Article

The Spatiotemporal Changes in Ecological–Environmental Quality Caused by Farmland Consolidation Using Google Earth Engine: A Case Study from Liaoning Province in China

1
Institute of Land and Urban-Rural Development, Zhejiang University of Finance and Economics, Hangzhou 310058, China
2
Institute for Fiscal Big-Data & Policy, Zhejiang University, Hangzhou 310058, China
3
School of Public Affairs, Zhejiang University, Hangzhou 310058, China
4
Yellow River Delta Land Use Safety Field Scientific Observation and Research Station, Ministry of Natural Resources, Jinan 256600, China
5
State Key Laboratory of Urban and Regional Ecology, Research Center for Eco-Environmental Sciences, Chinese Academy of Sciences, Beijing 100085, China
6
Institute of Eight-Eight Strategy, Zhejiang University of Finance and Economics, Hangzhou 310058, China
*
Author to whom correspondence should be addressed.
These authors contributed equally to this work.
Remote Sens. 2022, 14(15), 3646; https://doi.org/10.3390/rs14153646
Submission received: 21 June 2022 / Revised: 26 July 2022 / Accepted: 26 July 2022 / Published: 29 July 2022
(This article belongs to the Special Issue Monitoring Agricultural Land-Use Change and Land-Use Intensity Ⅱ)

Abstract

:
Farmland consolidation (FC) is among the measures to solve farmland issues, such as farmland fragmentation, and its impact on the ecological environment has always been controversial. In terms of long-term series and large-area analysis, the calculation of a large amount of data makes the analysis of the ecological–environmental quality of farmland consolidation very difficult. To solve this problem, our study applied a remote sensing ecological index model on the Google Earth Engine platform to analyze the changes in the ecological–environmental quality in two prefecture-level cities in Liaoning Province over the past 20 years. In addition, we analyzed the impacts of FC projects on the ecological environment from 2006 to 2018 and compared them to farmland without consolidation. The study results show that FC caused negative impacts on the quality of the ecological environment during the FC period (2006–2018) and that the FC’s positive effects take time to develop. In each FC phase, the results showed that FC exhibited negative effects before 2010 because the proportion of ecological–environmental quality reductions (0–47.67%) was higher than the proportion of increases (9.62–46.15%) in those FC phases. Since 2011, the area experiencing positive ecological–environmental benefits (31.96–72.01%) enabled by FC is higher than the area of negative impact (2.24–18.07%). This seems to be triggered by policy evolution. Based on the trend analysis, the proportion of FC areas with improved ecological–environmental quality grew faster (Gini index decreased 0.09) than that of farmland without consolidation (Gini index decreased 0.05) from before FC to after FC. Moreover, the new FC projects (2011–2018) performed better than the early projects (2006–2010), which may be due to policy evolution and technological advancements. However, the new FC projects (2011–2018) caused a dramatic decrease in ecological–environmental quality in a small number of areas due to the study time constraints. In conclusion, we believe that FC could improve the ecological–environmental quality of farmland, whereas some measures are needed to reduce its temporal negative impact on ecological–environmental quality, which may be caused by human interference. The remote sensing ecological index obtained using the Google Earth Engine platform provided an effective and reliable method for detecting the impacts of FC on the ecological–environmental quality of farmland. This could provide the basis and support for the monitoring of ecological–environmental changes in FC areas at a regional level.

Graphical Abstract

1. Introduction

Regional economic development is often inseparable from urbanization, which can cause land use and cover change and farmland loss, such as empoldering, disforestation, and farmland non-agriculturalization [1]. This massive loss of farmland will lead to reduced food production, which threatens food security [2,3]. Farmland consolidation (FC) can merge fragmented farmland, improve the efficiency of farmland use, and reduce the land occupation of ridges [4]. FC is widely used in China’s farmland occupation and supplement balance policy. Therefore, it could be considered as a measure to curb the farmland loss and to improve the quality of arable land. The most common pattern of this is farmland improvement, which includes farmland merging, agricultural infrastructure construction, and farmland remediation. In Europe, FC is usually applied to control land fragmentation, solve pollution problems, save biodiversity, and improve water management, which benefits rural sustainable development [5,6,7,8]. In African countries, FC has improved food security, landscape management, and farming efficiency and has decreased land-use conflicts [9,10,11]. In Asia, FC was employed to solve different kinds of land use issues, such as sustainable development goals (SDGs) and agricultural production efficiency [12,13]. Even though FC was used to improve sustainable development in many countries, it has experienced problems during implementation, and its effects on the ecological environment are still under discussion [14,15,16]. However, FC was quickly promoted and widely accepted in China, which may be because it is an effective measure to relieve the contradictions between population and farmland–a long-term presence in China.
From 2006 to 2012, the Chinese government invested approximately CNY 327.4 billion (USD 1 = CNY 6.75) into FC projects. The purpose of the “National land consolidation plan (2011 to 2015)” was to build 26.7 million ha of farmland (approximately 22% of the total farmland in China) by 2015 [17]. Moreover, the “National land consolidation plan (2016 to 2020)” planned to build 26.7 million ha of high-quality farmland by 2020 [18]. FC has increased farmer incomes and has decreased social conflict [17]. FC is considered to be an instrument to boost poverty alleviation and to activate the rural economy [19]. However, the ecological–environmental impacts of FC show divergence, as described by other studies. In terms of farmland soil, FC projects usually contain some cultivated land protection measures, which can control soil erosion and benefit the soil nutrient cycle [20,21,22]. However, FC may cause soil problems, such as soil hardening, topsoil breaking, and nutrient loss [23]. These negative effects were not easily avoided in early FC projects (before 2010) due to technical and awareness issues [24]. After 2010, the policy began to pay attention to the issues of farmland quality brought about by FC [25]. With the addition of farmland protection measures and the strengthening of supervision, the positive effect of FC on cultivated land has gradually become stronger [26]. The study of ecosystem services believes that FC increases crop yields while also increasing soil carbon emissions [27]. Some studies have indicated that FC does not show immediate benefits and that it takes 3 to 5 years to restore the local ecological–environmental quality [28,29]. Therefore, it is necessary to conduct further studies on the spatiotemporal ecological–environmental impact of FC, such as long-term series and large-scale data analysis.
To determine the ecological–environmental impacts of FC, many measurement and calculation methods have been described by other studies. For example, soil data, including saturated hydraulic conductivity and bulk density, are usually applied to determine FC effects [30]. However, the cost of soil sampling is too high to investigate regional and spatiotemporal changes in ecological–environmental quality (EEQ). Therefore, remote sensing data are usually employed to analyze the ecological–environmental impacts of FC. The ecological niche method was used to analyze the impacts of spatial restructuring and FC based on remote sensing images [31]. In another study, the changes in crop yield caused by FC were determined by the normalized difference vegetation index (NDVI) [32]. Other ecological indices from remote sensing data, such as the leaf area index (LAI), ratio drought index (RDI), standardized precipitation index (SPI), and land surface temperature (LST), have been applied to measure the vegetation index, the intensity of drought, and the heat island effect, which are associated with ecological–environmental quality [33,34,35]. Various engineering construction methods for FC (land-level engineering, irrigation and drainage engineering, road engineering, ecological protection engineering, etc.) and land use and management patterns have positive or negative impacts on ecological–environment elements, including soil, water, and organisms. In terms of soil elements, FC and agricultural production have changed the soil moisture, soil temperature, and soil structure and texture [30]; in terms of water elements, FC and the utilization of facilities have affected local water resource allocation [36]; in terms of biological elements, FC and agricultural production have changed the quantitative structure and spatial pattern of vegetation [37]. Therefore, the response of ecological–environmental elements caused by FC can be reflected by indicators such as humidity, greenness, heat, and dryness, which can be integrated into the remote sensing ecological index (RSEI) [38]. Moreover, RSEI is more effective than the ecological index (EI), which is widely used to assess ecological quality in China based on the Technical Criterion for Ecosystem Status Evaluation [39] in studies on the ecological–environmental quality of FC [40]. Although the RSEI model has many advantages, the time cost of RSEI calculations is huge when using it to detect long-term EEQ changes in FC areas at a large scale [38,41,42].
To study spatiotemporal changes in EEQ, the Google Earth Engine cloud-based platform (GEE) was employed in our study. The GEE platform has previously been applied in different study areas, such as soil mapping, crop yield estimation, and land use detection [43,44,45]. The GEE can access most of the long-term sequence remote sensing image data for free, including Landsat, Moderate-Resolution Imaging Spectroradiometer product (MODIS), and Sentinel imagery [45,46]. It is necessary to analyze the RSEI on a regional scale based on the GEE platform. In this study, the RSEI obtained using the GEE platform was applied to monitor EEQ changes caused by long-term and widespread FC projects. This may greatly improve the efficiency of monitoring the environmental impacts of FC projects and help us to discover the regularity of FC development.
Liaoning Province belongs to the old industrial base of Northeast China, which needs to be revitalized based on the Chinese development strategy [47]. Shenyang and Liaoyang are located in the central area of Liaoning Province. FC is widely applied as an effective method to revitalize the sustainable development of those cities. The total investment is CNY 2.91 × 10³ million (approximately USD 4.31 × 10² million). In terms of relevant policies, Liaoning Province has produced the “Land Use Master Plan of Liaoning Province (1997–2010)” and the “Land Use Master Plan of Liaoning Province (2006–2020)”. In the “Land Use Master Plan of Liaoning Province (1997–2010)”, the main purpose of FC is to protect the total amount of arable land from urbanization, which is repeatedly mentioned in items 19, 22, and 29 of the plan. In the “Land Use Master Plan of Liaoning Province (2006–2020)”, the importance of the quality of arable land began to receive attention, and the section on FC mentioned basic farmland construction and rural sustainable development. In this study, we used the GEE platform to analyze EEQ to answer three questions: (1) Did FC cause a decline in EEQ? (2) What is the impact of FC projects in different years on EEQ? (3) What is the trend of EEQ before and after farmland consolidation? The RESI model was employed to explain the changes in EEQ in the study.

2. Materials and Methods

2.1. Study Area and Data Sources

2.1.1. Study Area

Shenyang and Liaoyang were selected as the study areas (Figure 1). According to the Köppen Climate Classification, they are both located in the Dwa climate zone. The study area is dominated by plains, mountains, and hills that are concentrated in the southeast, and the Liao River, Hun River, Xiushui River, and Taizi River pass through the area. It has a temperate semi-humid continental climate, with temperatures ranging from −35 °C to 36 °C throughout the year. The average temperature is 8.3 °C, the annual precipitation is 500 mm, and the annual frost-free period is 183 days. Affected by the monsoon, precipitation is concentrated, the temperature differences are large, and the four seasons are distinct. The study area is located in the Liaohe Plain and is an important grain production base for corn and soybeans in China. In recent years, urban sprawl has caused a decline in the quantity and quality of arable land, making the protection of arable land increasingly important. From 2006 to 2018, a total of 557 farmland consolidation projects were completed, with a total area of 1.43 × 10³ km2 (Table 1). Fundamental farm construction and dryland improvement are used to improve the infrastructure construction and production capacity of arable land. Farmland development is used to build new farmland, and farmland readjustment is used to control farmland fragmentation. Reclaiming dryland into paddy is used to improve the production capacity of dryland. The durations of these projects are varied. As our study mainly focused on the changes in EEQ after FC, we defined the year in which FC ended as its construction time. The classification of FC projects in the study region is diverse. However, the targets of those FC projects are similar, and they are all about improving farmland productivity and quality. In order to make the design more reasonable, we chose long-term stable arable land that has not participated in FC as the control. A summary of FC projects is shown in Table 1. We divided FC projects into different phases based on the year of project completion. FC projects are mainly distributed in Faku County, Kangping County, Liaozhong County, Xinmin City, Dengta City, and Liaoyang County.

2.1.2. Data and Pre-Processing

There are four ecological components involved in the RSEI model. Therefore, we selected the corresponding standard products from the MODIS library as the data source based on the RSEI model. The NASA Land Processes Distributed Active Archive Center (LPDAAC) Collections from the USGS United States Geological Survey (USGS, https://earthexplorer.usgs.gov, accessed on 28 September 2021) provided standard data on different scenarios at the 1B level, which were used to build RSEI directly, including land surface reflectance (LSR), land surface temperature and emissions (LST&E), and vegetation indices (VI). The wetness and dryness components are derived from the MOD09A1 image set in the LSR product [41]. The greenness component is extracted from the MOD13A1 V6 image set in the vegetation indices product [48]. The image provides the VI per pixel location with a spatial resolution of 500 m and uses the best pixels obtained within 16 days for synthesis. The heat component was extracted from the MOD11A2 V6 image set in the LST&E product. The quality of MOD09A1, MOD13A1 V6, and MOD11A2 V6 were all assessed using the quality control bands. Cloudy pixels were removed. The GEE platform was used to collect and process the MODIS data. The land use and coverage patches were extracted from the GlobeLand30 dataset [49]. These historical images can be collected and processed by the GEE without downloading. We uploaded the RSEI images as online Supplementary Materials.

2.2. Data Analysis

The data analysis process is exhibited in Figure 2. First, we used remote images with a 500 × 500 m2 spatial resolution to build the RSEI model. Second, the RSEI values of FC areas were extracted using FC polygons (2006–2018) from the past 20 years that were obtained from local natural resource departments. The long-term stable farmland (never change) was extracted from the GlobeLand30 dataset (only 2000, 2010, and 2020 available) and the area that overlapped with FC was removed. Then, the farmland without FC was obtained. We extracted the RSEI values based on the farmland without FC. Third, reclassification and spatiotemporal trend analysis were conducted in the whole study region, including in FC areas and farmland without FC. Finally, the differences in the time scales were compared, as were the differences between the FC patches and arable land without FC.

2.2.1. Construction of RSEI

The RSEI model was developed to determine the EEQ, which is composed of wetness, greenness, heat, and dryness [50,51]. The RSEI value could be defined as a function of wetness, greenness, heat, and dryness. The model was built as follows:
RSEI = f Wetness , Greenness , Heat , Dryness
In Equation (1), wetness, greenness, heat, and dryness are characterized by the humidity component (WET), enhanced vegetation index (EVI), daytime land surface temperature (DLST), and normalized difference built-up and soil index (NDBSI), respectively. As the EVI could solve the NDVI’s saturation problem, and the EVI was used instead of NDVI, which is widely applied in RSEI models [51]. The other indicators are the same as described in another study [52]. The EVI and DLST were directly obtained from MOD13A1 V6 and MOD11A2 V6, respectively.
The WET component is characterized by the third component of the multispectral image after tasseled cap transformation, as described by other studies [53]. The formula for WET is as follows:
W E T = 0.1147 ρ r e d + 0.2489 ρ n i r 1 + 0.2408 ρ b l u e + 0.3132 ρ g r e e n + 0.3122 ρ n i r 2 + 0.6416 ρ s w i r 1 + 0.5187 ρ s w i r 2
where ρred, ρnir1, ρblue, ρgreen, ρnir2, ρswir1, and ρswir2 represent the reflectance of the 7 bands of the MOD09A1 images, respectively [53].
The NDBSI was calculated based on the Bare Soil Index (BI) and the Index Based Built-up Index (IBI) [50,54]. The formula for the NDBSI is as follows:
N D B S I = I B I + B I 2
I B I = 2 ρ s w i r 1 ρ s w i r 1 + ρ n i r 1 [ ρ n i r 1 ρ n i r 1 + ρ r e d + ρ g r e e n / ρ g r e e n + ρ s w i r 1 ] 2 ρ s w i r 1 ρ s w i r 1 + ρ n i r 1 + [ ρ n i r 1 ρ n i r 1 + ρ r e d + ρ g r e e n / ρ g r e e n + ρ s w i r 1 ]
B I = ρ s w i r 1 + ρ r e d ρ n i r 1 + ρ b l u e ρ s w i r 1 + ρ r e d + ρ n i r 1 + ρ b l u e
where ρred, ρnir1, ρblue, ρgreen, and ρswir1 represent the surface reflectance of the corresponding bands of the MOD09A1 V6 images, respectively [51].
Principal component analysis (PCA) was employed to couple these indicators, the first principal component (PC1) was selected to calculate the RSEI value, and the interpretation rates of the total variation were more than 80%. First, normalization was applied to those indicators, including WET, NVDI, DLST, and NDBSI. Second, the eigen analysis (https://developers.google.com/earth-engine/arrays_eigen_analysis, accessed on 28 September 2021) on the GEE platform was used to calculate PC1. Finally, the initial RSEI (RSEI0) could be calculated as follows:
R S E I 0 = 1 P C 1 f W E T , E V I , D L S T , N D B S I
where PC1 is the first principal component of the 4 indicators (WET, EVI, DLST, and NDBSI). The RSEI could be obtained from the RSEI0, and the RSEI values were normalized from 0 to 1. The normalized RSEI values were divided into 5 levels, and each level had an increment of 0.2. A value close to 1 indicated a good EEQ level. The levels were as follows: poor: 0–0.2; fair: 0.2–0.4; moderate: 0.4–0.6; good: 0.6–0.8; and excellent: 0.8–1, and were taken from other researchers who conducted similar studies [50,55]. Consequently, we used the RSEI levels to show the ecological–environmental status of the study area.

2.2.2. Spatiotemporal Trend Analysis

Change vector analysis, which was calculated using the difference between the RSEI levels from 6 years after FC and the RSEI levels from 6 years before FC, was employed to detect the EEQ changes and was conducted in QGIS [41,55]. The trend analysis was applied to the farmland without FC and each FC plot. The Mann–Kendall trend test (M–K test) and Theil–Sen slope estimator were used in combination to predict the change trends in the long-term series data and were conducted in the GEE platform [46]. The M–K test is a nonparametric statistical test method used to judge the significance of trends [56]. It is not affected by missing data values and can distinguish whether there are definite trends in natural processes.
S = i = 1 n 1 j = i + 1 n s g n x j x i
s g n x j x i = + 1 , x j > x i 0 , x j = x i 1 , x j < x i
where n is the length of time series; xi and xj are RSEI values in time series. The variance of S is calculated as follows:
τ = V a r S = n n 1 2 n + 5 18
The Z statistic is defined as follows:
Z = S 1 V a r S , S > 0 0 , S = 0 S + 1 V a r S , S < 0
P ( T > Z ) = 1 2 Z + e β 2 d t = 0.5 1 2 0 Z e t 2 2 d t
Z has a standard normal distribution. We collected the results of the M–K test under the significance level of 95% and considered the area with the Kendall’s τ values in the range from −0.1 to 0.1 as the EEQ unchanged region, as described by other studies [46]. Therefore, values greater than 0.1 are considered a growing trend, and values less than −0.1 are considered a falling trend.
The Theil–Sen slope estimator is a robust nonparametric statistical trend calculation method. It calculates the median slopes of the long-term series and can reduce the impact of data outliers. The calculation of the Theil–Sen slope estimator is as follows:
S l o p e β = M e d i a n x i x j t i t j
where Slope (β) is the Sen trend degree of the long sequence of RSEI, xi and xj are the sequences of RSEI content, and ti and tj are the sequence years of RSEI, respectively. According to descriptions in other studies, we set the range from −0.03 to 0.03 to represent the state of relative stability. Values greater than 0.03 are considered a dramatic growing trend, and values less than −0.03 are considered a dramatic falling trend [38]. For the FC patches in different years, the EEQ changes in the overall process and the EEQ changes before and after FC were calculated. Then, we superimposed the results of different years into one graph (Figure 3). Finally, the comparison between FC areas and farmland without FC was carried out, and Gini coefficients were calculated based on the results of the trend analysis via the DescTools package in R language [57]. The Gini coefficients could reflect the development balance of EEQ and could detect the frequencies of low RSEI levels.

3. Results

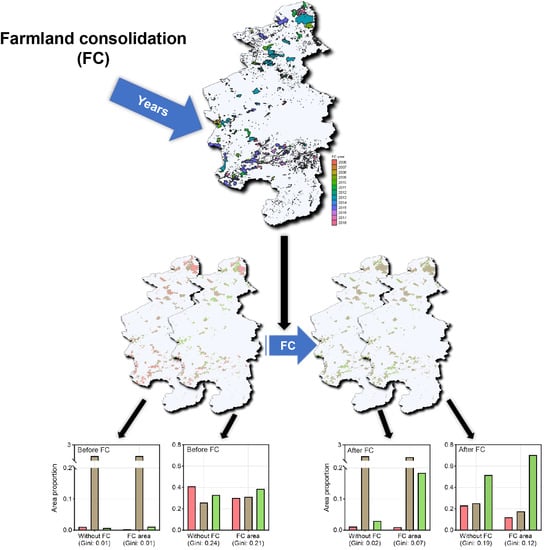
3.1. The Dynamic Changes in Ecological–Environmental Quality in FC Areas

The results of RSEI change showed that ecological–environmental quality showed increased volatility from 2000 to 2020 in the whole study region, in FC areas, and in the long-term stable farmland without FC (Figure 4a). The EEQ of the total region was usually better than that of FC and farmland without FC. The tendencies of FC and farmland without FC were similar before 2009. Then, the EEQ of FC areas became worse than that of farmland without FC until 2013. After 2014, the EEQ of FC started to exceed that of farmland without FC, except in 2018. From 2019 to 2020, the EEQ of FC gradually surpassed that of the entire area. Notably, the scale of FC showed that the largest number of FC projects was completed in 2013 (414.61 km2), followed by in 2015 (330.11 km2). Moreover, some years were selected to detect the regional changes in EEQ (Figure 4b). The average RSEI of FC was lower than in plots without FC in 2000. This was because the proportions of excellent and good levels were higher in the plots without FC (18.41% good; 0.40% excellent) than in the FC areas (17.65% good; 0.39% excellent). In 2003 and 2006, the EEQ of FC showed little difference from the plots without FC. The average RSEI of the plots without FC was significantly higher than in FC areas in 2012. The proportions of fair and poor levels were higher in FC areas (19.40% fair; 1.44% poor) than in plots without FC (10.61% fair; 0.94% poor). Then, the EEQ of FC was relatively higher than that of plots without FC in 2015. The reason for this seems to be that the proportion of poor levels in FC areas (6.05% poor) was less than that of plots without FC (8.32% poor). In 2018, the EEQ of plots without FC was again higher than that of FC areas. The proportion of fair levels in FC areas (29.21% fair) was higher than that in plots without FC (20.55% fair). In 2020, the proportion of excellent levels in FC areas (8.86% excellent) was higher than that in plots without FC (5.58% excellent), which improved the mean value of the RSEI in FC areas. The proportion of FC polygons at each EEQ level in 2015 and 2018 showed that large-scale FC projects may significantly increase EEQ risks (refer to Appendix A, Figure A1). Moreover, FC also increased the proportion of excellent EEQ plots compared to farmland without FC in several years, such as in 2018 and 2020 (Figure 4b). According to the spatial distribution of the RSEI in FC areas, the evolution of each FC phase may cause a fluctuation in the EEQ (Figure 5).

3.2. The Changes in Ecological–Environmental Quality in Each FC Phase

FC projects were presented in different time phases. The proportion of the quality level indicated that some FC projects were not always able improve the EEQ of farmland before 2010 (Figure 6). From 2011 to 2018, the subsequent and positive effects of FC projects always improved the proportion of good and excellent levels. The results demonstrating quality level changes also showed that FC projects usually caused one or two levels of improvement and deterioration (Table 2).
There were four FC phases that showed negative impacts (over 30% area deterioration), namely 2007, 2008, 2009, and 2010. The FC phases of 2006, 2007, 2008, 2009, and 2010 caused 30%, 46.15%, 12.02%, 9.62%, and 15.36% area improvement, respectively. They caused 0%, 38.46%, 47.67%, 35.73%, and 35.27% area deterioration, respectively. Other FC phases, namely 2011, 2012, 2013, 2014, 2015, 2016, 2017, and 2018, resulted in 50.74%, 40.96%, 48.25%, 50.70%, 45.27%, 36.89%, 72.01%, and 31.96% area improvement, respectively, and caused 6.85%, 18.07%, 3.37%, 7.04%, 9.22%, 16.80%, 2.24%, and 6.86% deterioration, respectively.

3.3. The Spatiotemporal Trend of Ecological–Environmental Quality in FC Areas

To determine the positive and negative impacts of FC, we employed the Mann–Kendall confidence test to evaluate the trend of RSEI in time series. The results of the M–K test indicate that the EEQ of the FC areas has increased slowly over the past 20 years (Figure 7a). Before FC finished, the area proportions that showed rising trends in the EEQ were 32.99% and 38.68% in the plots without FC and FC areas, respectively (Figure 7b and Figure A3). After FC finished, the proportion of the area with rising trends was 51.73% and 70.41% in the plots without FC and FC areas, respectively. Compared to the 18.74% increase in the plots without FC, the FC projects resulted in a 31.73% improvement. The Gini index also proved that FC effectively improved the EEQ of farmland.
The results of the Theil–Sen slope estimator showed that change strength was relatively stable in the overall process (Figure 8a). The stable area proportions were 98.26% and 98.68% in the plots without FC and in FC areas, respectively, before FC finished (Figure 8b). However, the proportions of stable areas dropped to 95.91% and 80.65% in the total region and in FC areas, respectively, after FC finished. Of the FC areas, 18.38% showed a dramatic increase in polygons. Meanwhile, 2.96% of the plots without FC showed a dramatic increase in polygons. However, the increased Gini index showed that some of the FC areas demonstrated a dramatic decrease in polygons after FC (Figure 9b). The new stage of FC projects (2011–2018) caused a dramatic decrease in polygons, the proportion of which increased from 0.50% to 1.21% (Table 3). A dramatic decrease in polygons was observed in FC (2011–2020) in 2011 (0.02%), 2013 (0.10%), 2015 (0.10%), 2016 (0.17%), 2017 (0.22%), and 2018 (0.60%).

4. Discussion

4.1. Ecological–Environmental Quality Monitoring at a Large Regional Level

This study described the spatiotemporal changes in the EEQ in a large region caused by agricultural land consolidation. According to descriptions in other studies, land consolidation projects are considered to be an effective instrument to promote plant biomass, optimize the landscape pattern, and change the structure and function of the regional ecosystem [58,59]. However, it is difficult to analyze the impact of numerous FC projects on the EEQ of a large region. The construction of the RSEI model requires a large amount of image data at a regional level and a long-term time scale, which greatly increases the cost of analysis and monitoring. According to descriptions in another study, the EEQ monitoring of FC was limited to spatiotemporal scales, which studied the impacts of one-year FC projects and EEQ changes after 2010 [29]. The application of the GEE cloud platform in our study has broken the boundary of rapidly and efficiently analyzing the spatiotemporal changes in environmental and ecological quality in a large area [42].
In the results of our study, the EEQ variation showed that the EEQ of FC areas declined during the FC period (Figure 4) and that the effects of FC had a lag (Figure 6). This is similar to the findings of other researchers who conducted similar studies in FC and ecosystems, in which intensive engineering activities brought about by FC caused ecological risks [60]. It takes 3–5 years to restore the ecological and environmental quality after FC [29]. The largest area of FC was completed in 2013 and 2015 and was distributed widely in the study area. We also found that FC projects may cause temporary and negative impacts. The FC areas completed in 2013 and 2015 experienced a decline in EEQ in 2018, which was proven by the EEQ classification results (Figure 6). Another study on FC also indicated that heavy consolidation work could threaten plant species diversity, which is associated with ecological resistance and EEQ [61]. Therefore, we suggest that although FC will enable long-term ecological benefits, the number and size of FC projects should be matched with the regional development in a short period (under 3 years). Moreover, it is necessary to consider the acceptability of ecologically fragile areas for FC projects.

4.2. Differences among FC Phases from 2006 to 2018

Our results indicate that the effects of FC on EEQ may be driven by policy evolution in China. Descriptions in another study showed that the development of FC and relevant policies could be divided into several phases over the past 20 years [25]. In our study region, the FC phases could also be divided into different stages. As mentioned above, the policy in Liaoning Province has begun to strengthen the requirements for the quality of cultivated land from 2006. However, the relevant inspections have not yet been implemented at the provincial scale. At the end of 2010, the State Council issued the “Notice of the State Council on Strictly Regulating the Pilot Program of Linking New Land Used for Urban Construction with the Decrease of Land Used for Rural Construction and Effectively Carrying out the Consolidation of Rural Land” (NO. 47 [2010] of the State Council). Subsequently, the Department of Land and Resources of Liaoning Province (DLRLN) organized an inspection of FC projects in 2011 (NO. 23 [2011] of the DLRLN) based on NO. 47 document of the State Council. The RSEI values of the FC phases reflected the change in policies. From 2006 to 2010, the impacts of some FC projects were negative. The FC phases of 2007, 2008, 2009, and 2010 showed that the area experiencing eco-environmental deterioration was greater than the area of improvement 6 years after the completion of the projects. On the other hand, the FC phases from 2011 to 2018 all showed that the area of eco-environmental improvement was greater than the area of deterioration, 6 years after the completion of projects. Therefore, the FC phases could be divided into two stages. One is from 2006 to 2010, and the other is from 2011 to 2020. This is generally in line with the time node representing FC policy adjustment in Liaoning Province, which shows the influence of policy evolution.
The results of the M–K test and Theil–Sen slope showed that the FC projects turned some areas with decreasing EEQ and unchanged areas into areas with increasing EEQ, which proved that FC can improve the EEQ of farmland. It also proved that the efficiency of the new FC projects (2011–2020) is higher than that of the early projects (2006–2010), in agreement with descriptions in another study that the strengthening of government supervision has improved the engineering efficiency of FC projects [62]. Moreover, the technical development of FC, including optimizing the landscape structure, may also provide ecological–environmental benefits [63]. Notably, the dramatic negative impacts of the new FC projects (2011–2020) have increased from 0.50% to 1.21%, whereas the impacts of the early projects (2006–2010) decreased from 0.99% to 0.00%. Some FC phases were completed in less than 5 years. Although the overall EEQ was effectively improved within 5 years after the completion of FC projects, the EEQ in some areas needs more time to recover. This is consistent to the description in another study [29]. Therefore, while we focus on the benefits of the FC project, we also need to pay attention to its possible negative effects in the short term. This seems to be consistent with our previous point that the number of FC projects should be promoted cautiously in the short term.

4.3. Policy Suggestions for FC

FC plays an important role in solving the contradiction between humans and the Earth in the Chinese urbanization process. Meanwhile, FC also shoulders the important task of rural revitalization. The number of FC projects will be persistently promoted in China, and the technical development of FC will also not stop. Therefore, we determine the impacts of FC on EEQ in the study area and making the following policy suggestions:
  • Even though FC is an effective method to improve the ecological–environmental quality of farmland, the regional development and environmental carrying capacity should be considered before FC. Our results showed that a fast-growing number of FC projects have increased the pressure on the ecological environment. The government should evaluate the impact of FC implementation on the ecological environment and the time required for restoration in advance. This evaluation should be based on historical data of regional development and FC projects.
  • Government supervision should be applied in the post-FC period. Compared to the whole process of supervision of FC projects, post-FC supervision is also important. On one hand, the results showed that FC sometimes caused EEQ to decrease in the following period. Some of the negative impacts of FC existed for a long time. Supervision should be repeatedly applied to the farmland involved in FC. On the other hand, the incorrect management of those areas may also cause environmental issues [21]. Reasonable management and problem-solving methods should be promoted during the post-FC period.
  • Early FC projects, which lacked policy evolution and technical improvement, also need attention. Remedial measures should be implemented to control the negative impacts caused by early FC issues. It is necessary to implement green agriculture and ecological intensification in early FC areas.
  • The government can use monitoring methods that use big data cloud platforms to understand the changes in the EEQ in FC areas. In our study, the variation in each patch can be displayed. In our follow-up research, we could analyze the causes of environmental problems in different patches in a targeted manner. This could improve the efficiency of monitoring and information processing.

5. Conclusions

In the study, we calculated the RSEI (including the NDVI, WET, LST, and NDBSI) on the GEE platform to analyze the spatiotemporal changes in the EEQ in regional farmland consolidation areas. We found that the analysis of RSEI using the GEE platform is suitable for large-scale temporal and spatial series monitoring, and it reflects the dynamic impacts of FC projects at a regional level. Our study has effectively broadened the spatiotemporal scale compared to other studies.
The results showed that FC could improve EEQ effectively, while some issues were also present. First, the positive effect of farmland consolidation takes more than 3 years to appear, and it may have a negative effect in the short term. Therefore, it is more reasonable to decide the scale of remediation according to the actual situation of regional development. The launch of large-scale FC projects may temporarily increase the pressure on the environment. Second, the policies associated with FC could impact the effects of FC on the EEQ. With the emphasis on FC projects in policy, the positive impact of FC is becoming increasingly stronger. Finally, the new FC projects showed more positive effects than the early FC projects, while risks were also present in the new projects. Therefore, the application of the RSEI model on the GEE platform could improve the efficiency of government inspections of FC projects at a regional level, which could help us conduct targeted follow-up studies, such as fieldwork of EEQ issues caused by FC projects.

Supplementary Materials

The following are available online at https://zenodo.org/record/6635643#.YuPmc4RBxPY.

Author Contributions

Conceptualization, M.Z., G.L. and C.W.; data curation, M.Z., T.H. and G.L.; funding acquisition, T.H. and G.L.; methodology, T.H. and G.L.; project administration, C.W.; software, T.H.; supervision, C.W.; visualization, G.L.; writing–original draft, M.Z. and G.L. All authors have read and agreed to the published version of the manuscript.

Funding

This research was funded by the China Postdoctoral Science Foundation, Approval No. 2021M702795, the Natural Science Foundation of Zhejiang Province, Approval No. Q22D018818, and the Yellow River Delta Land Use Safety Field Scientific Observation and Research Station, Approval No. YWZ2022–04.

Data Availability Statement

Not applicable.

Conflicts of Interest

The authors declare no conflict of interest.

Abbreviations

The following abbreviations are used in this manuscript:
GEEGoogle Earth Engine
RSEIRemote Sensing Ecological Index
FCFarmland Consolidation
EEQEcological–Environmental Quality
MODISModerate–Resolution Imaging Spectroradiometer
EVIEnhanced Vegetation Index
LAILeaf Area Index
RDIRatio Drought Index
SPIStandardized Precipitation Index
LSTLand Surface Temperature
VIVegetation Indices
LSRLand Surface Reflectance
LST&ELand Surface Temperature and Emission
WETHumidity component
NDBSINormalized Difference Built-Up and Soil Index
DLSTDaytime Land Surface Temperature
PCAPrincipal Component Analysis

Appendix A

Figure A1. The area proportion of FC phases at each EEQ level in selected years.
Remotesensing 14 03646 g0a1
Figure A2. The overall process of the trend analysis in FC areas and an addition to Figure 7 and Figure 8. (a) is the results of the M–K test, and (b) is the results of the Theil–Sen slope test.
Remotesensing 14 03646 g0a2
Figure A3. Results of trend analysis for the farmland without FC: (a) M–K test; (b) Theil–Sen Slope test.
Remotesensing 14 03646 g0a3

References

  1. Deng, X.; Huang, J.; Rozelle, S.; Zhang, J.; Li, Z. Impact of urbanization on cultivated land changes in China. Land Use Policy 2015, 45, 1–7. [Google Scholar] [CrossRef]
  2. Jiang, G.; Zhang, R.; Ma, W.; Zhou, D.; Wang, X.; He, X. Cultivated land productivity potential improvement in land consolidation schemes in Shenyang, China: Assessment and policy implications. Land Use Policy 2017, 68, 80–88. [Google Scholar] [CrossRef]
  3. Chien, S.-S. Local farmland loss and preservation in China—A perspective of quota territorialization. Land Use Policy 2015, 49, 65–74. [Google Scholar] [CrossRef]
  4. Ntihinyurwa, P.D.; de Vries, W.T. Farmland Fragmentation, Farmland Consolidation and Food Security: Relationships, Research Lapses and Future Perspectives. Land 2021, 10, 129. [Google Scholar] [CrossRef]
  5. Moravcová, J.; Koupilová, M.; Pavlíček, T.; Zemek, F.; Kvítek, T.; Pečenka, J. Analysis of land consolidation projects and their impact on land use change, landscape structure, and agricultural land resource protection: Case studies of Pilsen-South and Pilsen-North (Czech Republic). Landsc. Ecol. Eng. 2017, 13, 1–13. [Google Scholar] [CrossRef]
  6. Stańczuk-Gałwiaczek, M.; Sobolewska-Mikulska, K.; Ritzema, H.; van Loon-Steensma, J.M. Integration of water management and land consolidation in rural areas to adapt to climate change: Experiences from Poland and the Netherlands. Land Use Policy 2018, 77, 498–511. [Google Scholar] [CrossRef]
  7. Wójcik-Leń, J.; Leń, P.; Sobolewska-Mikulska, K. The proposed algorithm for identifying agricultural problem areas for the needs of their reasonable management under land consolidation works. Comput. Electron. Agric. 2018, 152, 333–339. [Google Scholar] [CrossRef]
  8. Zhou, Y.; Li, Y.; Xu, C. Land consolidation and rural revitalization in China: Mechanisms and paths. Land Use Policy 2020, 91, 104379. [Google Scholar] [CrossRef]
  9. Asiama, K.O.; Bennett, R.M.; Zevenbergen, J.A. Land consolidation on Ghana’s rural customary lands: Drawing from The Dutch, Lithuanian and Rwandan experiences. J. Rural. Stud. 2017, 56, 87–99. [Google Scholar] [CrossRef]
  10. Gedefaw, A.A.; Atzberger, C.; Seher, W.; Mansberger, R. Farmers Willingness to Participate In Voluntary Land Consolidation in Gozamin District, Ethiopia. Land 2019, 8, 148. [Google Scholar] [CrossRef] [Green Version]
  11. Asiama, K.O.; Voss, W.; Bennett, R.; Rubanje, I. Land consolidation activities in Sub-Saharan Africa towards the agenda 2030: A tale of three countries. Land Use Policy 2021, 101, 105140. [Google Scholar] [CrossRef]
  12. Munnangi, A.K.; Lohani, B.; Misra, S.C. A review of land consolidation in the state of Uttar Pradesh, India: Qualitative approach. Land Use Policy 2020, 90, 104309. [Google Scholar] [CrossRef]
  13. Janus, J.; Ertunç, E. Differences in the effectiveness of land consolidation projects in various countries and their causes: Examples of Poland and Turkey. Land Use Policy 2021, 108, 105542. [Google Scholar] [CrossRef]
  14. Niroula, G.S.; Thapa, G.B. Impacts and causes of land fragmentation, and lessons learned from land consolidation in South Asia. Land Use Policy 2005, 22, 358–372. [Google Scholar] [CrossRef]
  15. Dudzińska, M.; Kocur-Bera, K. Land consolidation as the driving force behind ecological and economic development of rural areas. In Proceedings of the 9th International Conference Environmental Engineering–Selected Papers, Vilnius, Lithuania, 22–23 May 2014; pp. 1–7. [Google Scholar]
  16. Zhang, Z.; Zhao, W.; Gu, X. Changes resulting from a land consolidation project (LCP) and its resource–environment effects: A case study in Tianmen City of Hubei Province, China. Land Use Policy 2014, 40, 74–82. [Google Scholar] [CrossRef]
  17. Jin, X.; Xu, X.; Xiang, X.; Bai, Q.; Zhou, Y. System-dynamic analysis on socio-economic impacts of land consolidation in China. Habitat Int. 2016, 56, 166–175. [Google Scholar] [CrossRef]
  18. Ministry of Land and Resources. National Land Consolidation Plan (2016 to 2020). 2017. Available online: http://g.mnr.gov.cn/201702/t20170220_1440609.html (accessed on 10 January 2017).
  19. Zhou, Y.; Guo, L.; Liu, Y. Land consolidation boosting poverty alleviation in China: Theory and practice. Land Use Policy 2019, 82, 339–348. [Google Scholar] [CrossRef]
  20. Liu, S.L.; Dong, Y.H.; Li, D.; Liu, Q.; Wang, J.; Zhang, X.L. Effects of different terrace protection measures in a sloping land consolidation project targeting soil erosion at the slope scale. Ecol. Eng. 2013, 53, 46–53. [Google Scholar] [CrossRef]
  21. Li, G.; Zhang, M.; Wu, C. Agricultural land consolidation impacted edaphic microbial community dynamics and assembly in China—A case study from Zhejiang Province. CATENA 2021, 205, 105424. [Google Scholar] [CrossRef]
  22. Li, G.; Zhang, M.; Wu, C. Short-term fallow practices drive soil bacterial community changes: A case study from China. Appl. Soil Ecol. 2021, 165, 103988. [Google Scholar] [CrossRef]
  23. Wang, J.; Li, Z.; Bai, Z.; Ju, Z.; Wang, G. Progress and prospect of ecological environment impact of land consolidation. Nongye Gongcheng Xuebao/Trans. Chin. Soc. Agric. Eng. 2011, 27, 340–345. [Google Scholar] [CrossRef]
  24. Wu, C.; Huang, J.; Zhu, H.; Zhang, L.; Minasny, B.; Marchant, B.P.; McBratney, A.B. Spatial changes in soil chemical properties in an agricultural zone in southeastern China due to land consolidation. Soil Tillage Res. 2019, 187, 152–160. [Google Scholar] [CrossRef]
  25. Tang, H.; Yun, W.; Liu, W.; Sang, L. Structural changes in the development of China’s farmland consolidation in 1998–2017: Changing ideas and future framework. Land Use Policy 2019, 89, 104212. [Google Scholar] [CrossRef]
  26. Sun, Y.; Song, X.; Ma, J.; Yu, H.; Ge, X.; Liu, G.-J.; Chen, F. Assessing the Effectiveness for Achieving Policy Objectives of Land Consolidation in China: Evidence from Project Practices in Jiangsu Province from 2001 to 2017. Sustainability 2021, 13, 13891. [Google Scholar] [CrossRef]
  27. Zhong, L.; Wang, J.; Zhang, X.; Ying, L. Effects of agricultural land consolidation on ecosystem services: Trade-offs and synergies. J. Clean. Prod. 2020, 264, 121412. [Google Scholar] [CrossRef]
  28. Shan, W.; Jin, X.; Meng, X.; Yang, X.; Xu, Z.; Gu, Z.; Zhou, Y. Dynamical monitoring of ecological environment quality of land consolidation based on multi-source remote sensing data. Nongye Gongcheng Xuebao/Trans. Chin. Soc. Agric. Eng. 2019, 35, 234–242. [Google Scholar] [CrossRef]
  29. Guo, B.; Fang, Y.; Jin, X.; Zhou, Y. Monitoring the effects of land consolidation on the ecological environmental quality based on remote sensing: A case study of Chaohu Lake Basin, China. Land Use Policy 2020, 95, 104569. [Google Scholar] [CrossRef]
  30. He, M.; Wang, Y.; Tong, Y.; Zhao, Y.; Qiang, X.; Song, Y.; Wang, L.; Song, Y.; Wang, G.; He, C. Evaluation of the environmental effects of intensive land consolidation: A field-based case study of the Chinese Loess Plateau. Land Use Policy 2020, 94, 104523. [Google Scholar] [CrossRef]
  31. Yu, Z.; Xiao, L.; Chen, X.; He, Z.; Guo, Q.; Vejre, H. Spatial restructuring and land consolidation of urban-rural settlement in mountainous areas based on ecological niche perspective. J. Geogr. Sci. 2018, 28, 131–151. [Google Scholar] [CrossRef] [Green Version]
  32. Du, X.; Zhang, X.; Jin, X. Assessing the effectiveness of land consolidation for improving agricultural productivity in China. Land Use Policy 2018, 70, 360–367. [Google Scholar] [CrossRef]
  33. Liang, Y.; Liu, G.; Ma, D.; Wang, F.; Zheng, H. Regional cooperation mechanism and sustainable livelihoods: A case study on paddy land conversion program (PLCP). Acta Ecol. Sin. 2013, 33, 693–701. [Google Scholar] [CrossRef]
  34. Asadi Zarch, M.A.; Sivakumar, B.; Sharma, A. Droughts in a warming climate: A global assessment of Standardized precipitation index (SPI) and Reconnaissance drought index (RDI). J. Hydrol. 2015, 526, 183–195. [Google Scholar] [CrossRef]
  35. Singh, P.; Kikon, N.; Verma, P. Impact of land use change and urbanization on urban heat island in Lucknow city, Central India. A remote sensing based estimate. Sustain. Cities Soc. 2017, 32, 100–114. [Google Scholar] [CrossRef]
  36. Demetriou, D.; Stillwell, J.; See, L. Land consolidation in Cyprus: Why is an Integrated Planning and Decision Support System required? Land Use Policy 2012, 29, 131–142. [Google Scholar] [CrossRef]
  37. Sklenicka, P.; Šímová, P.; Hrdinová, K.; Salek, M. Changing rural landscapes along the border of Austria and the Czech Republic between 1952 and 2009: Roles of political, socioeconomic and environmental factors. Appl. Geogr. 2014, 47, 89–98. [Google Scholar] [CrossRef]
  38. Xu, H.; Wang, M.; Shi, T.; Guan, H.; Fang, C.; Lin, Z. Prediction of ecological effects of potential population and impervious surface increases using a remote sensing based ecological index (RSEI). Ecol. Indic. 2018, 93, 730–740. [Google Scholar] [CrossRef]
  39. Ministry of Environmental Protection. Technical Criterion for Ecosystem Status Evaluation 2015, HJ 192-2015. Available online: https://www.mee.gov.cn/ywgz/fgbz/bz/bzwb/stzl/201503/W020150326489785523925.pdf (accessed on 25 March 2015).
  40. Shan, W.; Jin, X.; Ren, J.; Wang, Y.; Xu, Z.; Fan, Y.; Gu, Z.; Hong, C.; Lin, J.; Zhou, Y. Ecological environment quality assessment based on remote sensing data for land consolidation. J. Clean. Prod. 2019, 239, 118126. [Google Scholar] [CrossRef]
  41. Xu, H.; Wang, Y.; Guan, H.; Shi, T.; Hu, X. Detecting Ecological Changes with a Remote Sensing Based Ecological Index (RSEI) Produced Time Series and Change Vector Analysis. Remote Sens. 2019, 11, 2345. [Google Scholar] [CrossRef] [Green Version]
  42. Xiong, Y.; Xu, W.; Lu, N.; Huang, S.; Wu, C.; Wang, L.; Dai, F.; Kou, W. Assessment of spatial–temporal changes of ecological environment quality based on RSEI and GEE: A case study in Erhai Lake Basin, Yunnan province, China. Ecol. Indic. 2021, 125, 107518. [Google Scholar] [CrossRef]
  43. Azzari, G.; Lobell, D.B. Landsat-based classification in the cloud: An opportunity for a paradigm shift in land cover monitoring. Remote Sens. Environ. 2017, 202, 64–74. [Google Scholar] [CrossRef]
  44. Shelestov, A.; Lavreniuk, M.; Kussul, N.; Novikov, A.; Skakun, S. Exploring Google Earth Engine Platform for Big Data Processing: Classification of Multi-Temporal Satellite Imagery for Crop Mapping. Front. Earth Sci. 2017, 5, 17. [Google Scholar] [CrossRef] [Green Version]
  45. Wu, Q.; Lane, C.R.; Li, X.; Zhao, K.; Zhou, Y.; Clinton, N.; DeVries, B.; Golden, H.E.; Lang, M.W. Integrating LiDAR data and multi-temporal aerial imagery to map wetland inundation dynamics using Google Earth Engine. Remote Sens. Environ. 2019, 228, 1–13. [Google Scholar] [CrossRef] [Green Version]
  46. Xiao, W.; Chen, W.; He, T.; Ruan, L.; Guo, J. Multi-Temporal Mapping of Soil Total Nitrogen Using Google Earth Engine across the Shandong Province of China. Sustainability 2020, 12, 10274. [Google Scholar] [CrossRef]
  47. Zhang, P. Revitalizing old industrial base of Northeast China: Process, policy and challenge. Chin. Geogr. Sci. 2008, 18, 109–118. [Google Scholar] [CrossRef]
  48. Jiang, Z.; Huete, A.R.; Didan, K.; Miura, T. Development of a two-band enhanced vegetation index without a blue band. Remote Sens. Environ. 2008, 112, 3833–3845. [Google Scholar] [CrossRef]
  49. Jun, C.; Ban, Y.; Li, S. Open access to Earth land-cover map. Nature 2014, 514, 434. [Google Scholar] [CrossRef] [Green Version]
  50. Hu, X.; Xu, H. A new remote sensing index for assessing the spatial heterogeneity in urban ecological quality: A case from Fuzhou City, China. Ecol. Indic. 2018, 89, 11–21. [Google Scholar] [CrossRef]
  51. Zheng, Z.; Wu, Z.; Chen, Y.; Yang, Z.; Marinello, F. Exploration of eco-environment and urbanization changes in coastal zones: A case study in China over the past 20 years. Ecol. Indic. 2020, 119, 106847. [Google Scholar] [CrossRef]
  52. Liao, W.; Jiang, W. Evaluation of the Spatiotemporal Variations in the Eco-environmental Quality in China Based on the Remote Sensing Ecological Index. Remote Sens. 2020, 12, 2462. [Google Scholar] [CrossRef]
  53. Xiaoyang, Z.; Schaaf, C.B.; Friedl, M.A.; Strahler, A.H.; Feng, G.; Hodges, J.C.F. MODIS tasseled cap transformation and its utility. In Proceedings of the IEEE International Geoscience and Remote Sensing Symposium, Boston, MA, USA, 24–28 June 2002; Volume 1062, pp. 1063–1065. [Google Scholar]
  54. Liu, Y.; Meng, Q.; Zhang, L.; Wu, C. NDBSI: A normalized difference bare soil index for remote sensing to improve bare soil mapping accuracy in urban and rural areas. CATENA 2022, 214, 106265. [Google Scholar] [CrossRef]
  55. Yuan, B.; Fu, L.; Zou, Y.; Zhang, S.; Chen, X.; Li, F.; Deng, Z.; Xie, Y. Spatiotemporal change detection of ecological quality and the associated affecting factors in Dongting Lake Basin, based on RSEI. J. Clean. Prod. 2021, 302, 126995. [Google Scholar] [CrossRef]
  56. Mann, H.B. Nonparametric Tests Against Trend. Econometrica 1945, 13, 245–259. [Google Scholar] [CrossRef]
  57. R Core Team. R: A Language and Environment for Statistical Computing; R Foundation for Statistical Computing: Vienna, Austria, 2019. [Google Scholar]
  58. Zeng, Q.; Yu, G.; Yu, Q. The influence of land consolidation on biomass and ecological environment. Res. J. Appl. Sci. Eng. Technol. 2014, 7, 3656–3662. [Google Scholar]
  59. Yurui, L.; Yi, L.; Pengcan, F.; Hualou, L. Impacts of land consolidation on rural human–environment system in typical watershed of the Loess Plateau and implications for rural development policy. Land Use Policy 2019, 86, 339–350. [Google Scholar] [CrossRef]
  60. Guo, B.; Jin, X.; Yang, X.; Guan, X.; Lin, Y.; Zhou, Y. Determining the effects of land consolidation on the multifunctionlity of the cropland production system in China using a SPA-fuzzy assessment model. Eur. J. Agron. 2015, 63, 12–26. [Google Scholar] [CrossRef]
  61. Osawa, T.; Kohyama, K.; Mitsuhashi, H. Trade-off relationship between modern agriculture and biodiversity: Heavy consolidation work has a long-term negative impact on plant species diversity. Land Use Policy 2016, 54, 78–84. [Google Scholar] [CrossRef]
  62. Tang, X.; Pan, Y.; Liu, Y. Analysis and demonstration of investment implementation model and paths for China’s cultivated land consolidation. Appl. Geogr. 2017, 82, 24–34. [Google Scholar] [CrossRef]
  63. Yun, W.; Yu, Z. Ecological landscaping strategy of rural land consolidation in China. Trans. Chin. Soc. Agric. Eng. 2011, 27, 1–6. [Google Scholar]
Figure 1. The location map of the study area and farmland consolidation (FC) phases marked by FC year. Liaoning Province (a) and our study region (b).
Remotesensing 14 03646 g001
Figure 2. The technique flowchart. MODIS, Moderate-Resolution Imaging Spectroradiometer product; VI, vegetation indices; LSR, land surface reflectance; LST&E, land surface temperature and emissions; EVI, enhanced vegetation index; WET, humidity component; NDBSI, normalized difference built-up and soil index; DLST, daytime land surface temperature; PCA, principal component analysis; RSEI, remote sensing ecological index; MK test, Mann–Kendall trend test; Slope, Theil–Sen slope estimator; EEQ, ecological–environmental quality; FC, farmland consolidation.
Remotesensing 14 03646 g002
Figure 3. The trend analysis procedure. FC, farmland consolidation. Outside the dashed box is the trend analysis of the changes in the quality of the ecological environment in the FC plots, and inside the dashed box is the trend analysis of the quality changes in the ecological environment in the stable farmland without FC.
Remotesensing 14 03646 g003
Figure 4. The changes in the average RSEI values for the whole study region, FC areas, and farmland without FC in each year. The coverage years of the FC phases are in gray (a); area distribution of EEQ levels in FC areas and in the farmland without FC in the selected years, from 2000 to 2020 (b). For the convenience of presentation, we chose to display one years from each three-year period.
Remotesensing 14 03646 g004
Figure 5. Spatial distribution of EEQ levels, same as before, in the FC areas in selected years from 2000 to 2020.
Remotesensing 14 03646 g005
Figure 6. Area proportion of EEQ levels in each FC phase. The EEQ levels are same as before. Moreover, we exhibited the changes in the average RSEI from the 6 years before FC to the 6 years after FC in each FC phase.
Remotesensing 14 03646 g006
Figure 7. The trend of eco-environment quality (M–K test) in the FC areas at the 95% confidence level before FC (a) and after FC (b); the subsets (1–4) are used to reflect the changes.
Remotesensing 14 03646 g007
Figure 8. The trend strength of the EEQ (Theil–Sen slope value) in the FC areas at the 95% confidence level before FC (a) and after FC (b); the subsets (1–4) are used to reflect the changes.
Remotesensing 14 03646 g008
Figure 9. The comparison between FC areas and the plots without FC based on Kendall’s τ value (a); the comparison between FC areas and the plots without FC based on Theil–Sen slope (b). The Gini coefficients are shown along the scale of the x-axis.
Remotesensing 14 03646 g009
Table 1. Basic information of land consolidation projects.
CityFC ClassificationCompleted Area of FC (km2)
ShenyangFundamental farm construction582.88
Farmland development466.82
Farmland readjustment23.74
Farmland reclamation7.98
LiaoyangFundamental farm construction173.66
Farmland development60.13
Farmland readjustment106.69
Dryland reclamation into paddy6.06
Drylands improvement3.99
Source: Natural Resource Departments of Shenyang and Liaoyang.
Table 2. Changes in RSEI levels in each FC phase based on the change vector analysis.
Year ImprovementStableDeterioration
+3+2+10−1−2−3
FC of 2006 Area/km2001.53.5000
(2000 to 2012)Percentage/%30 700
FC of 2007Area/km200.252.7512.500
(2001 to 2013)Percentage/%46.15 15.3838.46
FC of 2008Area/km200.5155256.255.250
(2002 to 2014)Percentage/%12.02 40.3147.67
FC of 2009Area/km200.256.7539.75241.750.25
(2003 to 2015)Percentage/%9.62 54.6435.73
FC of 2010Area/km202.7521.7578.7550.755.250.25
(2004 to 2016)Percentage/%15.36 49.3735.27
FC of 2011Area/km2016.7577.757912.7500
(2005 to 2017)Percentage/%50.74 42.426.85
FC of 2012Area/km203.558.53.50.250
(2006 to 2018)Percentage/%40.96 40.9618.07
FC of 2013Area/km24.7544.522327317.751.250
(2007 to 2019)Percentage/%48.25 48.383.37
FC of 2014Area/km200.58.57.51.2500
(2008 to 2020)Percentage/%50.70 42.257.04
FC of 2015Area/km20.7526.2517320140.7500
(2009 to 2020)Percentage/%45.27 45.509.22
FC of 2016Area/km200.7521.7528.259.750.50
(2010 to 2020)Percentage/%36.89 46.3116.80
FC of 2017Area/km207.540.7517.251.500
(2011 to 2020)Percentage/%72.01 25.752.24
FC of 2018Area/km20238.75788.7500
(2012 to 2020)Percentage/%31.96 61.186.86
Table 3. The differences between FC phases before 2010 and FC phases after 2010.
Trend Analysis Early FC (2006–2010)Newly FC (2011–2018)
Percentage/%Percentage/%
Kendall’s τ value Before FCAfter FCBefore FCAfter FC
From 0.1 to 140.86%64.10%38.28%88.50%
From −0.1 to 0.129.07%21.83%31.78%16.51%
From −0.1 to −130.07%14.66%29.94%11.50%
Gini index0.210.140.210.05
Theil–Sen slope Before FCAfter FCBefore FCAfter FC
From 0.03 to 0.53.35%1.94%0.50%22.37%
From −0.03 to 0.0395.71%98.06%99.44%76.42%
From −0.03 to −0.30.94%0.00%0.50%1.21%
Gini index0.020.010.0030.08
Publisher’s Note: MDPI stays neutral with regard to jurisdictional claims in published maps and institutional affiliations.

