Article

Gully Morphological Characteristics and Topographic Threshold Determined by UAV in a Small Watershed on the Loess Plateau

1
State Key Laboratory of Earth Surface Processes and Resources Ecology, Beijing Normal University, Beijing 100875, China
2
Faculty of Geographical Science, Beijing Normal University, Beijing 100875, China
*
Author to whom correspondence should be addressed.
Remote Sens. 2022, 14(15), 3529; https://doi.org/10.3390/rs14153529
Submission received: 13 June 2022 / Revised: 20 July 2022 / Accepted: 21 July 2022 / Published: 23 July 2022

Abstract

:
Gully erosion is an important sediment source in small watershed, and causes severe land degradation, particularly in semi-arid regions. Accurately measuring gully morphological characteristics, and determining its topographic threshold, are vital for gully erosion simulation and control. In this study, 910 gullies were visually interpreted by unmanned aerial vehicle (UAV) technology combined with field measurement. Ten gully morphological characteristics were extracted from the digital orthophoto map (DOM) and digital elevation model (DEM) generated by UAV images, including gully length (L), circumference (C), plane area (PA), surface area (SA), volume (V), depth (D), top width (TW), mean width (MW), cross-sectional area (CSA), and ratio of top width to depth (TW/D). The morphological characteristics of 30 reachable gullies were measured by a real time kinematic (RTK) to validate the parameters extracted from the UAV images. The topographic thresholds were determined based on the local slope gradient (S) and upland drainage area (A), using a dataset of 365 gully heads and their corresponding land-use types. The results show that the mean absolute percentage errors (MAPE) of the 2D and 3D gully characteristics are less than 10% and 20%, respectively, demonstrating a high accuracy of gully characteristic extraction from UAV images. Gully V is significantly related to the other nine parameters. Significant power functions were fitted between V, and L, C, PA, and SA. The gully volume could be well-estimated by SA (V = 0.212 SA0.982), with a R2 of 0.99. For all land-use types, the topographic threshold could be described as S = 0.61 A0.48, implying that water erosion is the dominant process controlling gully erosion in this region. The topographic threshold is land-use-dependent, and shrubland is hardest for gully incision, followed by grassland and cropland. The results are helpful to rapidly estimate gully erosion, and identify the areas for gully erosion mitigation in small watershed.

1. Introduction

A gully is defined as an erosion channel with a cross-sectional area of more than 1 ft2 (929 cm2) [1], which cannot be obliterated by conventional tillage [2]. It is one of most important erosion types in small watershed. A gully, especially during its active development stage, is the main source of eroded sediment in small watershed [3,4]. In arid and semi-arid regions, the eroded sediment from gully erosion can account for 50% to 80% of the total sediment yield, and can even be as high as 84% to 99% in some areas [5]. Moreover, the initiation and development of a gully will considerably improve the hydrological and sediment connectivity of a watershed, and, thus, increase the sediment transport capacity, enhancing soil erosion [6,7]. Meanwhile, gully erosion is one of significant driving forces for land degradation, and can cause the destruction of cropland and damage infrastructure [8,9]. Therefore, it is of great significance to investigate the gully morphological characteristics and determine the topographic threshold of its incision for gully erosion estimation and control.
The gully morphological characteristics (i.e., length, depth, width, area, and volume) and their changes over time are closely related to its development stage. During the active stage, the morphological characteristics are far from stable and increase rapidly [7]. Nevertheless, during its later stable stage, most of morphological characteristics are relative stable [10]. In other words, the morphological characteristics, particularly their changes, can directly reflect a particular evolvement stage of gully [11]. The accurate measurement of gully morphological characteristics is, therefore, vital for estimating gully erosion and its control. Among these morphological characteristics, gully volume is the most significant to calculate gully erosion, which is the product of gully volume and soil bulk density [12].
The methods widely utilized to measure gully morphological characteristics are cataloged into direct and indirect approaches. The former includes tape, erosion pin, global positioning system (GPS), and total station [13,14,15,16]. The advantages of the direct method are reliability and accuracy, particularly GPS and total station. Nevertheless, it is expensive, labor-consuming, and cannot be applied to measure unreachable gullies and large-scale regions. The commonly explored indirect methods are 3D laser scanners, photogrammetry based on structure from motion, and remote sense images with different spatial resolutions [17]. A digital elevation model (DEM) or digital orthophoto map (DOM) with different solutions can be generated by some direct and indirect methods, i.e., GPS, total station, 3D laser scanner, remote sense image, and so forth. Both DEM and DOM can be explored to determine gully volume [11,12,14]. The estimated gully volume directly depends on the spatial resolution of DEM or DOM. However, in most cases, DEMs or DOMs with high resolution are scarce, which increases the difficulty in estimating gully erosion in regions. Therefore, there is an urgent need for a high-efficiency, high-accuracy, and low-labor-intensity method to measure gully morphological characteristics. In recent years, the unmanned aerial vehicle (UAV) was commonly applied to measure gully morphological characteristics under different conditions [11,18]. The results reveal that UAV can produce DEMs with high resolution to estimate gully erosion. Field measurements combined with UAV monitoring has been recognized as a powerful approach for gully volume or erosion measurement [9,11,14,19].
Due to the linear feature of gullies, and the difficulty in measuring their depth, it is a practical approach to estimate gully volume based on some easily measured gully characteristics (e.g., gully length). The length of a gully can be visually or automatically extracted from aerial photographs or satellite images [12]. The captured gully length is further utilized to develop an empirical relationship between gully volume and its length for a rapid gully erosion estimation. Many studies demonstrate that a significantly positive power function exists between gully volume (V) and length as V = aLb [9,11,12,20,21]. In addition to gully length, some other gully parameters, for instance circumference, surface area, and the ratio of gully top width to depth, are also explored to estimate gully volume [11,17]. The estimated gully volumes are closely related to the parameters applied and soil properties. Taking TW/D as an example, it represents the shape of gully cross-section (e.g., “U” or “V” shaped) [11], depending on soil texture and gully development stage. However, the gully TW/D of silt loam is controversial. Some studies suggest that TW/D significantly increases with the increase in silt content [22,23], while other studies show that TW/D decreases with silt content, since it provides a stable soil aggregate [9,24]. Thus, it is of great significance to choose suitable gully morphological characteristics to estimate gully volume or erosion under different conditions.
In addition to gully morphological characteristics, the topographic threshold of gully development has been widely utilized to identify the location of gully initiation [25]. For a specific area with uniform geology and similar climate, gully erosion occurs as a threshold phenomenon, and it initiates when a given upland drainage area (A) and a critical slope gradient (S) are exceeded or vice versa. The relationship can be described as S = kA−b1 [25]. Both the slope gradient of a gully head and the upslope drainage area can partially represent runoff volume and its energy [14], and, hence, they can be explored to reflect the threshold condition of gully initiation. The values of k and b1 range from 0.005 to 0.86 and from 0.0002 to 1.61, respectively [25]. The considerable variation in both of k and b1 directly indicates the significance of investigating the specific topographic threshold of gully erosion in different regions. In addition to commonly studied climates, soil, k, and b1 are also affected by land-use type [25]. Some previous studies found that the k of cropland is significantly greater than that of woodland and grassland, due to less vegetation coverage [14,25,26]. However, the quantitative effects of land-use type on the S–A relationship, and the related dominant influencing factors, are still a challenge at a small watershed scale. It is of great significance to determine the topographical threshold under different land-use types to prevent the gully occurrence in small watershed.
Soil erosion, especially gully erosion, is severe on the Loess Plateau, due to its unique climate, topography, soil, and vegetation conditions. More than 60% of the land has eroded, and the area with an erosion modulus exceeding 8000 t km−2 a−1 is 91,200 km2 [12,14]. The development of vertical joints is a distinctive feature of loess soil. During rainfall events, the joints are quickly filled by water and the hydrostatic pressure in the joints increases rapidly, which promote instability, and collapse of the gully head and its walls [27]. To control serious soil erosion, the famous “Grain for Green” project was implemented in 1999 on the Loess Plateau. Vegetation coverage increased significantly from 30% to 64% [14], particularly in the hilly–gully region. However, with the increase in extreme rainfall events, gully erosion is still a severe problem on the Loess Plateau [14,27]. Due to the complex morphology of gully shoreline and structure, the accuracy of morphological characteristics extracted from UAV images in areas with high gully density is still unclear. Quantification of gully erosion intensity is seldom reached at small watershed scale. Meanwhile, great attention should be paid to gullies with a length less than 500 m, especially those less than 100 m, since they are relatively active and produce a large amount of sediment in small watershed [11]. Therefore, the specific objectives of current study were to: (1) assess the accuracy of gully morphological characteristics extracted from UAV images using measured data of RTK, (2) analyze the cross-sectional characteristics of a gully and investigate a reliable relationship between gully morphological characteristics and its volume for gully erosion estimation, and (3) determine the topographic thresholds of gully initiation under different land-use types in a typical small watershed on the Loess Plateau.

2. Materials and Methods
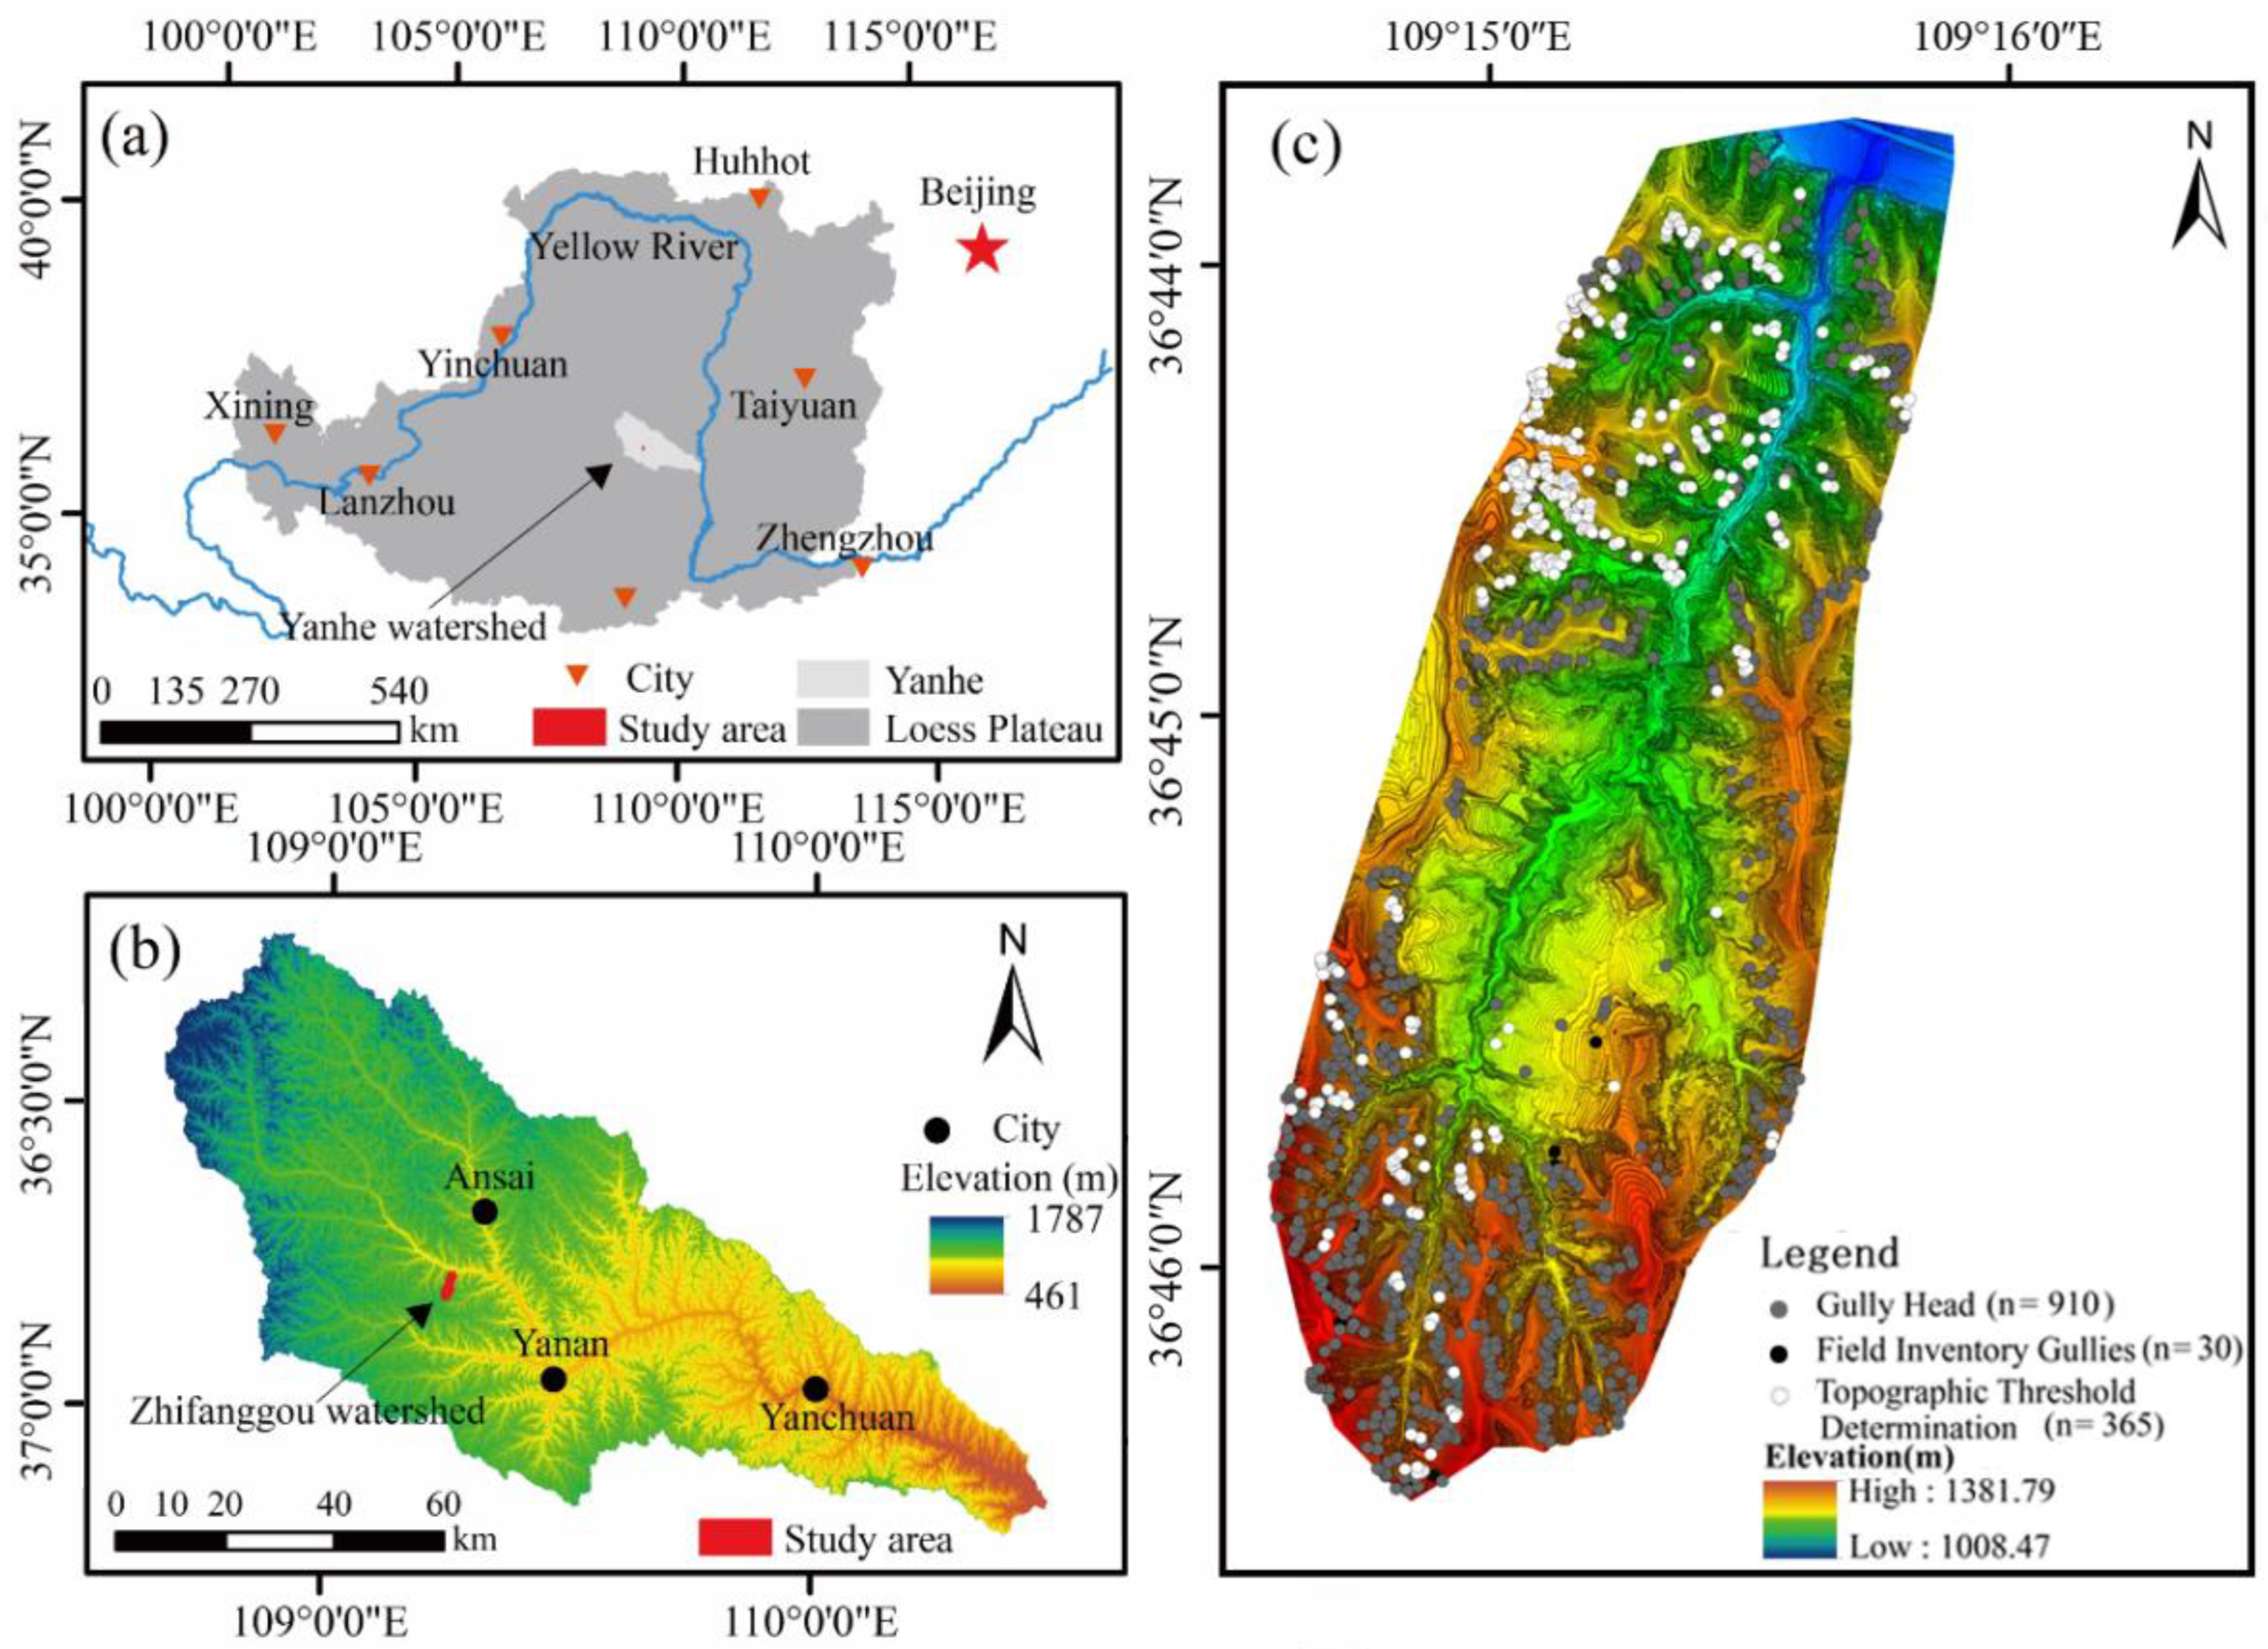
2.1. Study Area

This study was performed in the Zhifanggou small watershed in Ansai county (Figure 1a), Shaanxi Province (36°46′28″–36°46′42″N, 109°13′03″–109°16′46″ E), which is situated in the typical hilly–gully region of the Loess Plateau, with an area of 8.27 km2 and an altitude of 1039 to 1425 m (Figure 1b). This region has a typical semi-arid continental monsoon climate, with an annual mean temperature and precipitation of 8.8°C and 505 mm, respectively [28]. More than 70% of the precipitation falls from June to September as short heavy storms. The landscape is highly fragmented and composed of two distinct parts of hillslope and gully. The slope is relatively gentle (<25°) at hillslopes, while it is much steeper (25° to 79°) at gullies. The dominant soil is a typical loess (calcaric cambisols, FAO; Ustochnept, USDA), accounting for 75% of the studied area, with a uniform silt loam texture. Currently, the dominant land-use types in the small watershed are grassland, shrubland, woodland, wasteland, cropland, and orchard [28]. The dominant species of grass communities are Carex lanceolata Boott, Bothriochloa ischaemum (Linn.) Keng, Artemisia sacrorum, and Artemisia giraldii Pamp. The dominant species of shrub communities are Hippophae rhamnoides Linn., Caragana korshinskii Kom., and Sophora viciifolia [29].
Gully erosion is serious in the studied small watershed, with a gully density of 8.06 km/km2 [28]. The developed gullies can be cataloged into three types, named as bank, floor, and hillslope gully [20]. Bank gullies mainly occur at the boundary between the interfluve and the valley, which has the steepest slope. The slope gradient ranges from 45° to 79°, with a mean of 57°. Bank gullies accounts for approximately 60% (n = 550) of the total gullies in the studied small watershed. Floor gullies develop on the floor of the valley. They often occur immediately downstream from the convergence of two branches, or in an area with a great contributing area and gentle slopes [14]. There are 148 (16%) floor gullies developed in the studied small watershed. Hillslope gullies (n = 212) mainly develop in the cropland at the interfluves or the middle position of the slope where erosion intensity is great [20].

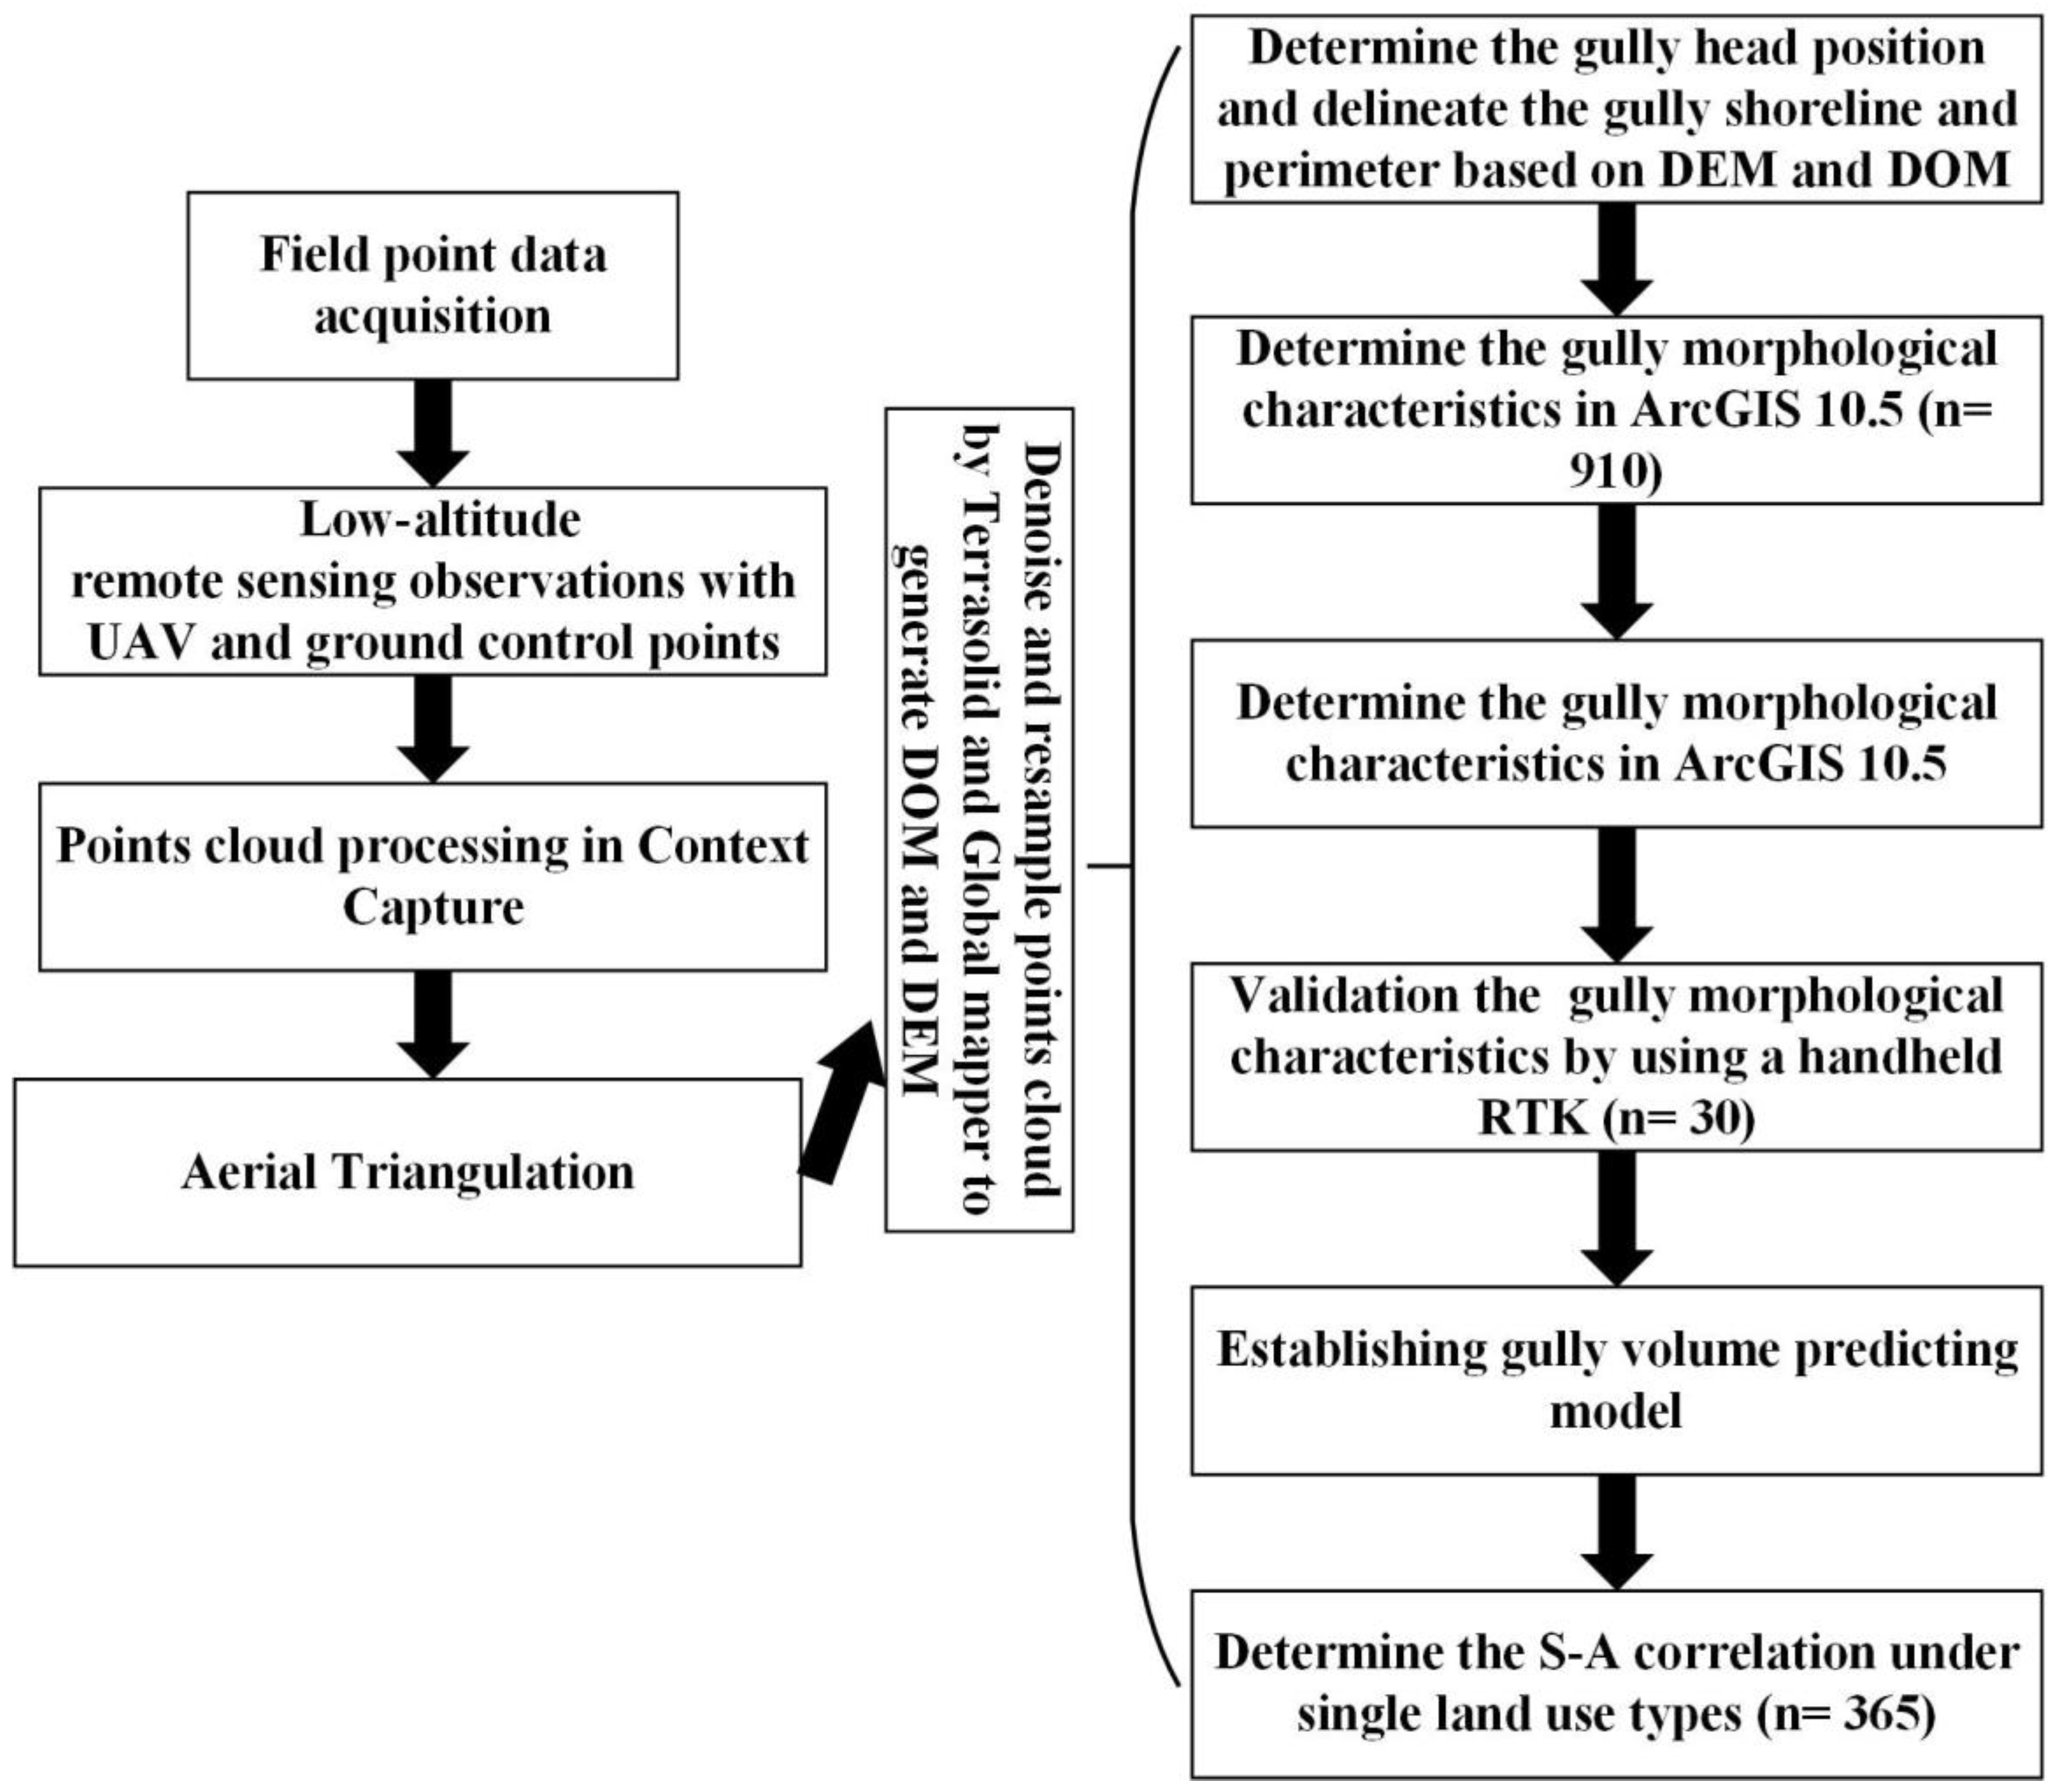
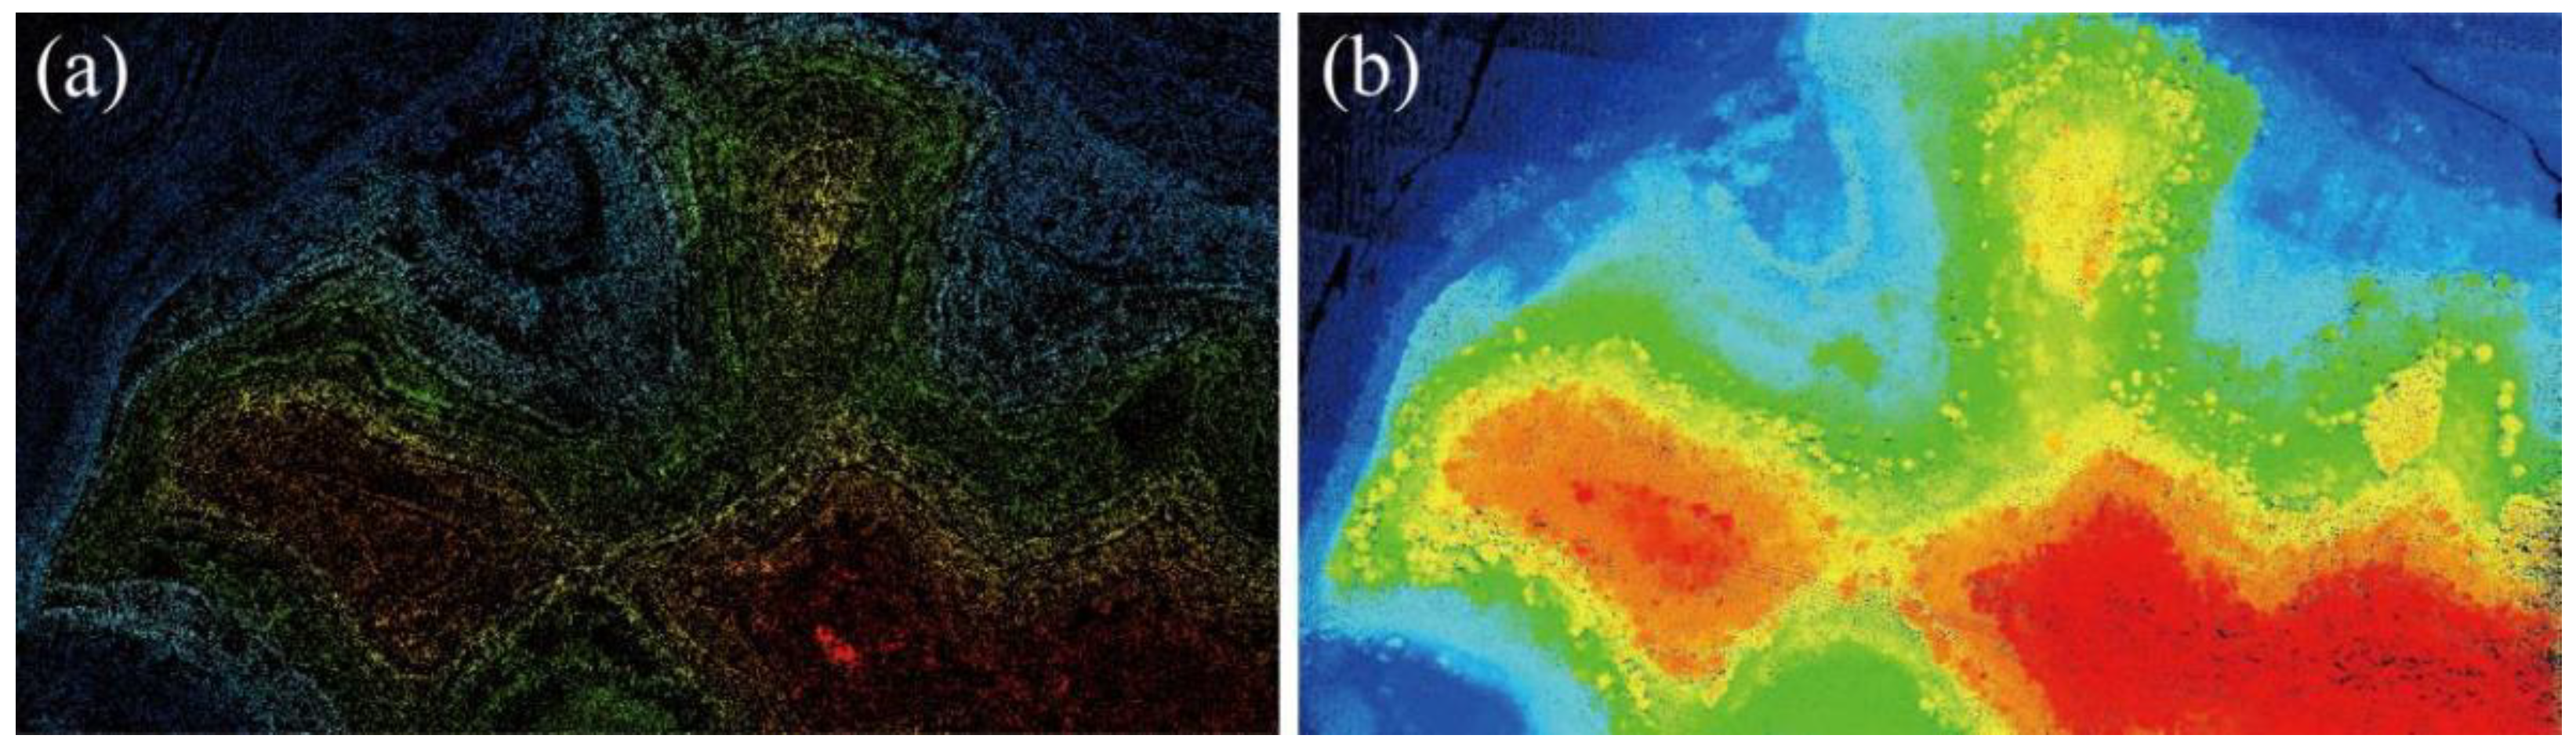
2.2. UAV Image and Its Processing

The logical scheme (flowchart) presenting the stages and sub-stages of the research approach is shown in Figure 2, comprising the UAV data processing method, the field validation, and the S–A model estimation. The low-altitude remote sensing observations were conducted using a UAV (Dji Phantom 4 RTK). A new RTK module was directly integrated into the Phantom 4 RTK, providing real-time, centimeter-level positioning data with a 1 cm + 1 ppm horizontal and a 1.5 cm + 1 ppm vertical accuracy. Phantom 4 captured the image data with a 1 inch, 20 megapixel CMOS sensor. Due to the high resolution of the applied camera, the Phantom 4 RTK achieved a ground sample distance of 2.74 cm at 100 m flight altitude [30].
UAV observations were carried out in April 2021, without crop and low vegetation cover, to reduce the disturbance of vegetation on terrain data. The investigated small watershed was separated into 8 sub-areas via the region segmentation tools in the Dji control system. The scheme of UAV was well-shaped fight, and a total of 12,427 photos were taken by UAV. A total of 10 ground control points were used for georeferencing of the aerial photogrammetry by the continuously operating reference stations (CORS) provided by QianXun system. The ground control points were located at the corner of the buildings with a “L” shaped marker in the size of 50 cm × 100 cm. The mean level and vertical errors of GCPS were 0.023 m and 0.031 m, respectively. The overlap rates of flight direction and side were set to 80% and 70%, respectively. The flight speed and height were 7.2 m s−1 and 100 m, respectively. The other detailed information of UAV flight and image processing are listed in Table 1.
The software of Context Capture (i.e., Smart 3D) was utilized to automatically process the images taken by camera to generate DOM, digital surface model (DSM), and point clouds with a spatial resolution of 0.053 m, under the geographic coordinate system of WGS-84/UTM zone 49 N. Terrasolid was applied to remove the effects of sparse vegetation from DSM and obtain a high resolution DEM (Figure 3). Terrasolid was also utilized to de-noise the point cloud, thin it out, and filter to obtain relatively rough ground point data. The accurate classification of ground points (exporting point cloud of ground points using Global Mapper to reconstruct the point cloud data by triangulation) was performed to generate DEM in tif format. The procedures described by Horvat et al. [31] were strictly followed. The location of gully heads was carefully detected from the produced DEM, including the gullies investigated in the field, and utilized to estimate the topographic threshold (Figure 1c).

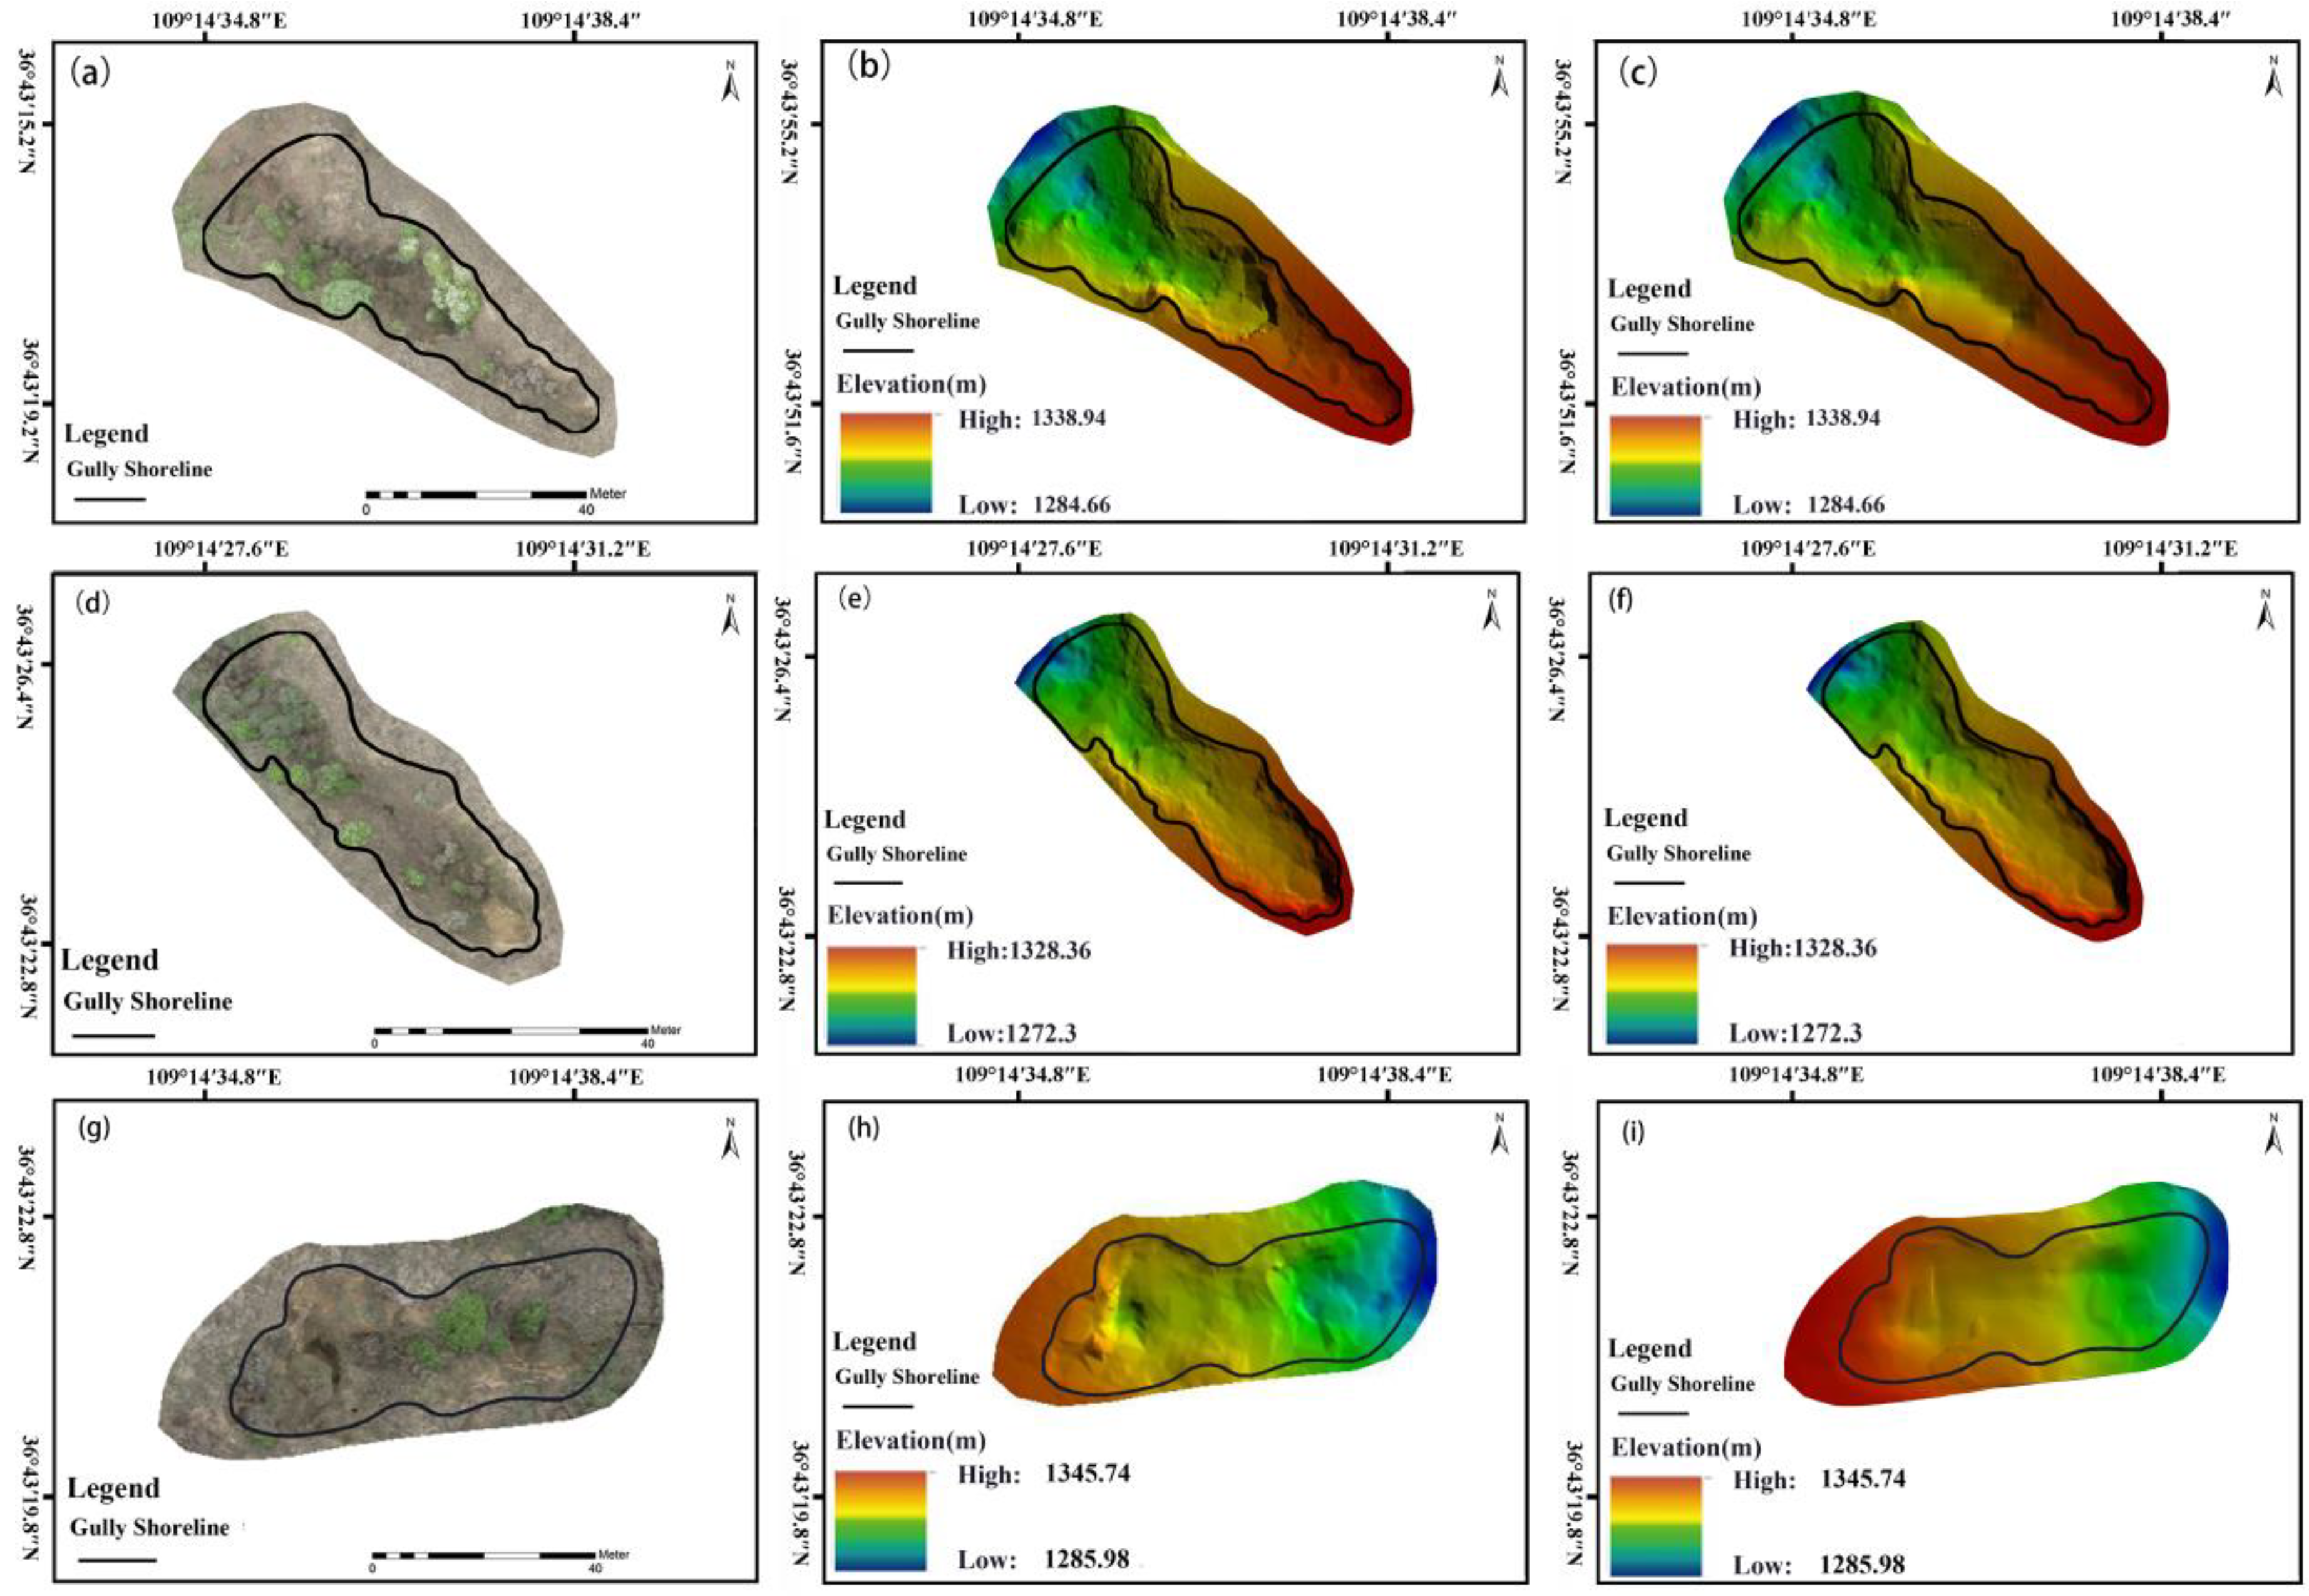
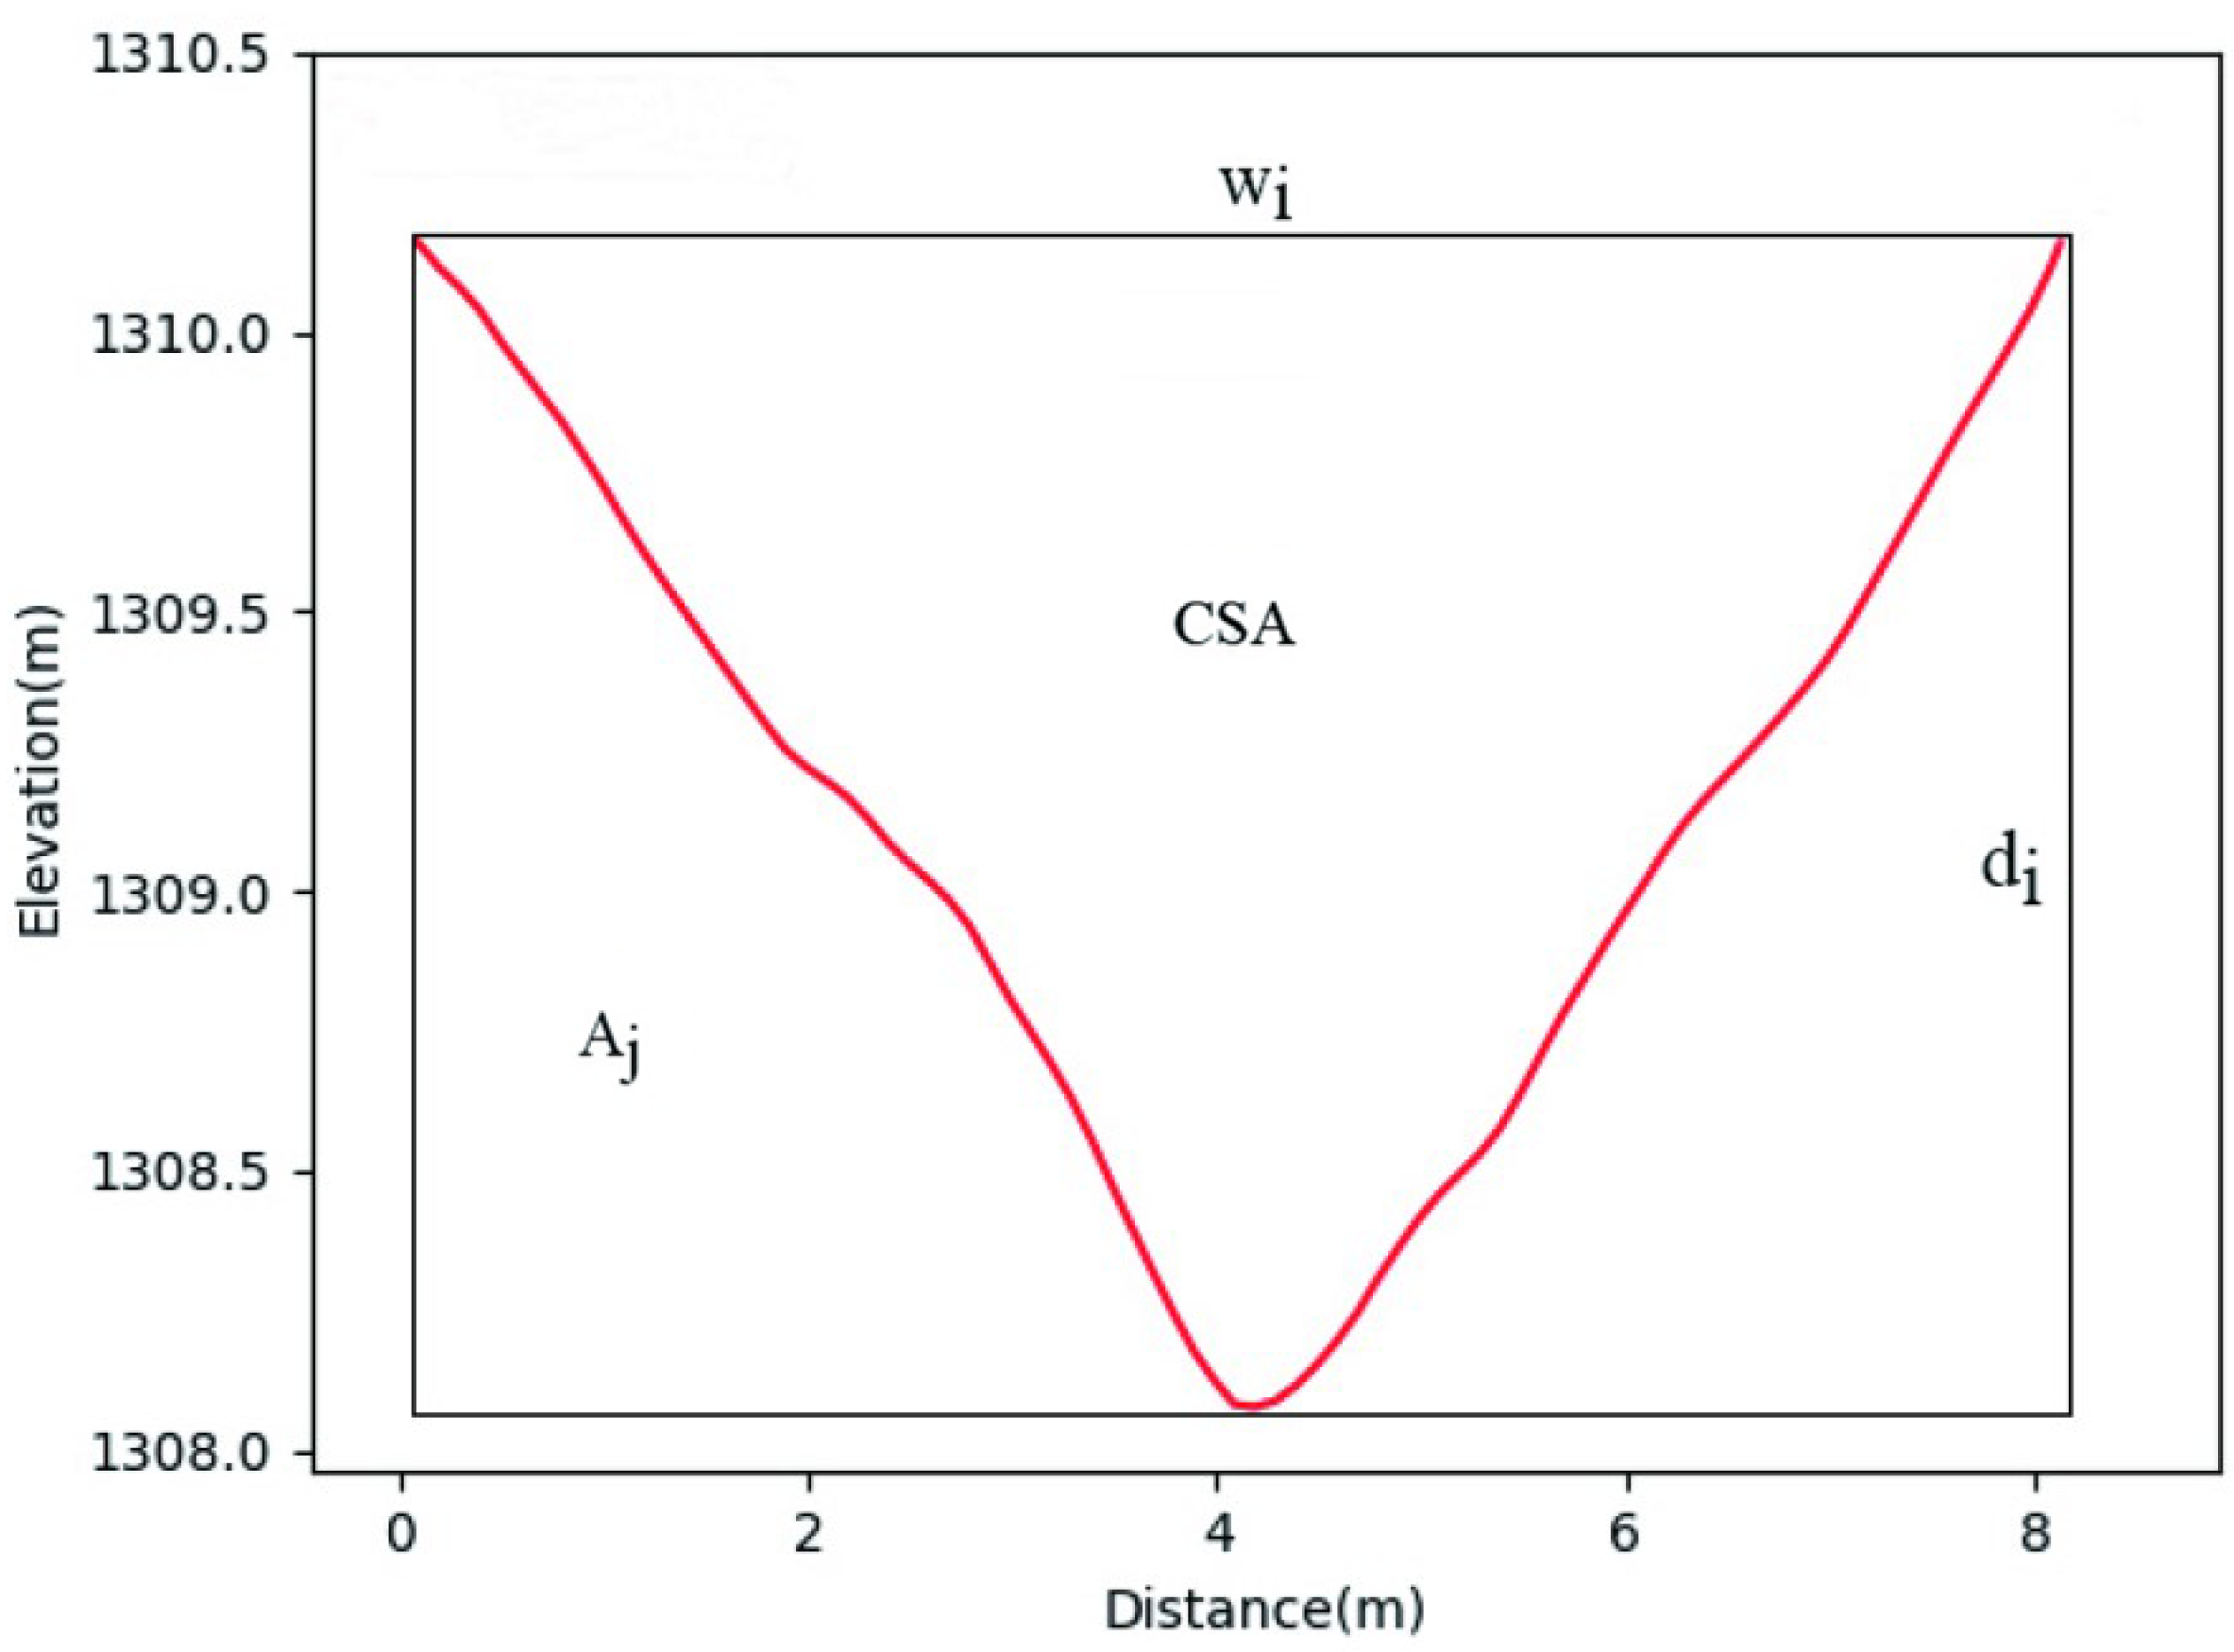
2.3. Gully Morphological Characteristics Acquisition from DEM

A total of 910 gullies were identified from UAV images in the studied small watershed. The gully boundary (shoreline) of each gully was digitized based on the DOM and DEM in ArcGIS software (https://developers.arcgis.com/, accessed on 13 October 2021) through visual interpretation. The DOM and DEM of three gully types are shown in Figure 4. A total of 10 gully morphological characteristics were extracted, including length, circumference, plane area, surface area, volume, depth, top width, mean width, cross-sectional area, and top width/depth based on DOM and DEM in ArcGIS software. The gully length was defined as the distance from the gully head to the gully outlet. The gully circumference was referred to the total length of the gully perimeters, while the gully plane area was defined as the 2D gully area. These 3 parameters were extracted by adding the gully and attribute table in ArcGIS 10.2 [11]. The gully surface area was determined by the basin analysis module in the spatial analyst tools. The gully volume was estimated using a neighborhood analysis module, and the cut and fill function in the surface analysis module [11]. The gully depth was determined as the average vertical distance from the top to the bottom, and they were extracted using the ArcGIS 3D section analysis module (Figure 5). Five cross-sections evenly distributed along each gully were analyzed to estimate gully width. Gully top width was computed as the mean horizontal distance between the left and right vertex of the five cross-sections. The gully mean width was calculated as the mean width of the cross-sections. Gully width and cross-sectional area were the means of five cross-sections:
TW = 1 5 1 n   = 5 w i
CSA = 1 5 1 n   = 5 w i × d i 1 n   = 5 A j
where TW is the gully top width (m), CSA is the gully cross-sectional area (m2), w i and d i are the width and the depth of the gully cross-section, respectively, and Aj is the area of the sections below the cross-section line.

2.4. Field Measurements of Gully Morphological Characteristics

The field inventory and measurement of gully morphological characteristics were carried out in October 2021. The DEM acquired by UAV with RTK was further processed with the points cloud removing tools (i.e., Terrasolid and Global Mapper). During this process, the ground points may be wrongly removed. The vegetation points probably remained as the classification system of Terrasolid failed to recognize them as ground points. Conversely, the elevation measured by handheld RTK was the literal elevation without the influence of vegetation cover. Thus, the field inventory and measurement of gully morphological characteristics were necessary to validate the accuracy of DEM acquired by UAV images. To validate the gully location, and to measure the required gully characteristics, we systematically walked along the reachable gully shoreline under different land-use types. A total of 30 gullies were measured by a handheld RTK HI TARGET® V90, and the position of each gully head was recorded. Among these investigated gullies, bank, floor, and hillslope gullies account for 50%, 30%, and 20% of the total gullies, respectively. The elevation of each gully (including the shoreline, gully head, and the gully bottom) was measured at an interval of 0.5 m to validate the gully characteristics extracted from the UAV images (Figure 4c,f,i). The mean horizontal and vertical errors of DOM and DEM were 0.18 m and 0.27 m for these check points, respectively. The land-use type of the upslope contributing area was identified for 365 gullies, to quantify the effects of land-use type on the topological threshold of gully initiation.
The mean absolute error (MAE), mean square error (MSE), root-mean-square error (RMSE), Nash–Sutcliffe efficiency coefficient (NSE), and mean absolute percentage error (MAPE) were utilized to assess the accuracy of gully morphological characteristics extracted from UAV images.

2.5. Gully Volume Estimation and Topographic Threshold (S–A) Model Determination

A total of 910 gullies within the studied watershed were used to determine the relationship of V–L. Due to the linear structure of gully, L was widely used to estimate gully volume as a power function:
V = aL b
where V is the gully volume in m3 and L is the gully length in m. A b greater than 1 indicates a large cross-sectional area of a long gully [12]. In addition to gully length, the surface area and plane area were also applied to estimate gully volume. To evaluate the performance of the fitted functions, the coefficient of determination (R2) of different functions were compared.
The 365 gullies with individual land-use type were used to determine the topographic threshold of gully initiation. The upslope drainage area and slope gradient were determined from UAV-derived DEM by the watershed and slope tools in ArcGIS. The A of the gully head was computed using D-infinity contributing area tools in TauDEM, and the local slope gradient was calculated as the average slope gradient at the gully head shoreline by 3D analysis tools [32]. The procedures described by Guan et al. [14] were strictly followed to determine the relationship between A and S in a log–log diagram. A straight line passing through the lowermost points was plotted to represent the topographic threshold, expressed as:
S = kA b 1
where S is the local slope gradient at the gully head in m m−1, A is the upslope drainage area at the gully head in ha, and k and b1 are the fitted parameters.

3. Results

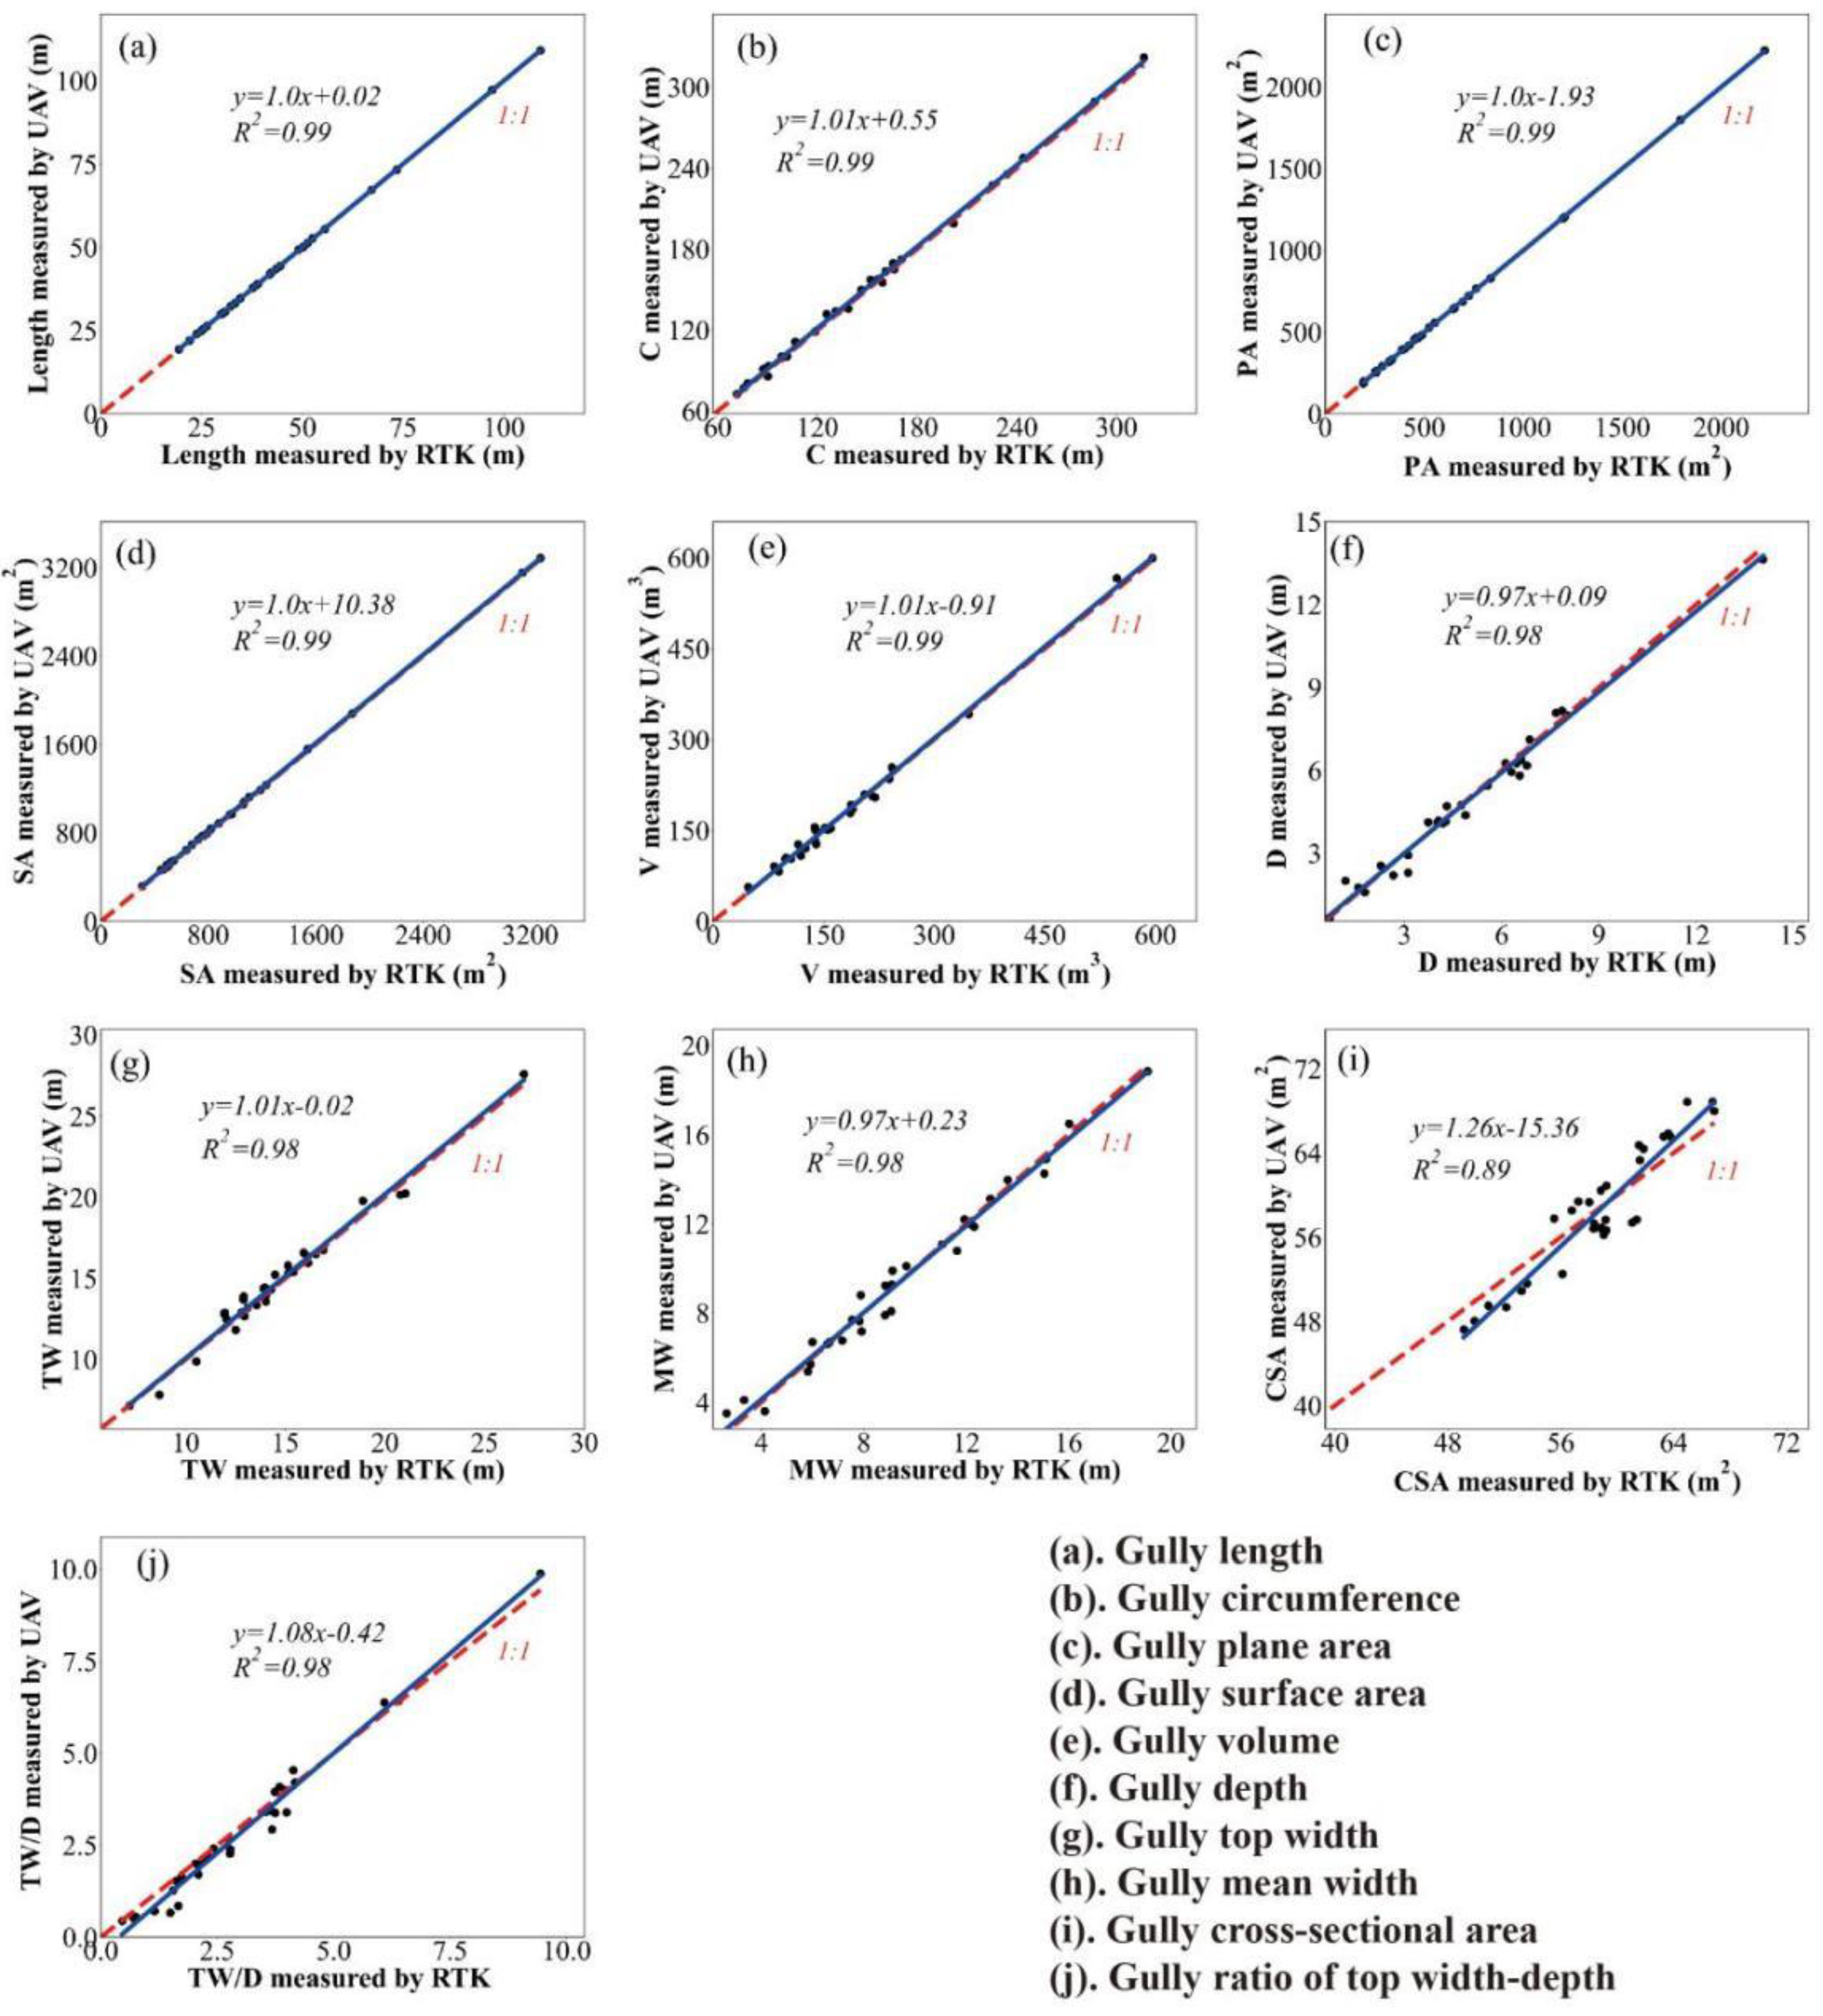
3.1. Evaluate Gully Morphological Characteristics Measured by UAV

The linear regressions of the gully morphological characteristics measured by RTK and determined from UAV-based DEM are shown in Figure 6. The R2 of five characteristics (L, C, PA, SA, and V) is 0.99, and the other four characteristics (D, TW, MW, and TW/D) is 0.98. The R2 of CSA between the two datasets is only 0.89. The regression coefficient of the fitted linear functions between RTK and the UAV images is recorded as 1, 1.01, and 0.97 for three characteristics (L, PA, and S), another three (C, V, and TW), and another two characteristics (D and MW), respectively. The relative great regression coefficient is found for CSA and TW/D (1.26 and 1.08).
The results of error analysis of the gully morphological characteristics between UAV and RTK are represented in Table 2. The MAE, MSE, RMSE, NSE, and MAPE of L, C, PA, SA, and V range from 0.002 to 0.999, 2.53% to 7.84%, 0.008% to 8.57%, 0.011% to 8.96%, and 0.04% to 15.89%, respectively. These results imply that C, PA, SA, and V measured by UAV match well with those measured by RTK. Moreover, MAE, MSE, RMSE, NSE, and MAPE of D, TW, MW, CSA, and TW/D vary from 0.053% to 13.87%, 0.031% to 9.15%, 0.046% to 11.44%, 0.038% to 11.38%, and 0.093% to 18.10%, respectively (Table 2). All these results show that UAV satisfactorily measured gully morphological characteristics in the studied small watershed.

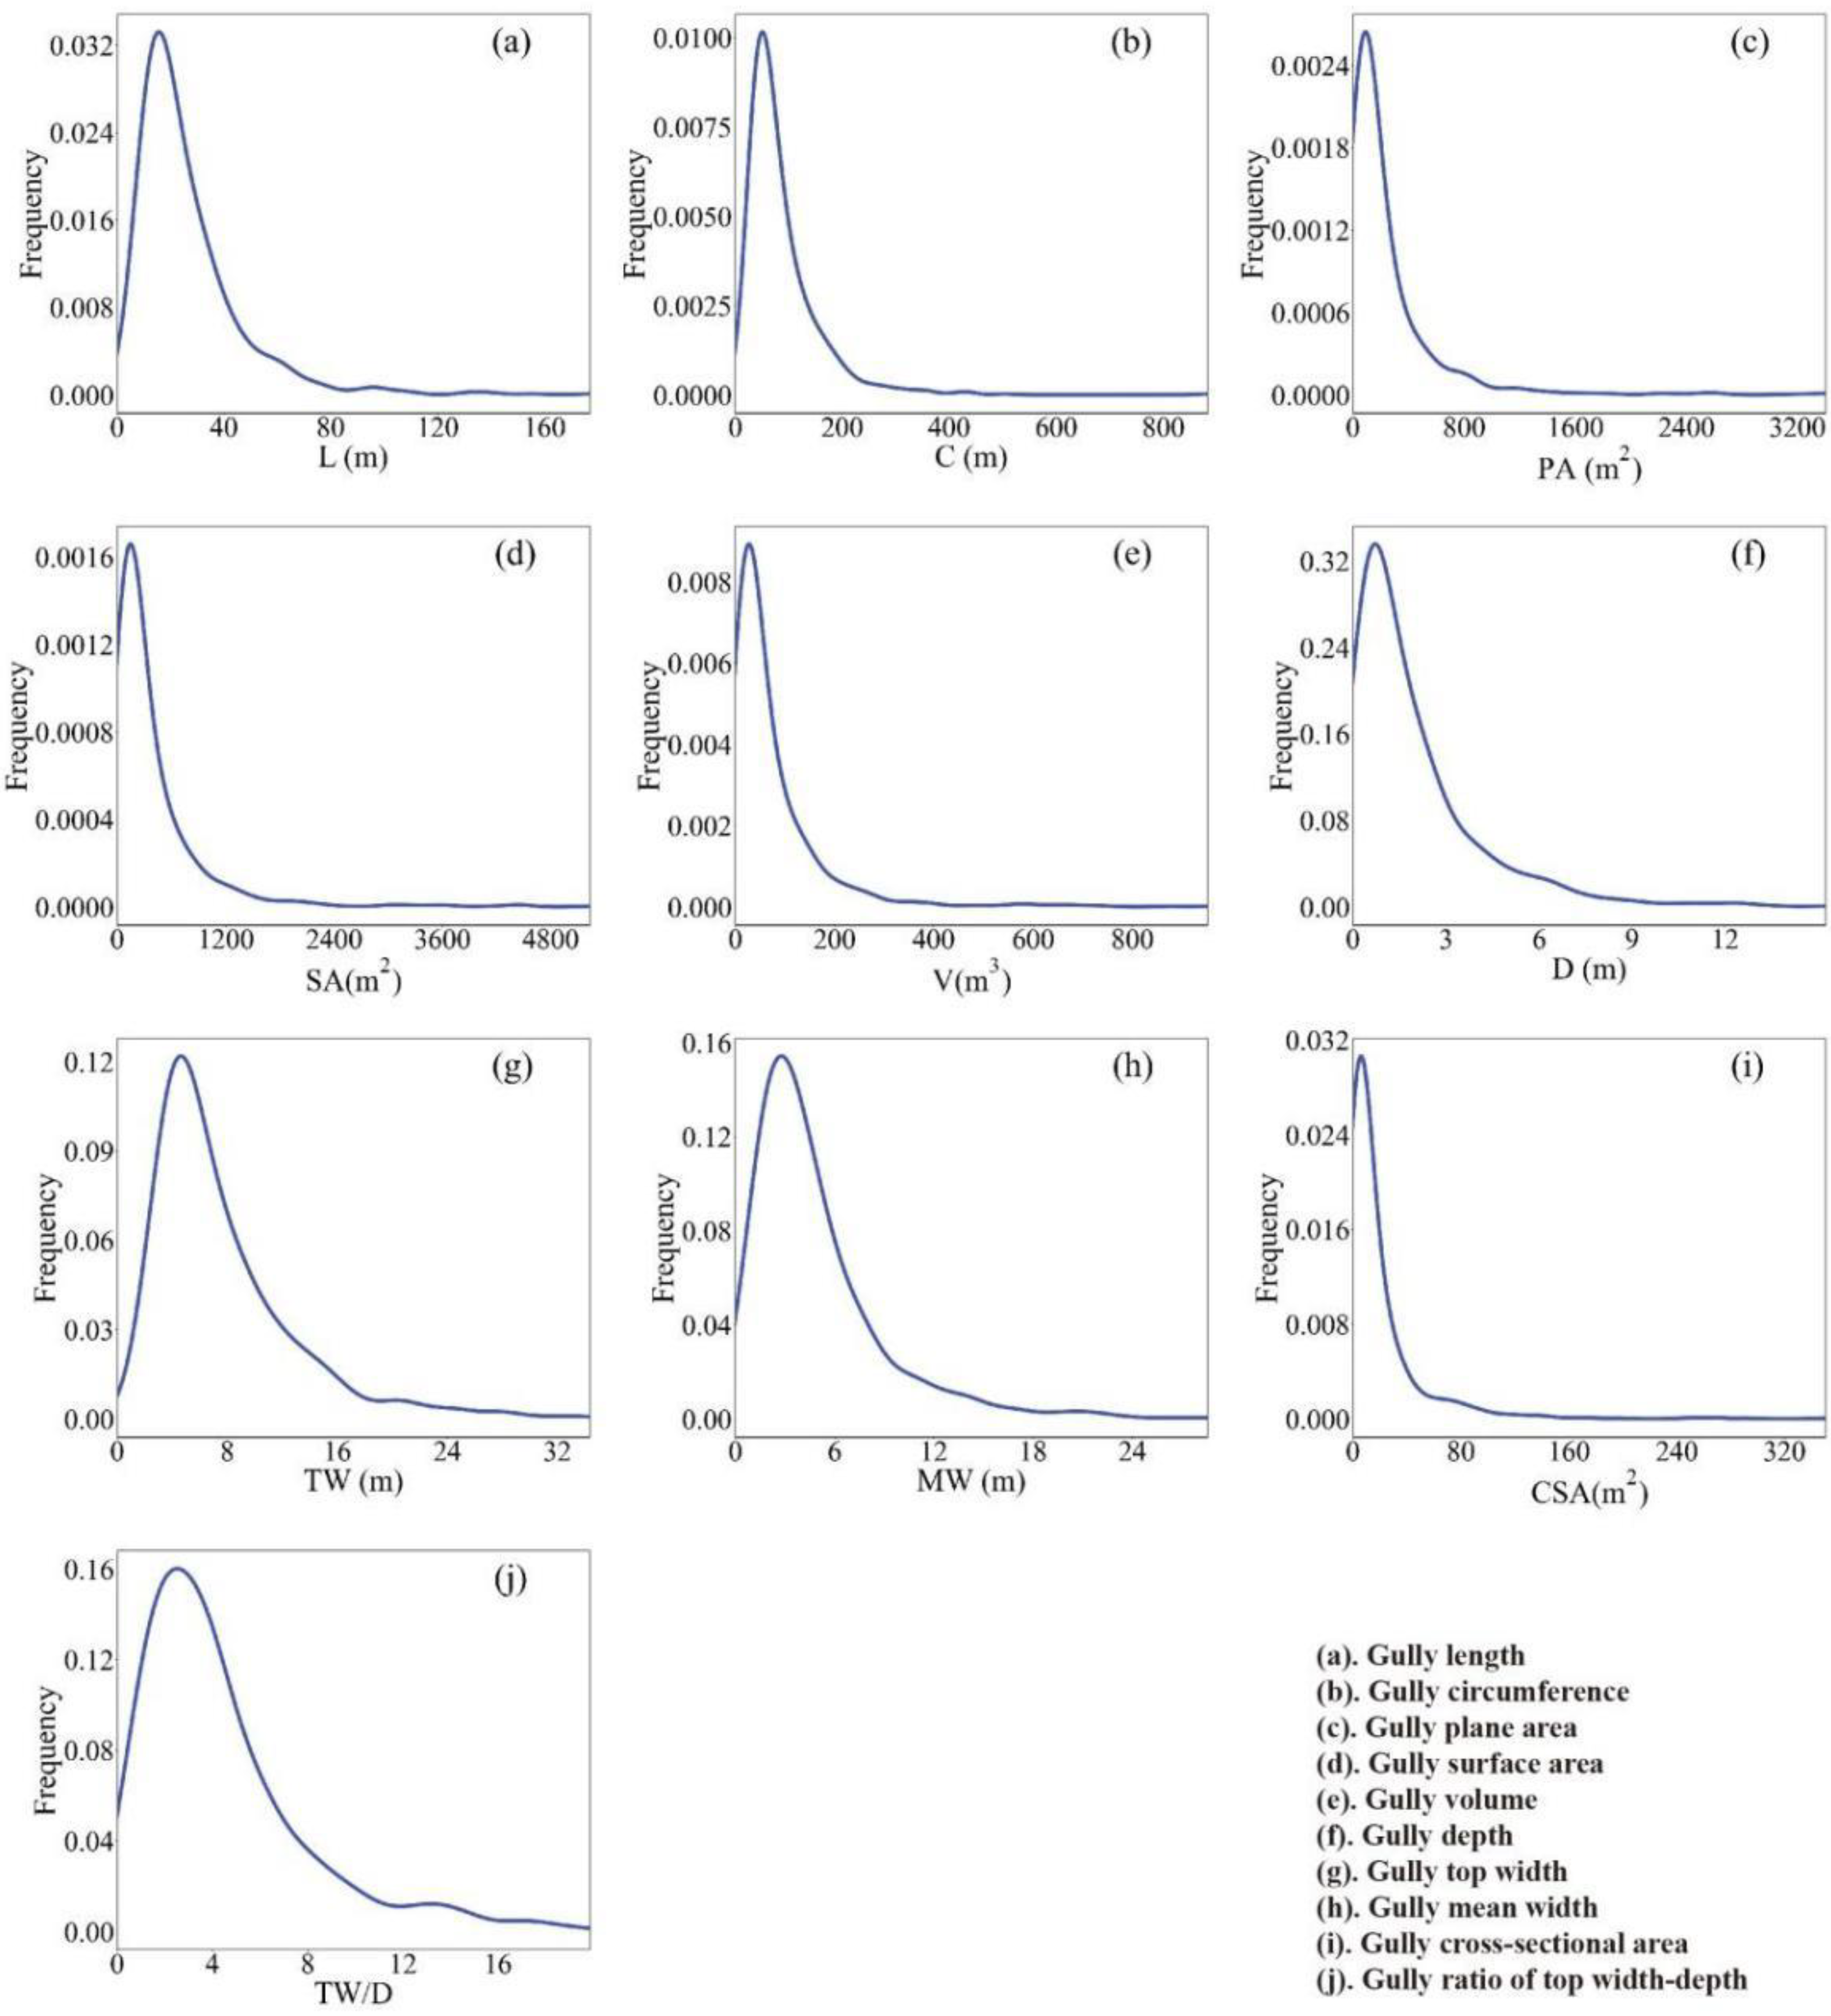
3.2. Morphological Characteristics of Gullies at Small Watershed Scale

As shown in Figure 7, the relative frequency of gully morphological characteristics (n = 910) were plotted. The measured L, C, PA, SA, and V by UAV in the studied small watershed varies from 3.86 to 155.77 m, 14.21 to 502.60 m, 15.28 to 3400.24 m2, 16.78 to 5228.95 m2, and 14.39 to 950.89 m3, respectively, with averages of 25.90 m, 85.57 m, 238.56 m2, 388.33 m2, and 73.28 m3, respectively. The measured D, TW, MW, CSA, and TW/D range from 0.51 to 15.24 m, 0.87 to 28.36 m, 0.65 to 24.65 m, 3.74 to 350.74 m2, and 0.32 to 19.85, respectively, with averages of 1.94 m, 7.65 m, 4.87 m, 18.71 m2, and 4.61, respectively. A loose power function is found between TW and D:
D = 1.785 × TW0.497 (R2 = 0.22)
The results of Spearman’s correlation coefficients between different gully characteristics are listed in Table 3. V is significantly positively correlated with L, C, PA, SA, D, TW, MW, and CSA (p < 0.01). The strongest correlation is observed between V and SA, with a correlation coefficient of 0.995. Therefore, it is possible to estimate gully volume in the studied region using these eight characteristics.

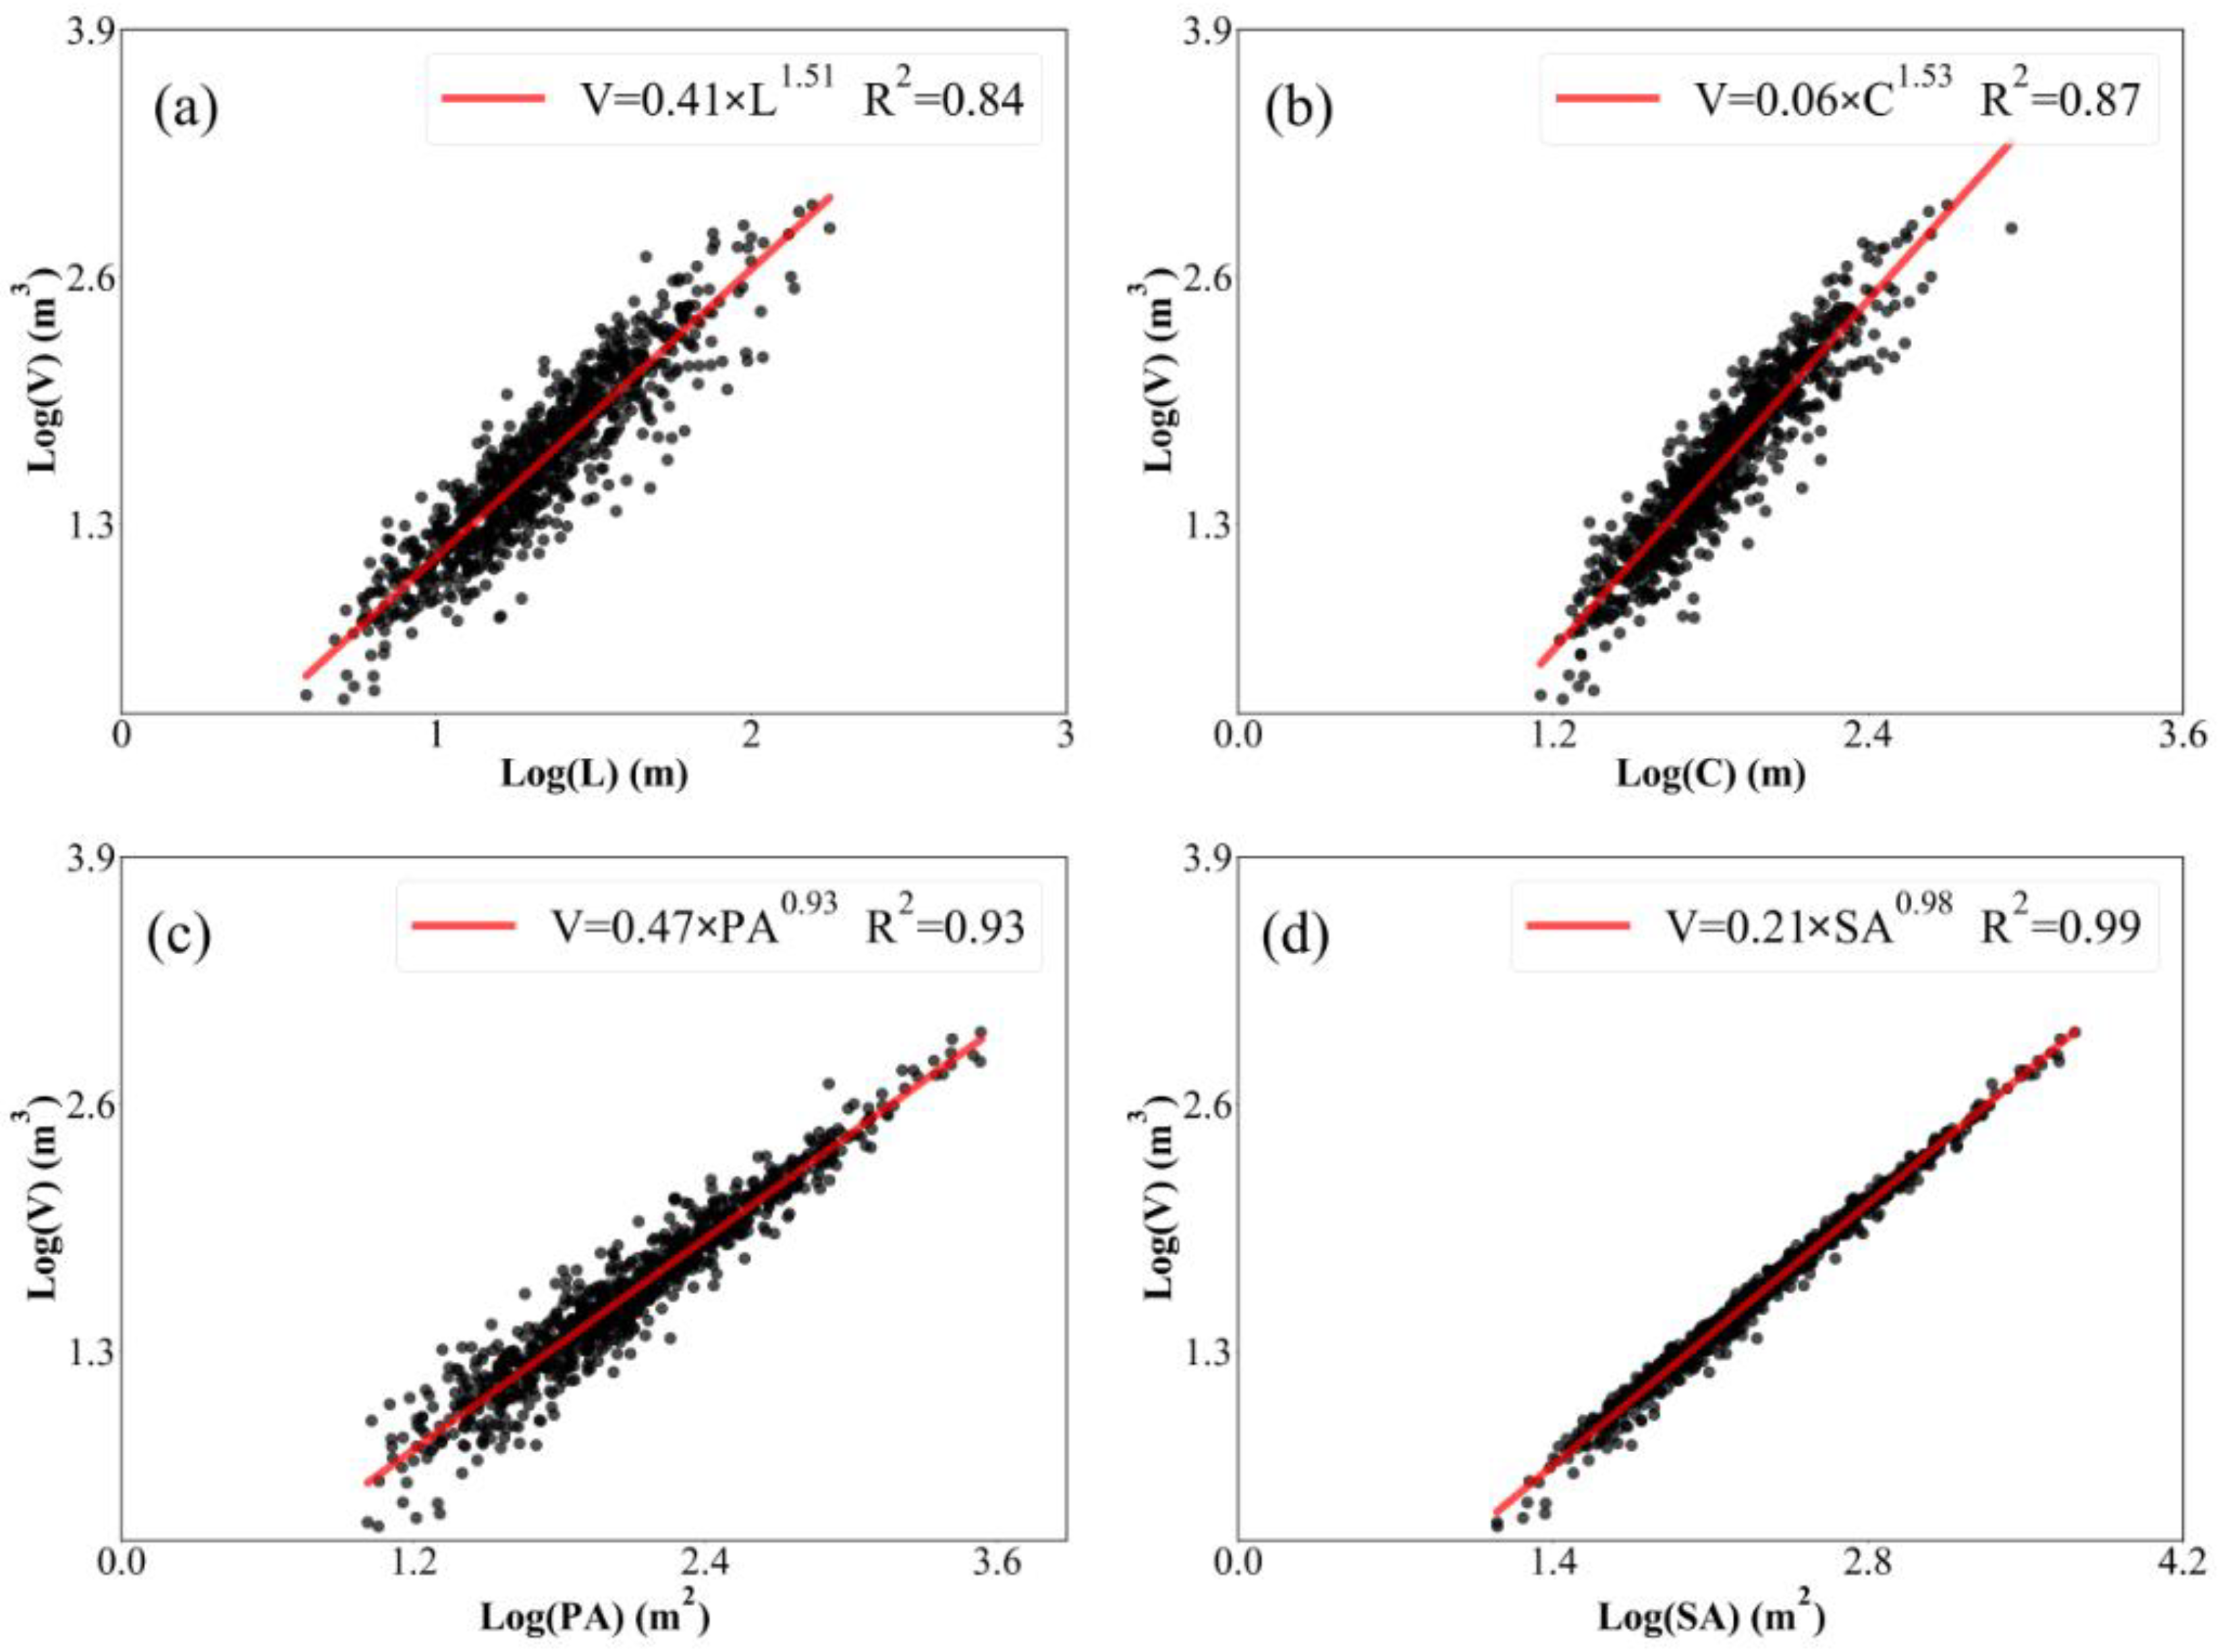
3.3. Estimating Gully Volume by Morphological Characteristics

A linear regression shows that gully volume could be well-estimated by gully L, C, PA, and SA (Figure 8). The corresponding equations are:
V = 0.412 × L 1.512   ( R 2 = 0.84 )
V = 0.065 × C 1.522   ( R 2 = 0.87 )
V = 0.471 × PA 0.924   ( R 2 = 0.94 )
V = 0.212 × SA 0.982   ( R 2 = 0.99 )
The relationships between V and other gully characteristics were also analyzed as following:
V = 3.477 × TW 1.345   ( R 2 = 0.58 )
V = 8.371 × MW 0.665   ( R 2 = 0.28 )
V = 14.873 × CSA 0.504   ( R 2 = 0.45 )
V = 11.267 × D 0.336   ( R 2 = 0.18 )
It is clear that SA is the best parameter to estimate gully volume in the studied small watershed, with a coefficient of determination of 0.99. A high coefficient of determination between V and L (R2 = 0.84) suggests that, in this region, gully development is dominantly controlled by longitudinal incision process, e.g., head cut retreat. The close correlation between V and TW, and between V and D, indicates that, compared to gully vertical incision, gully volume is greatly affected by gully bank collapse. Meanwhile, a great b value fitted between V and L (1.345) implies that the structure of gullies in the studied small watershed is relatively long and wide, but shallow.

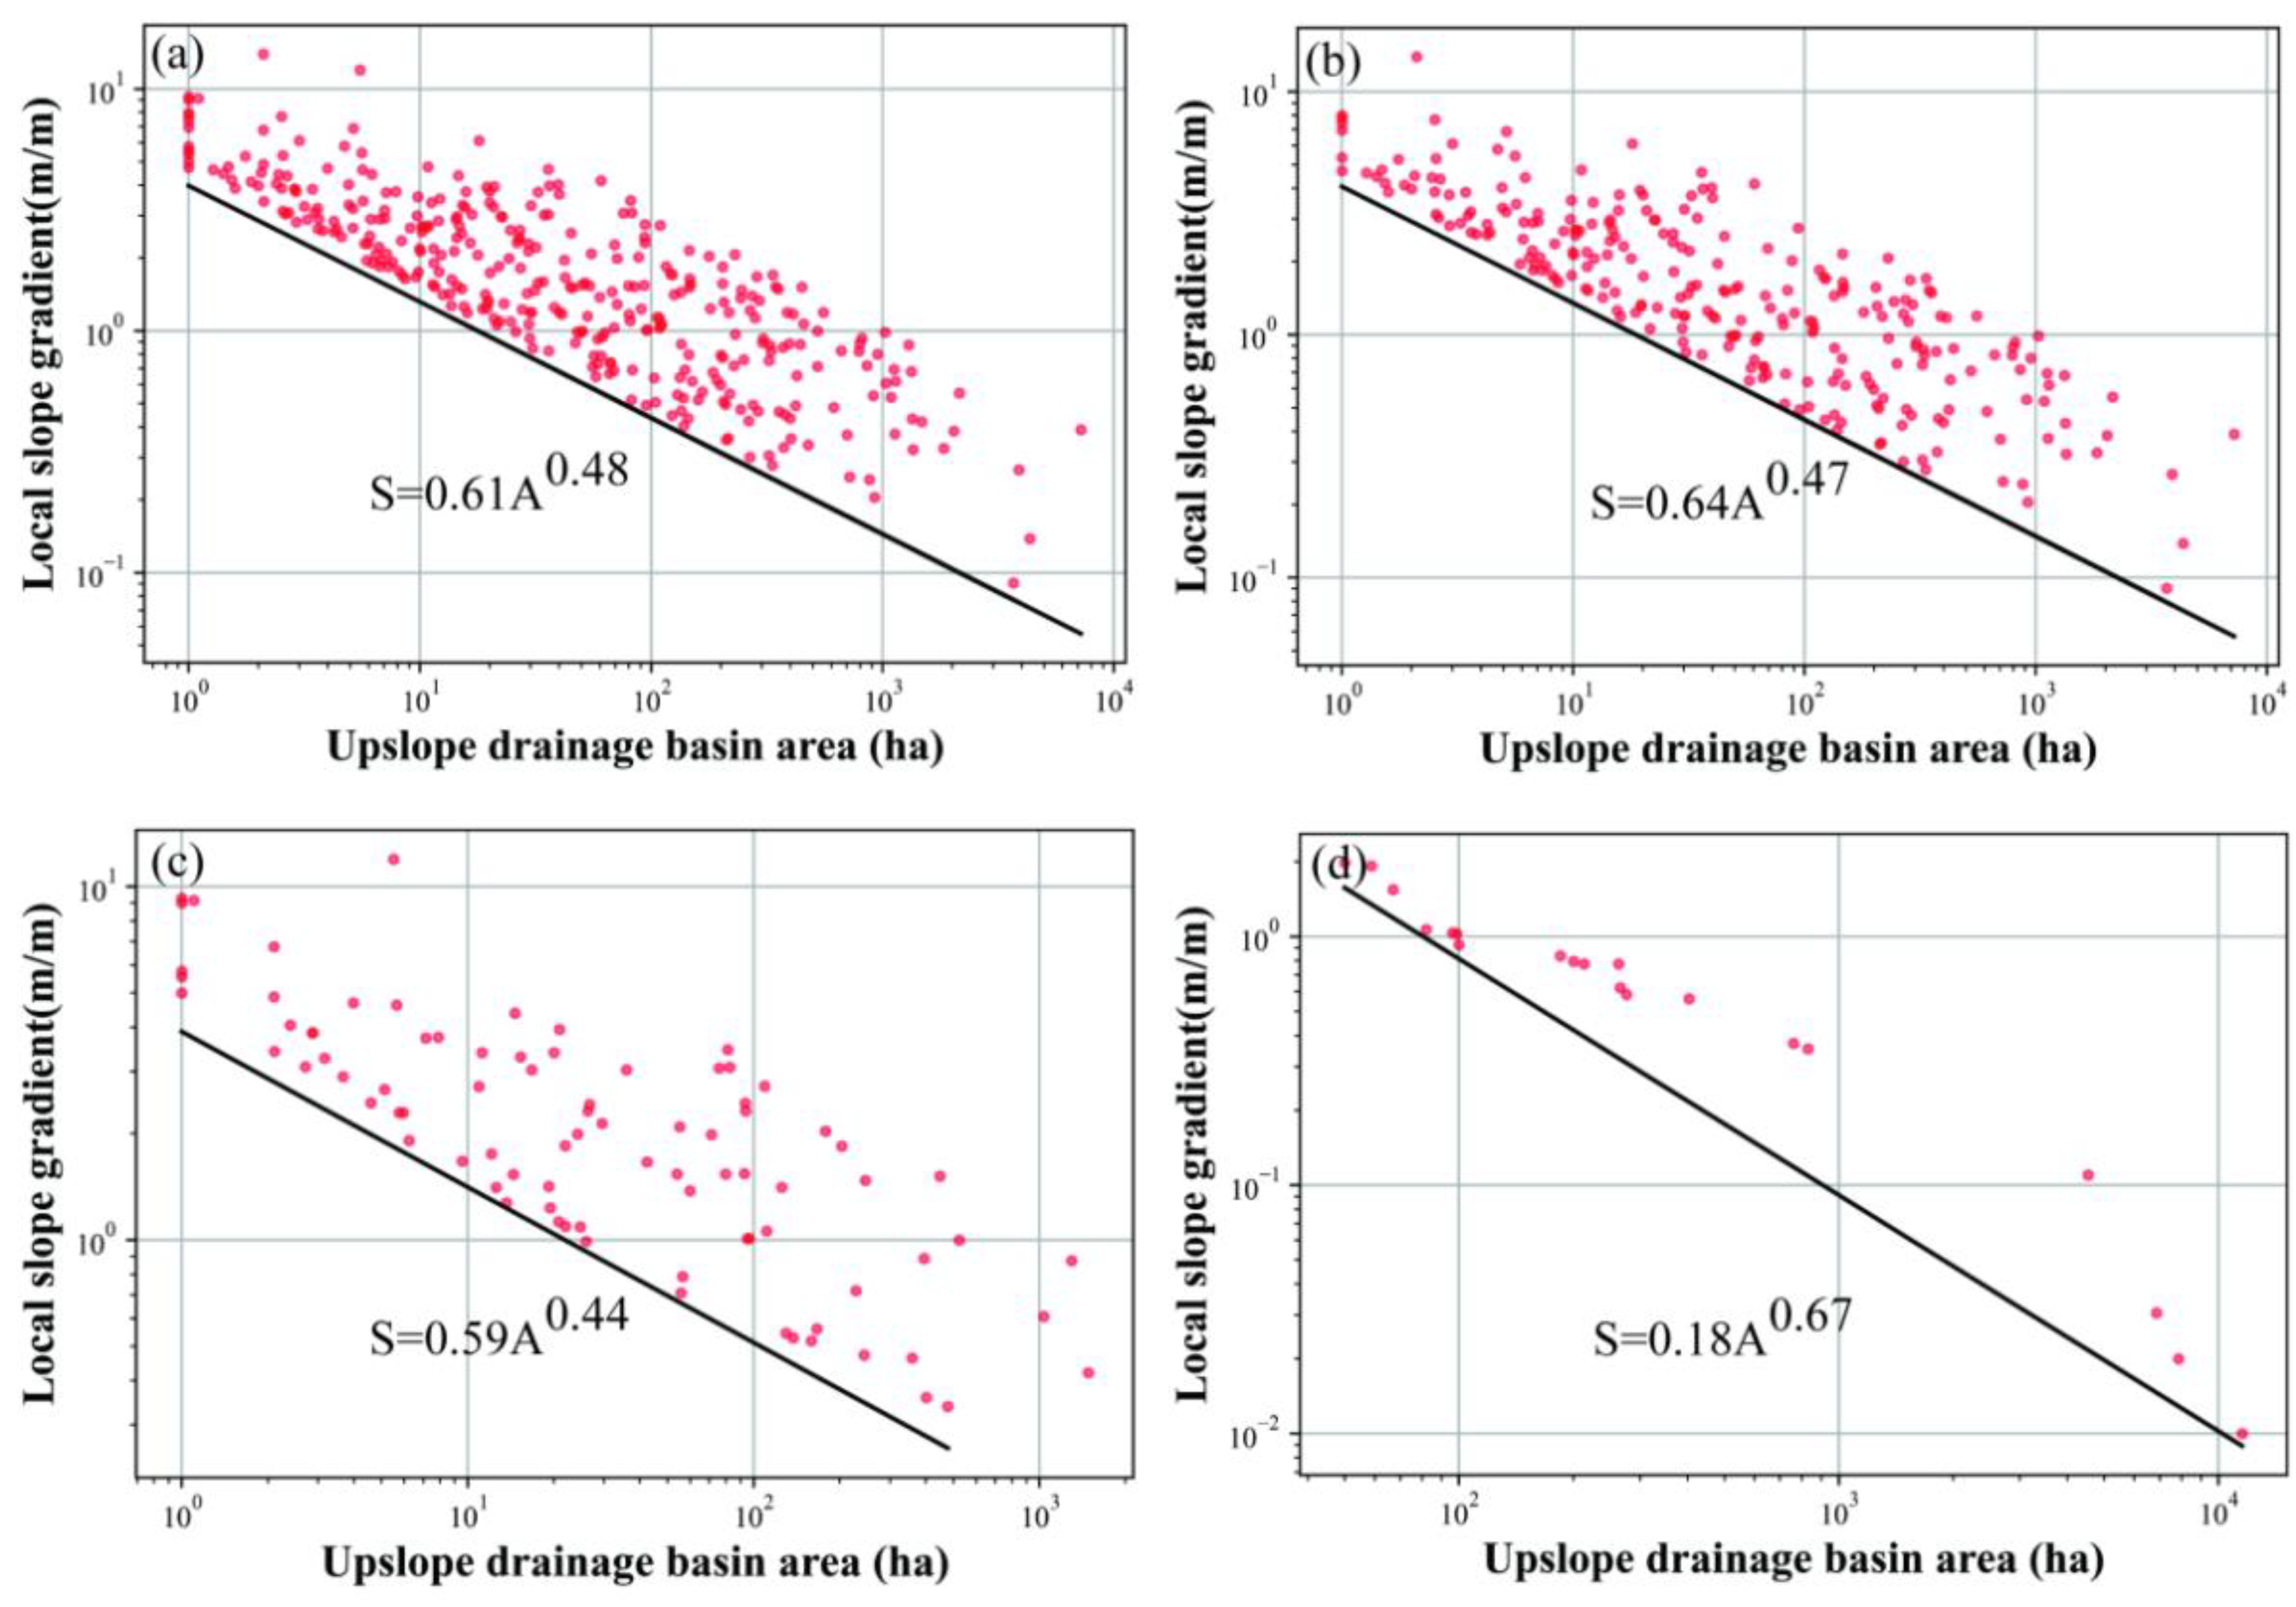
3.4. Topological Threshold of Gully Initiation

The local slope gradient at the gully head of 365 identified gullies with individual land-use type varies from 0.091 to 11.959 m m−1, with an average of 2.113 m m−1. The determined upslope drainage area of these gullies ranges from 1.5 to 7202 m2, with an average of 229.8 m2. For all datasets, the topographic threshold of gully initiation in the studied small watershed is (Figure 8a):
S = 0.61 × A 0.48
where S is the local slope gradient (m m−1), and A is the upslope drainage area at the gully head in ha.
The topographic threshold is greatly affected by land-use type (Figure 9). The fitted k and b1 of shrubland are 0.64 and 0.47, respectively (Figure 9b), while for grassland and cropland, they are 0.59 and 0.44 (Figure 8c), and 0.18 and 0.67 (Figure 8d), respectively. These results reveal that gully erosion is strongly impacted by land-use type. In the studied region, shrubland is most resistant to gully erosion, followed by grassland and cropland.

4. Discussion

4.1. Access the Accuracy of Gully Morphological Characteristic Determined by UAV Images

Previous studies show that the images captured by UAVs can be utilized to measure gully morphological characteristics, especially for small gullies [33]. Nevertheless, it is difficult to measure morphological characteristics of floor gullies by UAV, due to its deep location and small relief amplitude. In this case, the traditional field measurement is still more suitable [18]. For bank gullies, it is also hard for UAV technology to measure morphological characteristics on very steep slopes, due to the limitation of the shooting angle [16]. Compared to the oblique photography, the 3D gully characteristics (i.e., SA, D, CSA, V) extracted by ortho-image may produce a high number of errors. Therefore, a balance between the accuracy and time cost should be considered during gully erosion measurement [34], which is a common issue for the areas characterized by steep slopes. In this study, UAV could measure gully morphological characteristics, but the accuracy varies with different parameters. Generally, the measured results of the 2D parameters are better than that of the 3D ones. Compared to the measured results of RTK, the MAPE of the 2D gully characteristics measured by UAV is less than 10%, while the MAPE of the 3D characteristics is less than 20% (Table 1), which is consistent with the conclusions of some previous studies [18,35]. The DSM was widely utilized to estimate gully volume in the previous studies instead of the DEM. The gully volume is likely to be underestimated, as the elevation information is hindered by the vegetation when DSM is applied [11,13]. Meanwhile, the gully depth and cross-sectional area could not be extracted with high precision, since the ground elevation could not be fully reflected by DSM. Under such circumstances, the DEM is more powerful than DSM for the precise measurement of gully morphological characteristics and further estimating its volume. With the help of Terrasolid and Global Mapper to remove the points cloud of vegetation, the 3D morphological characteristics of the gullies could be obtained accurately, which were confirmed by the results of RTK. The results also suggest that the processing tools of points cloud successfully removed the disturbance of vegetation. The technique and the corresponding working flows could be applied to other studies to measure gully erosion at small watershed scale.

4.2. Analysis of the Gully TW/D and Modelling Gully Volume

The gully morphological characteristics vary with climate, topography, soil, vegetation, land use, and the stage of gully development [11,12]. The variations in gully morphological characteristics measured in this study are within the range of values reported by Li et al. [12], who investigated gully erosion on the Loess Plateau of China. The measured results of the current study are also consistent with the ranges measured by Frankl et al. [36] in the semi-arid region of northern Ethiopia. Compared to the results of Li et al. [12] and Frankl et al. [36], the mean morphological characteristics of gullies measured in this study are a little less, due to the differences in climate, topography, vegetation coverage, and land-use structure [9,12].
The TW/D directly reflects the shape of gully cross-section. A TW/D greater than 1 means the rate of gully width is greater than its incision, and the shape of the cross-section is wide but shallow [12]. In this study, the gullies with a TW/D greater than 1 account for 93% of the total gullies, and the mean TW/D is considerably greater than that of other studies (Table 4). This difference is mainly produced by the difference in soil texture, as shown in Table 4, except for the study of Yibeltal et al. [9]. In their study, clay soil was tested, but TW/D is different than the mean of current study. This difference was likely caused by soil properties and slope gradient. As discussed by Vandekerckhove et al. [37] and Schumm [24], TW/D of a gully is smaller for non-cohesive (sand) soils than that of cohesive soils (silt–clay), and increases with slope gradient [22]. Previous studies show that the flow velocity, stream power, and unit energy of the cross-section increases with the slope gradient of the gully, demonstrating an increased expenditure of the flow power, potential energy, and kinetic energy to separate soils [38]. With the great slope gradient in the studied area, the erosive power of concentrated flow increases considerably and, hence, a high TW/D is expected [22,23]. Meanwhile, the soil water content also affects the gully width, as the bank failure tends to occur when the soil water content is high. The soil moisture content increases because of rainfall infiltration, which leads to a decrease in the soil shear strength, and, ultimately, results in bank failures. With the vertical joints in the typical loess, the bank failures are aggravated under the rainfall infiltration [27]. The TW/D can partially reflect gully erosion processes. A relative loose power function detected between TW and D (Equation (5)) implies that gully top width and depth are controlled by different erosion processes in the studied region. The top width of a gully is mainly controlled by bank failure, whereas gully depth is dominantly affected by runoff incision [9].
Gullies commonly appear as a linear landscape and, thus, their lengths are widely applied to estimate gully volume or erosion [9]. In this study, the fitted power function between gully length and volume (Equation (6)) is significant, with a R2 of 0.84, indicating that gully length could be used to estimate gully volume. Compared to some previous studies [12,22,39], the b value is greater (1.512). The larger the b coefficient, the more important the increase in CSA becomes with increasing length, and, thus, the more erodible the incised deposits or bank failure are [36]. The increase in CSA is induced by the gully width instead of gully incision, as the R2 of the V–D model is relatively lower. Meanwhile, the D in this study is also smaller compared to the previous studies, demonstrating that a large b coefficient is induced by the bank failure [3], and the gully width is significant compared to the previous studies. The relatively high coefficient of determination of the V–L model (0.84) suggests a strong relationship between gully volume and length, demonstrating that the shape of the gully in the studied watershed is generally long and wide, but shallow.
Similar to gully length, surface area of a gully is easily obtained from a DEM generated by UAV image. Therefore, it is also used to estimate gully volume or erosion in some previous studies [12]. In this study, a best power function was fitted between gully volume and its surface area, with a R2 of 0.99 (Equation (9). Compared to gully length (Equation (6)), the R2 of Equation (9) increases by 15%, which demonstrates that the relationship between gully volume and surface area is much closer than that of length in the studied small watershed. In other words, gully surface area is better than its length to estimate gully volume or erosion in the studied region. This result is consistent with the conclusions reported by some previous studies [9,12]. Thus, the surface area could be the most optimized gully morphological characteristics to estimate gully volume and erosion.

4.3. Topographic Threshold of Gully Initiation under Different Land Use Types

Gully erosion occurs when its threshold conditions are met. The topographic threshold is one of the most significant topics in gully erosion studies. Torri and Poesen [25] summarized the topographic threshold of gully erosion over the world, and concluded that topographic threshold of gully erosion is strongly impacted by land-use type. The constant k ranges from 0.005 to 0.230 with a mean of 0.08, and the exponent b1 varies from 0.10 to 0.80 with a mean of 0.329 in cropland. The k and b1 change from 0.2 to 0.86 and from 0.2 to 1.61 in grassland and woodland, respectively. The results of this study are within the ranges reported by Torri and Poesen [25]. Montgomery and Dietrich [40] demonstrated that erosion is controlled by overland flow and subsurface processes when b1 is greater than 0.2 and less than 0.2. Accordingly, the gully erosion is dominated by overland flow in the studied region. Meanwhile, it is found that land cover has a significant influence on the coefficient of k. The lowest k is observed in cropland, followed by grassland and shrubland. These results imply that a higher slope gradient or contributing area is needed for gully initiation in shrubland and grasslands than that of in cropland. In other words, cropland has a higher vulnerability to gully erosion than grassland and shrubland in the studied region. These results are in agreement with the conclusions of Torri and Poesen [25]. The root system of shrubland protects the soil surface from drop impact, and retards soil surface sealing. Soil aggregates are more stable if organic matter is present in the soil, which is usually more abundant under vegetation cover, especially the area under the shrub canopy [28]. Furthermore, vegetation increases friction to overland flow, decreasing runoff velocity and absorbing part of the flow energy. On the other hand, roots system of shrubland increase the resistance of the topsoil to flow detachment [41], which is equivalent to increasing soil cohesion [12,14]. This brings the soil to an almost non-erodible condition.
The root density is lower in grassland than it is in shrubland; the reinforcement effect of the roots is, therefore, more significant in shrubland, which provide a higher gully initiation susceptibility in grassland [28]. Meanwhile, the soil moisture is found to be higher in grassland compared to the shrubland, which results in a lower soil shear stress and more vulnerability to runoff incision compared to shrubland [42].
Subdividing the dataset based on land-use type did not lead to any appreciable difference in the fitted exponent of b1 (Figure 8). The fitted b1 of cropland, grassland, and shrubland are all in excess of 0.2, though the mean slope gradient of cropland is significantly less than that of shrubland and grassland. Compared to the other studies, the fitted b1 of grassland and shrubland is relatively small [25], which is likely induced by the great slope gradient in the studied area. The mean slope gradient of the tested gullies is about 54 in the Zhifanggou small watershed, which is much steeper than that of other studies [14,25]. Consequently, the contribution of upslope drainage area to gully initiation is reduced, since the velocity of concentrated flow accelerates with slope gradient, and the scouring capacity is stronger, accelerating the rate of gully head retardation and floor incision [9]. Meanwhile, a previous study found that, compared to cropland, soil erodibility is lower by 53.0% and 59.6% in grassland and woodland, respectively, which demonstrates that the feebleness of vegetation coverage and the frequent disturbance of soil contributes to the formation of new gullies in cropland [12].

5. Conclusions

This study measured gully morphological characteristics by UAV image, and determined its topographic threshold under different land-use types in a typical small watershed on the Loess Plateau, China. The results reveal that UAV is an effective approach to measure gully morphological characteristics in the studied region. The MAPEs of gully 2D and 3D characteristics are less than 10% and 20%, respectively, compared to the geometry measured by RTK. The great TW/D is induced by finer soil texture and steep slopes. Significantly positive correlations are detected between most of the gully morphological characteristics, i.e., V, L, C, PA, and SA. A significant power function is found between gully volume and its gully length is obtained (V = 0.412L1.512, R2 = 0.84). Gully surface area is better than gully length to estimate its volume ( V = 0.212 × SA 0.982   ( R 2 = 0.99 ) ) in the studied small watershed. The topographic threshold of gully erosion is affected by land-use type. For all the datasets of cropland, grassland, and shrubland, the determined S–A relationship is S = 0.61A0.48, implying that gully erosion is controlled by concentrated flow in the studied region. The fitted k is greatest in shrubland, followed by grassland and cropland, suggesting vegetation restoration is an effective approach to mitigate gully initiation in the semi-arid region.

Author Contributions

Z.W.: writing—review and editing. G.Z.: writing–modification. C.W.: visualization. S.X.: software. All authors have read and agreed to the published version of the manuscript.

Funding

This work is supported by the National Natural Science Foundation of China (42130701).

Acknowledgments

This work is supported by the National Natural Science Foundation of China (42130701). We thank Liang Guo, QingYu Xu, and XianBin Wang from China University of Geoscience (Beijing) for valuable discussion and experiment assistance. We also thank the members of the Ansai Research station of Soil and Water Conservation.

Conflicts of Interest

The authors declare no conflict of interest. The funders had no role in the design of the study; in the collection, analyses, or interpretation of data; in the writing of the manuscript; or in the decision to publish the results.

References

  1. Poesen, J.; Vandaele, K.; Van Wesemael, B. Contribution of Gully Erosion to Sediment Production on Cultivated Lands and Rangelands. In Proceedings of the Erosion and Sediment Yield: Global and Regional Perspectives; Walling, D.E., Webb, B., Eds.; IAHS Publishing: Exeter, UK, 1996; p. 251. [Google Scholar]
  2. Food and Agricultural Organization. Soil Erosion by Water, Some Measures for Its Control on Cultivated Land; FAO Agricultural: Rome, Italy, 1965. [Google Scholar]
  3. Frankl, A.; Deckers, J.; Moulaert, L.; Van Damme, A.; Haile, M.; Poesen, J.; Nyssen, J. Integrated solutions for combating gully erosion in areas prone to soil piping: Innovations from the drylands of Northern Ethiopia. Land Degrad. Dev. 2016, 27, 1797–1804. [Google Scholar] [CrossRef]
  4. Poesen, J.W.A.; Torri, D.B.; Van Walleghem, T. Gully erosion: Procedures to adopt when modelling soil erosion in landscapes affected by gullying. In Handbook of Erosion Modelling; Morgan, R.P.C., Nearing, M.A., Eds.; John Wiley and Sons: London, UK, 2011; pp. 360–386. ISBN 9781405190107. [Google Scholar]
  5. Samani, A.N.; Wasson, R.J.; Malekian, A. Application of multiple sediment fingerprinting techniques to determine the sediment source contribution of gully erosion: Review and case study from Boushehr province, southwestern iran. Prog. Phys. Geogr. 2011, 35, 375–391. [Google Scholar] [CrossRef]
  6. Zanandrea, F.; Michel, G.P.; Kobiyama, M. Impedance influence on the index of sediment connectivity in a forested mountainous catchment. Geomorphology 2020, 351, 106962. [Google Scholar] [CrossRef]
  7. Najafi, S.; Dragovich, D.; Heckmann, T.; Sadeghi, S.H. Sediment connectivity concepts and approaches. Catena 2021, 196, 104880. [Google Scholar] [CrossRef]
  8. Haregeweyn, N.; Tsunekawa, A.; Poesen, J.; Tsubo, M.; Meshesha, D.T.; Fenta, A.A.; Nyssen, J.; Adgo, E. Comprehensive assessment of soil erosion risk for better land use planning in river basins: Case study of the Upper Blue Nile River. Sci. Total Environ. 2017, 574, 95–108. [Google Scholar] [CrossRef] [Green Version]
  9. Yibeltal, M.; Tsunekawa, A.; Haregeweyn, N.; Adgo, E.; Meshesha, D.T.; Masunaga, T.; Tsubo, M.; Billi, P.; Ebabu, K.; Fenta, A.A.; et al. Morphological characteristics and topographic thresholds of gullies in different agro-ecological environments. Geomorphology 2019, 341, 15–27. [Google Scholar] [CrossRef]
  10. Samani, A.N.; Ahmadi, H.; Mohammadi, A.; Ghoddousi, J.; Salajegheh, A.; Boggs, G.; Pishyar, R. Factors controlling gully advancement and models evaluation (Hableh Rood Basin, Iran). Water Resour. Manag. 2010, 24, 1531–1549. [Google Scholar] [CrossRef]
  11. Wu, H.; Xu, X.; Zheng, F.; Qin, C.; He, X. Gully morphological characteristics in the loess hilly-gully region based on 3D laser scanning technique. Earth Surf. Process. Landf. 2018, 43, 1701–1710. [Google Scholar] [CrossRef]
  12. Li, Z.; Zhang, Y.; Zhu, Q.; Yang, S.; Li, H.; Ma, H. A gully erosion assessment model for the Chinese Loess Plateau based on changes in gully length and area. Catena 2017, 148, 195–203. [Google Scholar] [CrossRef]
  13. Gong, C.; Lei, S.; Bian, Z.; Liu, Y.; Zhang, Z.; Cheng, W. Analysis of the development of an erosion gully in an open-pit coal mine dump during a winter freeze-thaw cycle by using low-cost UAVs. Remote Sens. 2019, 11, 1356. [Google Scholar] [CrossRef] [Green Version]
  14. Guan, Y.; Yang, S.; Zhao, C.; Lou, H.; Chen, K.; Zhang, C.; Wu, B. Monitoring long-term gully erosion and topographic thresholds in the marginal zone of the Chinese Loess Plateau. Soil Tillage Res. 2021, 205, 104800. [Google Scholar] [CrossRef]
  15. Yang, S.; Wang, J.; Wang, P.; Gong, T.; Liu, H. Low altitude unmanned aerial vehicles (UAVs) and satellite remote sensing are used to calculated river discharge attenuation coefficients of ungauged catchments in arid desert. Water 2019, 11, 2633. [Google Scholar] [CrossRef] [Green Version]
  16. Lou, H.; Wang, P.; Yang, S.; Hao, F.; Ren, X.; Wang, Y.; Shi, L.; Wang, J.; Gong, T. Combining and comparing an unmanned aerial vehicle and multiple remote sensing satellites to calculate long-term river discharge in an ungauged water source region on the Tibetan plateau. Remote Sens. 2020, 12, 2155. [Google Scholar] [CrossRef]
  17. Li, Z.; Zhang, Y.; Zhu, Q.; He, Y.; Yao, W. Assessment of bank gully development and vegetation coverage on the Chinese Loess Plateau. Geomorphology 2015, 228, 462–469. [Google Scholar] [CrossRef]
  18. Liu, K.; Na, J.; Fan, C.; Huang, Y.; Ding, H.; Wang, Z.; Tang, G.; Song, C. Large-scale detection of the tableland areas and erosion-vulnerable hotspots on the Chinese Loess Plateau. Remote Sens. 2022, 14, 1946. [Google Scholar] [CrossRef]
  19. Wang, R.; Sun, H.; Yang, J.; Zhang, S.; Fu, H.; Wang, N.; Liu, Q. Quantitative evaluation of gully erosion using multitemporal UAV data in the southern black soil region of Northeast China: A case study. Remote Sens. 2022, 14, 1479. [Google Scholar] [CrossRef]
  20. Wu, Y.; Cheng, H. Monitoring of gully erosion on the Loess Plateau of China using a global positioning system. Catena 2005, 63, 154–166. [Google Scholar] [CrossRef]
  21. Kompani-Zare, M.; Soufi, M.; Hamzehzarghani, H.; Dehghani, M. The effect of some watershed, soil characteristics and morphometric factors on the relationship between the gully volume and length in Fars Province, Iran. Catena 2011, 86, 150–159. [Google Scholar] [CrossRef]
  22. Vanmaercke, M.; Poesen, J.; Van Mele, B.; Demuzere, M.; Bruynseels, A.; Golosov, V.; Bezerra, J.F.R.; Bolysov, S.; Dvinskih, A.; Frankl, A.; et al. How fast do gully headcuts retreat? Earth-Sci. Rev. 2016, 154, 336–355. [Google Scholar] [CrossRef]
  23. Vanmaercke, M.; Chen, Y.; Haregeweyn, N.; De Geeter, S.; Campforts, B.; Heyndrickx, W.; Tsunekawa, A.; Poesen, J. Predicting gully densities at sub-continental scales: A case study for the Horn of Africa. Earth Surf. Process. Landf. 2020, 45, 3763–3779. [Google Scholar] [CrossRef]
  24. Schumm, S.A. River Variability and Complexity; Cambridge University Press: New York, NY, USA, 2005; ISBN 9781139165440. [Google Scholar]
  25. Torri, D.; Poesen, J. A review of topographic threshold conditions for gully head development in different environments. Earth-Sci. Rev. 2014, 130, 73–85. [Google Scholar] [CrossRef]
  26. De Geeter, S.; Poesen, J.; Vanmaercke, M. Does the topographic threshold concept explain the initiation points of sunken lanes in the European loess belt? Catena 2020, 192, 104586. [Google Scholar] [CrossRef]
  27. Guo, W.Z.; Luo, L.; Wang, W.L.; Liu, Z.Y.; Chen, Z.X.; Kang, H.L.; Yang, B. Sensitivity of rainstorm-triggered shallow mass movements on gully slopes to topographical factors on the Chinese Loess Plateau. Geomorphology 2019, 337, 69–78. [Google Scholar] [CrossRef]
  28. Zhu, P.; Zhang, G.; Wang, H.; Yang, H.; Zhang, B.; Wang, L. Effectiveness of typical plant communities in controlling runoff and soil erosion on steep gully slopes on the Loess Plateau of China. J. Hydrol. 2021, 602, 126714. [Google Scholar] [CrossRef]
  29. Wang, J.; Zhang, Y.; Deng, J.; Yu, S.; Zhao, Y. Long-term gully erosion and its response to human intervention in the tableland region of the chinese loess plateau. Remote Sens. 2021, 13, 5053. [Google Scholar] [CrossRef]
  30. Ren, J.; Zhang, Z.; Gai, H.; Kang, W. Typical riedel shear structures of the coseismic surface rupture zone produced by the 2021 Mw 7.3 Maduo earthquake, Qinghai, China, and the implications for seismic hazards in the block interior. Nat. Hazards Res. 2021, 1, 145–152. [Google Scholar] [CrossRef]
  31. Horvat, D.; Žalik, B.; Mongus, D. Context-dependent detection of non-linearly distributed points for vegetation classification in airborne LiDAR. ISPRS J. Photogramm. Remote Sens. 2016, 116, 1–14. [Google Scholar] [CrossRef]
  32. Gudino-Elizondo, N.; Biggs, T.W.; Castillo, C.; Bingner, R.L.; Langendoen, E.J.; Taniguchi, K.T.; Kretzschmar, T.; Yuan, Y.; Liden, D. Measuring ephemeral gully erosion rates and topographical thresholds in an urban watershed using unmanned aerial systems and structure from motion photogrammetric techniques. Land Degrad. Dev. 2018, 29, 1896–1905. [Google Scholar] [CrossRef] [PubMed]
  33. Piacentini, T.; Galli, A.; Marsala, V.; Miccadei, E. Analysis of soil erosion induced by heavy rainfall: A case study from the NE Abruzzo Hills Area in Central Italy. Water 2018, 10, 1314. [Google Scholar] [CrossRef] [Green Version]
  34. Yuan, M.; Zhang, Y.; Zhao, Y.; Deng, J. Effect of rainfall gradient and vegetation restoration on gully initiation under a large-scale extreme rainfall event on the hilly Loess Plateau: A case study from the Wuding River basin, China. Sci. Total Environ. 2020, 739, 140066. [Google Scholar] [CrossRef]
  35. Frankl, A.; Stal, C.; Abraha, A.; Nyssen, J.; Rieke-Zapp, D.; De Wulf, A.; Poesen, J. Detailed recording of gully morphology in 3D through image-based modelling. Catena 2015, 127, 92–101. [Google Scholar] [CrossRef] [Green Version]
  36. Frankl, A.; Poesen, J.; Scholiers, N.; Jacob, M.; Haile, M.; Deckers, J.; Nyssen, J. Factors controlling the morphology and volume (V)-length (L) relations of permanent gullies in the northern Ethiopian Highlands. Earth Surf. Process. Landf. 2013, 38, 1672–1684. [Google Scholar] [CrossRef] [Green Version]
  37. Vandekerckhove, L.; Poesen, J.; Oostwoud Wijdenes, D.; De Figueiredo, T. Topographical thresholds for ephemeral gully initiation in intensively cultivated areas of the Mediterranean. Catena 1998, 33, 271–292. [Google Scholar] [CrossRef]
  38. Ban, Y.Y.; Wang, W.; Lei, T.W. Measurement of rill and ephemeral gully flow velocities and their model expression affected by flow rate and slope gradient. J. Hydrol. 2020, 589, 125172. [Google Scholar] [CrossRef]
  39. Vanmaercke, M.; Panagos, P.; Vanwalleghem, T.; Hayas, A.; Foerster, S.; Borrelli, P.; Rossi, M.; Torri, D.; Casali, J.; Borselli, L.; et al. Measuring, modelling and managing gully erosion at large scales: A state of the art. Earth-Sci. Rev. 2021, 218, 103637. [Google Scholar] [CrossRef]
  40. Montgomery, D.R.; Dietrich, W.E. Landscape Dissection and Drainage Area-Slope Thresholds. In Process Models and Theoretical Geomorphology; Kirkby, M.J., Ed.; Wiley: Chichester, UK, 1994; pp. 221–246. [Google Scholar]
  41. Majhi, A.; Nyssen, J.; Verdoodt, A. What is the best technique to estimate topographic thresholds of gully erosion? Insights from a case study on the permanent gullies of Rarh plain, India. Geomorphology 2021, 375, 107547. [Google Scholar] [CrossRef]
  42. Zhu, P.; Zhang, G.; Zhang, B. Soil saturated hydraulic conductivity of typical revegetated plants on steep gully slopes of Chinese Loess Plateau. Geoderma 2022, 412, 115717. [Google Scholar] [CrossRef]
Figure 1. Location of Zhifanggou watershed on the Loess Plateau (a), Yanhe watershed (b), and the maps for elevation and gully head position (c).
Remotesensing 14 03529 g001
Figure 2. The methodologies applied in this study (UAV, unmanned aerial vehicle; DOM, digital orthophoto map; DEM, digital elevation map).
Remotesensing 14 03529 g002
Figure 3. The points cloud processed by Terrasoil without vegetation and buildings to generate DEM (a), and the original point cloud extracted by UAV images (b).
Remotesensing 14 03529 g003
Figure 4. The DOM (a), UAV-derived DEM (b), and field inventory DEM (c) for a specific hillslope gully; DOM (d), UAV-derived DEM (e), and field inventory DEM (f) for a specific floor gully; and DOM (g), UAV-derived DEM (h), and field inventory DEM (i) for a specific bank gully in the study small watershed.
Remotesensing 14 03529 g004
Figure 5. Sketch map for the measurement of gully cross-section (wi, width; di, depth; CSA, cross-sectional area; Aj, area below the cross-section line).
Remotesensing 14 03529 g005
Figure 6. Linear relationships between gully morphological characteristics measured by RTK and UAV (n = 30).
Remotesensing 14 03529 g006
Figure 7. Gully morphological characteristics measured by UAV images and UAV-derived DEM (n = 910); the y axis shows the relatively frequency of the characteristics.
Remotesensing 14 03529 g007
Figure 8. Power relations between gully volume (V), and (a) gully length (L), (b) gully circumference (C), (c) gully plane area (PA), and (d) gully surface area (SA).
Remotesensing 14 03529 g008
Figure 9. Relationships between local slope (S) of gully head, and upslope drainage area (A) and its slope–drainage area thresholds for gully initiation. (a) S–A under all land-use types (n = 365), (b) S–A under shrubland (n = 262), (c) S–A under grassland (n = 83), and (d) S–A under cropland (n = 20).
Remotesensing 14 03529 g009
Table 1. Information related to UAV flight and image processing.
ItemsDetails
UAV flight date17–24 April 2021
Equipment, cameraDji Phantom 4 with RTK, DJI MAVIC2-ENTERPRISE-ADVANCED
Number of images12, 427
StripsWell-shaped
Height of flight100 m
Rate of overlap, side lap80%, 70%
GSD33.31 mm/pixel
GCPS10 points with “L” shape
Tie points3,102,343
RMSE in XY of GCPS (horizontal)0.023 m
RMSE in Z of GCPS (vertical)0.031 m
RMSE in reprojection0.89 pixels
Resolution of DEM and DOM0.053 m
RMSE in XY of check points in DOM0.18 m
RMSE in Z of check points in DEM0.27 m
Note: GSD, ground sample distance; GCP, ground control points; RMSE, root-mean-square error; DEM, digital elevation map; DOM, digital orthophoto map.
Table 2. Errors of gully morphological characteristics measured by RTK and UAV (MAE, mean absolute error; MSE, mean squared error; RMSE, root-mean-square error; NSE, Nash–Sutcliffe efficiency coefficient; MAPE, mean absolute percentage error).
MAEMSERMSENSEMAPE (%)
L (m)0.0020.0140.0030.9992.534
C (m)0.0189.2780.0210.9967.837
PA (m2)0.00822.1340.0080.9998.572
SA (m2)0.011146.0920.0130.9998.963
V (m3)0.04071.5520.0470.99515.894
D (m)0.0530.1290.0700.95813.867
TW (m)0.0310.3040.0380.9719.152
MW (m)0.0460.2890.0550.96311.435
CSA (m2)0.0385.4490.0400.74011.376
TW/D0.0930.1290.1210.86218.095
Note: L, gully length (m); C, gully circumference (m); PA, gully plane area (m2); SA, gully surface area (m2); V, gully volume V (m3); D, gully depth (m); TW, gully top width (m); MW, gully mean width (m); CSA, gully cross-sectional area (m2); TW/D, gully top width/depth.
Table 3. Pearson’s correlation coefficients between different gully morphological parameters (n = 910).
L (m)C (m)PA (m2)SA (m2)V (m3)D (m)TW (m)MW (m)CSA (m2)TW/D
L (m)1
C (m)0.963 **1
PA (m2)0.890 **0.900 **1
SA (m2)0.884 **0.896 **0.990 **1
V (m3)0.872 **0.886 **0.972 **0.995 **1
D (m)0.321 **0.319 **0.417 **0.470 **0.499 **1
TW (m)0.565 **0.585 **0.698 **0.706 **0.708 **0.587 **1
MW (m)0.427 **0.458 **0.554 **0.560 **0.563 **0.568 **0.849 **1
CSA (m2)0.471 **0.481 **0.639 **0.680 **0.701 **0.760 **0.828 **0.715 **1
TW/D0.0640.0820.0440.0260.0150.909 **0.851 **0.223 *0.1181
Note: L, gully length (m); C, gully circumference (m); PA, gully plane area (m2); SA, gully surface area (m2); V, gully volume V (m3); D, gully depth (m); TW, gully top width (m); MW, gully mean width (m); CSA, gully cross-sectional area (m2); TW/D, gully top width/depth. * p < 0.05; ** p < 0.01.
Table 4. The top width–depth ratios in different regions across the world.
StudiesMax
TW/D
Min
TW/D
Mean
TW/D
Median
TW/D
Soil Texture
Addisie et al., 20164.60.92.32.3Sandy loam
Frankl et al., 20123.71.42.52.7Sandy loam
Li et al., 20177.70.72.22.3Sandy loam
Wu et al., 20184.10.72.22.3Sandy loam
Yibeltal et al., 20196.91.43.53.1Clay
This study16.90.64.64.8Loam
Note: TW/D, top width–depth ratio; Max, maximum; Min, minimum.
Publisher’s Note: MDPI stays neutral with regard to jurisdictional claims in published maps and institutional affiliations.

