
Impact of Climate Change on the Glacier and Runoff of a Glacierized Basin in Harlik Mountain, Eastern Tianshan Mountains

Abstract
:1. Introduction
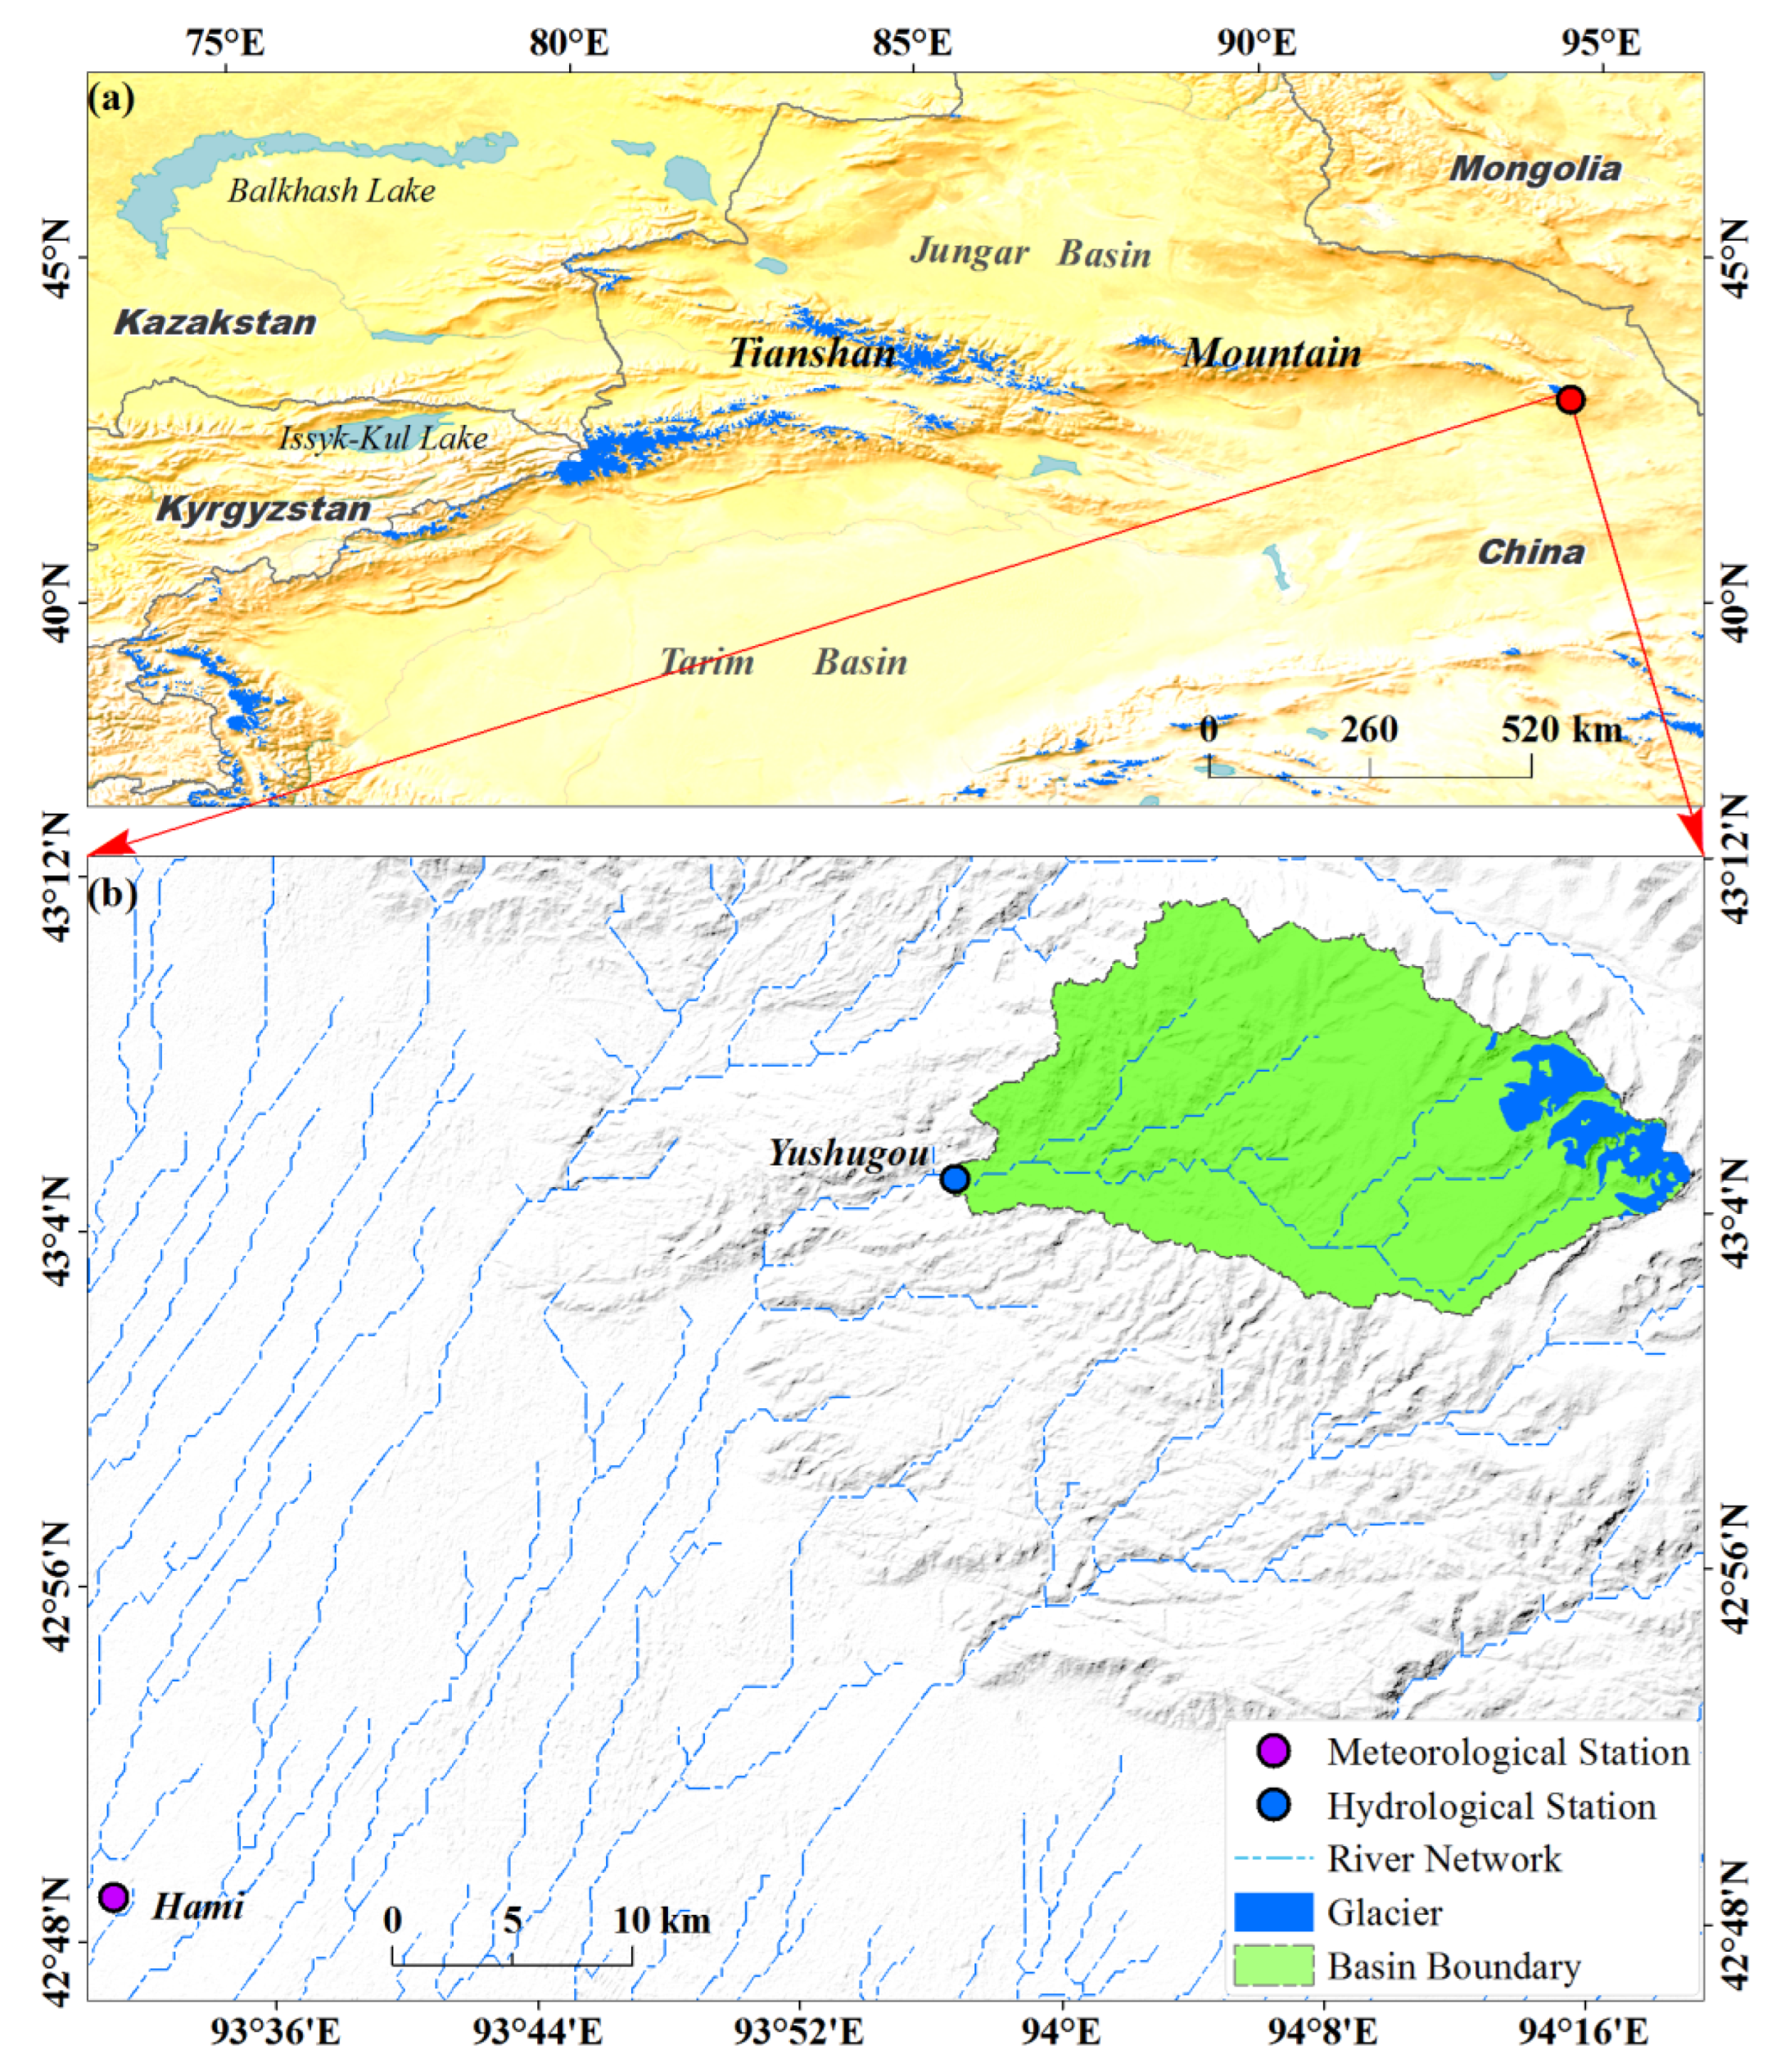
2. Study Area
3. Data and Method
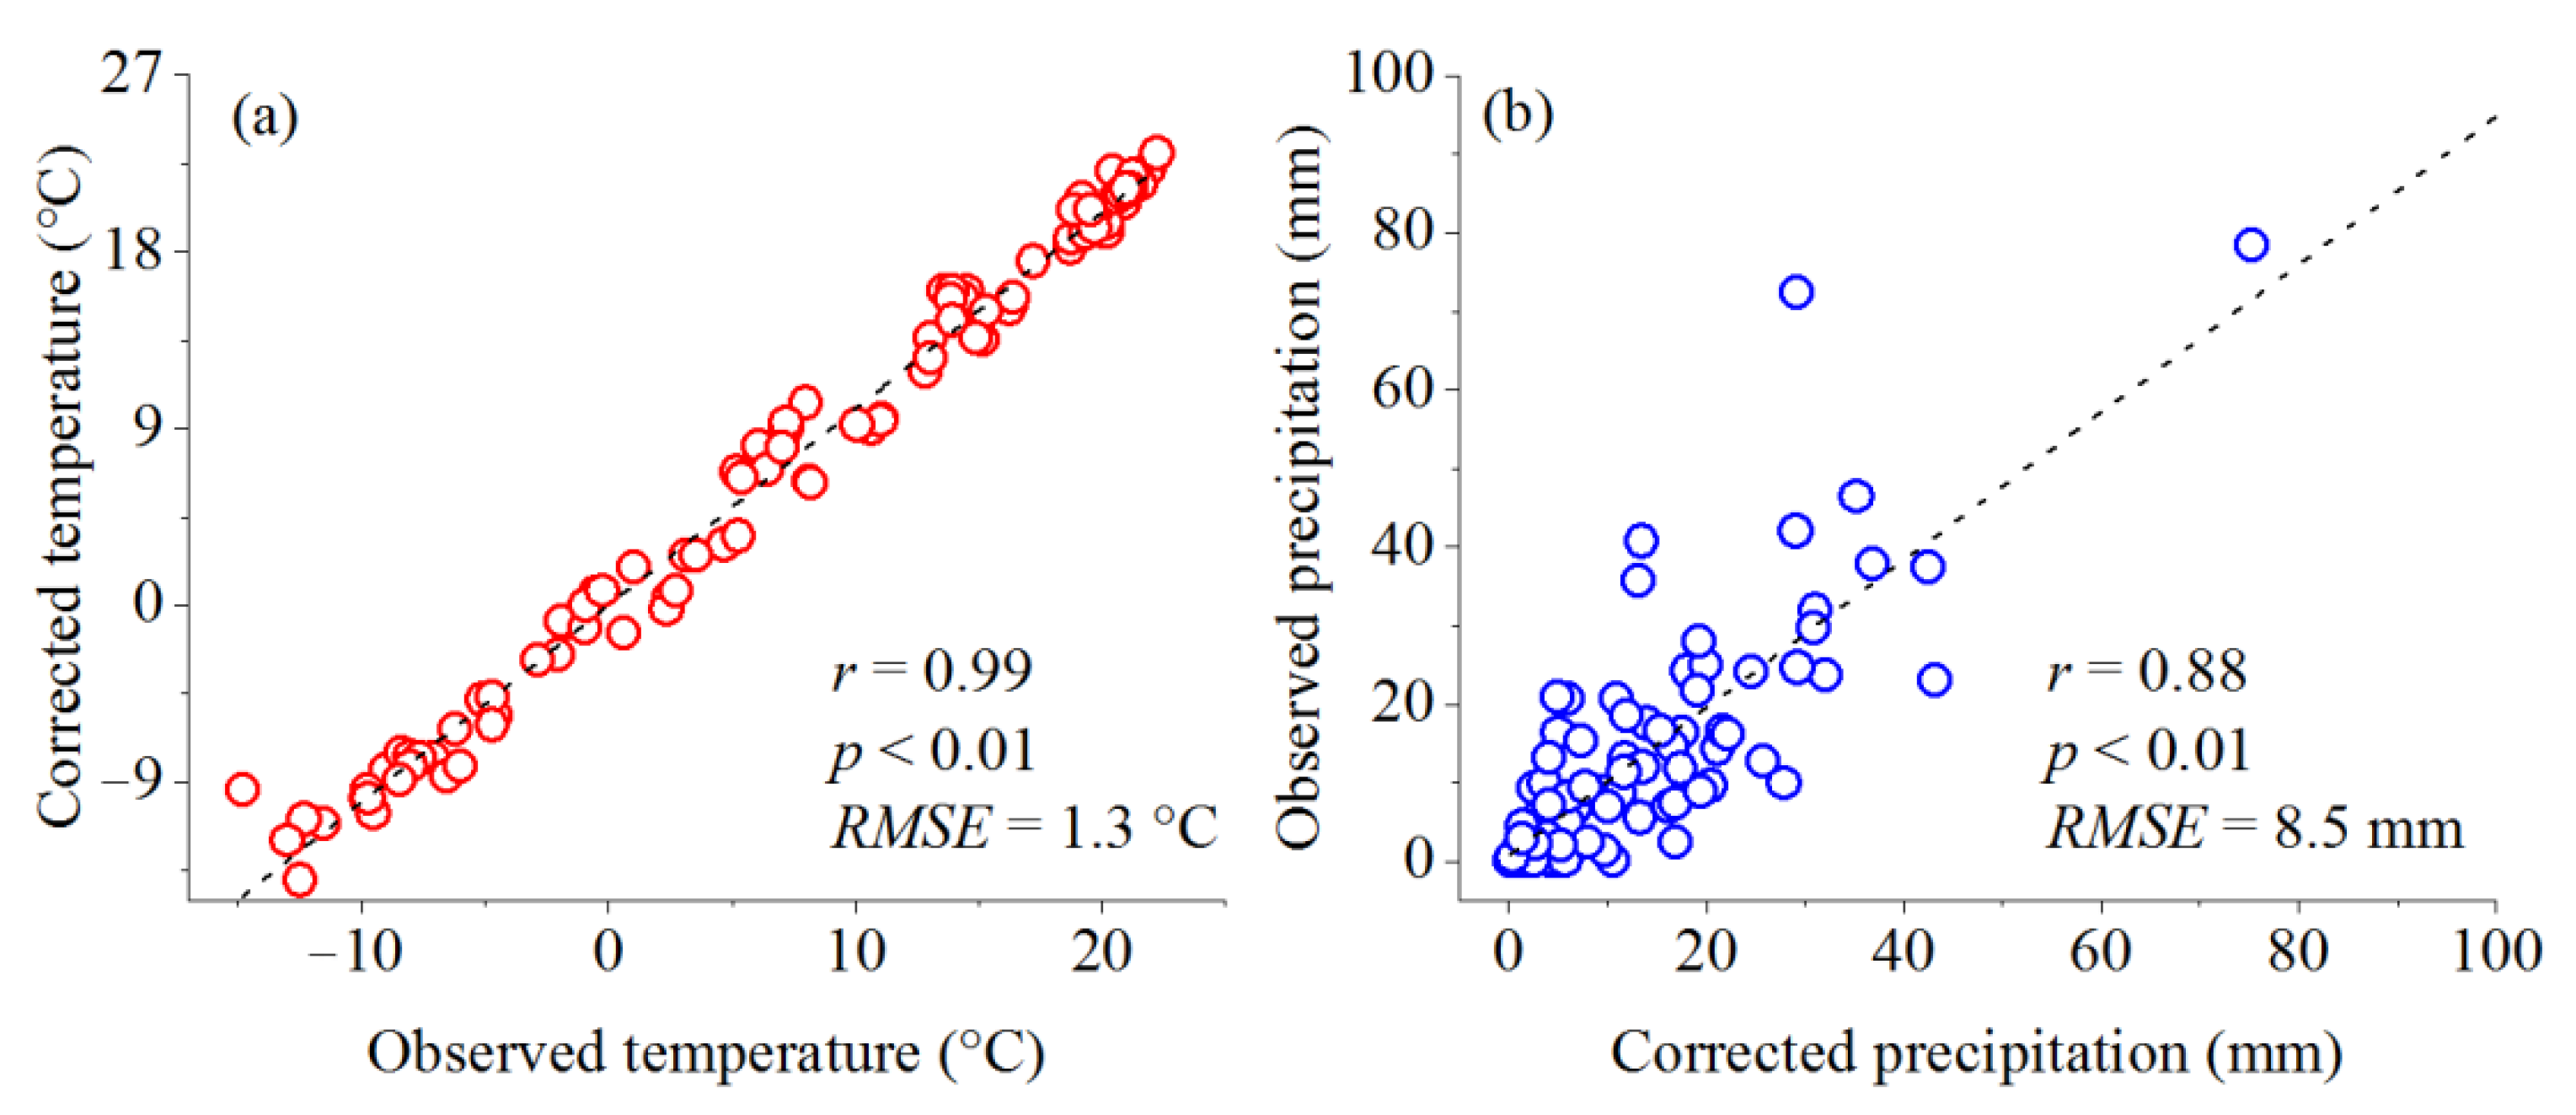
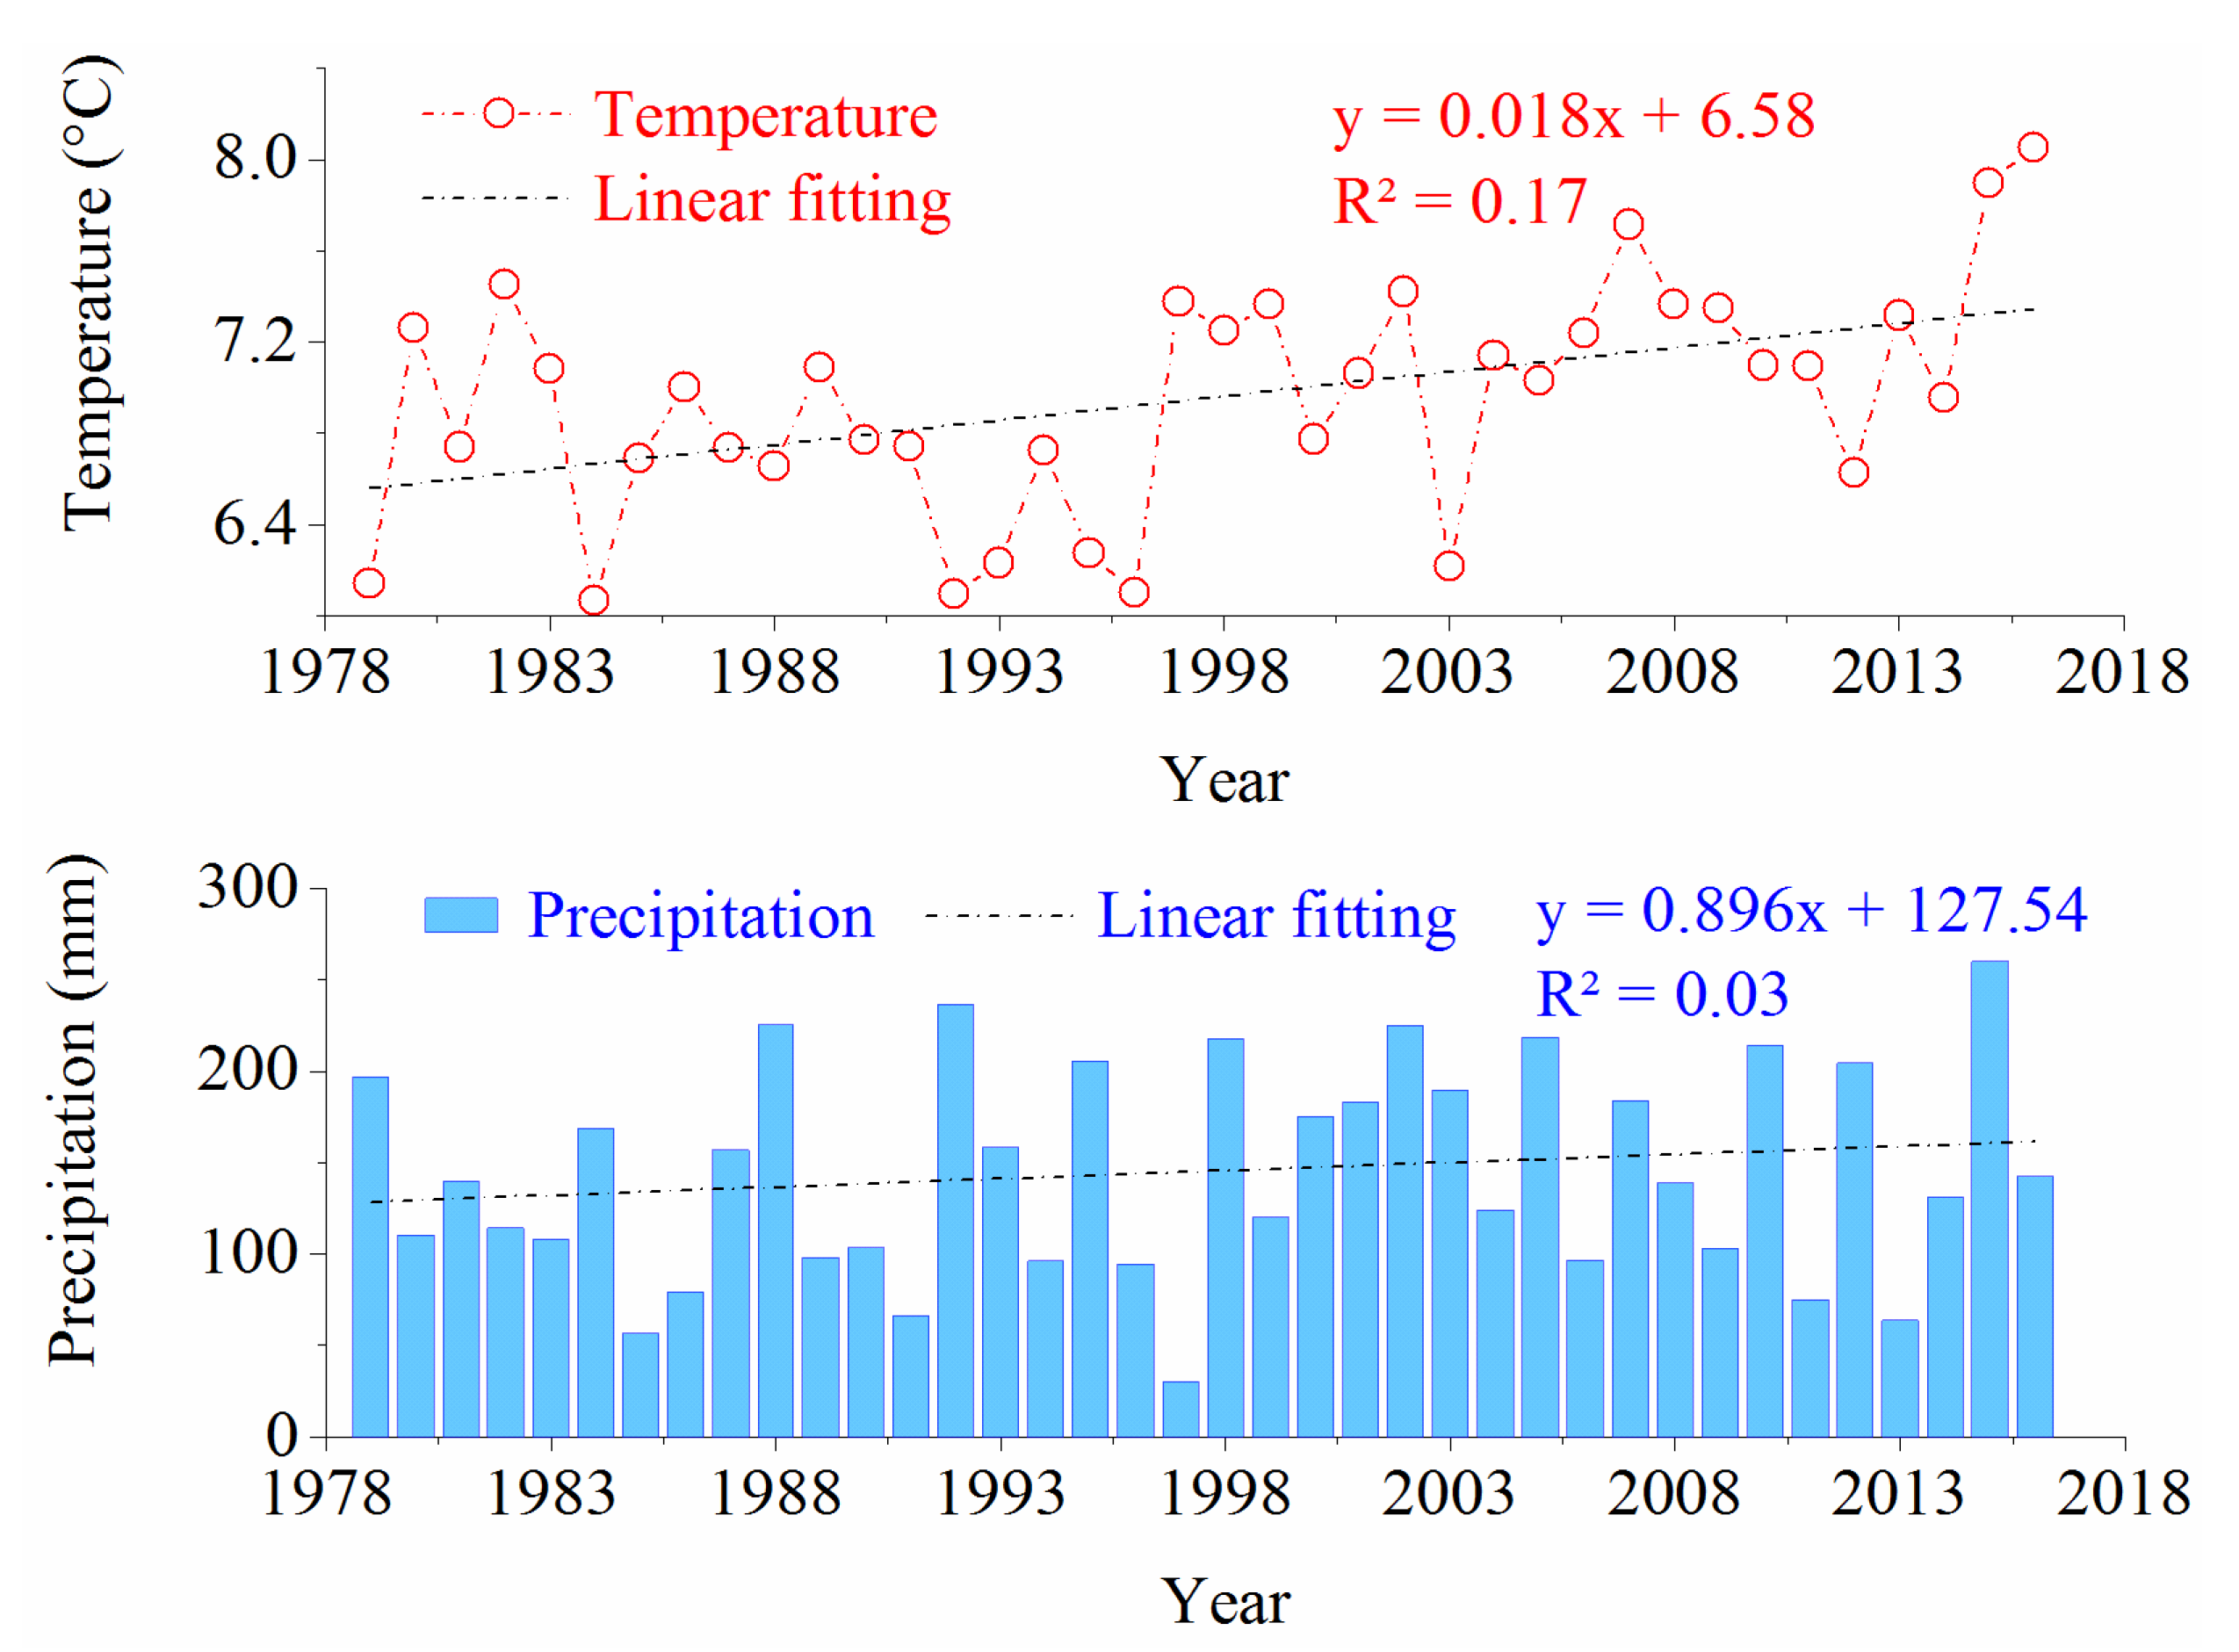
3.1. Data
3.2. Methods
4. Results
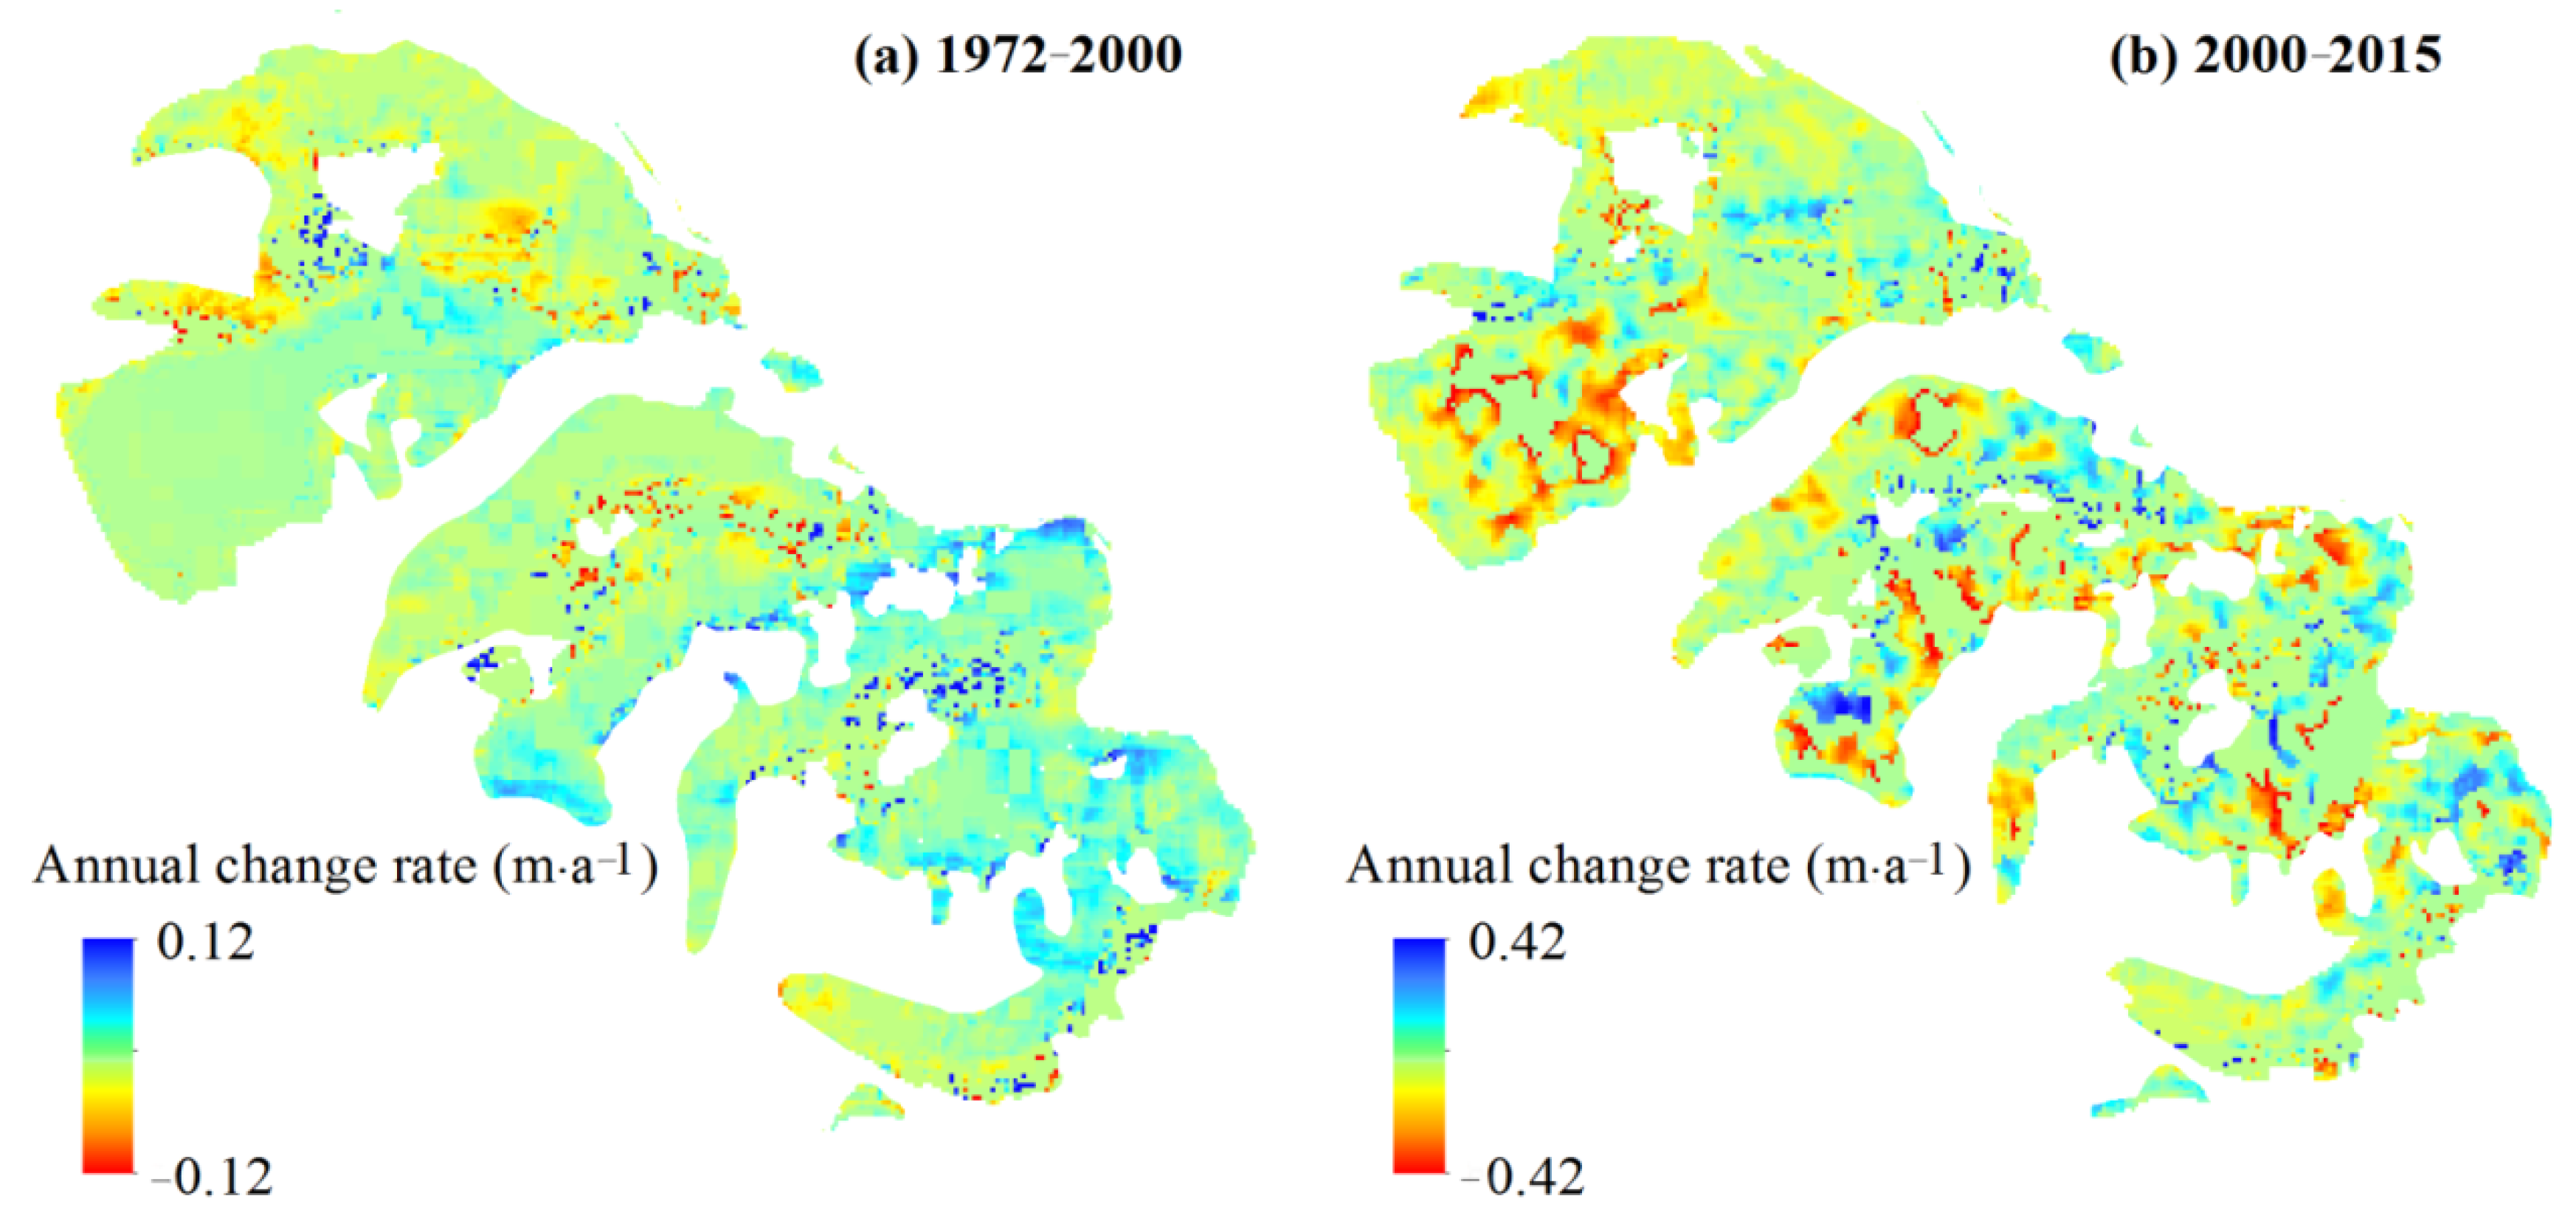
4.1. Glacier Area and Surface Elevation Change
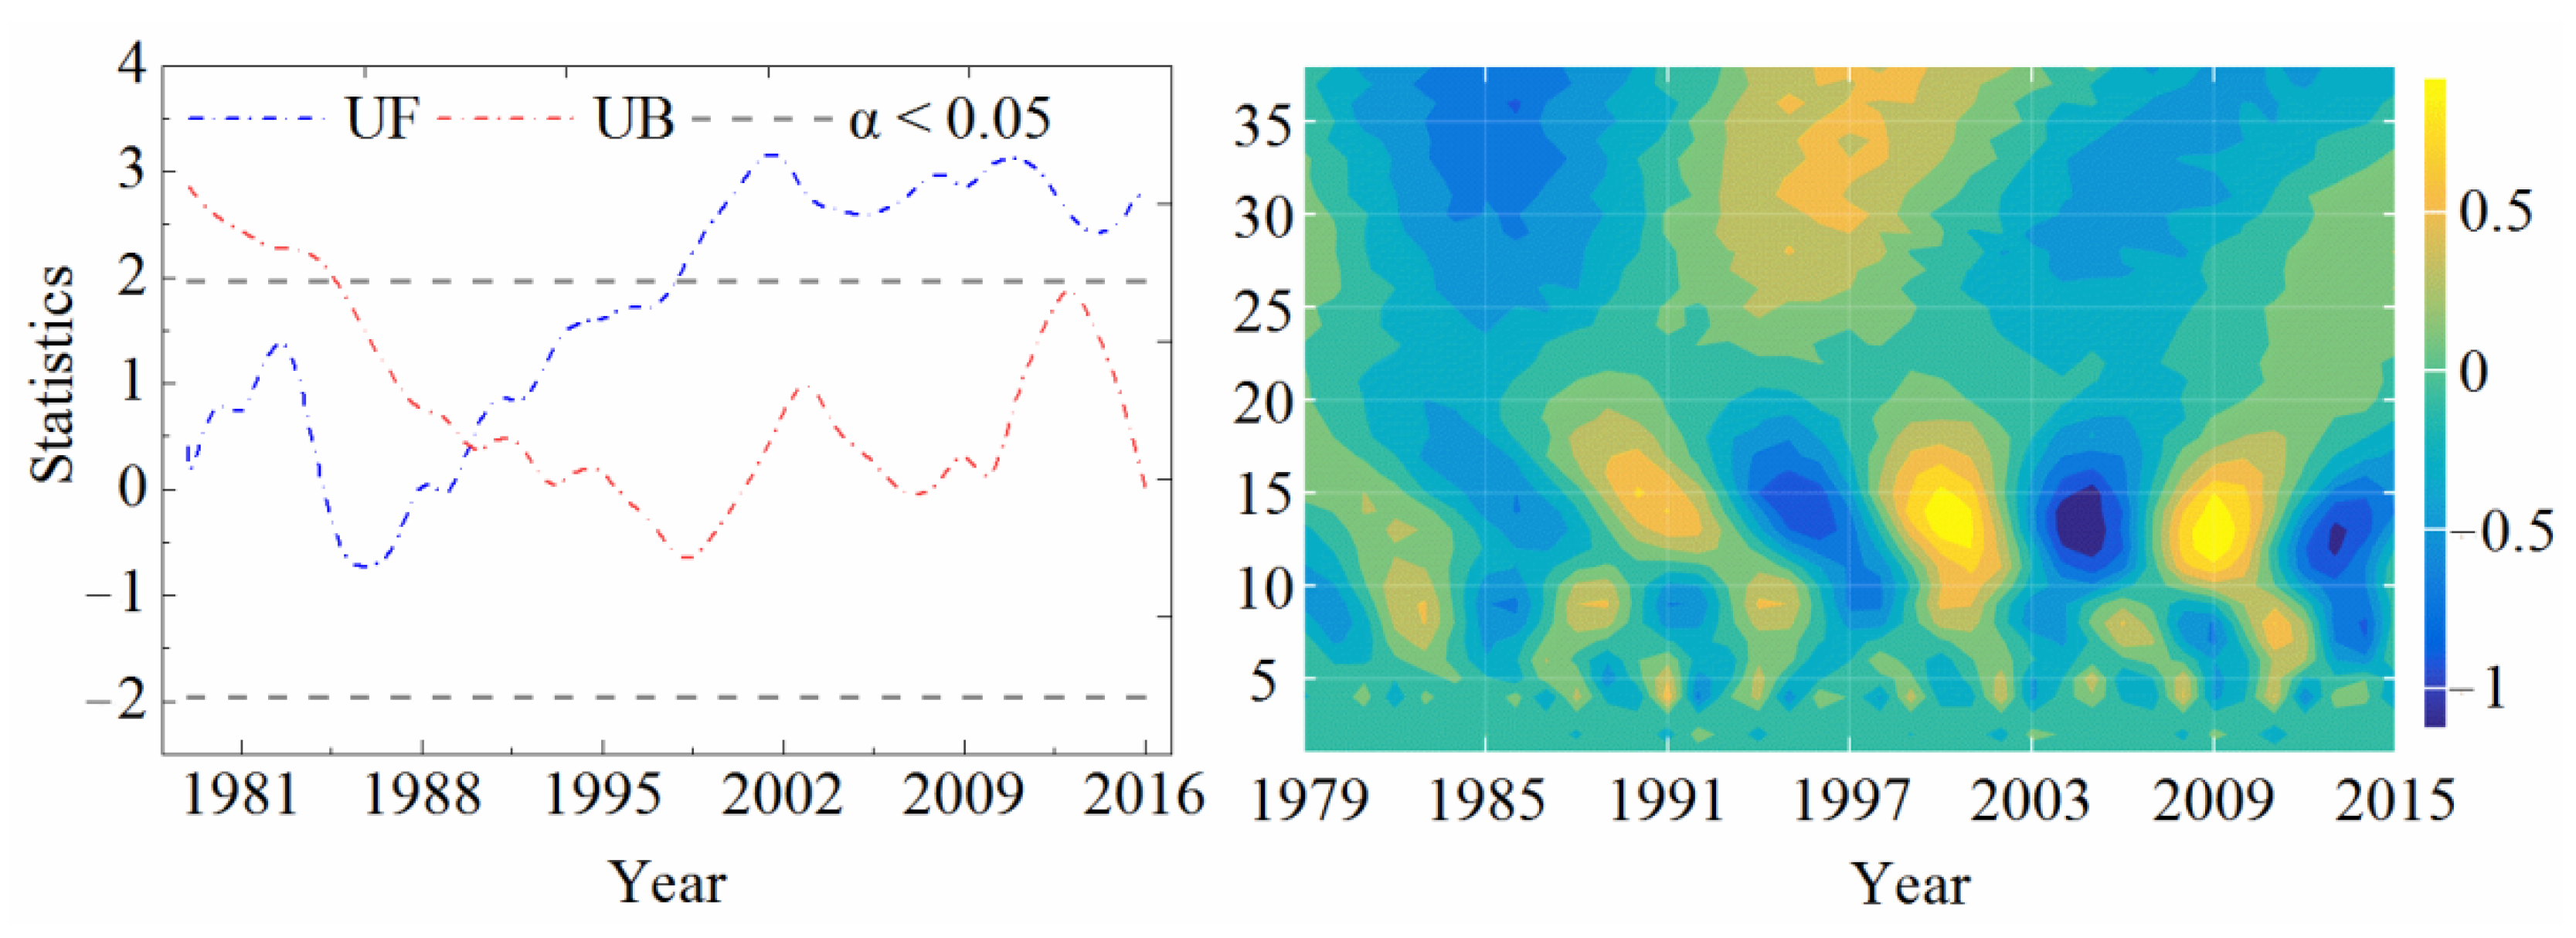
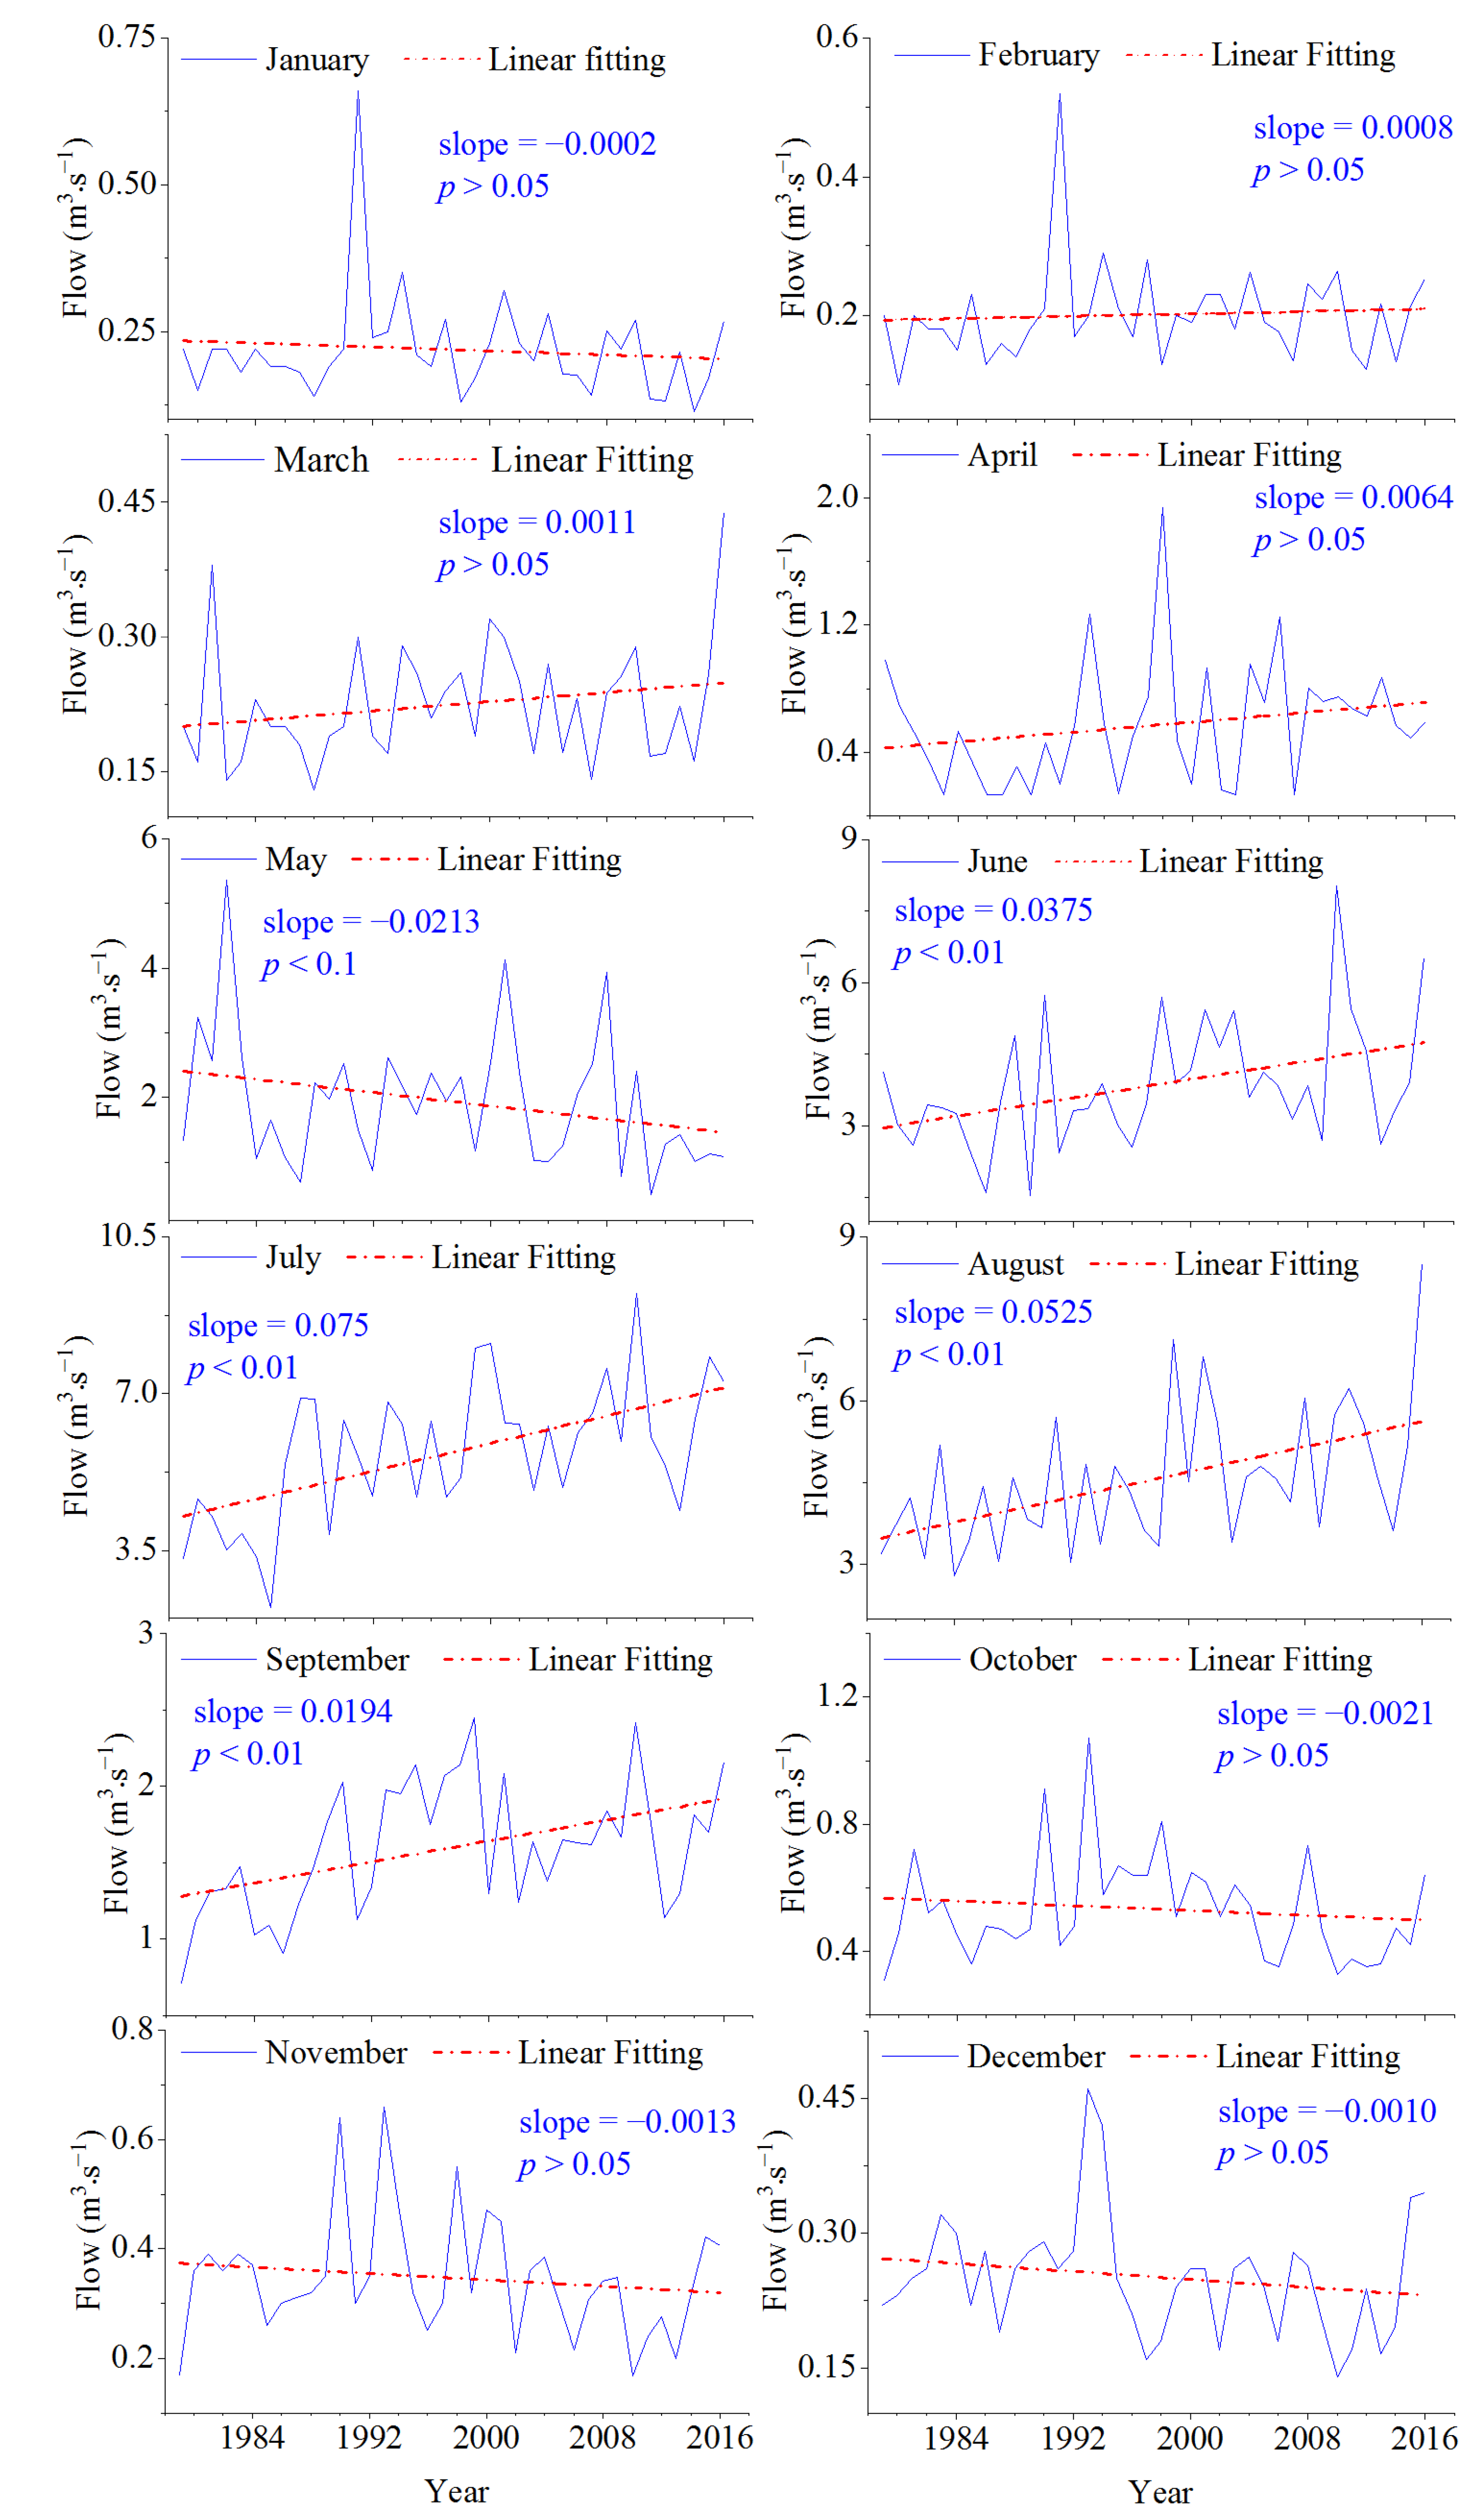
4.2. Variation of Annual Runoff and Monthly Runoff
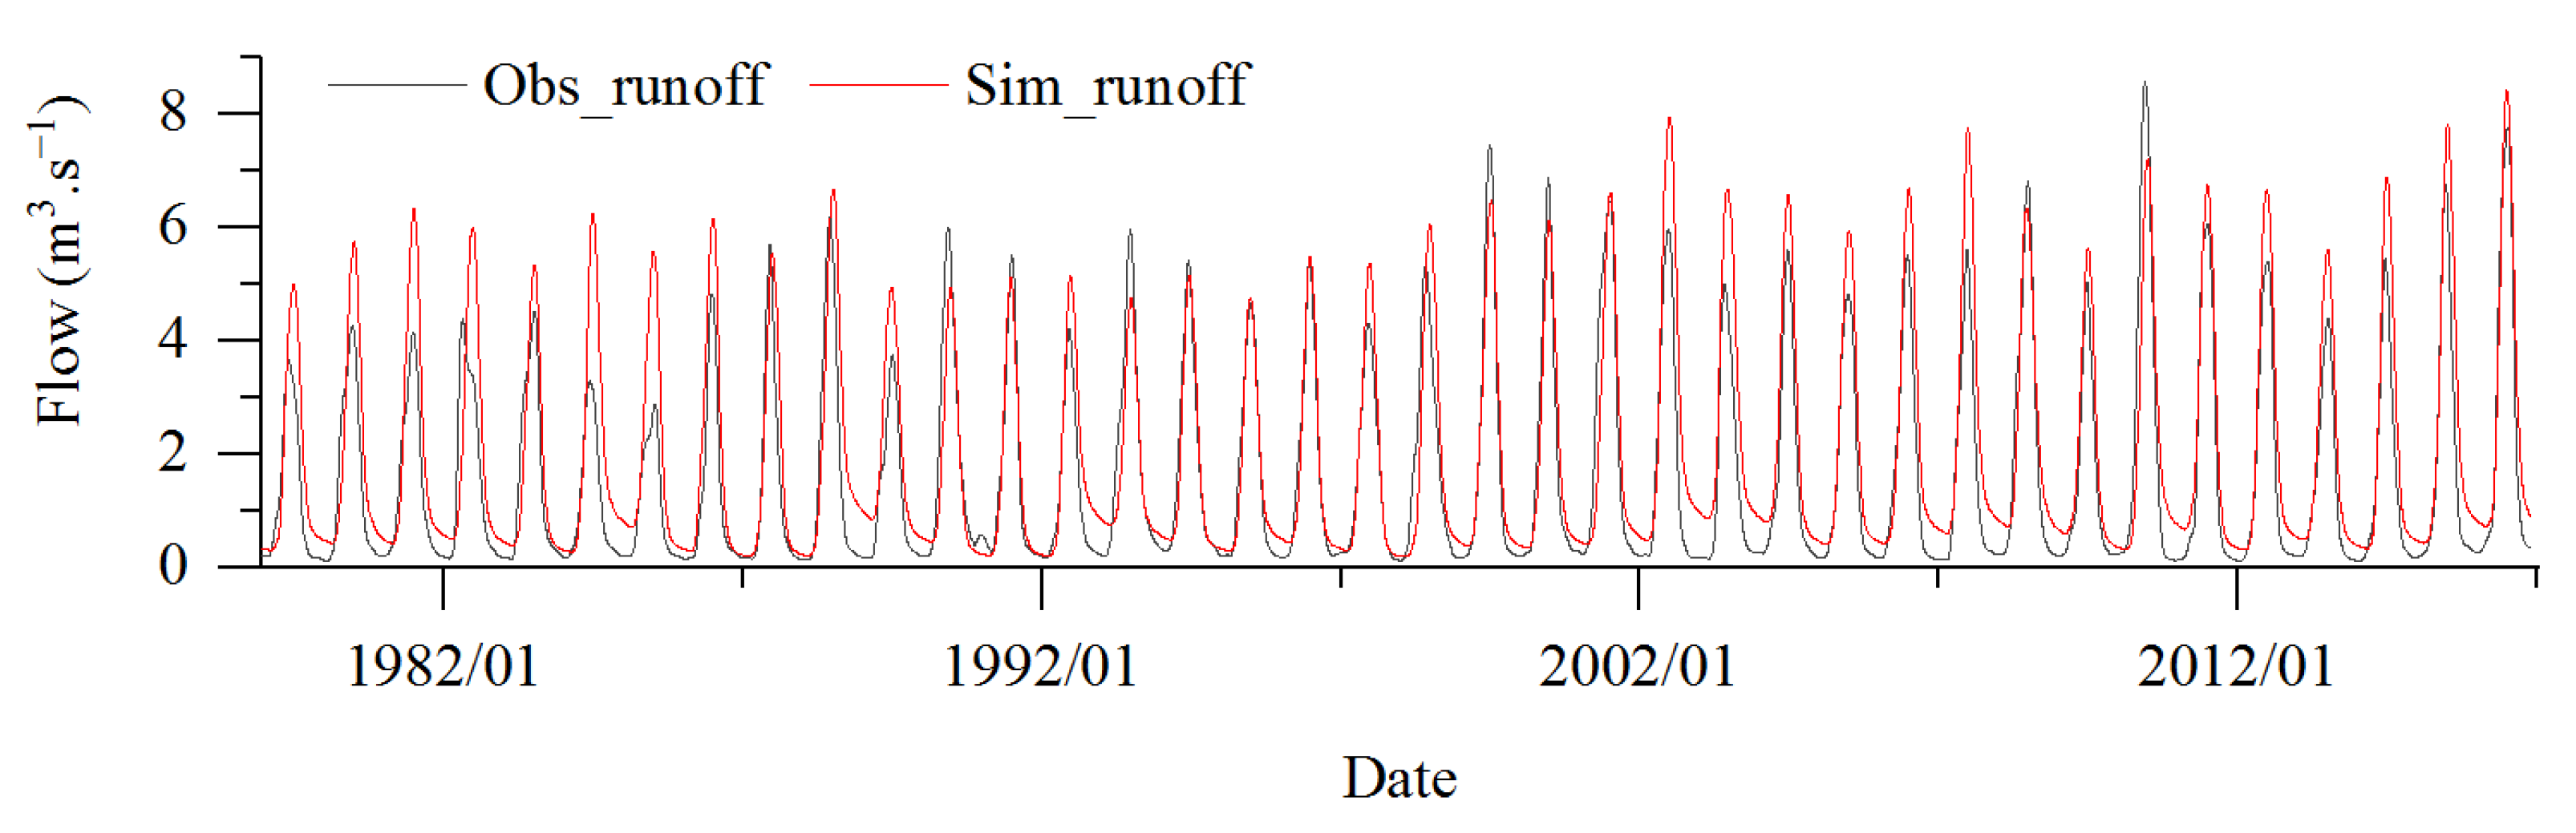
4.3. Performance Evaluation of the Hydrological Model
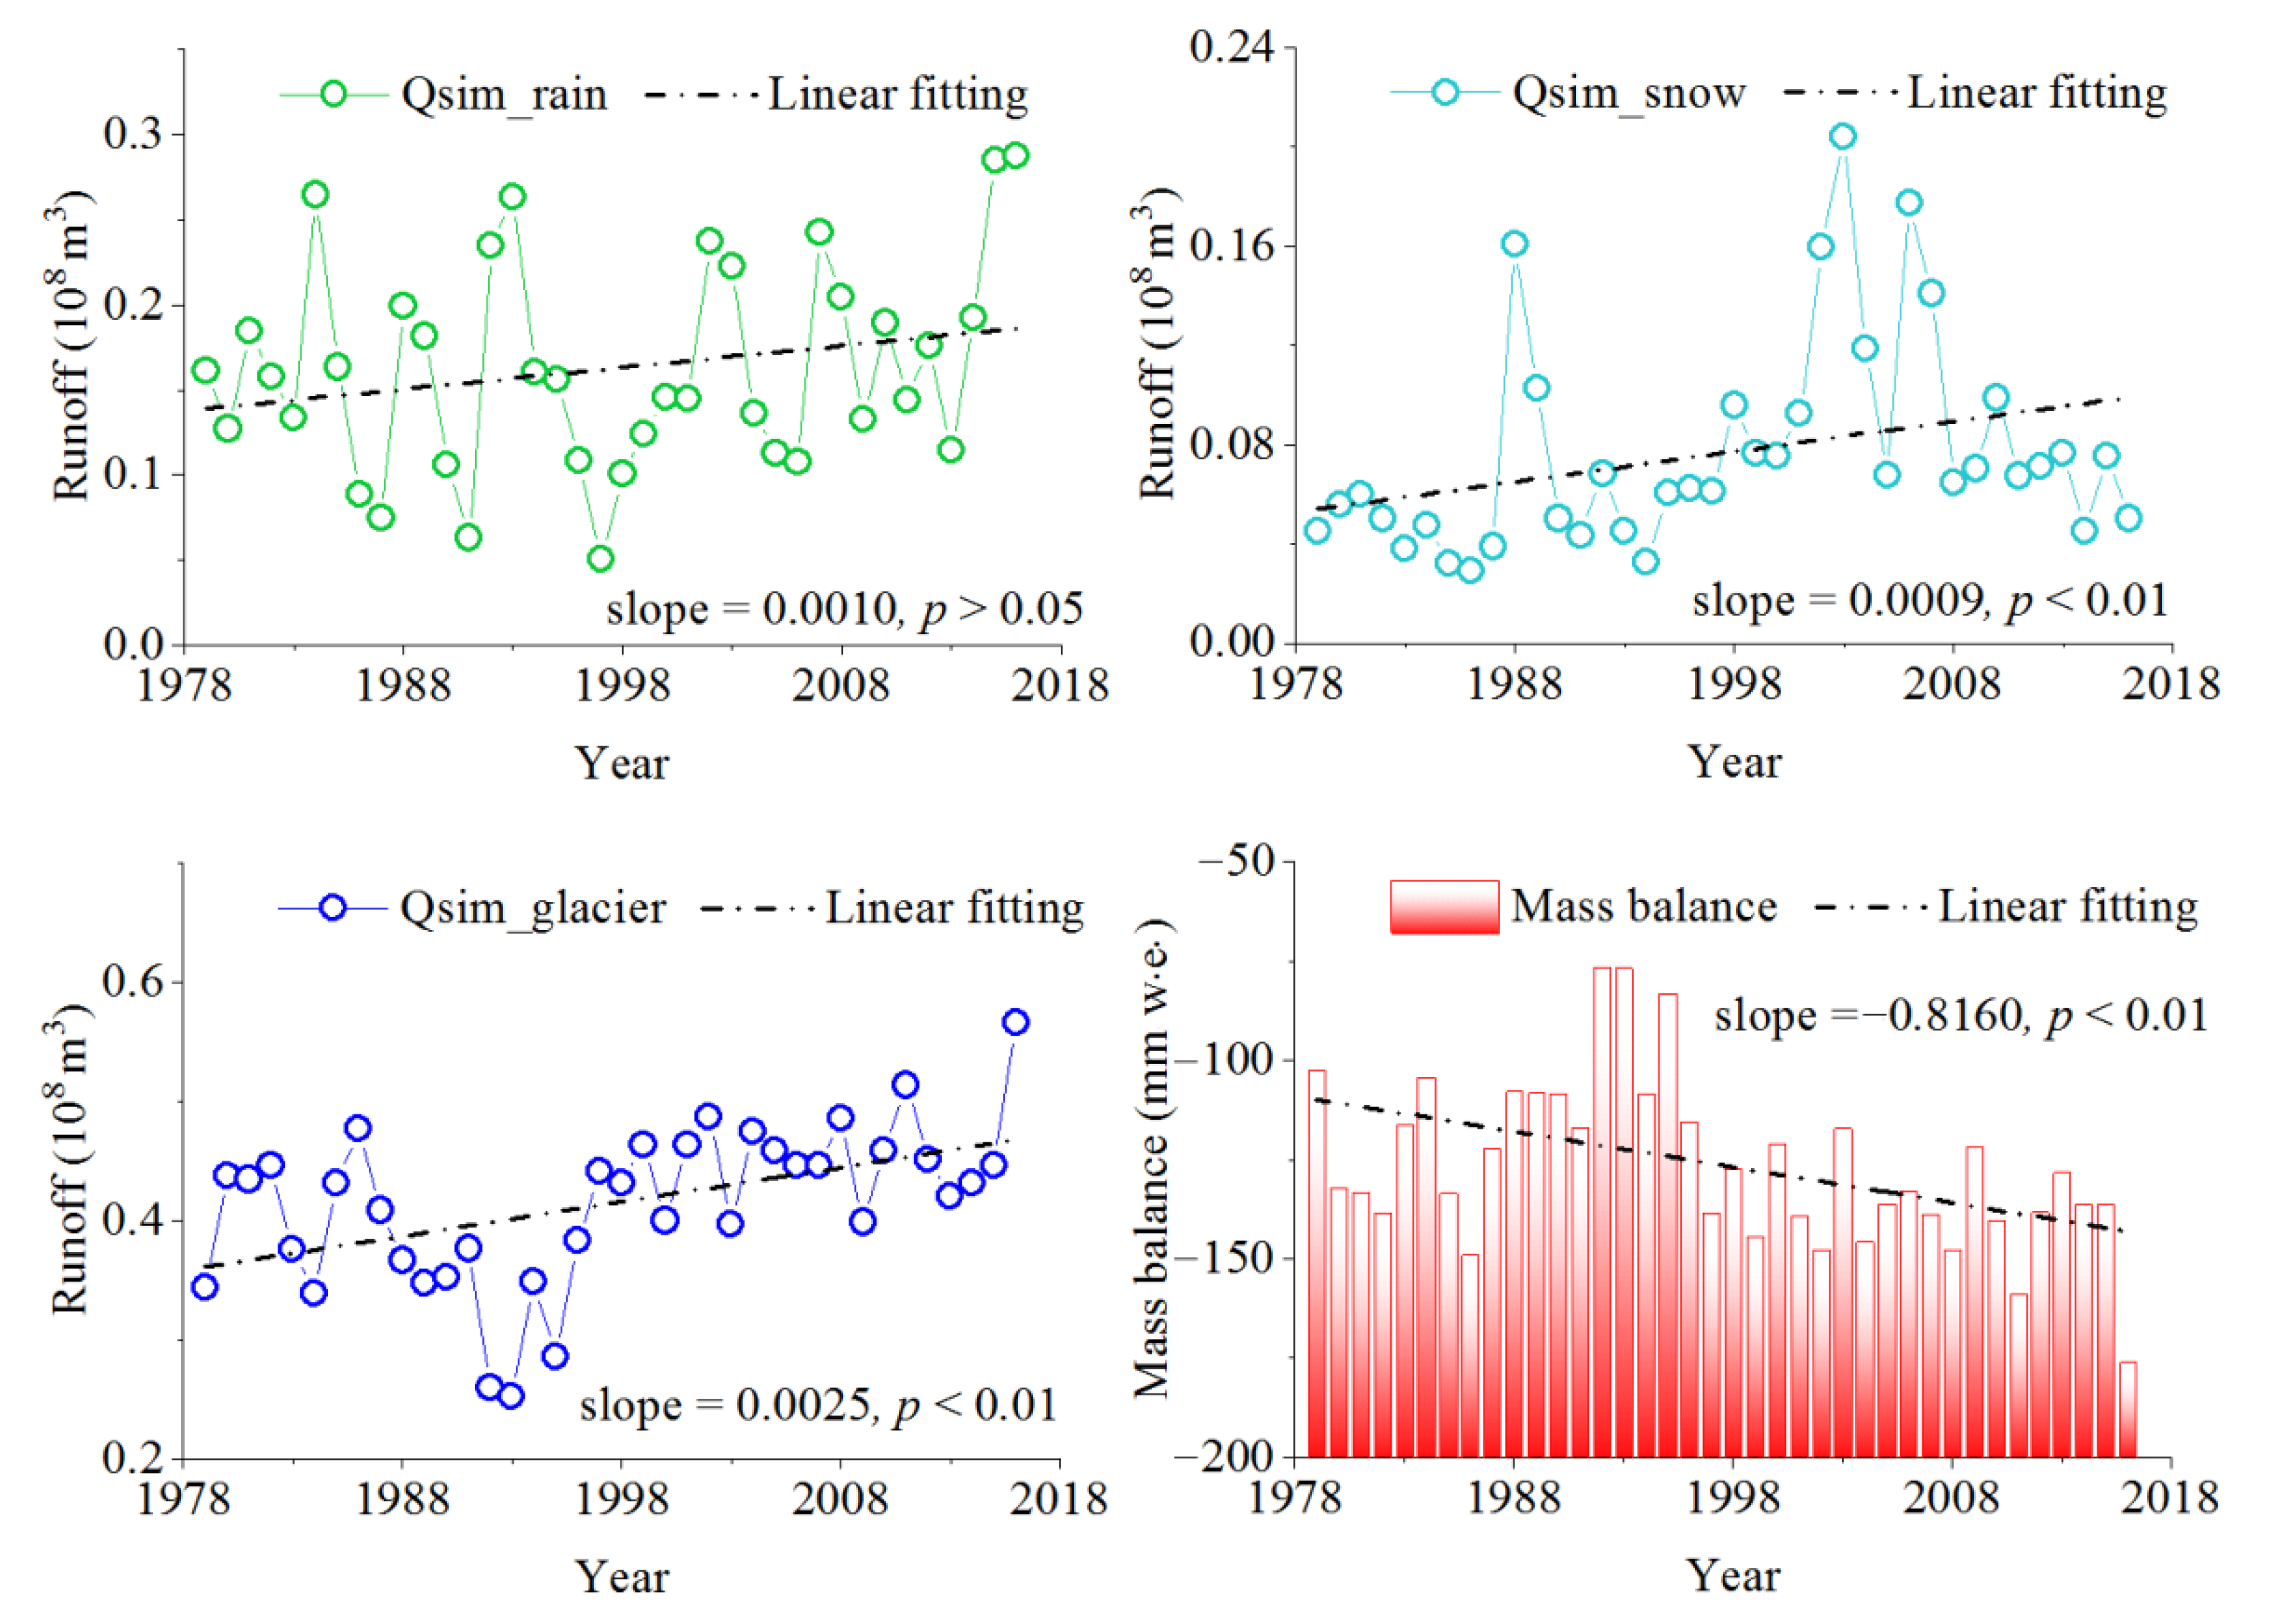
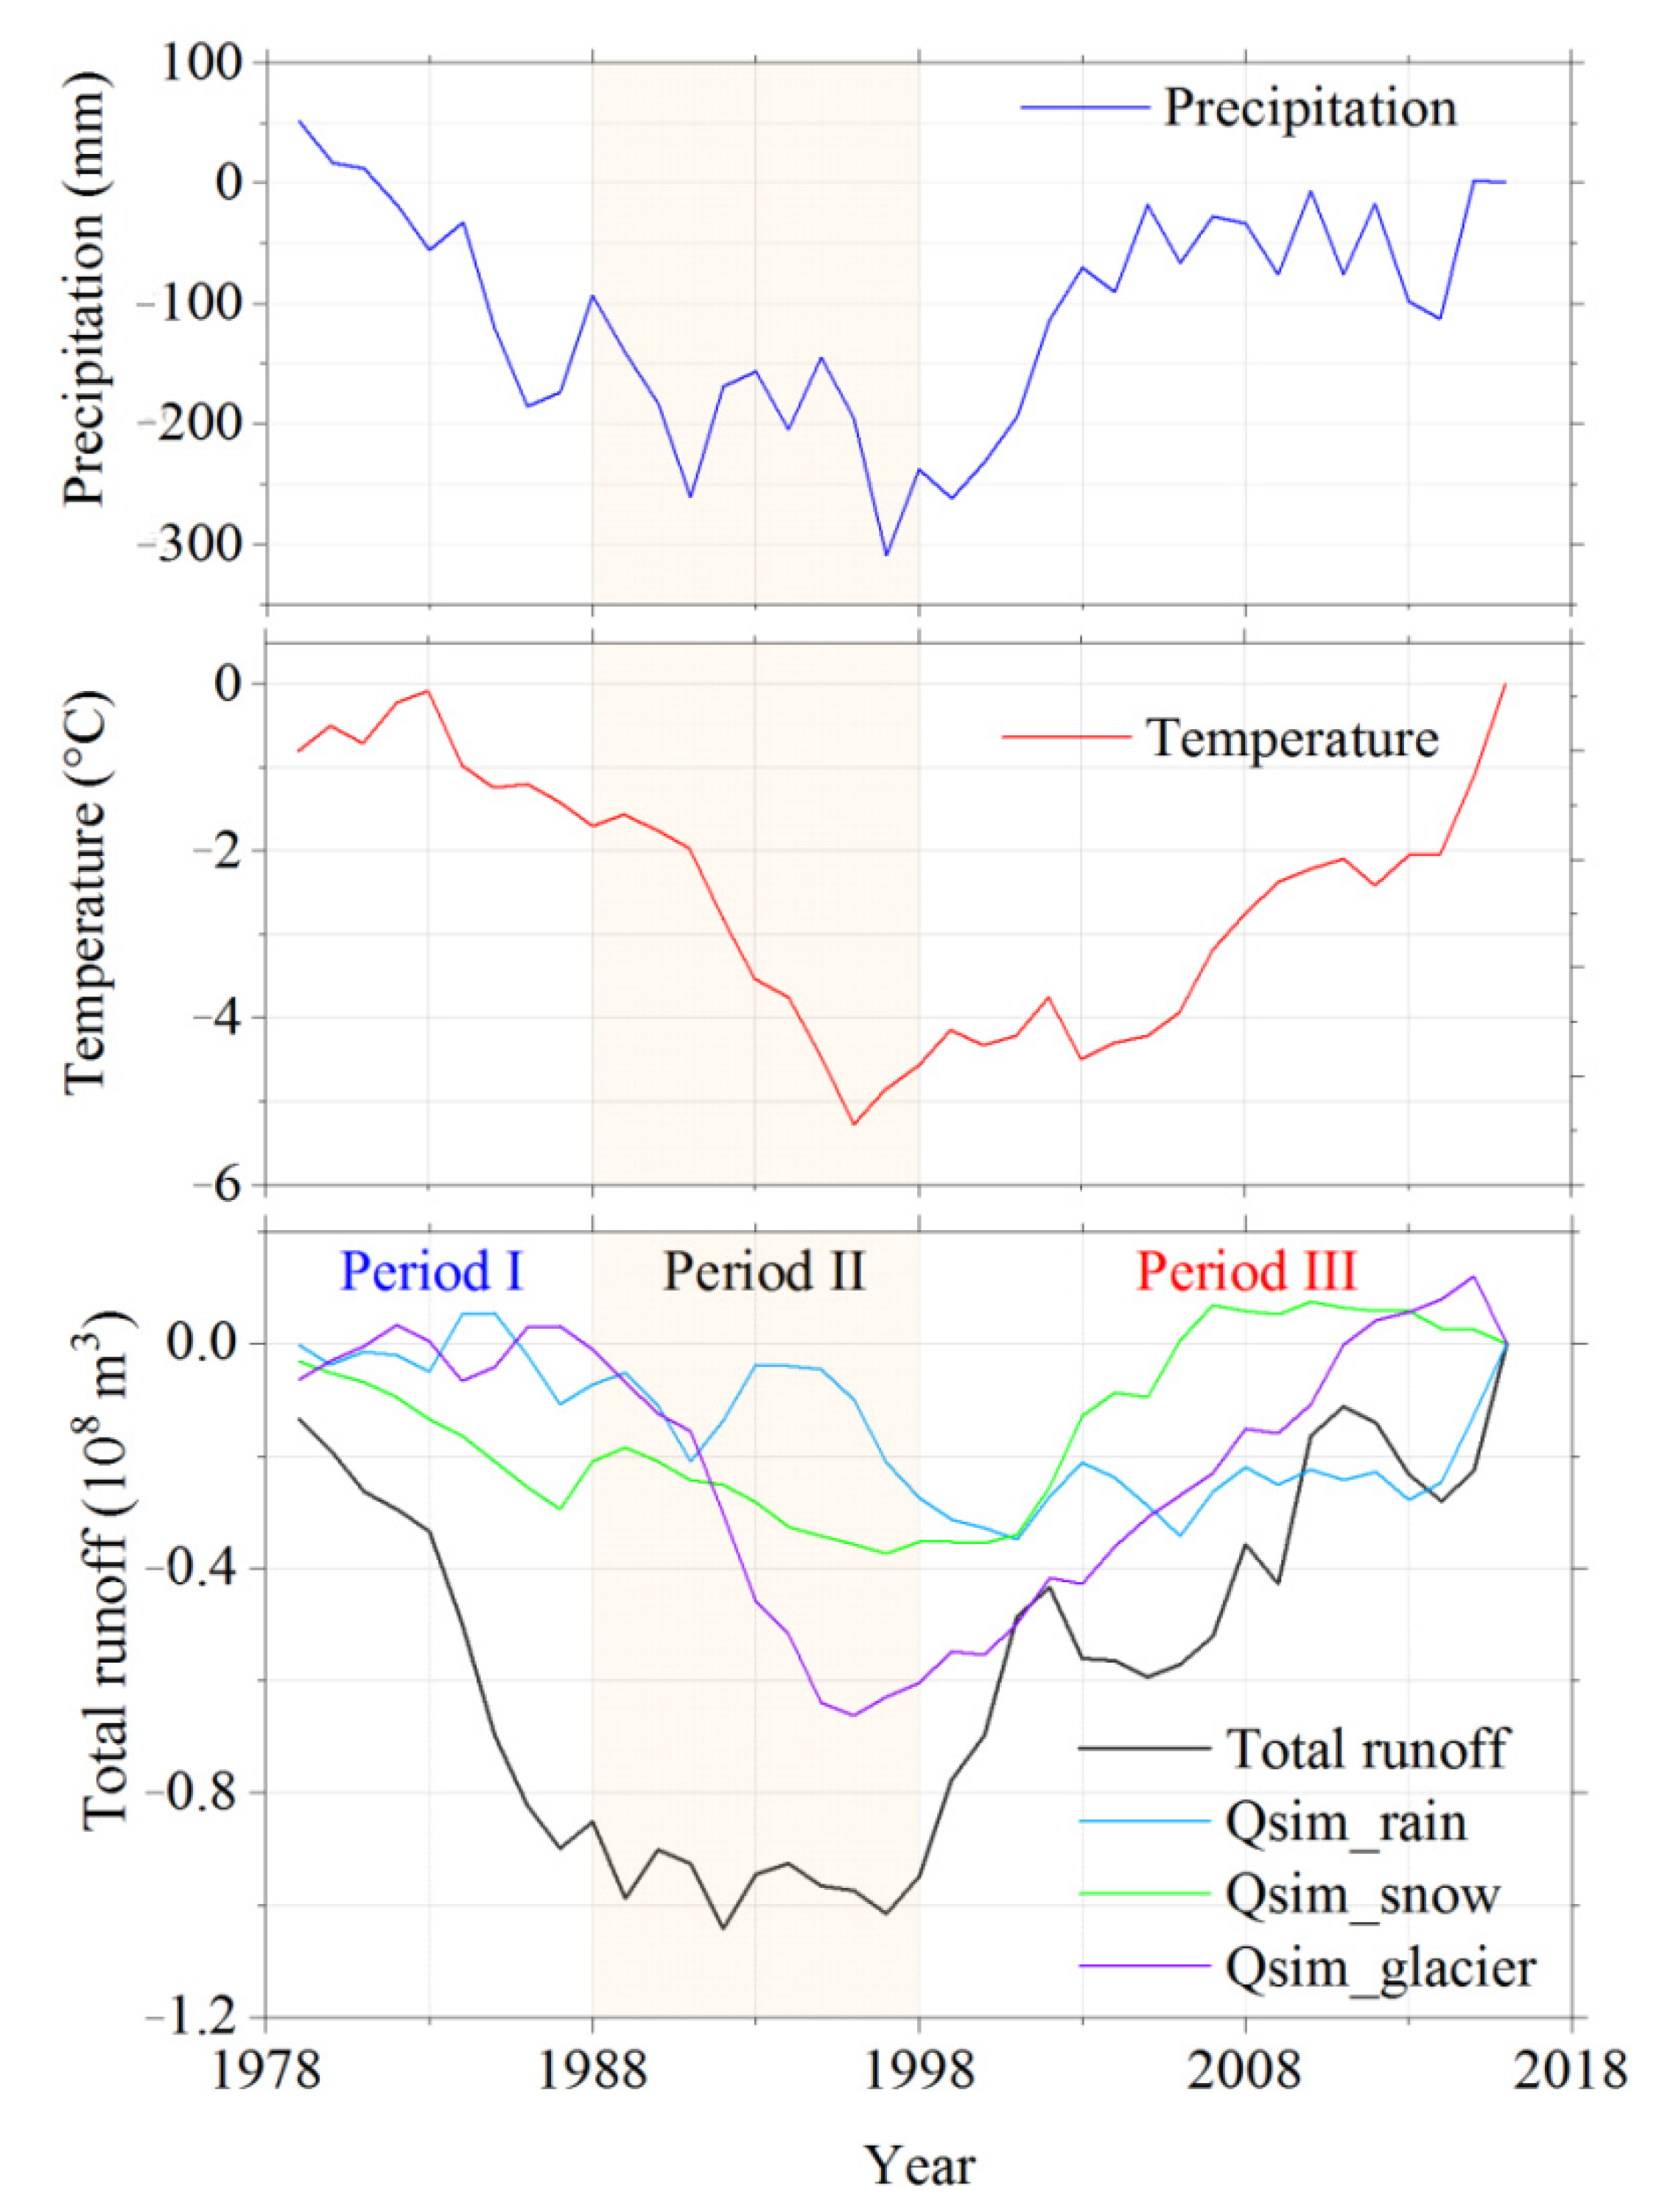
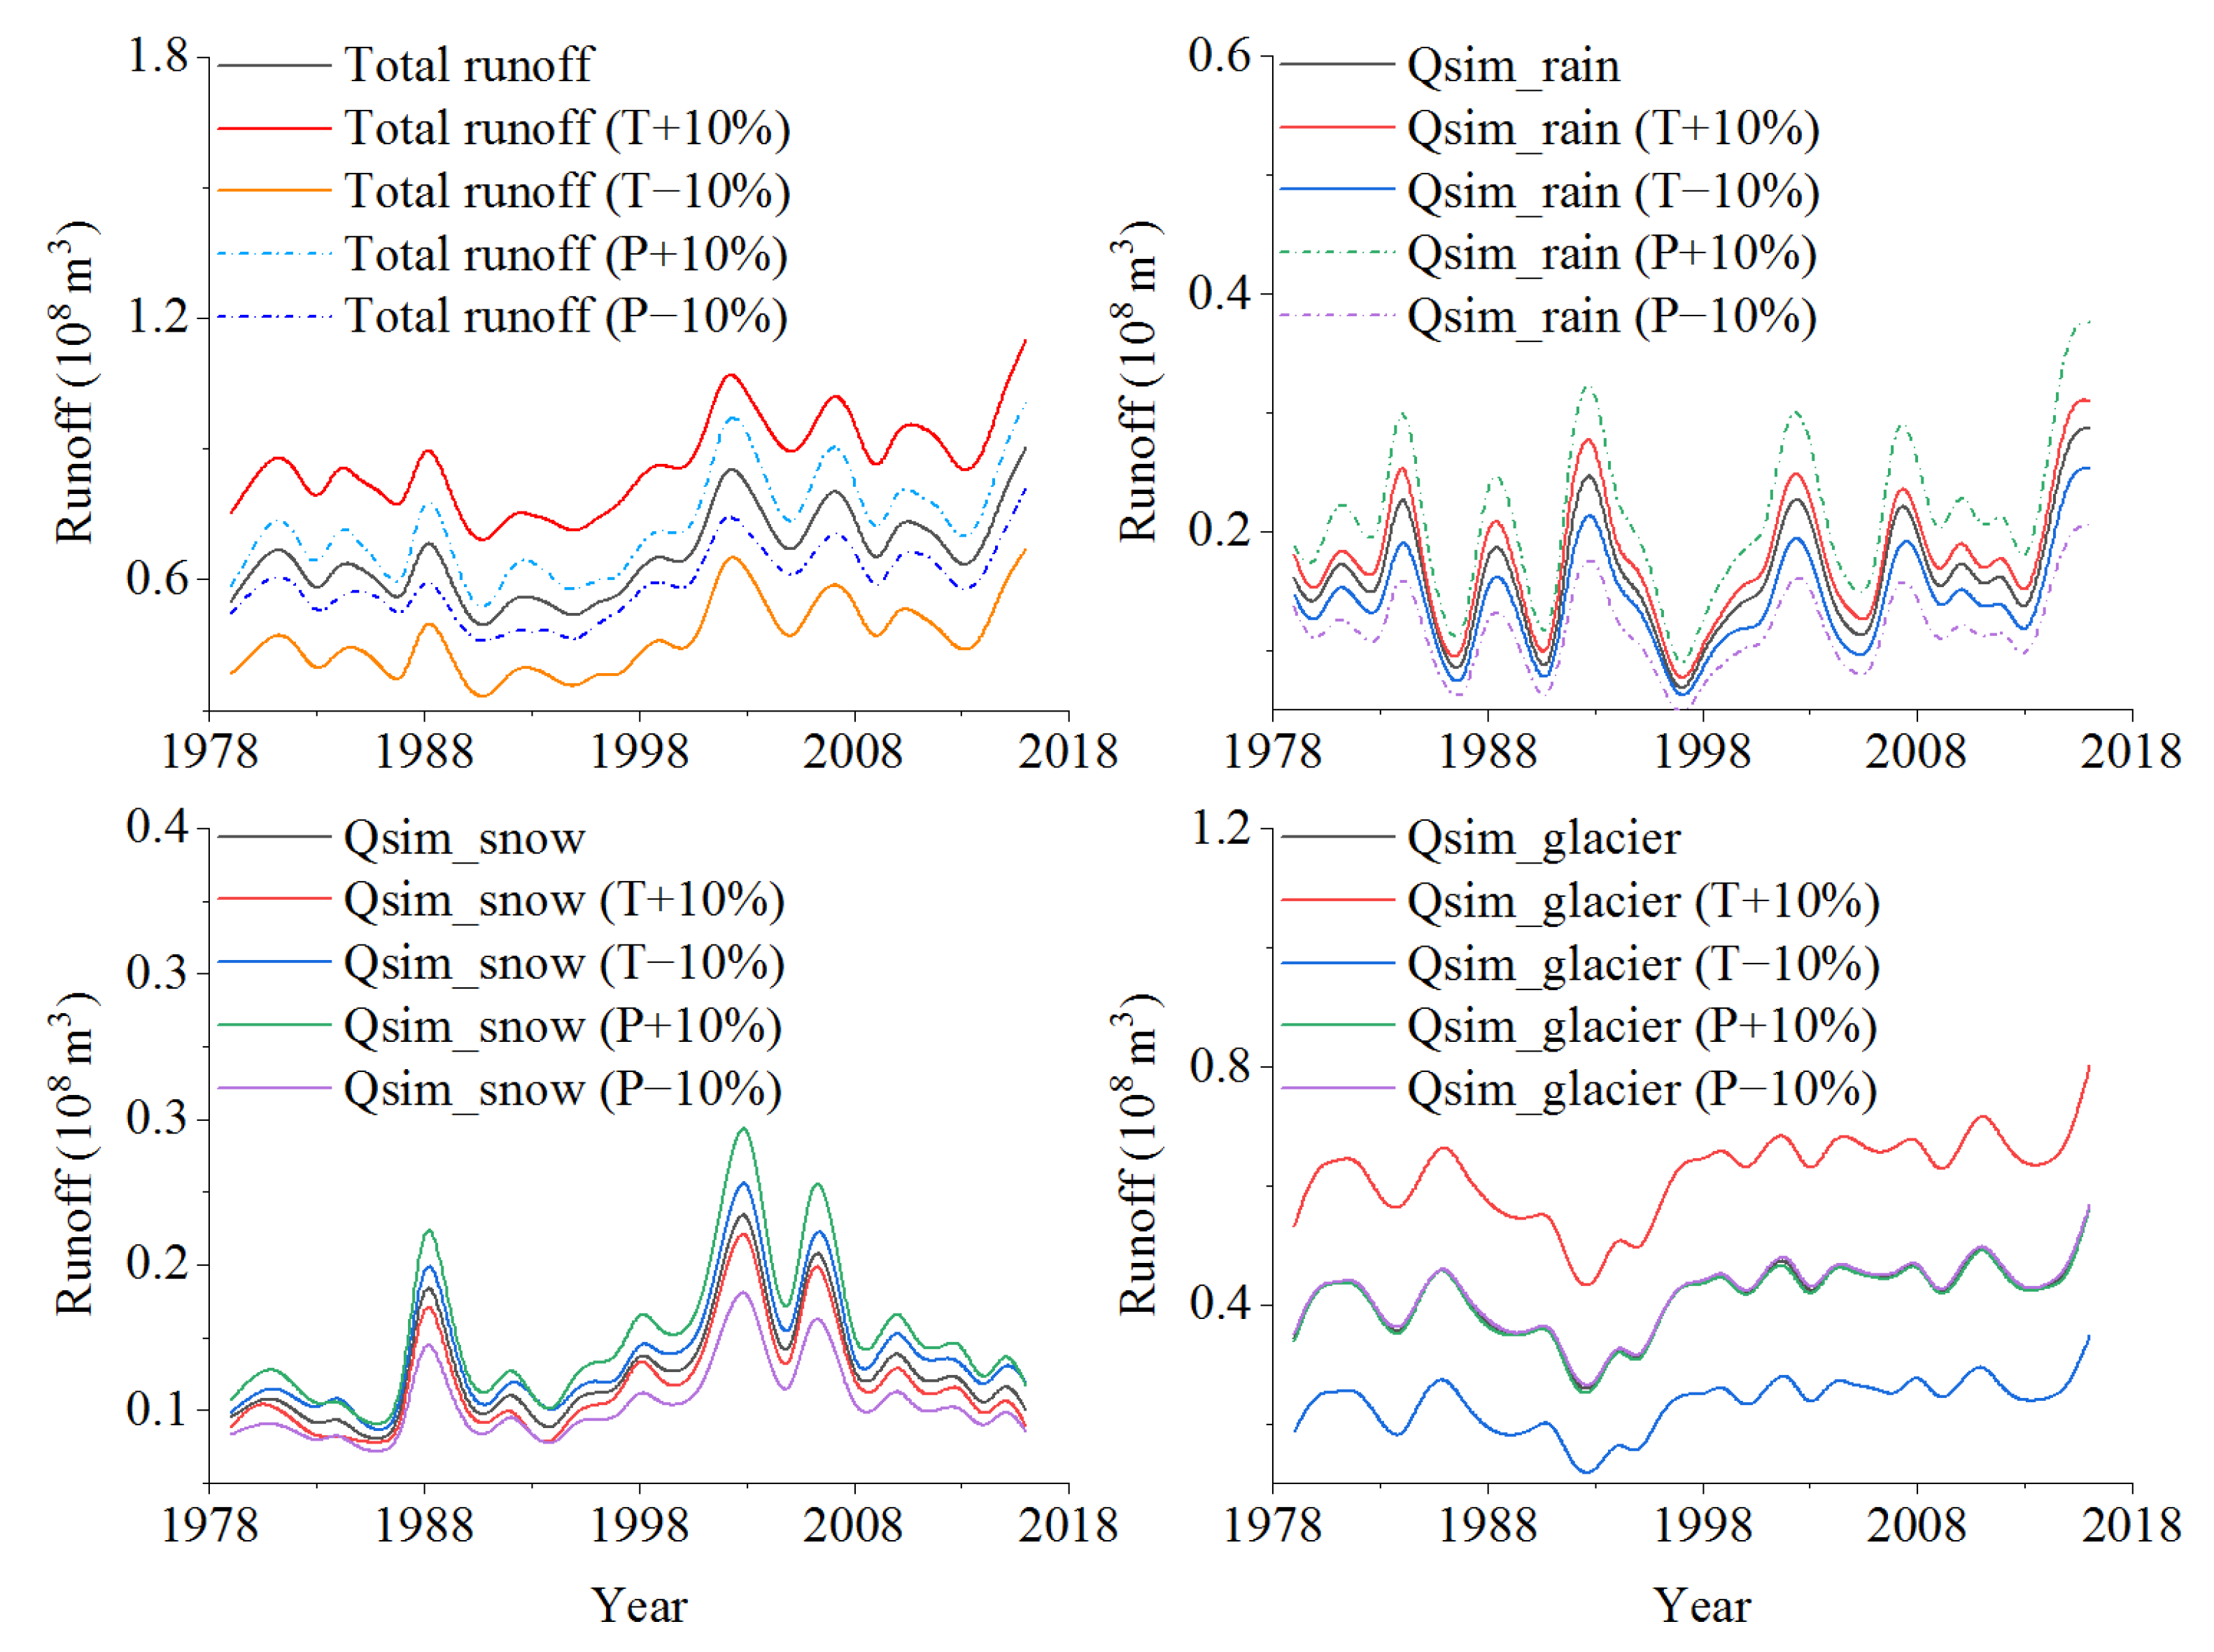
4.4. Variation of the Modeled Runoff Components Series
5. Discussion
6. Conclusions
Author Contributions
Funding
Data Availability Statement
Acknowledgments
Conflicts of Interest
References
- Sorg, A.; Bolch, T.; Stoffel, M.; Solomina, O.; Beniston, M. Climate change impacts on glaciers and runoff in Tien Shan (Central Asia). Nat. Clim. Change 2012, 2, 725–731. [Google Scholar] [CrossRef]
- Chen, Y.; Li, Z.; Fang, G. Changes of key hydrological elements and research progress of water cycle in the Tianshan Mountains, Central Asia. Arid. Land Geogr. 2022, 45, 1–8. (In Chinese) [Google Scholar]
- Immerzeel, W.W.; van Beek, L.P.H.; Bierkens, M.F.P. Climate Change Will Affect the Asian Water Towers. Science 2010, 328, 1382–1385. [Google Scholar] [CrossRef] [PubMed]
- Farinotti, D.; Longuevergne, L.; Moholdt, G.; Duethmann, D.; Molg, T.; Bolch, T.; Vorogushyn, S.; Guntner, A. Substantial glacier mass loss in the Tien Shan over the past 50 years. Nat. Geosci. 2015, 8, 716–722. [Google Scholar] [CrossRef]
- Chen, Y.N.; Li, W.H.; Deng, H.J.; Fang, G.H.; Li, Z. Changes in Central Asia’s Water Tower: Past, Present and Future. Sci. Rep. 2016, 6, 35458. [Google Scholar] [CrossRef]
- Hagg, W.; Braun, L.N.; Weber, M.; Becht, M. Runoff modelling in glacierized Central Asian catchments for present-day and future climate. Nord. Hydrol. 2006, 37, 93–105. [Google Scholar] [CrossRef] [Green Version]
- Jansson, P.; Hock, R.; Schneider, T. The concept of glacier storage: A review. J. Hydrol. 2003, 282, 116–129. [Google Scholar] [CrossRef]
- Li, Y.; Lu, X.; Li, Y. A Review on the Little Ice Age and Factors to Glacier Changes in the Tian Shan, Central Asia. In Glacier Evolution in a Changing World; Godone, D., Ed.; IntechOpen: London, UK, 2017; pp. 38–54. [Google Scholar]
- Savoskul, O.S.; Solomina, O.N. Late-Holocene glacier variations in the frontal and inner ranges of the Tian Shan, central Asia. Holocene 1996, 6, 25–35. [Google Scholar] [CrossRef]
- Zhang, Y.; Kong, Z.C.; Yan, S.; Yang, Z.J.; Ni, J. “Medieval Warm Period” on the northern slope of central Tianshan Mountains, Xinjiang, NW China. Geophys. Res. Lett. 2009, 36, L11702. [Google Scholar] [CrossRef] [Green Version]
- Vyazov, L.A.; Ershova, E.G.; Ponomarenko, E.V.; Gajewski, K.; Blinnikov, M.S.; Sitdikov, A.G. Ancient Society of the Lake Balkhash Basin. In Socio-Environmental Dynamics along the Historical Silk Road; Springer: Cham, Switzerland, 2019; pp. 381–382. [Google Scholar]
- An, L.X.; Hao, Y.H.; Yeh, T.C.J.; Zhang, B.J. Annual to multidecadal climate modes linking precipitation of the northern and southern slopes of the Tianshan Mts. Theor. Appl. Clim. 2020, 140, 453–465. [Google Scholar] [CrossRef]
- Guan, X.F.; Yao, J.Q.; Schneider, C. Variability of the precipitation over the Tianshan Mountains, Central Asia. Part II: Multi-decadal precipitation trends and their association with atmospheric circulation in both the winter and summer seasons. Int. J. Climatol. 2022, 42, 139–156. [Google Scholar] [CrossRef]
- Zhou, S.G.; Yao, X.J.; Zhang, D.H.; Zhang, Y.; Liu, S.Y.; Min, Y.F. Remote Sensing Monitoring of Advancing and Surging Glaciers in the Tien Shan, 1990–2019. Remote Sens. 2021, 13, 1973. [Google Scholar] [CrossRef]
- Li, K.M.; Li, Z.Q.; Gao, W.Y.; Wang, L. Recent glacial retreat and its effect on water resources in eastern Xinjiang. Chin. Sci. Bull. 2011, 56, 3596–3604. [Google Scholar] [CrossRef] [Green Version]
- Bolch, T. Climate change and glacier retreat in northern Tien Shan (Kazakhstan/Kyrgyzstan) using remote sensing data. Glob. Planet Change 2007, 56, 1–12. [Google Scholar] [CrossRef]
- Narama, C.; Kaab, A.; Duishonakunov, M.; Abdrakhmatov, K. Spatial variability of recent glacier area changes in the Tien Shan Mountains, Central Asia, using Corona (similar to 1970), Landsat (similar to 2000), and ALOS (similar to 2007) satellite data. Glob. Planet Change 2010, 71, 42–54. [Google Scholar] [CrossRef]
- Li, Z.Q.; Li, H.L.; Chen, Y.N. Mechanisms and Simulation of Accelerated Shrinkage of Continental Glaciers: A Case Study of Urumqi Glacier No. 1 in Eastern Tianshan, Central Asia. J. Earth Sci. 2011, 22, 423–430. [Google Scholar] [CrossRef]
- Pieczonka, T.; Bolch, T. Region-wide glacier mass budgets and area changes for the Central Tien Shan between similar to 1975 and 1999 using Hexagon KH-9 imagery. Global Planet Change 2015, 128, 1–13. [Google Scholar] [CrossRef]
- Wang, Y.T.; Hou, S.G.; Liu, Y.P. Glacier changes in the Karlik Shan, eastern Tien Shan, during 1971/72-2001/02. Ann. Glaciol. 2009, 50, 39–45. [Google Scholar] [CrossRef] [Green Version]
- Zhao, Q.D.; Zhang, S.Q.; Ding, Y.J.; Wang, J.; Han, H.D.; Xu, J.L.; Zhao, C.C.; Guo, W.Q.; Shangguan, D.H. Modeling Hydrologic Response to Climate Change and Shrinking Glaciers in the Highly Glacierized Kunma Like River Catchment, Central Tian Shan. J. Hydrometeorol. 2015, 16, 2383–2402. [Google Scholar] [CrossRef]
- Sun, M.P.; Li, Z.Q.; Yao, X.J.; Zhang, M.J.; Jin, S. Modeling the hydrological response to climate change in a glacierized high mountain region, northwest China. J. Glaciol. 2015, 61, 127–136. [Google Scholar] [CrossRef] [Green Version]
- Gao, H.K.; Li, H.; Duan, Z.; Ren, Z.; Meng, X.Y.; Pan, X.C. Modelling glacier variation and its impact on water resource in the Urumqi Glacier No. 1 in Central Asia. Sci. Total Environ. 2018, 644, 1160–1170. [Google Scholar] [CrossRef] [PubMed]
- Wang, X.L.; Luo, Y.; Sun, L.; Zhang, Y.Q. Assessing the effects of precipitation and temperature changes on hydrological processes in a glacier-dominated catchment. Hydrol. Process 2015, 29, 4830–4845. [Google Scholar] [CrossRef]
- Zhang, Y.Q.; Luo, Y.; Sun, L.; Liu, S.Y.; Chen, X.; Wang, X.L. Using glacier area ratio to quantify effects of melt water on runoff. J. Hydrol. 2016, 538, 269–277. [Google Scholar] [CrossRef]
- Xu, M.; Han, H.D.; Kang, S.C. Modeling Glacier Mass Balance and Runoff in the Koxkar River Basin on the South Slope of the Tianshan Mountains, China, from 1959 to 2009. Water 2020, 12, 582. [Google Scholar] [CrossRef] [Green Version]
- Wang, X.Y.; Yang, T.; Xu, C.Y.; Xiong, L.H.; Shi, P.F.; Li, Z.Y. The response of runoff components and glacier mass balance to climate change for a glaciated high-mountainous catchment in the Tianshan Mountains. Nat. Hazards 2020, 104, 1239–1258. [Google Scholar] [CrossRef]
- Yang, M.; Li, Z.Q.; Anjum, M.N.; Kayastha, R.; Kayastha, R.B.; Rai, M.; Zhang, X.; Xu, C.H. Projection of Streamflow Changes Under CMIP6 Scenarios in the Urumqi River Head Watershed, Tianshan Mountain, China. Front. Earth Sci. 2022, 10, 857854. [Google Scholar] [CrossRef]
- Liu, J.; Long, A.H.; Deng, X.Y.; Yin, Z.L.; Deng, M.J.; An, Q.; Gu, X.C.; Li, S.Y.; Liu, G.H. The Impact of Climate Change on Hydrological Processes of the Glacierized Watershed and Projections. Remote Sens. 2022, 14, 1314. [Google Scholar] [CrossRef]
- Khanal, S.; Lutz, A.F.; Kraaijenbrink, P.D.A.; van den Hurk, B.; Yao, T.; Immerzeel, W.W. Variable 21st Century Climate Change Response for Rivers in High Mountain Asia at Seasonal to Decadal Time Scales. Water Resour. Res. 2021, 57, e2020WR029266. [Google Scholar] [CrossRef]
- Wan, Z.J.; Wang, Y.T.; Hou, S.G.; Huai, B.J.; Liu, Q. A doubling of glacier mass loss in the Karlik Range, easternmost Tien Shan, between the periods 1972–2000 and 2000–2015. J. Glaciol. 2021, 67, 1–12. [Google Scholar] [CrossRef]
- Luo, G.; AI, L.; Qi, X.M.; Xu, L.C.; Li, B. Hydrological Characteristics of the Yushugou Valley. Bimon. Xinjiang Meteorol. 2002, 25, 19–37. (In Chinese) [Google Scholar]
- Guo, W.Q.; Liu, S.Y.; Xu, L.; Wu, L.Z.; Shangguan, D.H.; Yao, X.J.; Wei, J.F.; Bao, W.J.; Yu, P.C.; Liu, Q.; et al. The second Chinese glacier inventory: Data, methods and results. J. Glaciol. 2015, 61, 357–372. [Google Scholar] [CrossRef] [Green Version]
- Zhang, H.; Li, Z.Q.; Zhou, P.; Zhu, X.F.; Wang, L. Mass-balance observations and reconstruction for Haxilegen Glacier No.51, eastern Tien Shan, from 1999 to 2015. J. Glaciol. 2018, 64, 689–699. [Google Scholar] [CrossRef] [Green Version]
- Zhu, X.F.; Zhang, M.J.; Wang, S.J.; Qiang, F.; Zeng, T.; Ren, Z.G.; Dong, L. Comparison of monthly precipitation derived from high-resolution gridded datasets in arid Xinjiang, central Asia. Quatern Int. 2015, 358, 160–170. [Google Scholar] [CrossRef]
- Kendall, M.G. Rank Correlation Methods. Br. J. Psychol. 1990, 25, 86–91. [Google Scholar] [CrossRef]
- Mann, H.B. Nonparametric Tests against Trend. Econometrica 1945, 13, 245–259. [Google Scholar] [CrossRef]
- Hall, D.K.; Bayr, K.J.; Schoner, W.; Bindschadler, R.A.; Chien, J.Y.L. Consideration of the errors inherent in mapping historical glacier positions in Austria from the ground and space (1893–2001). Remote Sens. Environ. 2003, 86, 566–577. [Google Scholar] [CrossRef]
- Silverio, W.; Jaquet, J.M. Glacial cover mapping (1987–1996) of the Cordillera Blanca (Peru) using satellite imagery. Remote Sens. Environ. 2005, 95, 342–350. [Google Scholar] [CrossRef]
- Fujita, K.; Nuimura, T. Spatially heterogeneous wastage of Himalayan glaciers. Proc. Natl. Acad. Sci. USA 2011, 108, 14011–14014. [Google Scholar] [CrossRef] [Green Version]
- Yang, W.; Yao, T.D.; Guo, X.F.; Zhu, M.L.; Li, S.H.; Kattel, D.B. Mass balance of a maritime glacier on the southeast Tibetan Plateau and its climatic sensitivity. J. Geophys. Res. Atmos. 2013, 118, 9579–9594. [Google Scholar] [CrossRef]
- Seibert, J.; Vis, M.J.P. Teaching hydrological modeling with a user-friendly catchment-runoff-model software package. Hydrol. Earth Syst. Sci. 2012, 16, 3315–3325. [Google Scholar] [CrossRef] [Green Version]
- Gadeke, A.; Holzel, H.; Koch, H.; Pohle, I.; Grunewald, U. Analysis of uncertainties in the hydrological response of a model-based climate change impact assessment in a subcatchment of the Spree River, Germany. Hydrol. Process 2014, 28, 3978–3998. [Google Scholar] [CrossRef]
- Pomeon, T.; Jackisch, D.; Diekkruger, B. Evaluating the performance of remotely sensed and reanalysed precipitation data over West Africa using HBV light. J. Hydrol. 2017, 547, 222–235. [Google Scholar] [CrossRef]
- Ali, A.F.; Xiao, C.D.; Zhang, X.P.; Adnan, M.; Iqbal, M.; Khan, G. Projection of future streamflow of the Hunza River Basin, Karakoram Range (Pakistan) using HBV hydrological model. J. Mt. Sci. 2018, 15, 2218–2235. [Google Scholar] [CrossRef]
- Hargreaves, H.G.; Samani, A.Z. Reference Crop Evapotranspiration from Temperature. Appl. Eng. Agric. 1985, 1, 96–99. [Google Scholar] [CrossRef]
- Liu, C.; Ding, L. A primary calculation of temperature and precipitation in Tianshan Mountains, China. J. Glaciol. Geocryol. 1988, 10, 151–159. (In Chinese) [Google Scholar]
- Seibert, J. Estimation of parameter uncertainty in the HBV model. Nord. Hydrol. 1997, 28, 247–262. [Google Scholar] [CrossRef]
- Wu, L.H.; Li, H.L.; Wang, L. Application of a Degree-Day Model for Determination of Mass Balance of Urumqi Glacier No. 1, Eastern Tianshan, China. J. Earth Sci. 2011, 22, 470–481. [Google Scholar] [CrossRef]
- Seibert, J. Multi-criteria calibration of a conceptual runoff model using a genetic algorithm. Hydrol. Earth Syst. Sci. 2000, 4, 215–224. [Google Scholar] [CrossRef] [Green Version]
- Zhang, X.P.; Qin, X.; Xu, C.H.; Liu, Y.S. Simulation of Runoff and Glacier Mass Balance and Sensitivity Analysis in a Glacierized Basin, North-Eastern Qinhai-Tibetan Plateau, China. Water 2018, 10, 1259. [Google Scholar] [CrossRef] [Green Version]
- Shen, H.; Tolson, B.A.; Mai, J. Time to Update the Split-Sample Approach in Hydrological Model Calibration. Water Resour. Res. 2022, 58, e2021WR031523. [Google Scholar] [CrossRef]


| Path | ID | Date | Resolution (m) |
|---|---|---|---|
| 138/30 | LT51380301989235BJC00 | 1989/08/23 | 30 |
| 138/30 | LT51380301999231BJC00 | 1999/08/19 | 30 |
| 138/30 | LT51380302008224BJC01 | 2008/08/11 | 30 |
| 138/30 | LC81380302016214LGN02 | 2016/08/01 | 30 |
| Parameter | Description | Prior Range | Value1 | Value2 | References |
|---|---|---|---|---|---|
| PCALT | precipitation gradient (%/100 m) | 12.6 ± 20% | 10.01 | 10.01 | [32] |
| TCALT | temperature gradient (°C/100 m) | 0.55 ± 20% | 0.61 | 0.61 | [47] |
| TT | threshold temperature to split snowfall and rainfall (°C) | −2.5–2.5 | −0.41 | 0.18 | [48] |
| CFMAX | degree-day factor of snow (mm/(°C·d)−1) | 2–6 | 3.1 | 3.15 | [49] |
| SP | seasonal variability in CFMAX (−) | 0–1 | 0.31 | 0.33 | - |
| SFCF | snowfall correction factor (−) | 0–1 | 0.55 | 0.43 | [45] |
| CFR | refreezing coefficient (−) | 0.05–0.2 | 0.02 | 0.02 | [45] |
| CWH | water holding capacity (−) | 0–0.2 | 0.3 | 0.29 | [48] |
| FC | maximum soil moisture storage (mm) | 50–500 | 140 | 160 | [50] |
| LP | soil moisture value above which AET reaches PET (mm) | 0.3–1 | 0.53 | 0.33 | [50] |
| BETA | the parameter that determines the relative contribution to runoff from rain or snowmelt (−) | 1–6 | 0.72 | 0.79 | [50] |
| CFGlacier | glacier correction factor (−) | 1.2–1.6 | 1.3 | 1.5 | [51] |
| CFSlope | slope correction factor (−) | 1–2 | 0.82 | 0.87 | [45] |
| KSI | snow to Ice conversion factor (d−1) | 0–0.1 | 0.02 | [21] | |
| KGmin | minimum outflow coefficient t(d−1) | 0.01–0.4 | 0.01 | [51] | |
| dKG | maximum minus minimum outflow coefficient (d−1) | 0.01–0.5 | 0.05 | [51] | |
| AG | calibration parameter (mm−1) | 0–1 | 0.02 | * | |
| PERC | threshold parameter (mm/d) | 0–6 | 5 | [48] | |
| UZL | threshold parameter (mm) | 0–50 | 13 | [50] | |
| K0 | storage (or recession) coefficient 0 (d−1) | 0.1–0.5 | 0.02 | [50] | |
| K1 | storage (or recession) coefficient 1(d−1) | 0.05–0.3 | 0.002 | [50] | |
| K2 | storage (or recession) coefficient 2(d−1) | 0.001–0.1 | 0.003 | [50] | |
| MAXBAS | length of triangular weighting function (d) | 1–5 | 2 | [48] | |
| Cet | potential evaporation correction factor | 0–1 | 0.001 | * | |
Publisher’s Note: MDPI stays neutral with regard to jurisdictional claims in published maps and institutional affiliations. |
© 2022 by the authors. Licensee MDPI, Basel, Switzerland. This article is an open access article distributed under the terms and conditions of the Creative Commons Attribution (CC BY) license (https://creativecommons.org/licenses/by/4.0/).
Share and Cite
Zhou, P.; Zhang, H.; Li, Z. Impact of Climate Change on the Glacier and Runoff of a Glacierized Basin in Harlik Mountain, Eastern Tianshan Mountains. Remote Sens. 2022, 14, 3497. https://doi.org/10.3390/rs14143497
Zhou P, Zhang H, Li Z. Impact of Climate Change on the Glacier and Runoff of a Glacierized Basin in Harlik Mountain, Eastern Tianshan Mountains. Remote Sensing. 2022; 14(14):3497. https://doi.org/10.3390/rs14143497
Chicago/Turabian StyleZhou, Ping, Hui Zhang, and Zhongqin Li. 2022. "Impact of Climate Change on the Glacier and Runoff of a Glacierized Basin in Harlik Mountain, Eastern Tianshan Mountains" Remote Sensing 14, no. 14: 3497. https://doi.org/10.3390/rs14143497