1. Introduction
Interferometric Synthetic Aperture Radar (InSAR) technology has become an established technological solution for surface deformation monitoring over the last decade, thanks to the vast amount of freely available Synthetic Aperture Radar (SAR) data and the intensive development of processing techniques and growing computational capabilities [
1]. These advances in interferometric monitoring were made possible primarily by the Copernicus Programme of the European Space Agency (ESA) and its Sentinel-1 (S1) mission [
2]. Sentinel-1A and 1B have provided images of both ascending and descending geometry over Europe every six days over the last few years. Although this has been a remarkable technological advance for the SAR community, there remains a lack of user driven applications which utilize InSAR-based solutions. Many InSAR applications have been developed recently [
3,
4,
5,
6,
7,
8,
9,
10], but there is still significant potential to discover how this InSAR technology can be fully utilized. This article focuses on a practical application of InSAR in Hungary, Central Europe—a fully automated monitoring system that focuses on Hungary’s critical water management facilities.
InSAR has proved its reliability in monitoring various types of natural phenomena, such as mass movements [
11,
12,
13], or in the observation of deformation caused by human activity, such as deformation triggered by underground construction [
14,
15], or pumping [
16,
17]; building deformation [
18,
19], tailing pond failures [
20], damage to linear infrastructural elements, such as bridges [
21,
22], highways [
23], and critical water facilities, such as dams [
24] and numerous other objects.
Although InSAR technology has spread to more and more disciplines and applications, conventional interferometric stacking applications (PS, SBAS, etc.) remain focused on relatively small areas of interest, especially in the field of structural monitoring of buildings [
19] and the stability assessment of infrastructural elements [
21,
22]. In the meantime, stacking techniques have been used also in wider areas adapting to the extent of the investigated natural phenomenon [
25,
26,
27]. Although, over recent years, numerous nationwide interferometric-measurement-based monitoring systems [
3,
6,
8] have been developed [
1], in general, most of them are based on regularly acquired and freely available S1 SAR data [
4,
5,
7,
9,
10]. These data are suitable for general purposes by using the original resolution or a reduced resolution of products generated from S1. However, in most cases, if not all cases, these projects have a limited “monitoring component”, aiming at historical analysis with rare or non-existent updates. These techniques were designed to provide regularly updated, high-quality deformation information, usually calibrated with GNSS (Global Navigation Satellite System) data at the national or regional level. The next generation of these systems will be the European Ground Motion Service (EGMS), which covers the whole of Europe with regularly updated S1-based InSAR products [
28]. These InSAR systems require enormous amounts of computational capacity and numerous processing hours to generate a final product [
1]. This means that the products can only be updated once every year or every other year. Considering the general aspects and technical properties of these services, the end product is not necessarily suitable for every purpose and for specific user demand.
It is difficult to see exactly how climate change will affect a wide variety of different sectors [
29], but it is evident that water management will be one sector which is widely affected [
30]. Climate change driven hazards have a significant impact on man-made water infrastructure [
31], and, previously, design practices and standards were not prepared for these challenges. For this reason, continuous monitoring of the ageing water management infrastructure has become critically important in many countries recently.
Therefore, the ultimate objective of our article is to provide a comprehensive overview of a nationwide, dedicated, operational InSAR application, which was a user-driven development to assist with the operation of the Hungarian Disaster Management Service (HDMS). In particular, this means monthly monitoring of 63 water facilities and 83 individual objects, spread throughout Hungary. This monitoring system also allowed a near real-time warning system to be developed. During the development, we integrated state-of-the-art hardware and software solutions to cope with the technical difficulties of near real-time processing, the large number of objects being monitored, the numerous types of water facilities of varying size, and also to overcome the limitations of the Sentinel-1 sensor.
The first part of our research highlights the general scope of the application where we describe the targeted challenges that the InSAR application can manage, with special attention being paid to the hardware and software solutions. However, our main focus was on the client’s request for developing an integrated system which implements multiple components. The second part of this article details the operation of the system and concludes with the disadvantages of the system. In the conclusion, we provide a summary of our experiences and suggest how to improve the system’s performance and implementation.
2. Methods
2.1. Site Description
Hungary is a typical example of a country with a transboundary river basin, with 96% of surface waters originating outside the country [
32]. Although there are more than 20 water courses that flow into the country, these merge into three main rivers, that leave the country at the southern borders [
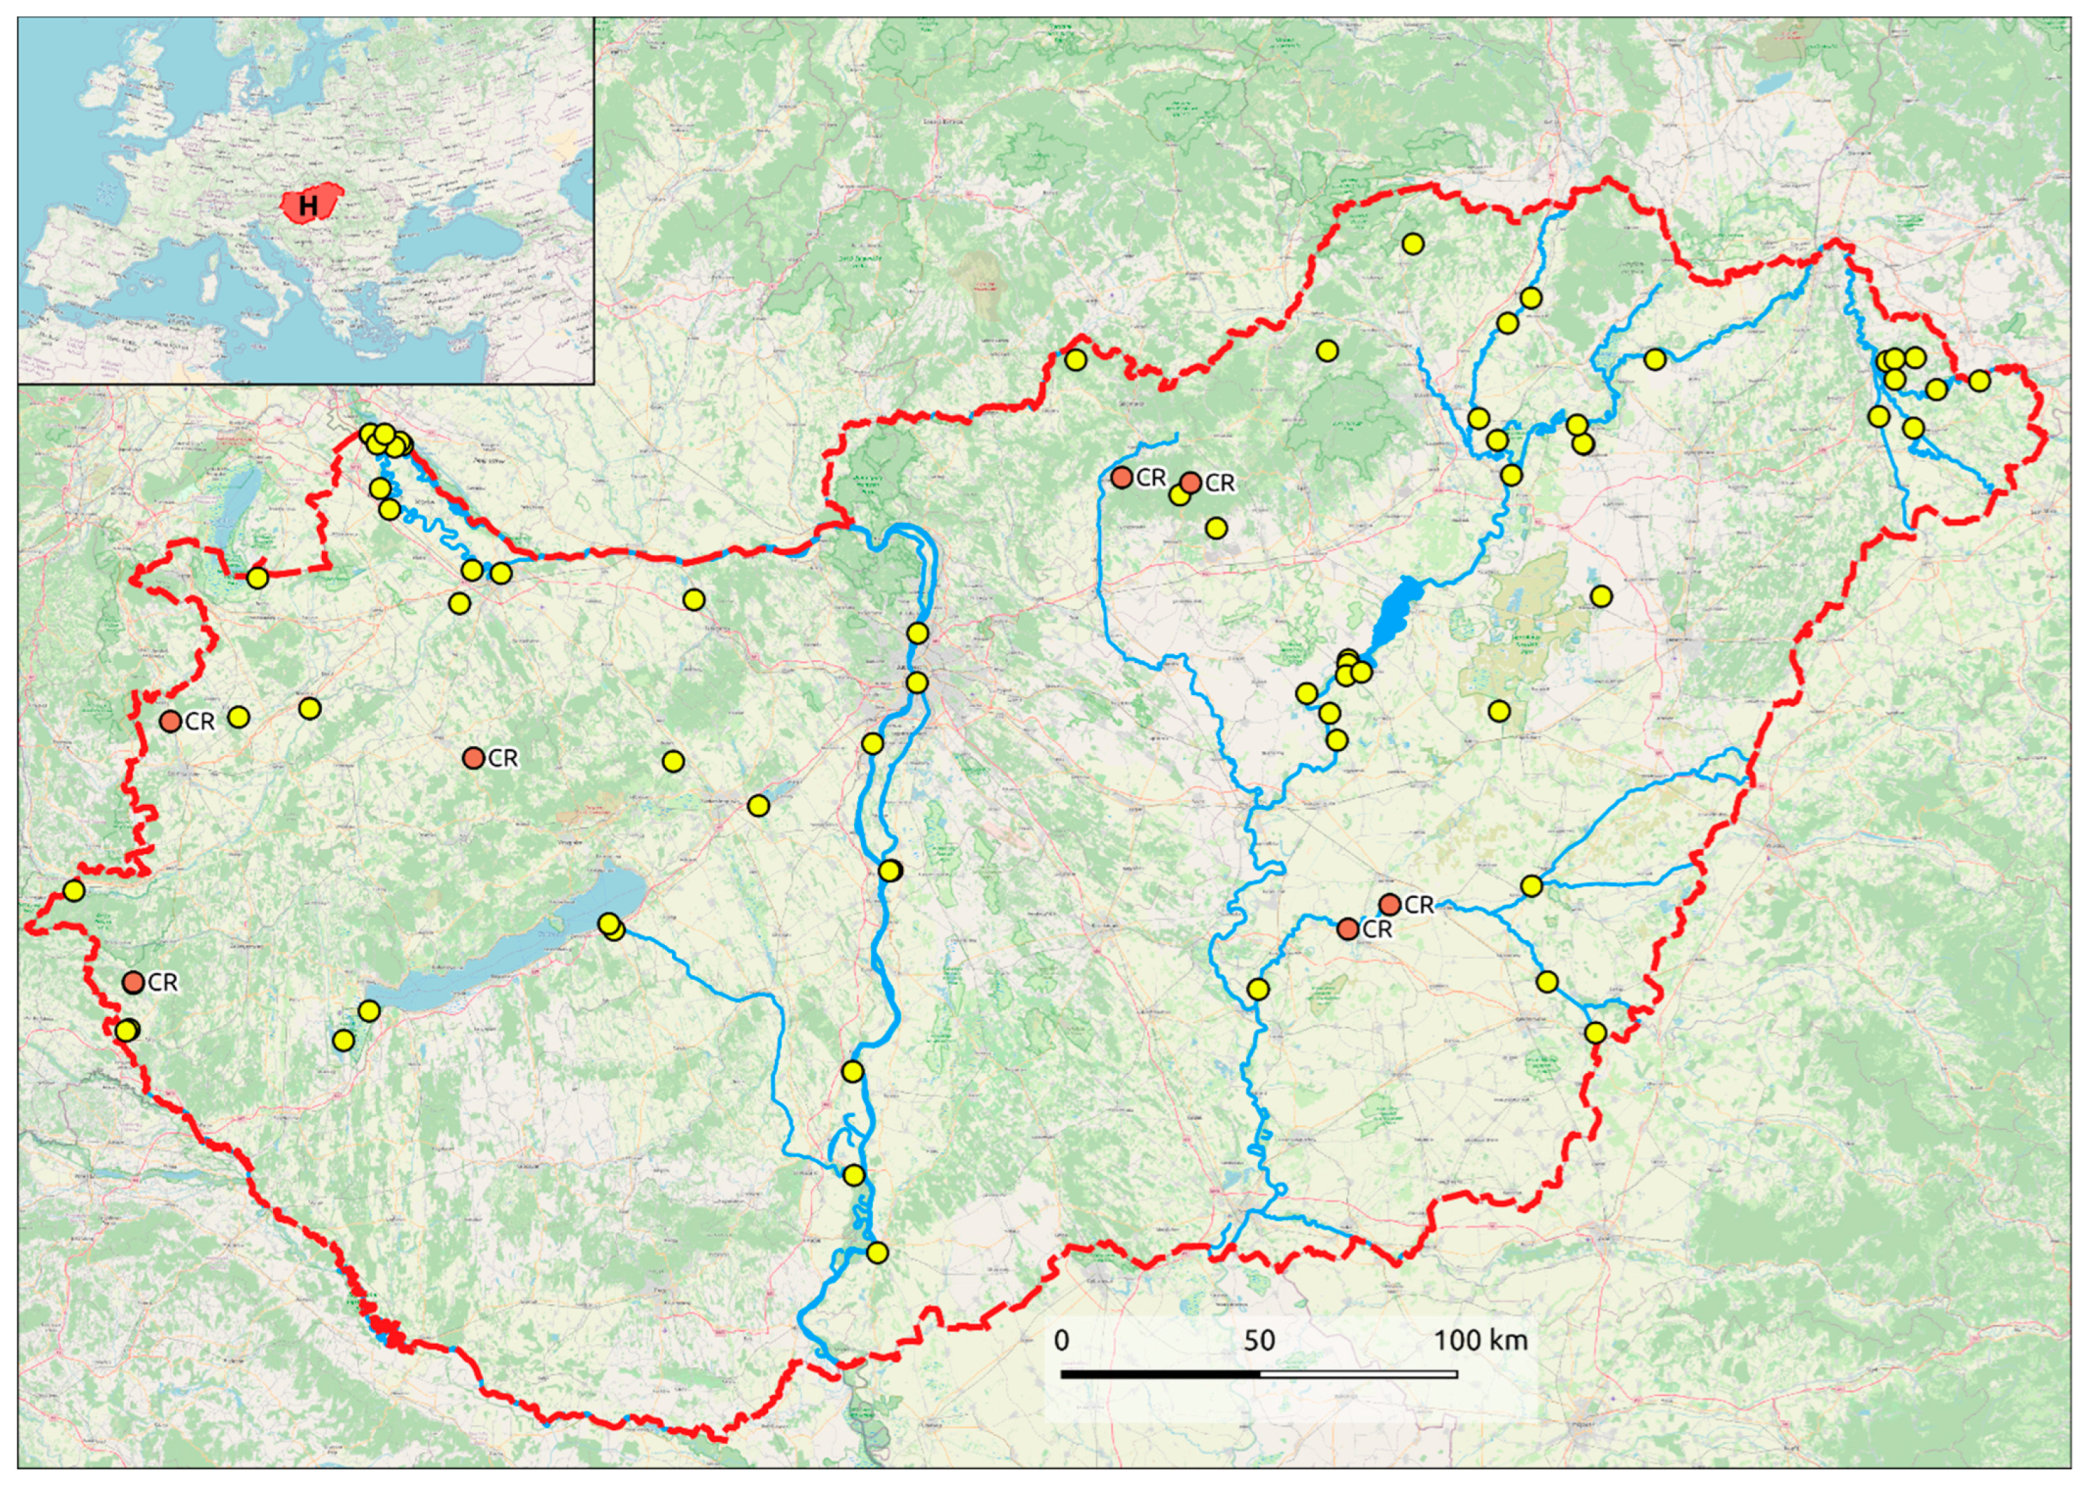
33] (
Figure 1). Hungary is unique in that it lies in the lowest part of the Pannonian Basin and has a landscape dominated by lowland plains [
34]. Throughout the 18th and 19th century, massive river regulation works in Europe transformed former natural wetlands into semi-channelled water bodies, establishing a new water regime [
35], in which man-made structures play an important role in water management [
36]. For this reason, and due to the low-lying nature of the country, inland waters and high groundwater levels can cause severe damage to agricultural fields, through flooding [
37], which frequently occurs near the main river courses. These floods also threaten major cities and can affect hundreds of thousands of lives. Therefore, water management and the frequent maintenance and monitoring of water management infrastructure is critical in Hungary. These challenges are managed using a variety of water management structures, including weirs, sluices, floodgates, dams, and numerous other structures. The state has designated 63 water facilities (
Figure 1) and 83 objects to be of national significance and the annual review of these facilities is administered by the HDMS of the Ministry of Interior according to government regulation 97/2007. The HDMS coordinates the annual review of the facilities, which is usually conducted using geodetic surveys. However, traditional monitoring is an expensive solution, and it cannot provide a continuous dataset on the stability of a structure.
The 83 structures investigated were built from various materials over the last 130 years; although they reflect a number of engineering designs and architectural styles, the main structures are predominantly constructed using reinforced concrete, metal plates, and pillars or earthworks (mainly at dams). Their size varies according to their function, ranging from a few square metres up to thousands of square metres of structural elements. The condition of the structures is also diverse. Most of the flood works and water management structures are situated in relatively remote areas, on riverbanks with dense vegetation, or in deep valleys of hill areas, with only a small portion located in easy-to-access built up environments. Overgrown vegetation also limits how well some structures can be surveyed. On the other hand, the construction materials (concrete and metal fittings, etc.) facilitate their measurements. It is worth mentioning that their location dependent on various river courses, lakes, and valleys, also influences how well they can be surveyed.
2.2. Methods
2.2.1. Technical Background of User Requirements Consolidation
As described in the previous section, the target objects of the InSAR monitoring system were legally defined and specific to man-made water management facilities. The advantage of combining the built environment and InSAR technology is that human-made structures are generally ideally suited to the double bounce backscattering mechanism [
38]. To gather information on these facilities, the InSAR calculations are performed using the persistent scatterer (PS) technique [
39], since this algorithm is designed to detect objects with well-defined geometry and permanent phase stability [
14].
Due to the remote location of the water facilities and the data updates required on a regular basis, it soon became clear that InSAR processing, focusing on the facilities and their immediate surroundings, could offer a more relevant and time-effective solution than InSAR processing of the whole county. Relative displacement measurements within the facility elements and between the facilities and their immediate environment provides the most relevant information which is critical to assess the stability of the facilities. Wide area coverage and calculations covering areas on a larger scale can provide a broader context of displacements (including slow-moving tectonic trends), but this comes with the cost of high computational capacity. Tectonic effects, however, only play a minor role on the stability of water facilities in Hungary, which is why the InSAR calculations were designed to investigate the water facilities and their nearby surroundings.
The side-looking nature of SAR systems and the presence of ascending and descending geometries of S1 improve the detectability of objects. Images acquired in both ascending and descending geometries, with overlapping for each location, were used for separate PS calculations for each water facility object.
2.2.2. Preparatory Work
The preliminary data required for the system planning was collected from the operators of the water facilities. This included the following information about the facilities: date of construction, coordinates, size, building materials, surrounding land cover, and categorisation of object. Other administrative data, such as the authorities responsible for each facility, was also collected.
The second part of the preparation included non-automated exploratory PS calculations of the sites. Here, the following objectives were established: selecting the ideal region of interest (ROI) for later calculations, selecting bursts of S1 images that overlap with the ROIs (so each ROI fits into an ascending/descending burst), and defining the length of the time series and the coherence thresholds used for PS processing, testing the number of PS points, and their distribution along the sites, and finally identifying facility types according to the following categories: detectable with PS or poorly detectable with PS. It is important to emphasize that thanks to the consistent acquisition scheme of Sentinel-1 and burst synchronisation requirements, the selected bursts and ROIs can remain the same for the automated system and throughout the lifetime of the project (Sentinel-1). Sites which were initially identified as poorly detectable in the PS calculations had their recognisability increased through the use of corner reflectors (CR), in compliance with the requests of the customer. This preparatory work included two main tasks: 1: analysis of the coherence and intensity of the sites (backscattering coefficient of the objects determines both the coherence and the requirement for CRs); 2: observation of the local field conditions (whether the field conditions allow the installation of CRs or not). Intensity and coherence calculations were performed using the Intensity Time Series (ITS) and Coherence TimeLine (CCD) workflows of the Envi SARscape® 5.5.2. software (by Sarmap SA, Caslano, Switzerland). The same bursts and ROIs selected in the previous step (at the PS processing stage) were also used here. First, coherence pairs were created within a 2-year interval to observe the changes of the phase of each given site (which was undetectable with PS). Coherence pairs were created from image pairs at 6 days, 12 days, and 6 months to analyse temporal changes of the phases along the selected water facilities. The results were interpreted by interferometry experts and the general coherence properties of these sites were ranked and classified according to their phase stability (phase stability categories: poor, medium, good, excellent). The phase stability categories provided essential information for understanding the phase properties of the investigated objects and also established a solid basis for CR placement.
The next step was to create an intensity time series of imagery over one year at each site to observe the mean backscattering (in dB) from sites that were undetectable using PS. This crucial step was necessary to establish which sites needed CRs to improve the detectability. However, this was only possible if the radar cross-section of the CR is significantly higher than the backscattering coefficient of the target, otherwise, the separation of the CR and the target is not possible.
The resulting data from the exploratory PS processing, intensity, and coherence analysis, allowed a comprehensive list of water facilities to be compiled. These facilities included those where CRs could improve the observation. It was also necessary to conduct field work around the facilities to ensure whether there would be any constraints regarding the installation of CRs. Several field trips were conducted to check the following conditions around the facilities: orientation, size, structural health of the objects, general land cover surrounding the object (including number and position of any shadowing objects, any blocking or interference around the object and the general visibility of the object), and possible locations for the placement of CRs. Potential CR locations were marked using geodetic nails, wooden stakes, or paint markings on structures, and also documented using sketches, photos, and a handheld GPS. Once the evaluation of the field survey was completed, the list of potential sites was shortlisted and further refined until it was ready to be forwarded to the clients. The final list included all the information gathered during the preparatory work at each site, as well as the number of proposed CRs and their potential locations. This list was forwarded to the clients who then decided on which sites should be improved by placing CRs, and also gave official approval for the CRs at each site.
2.3. Sentinel-1 Data Processing Pipeline
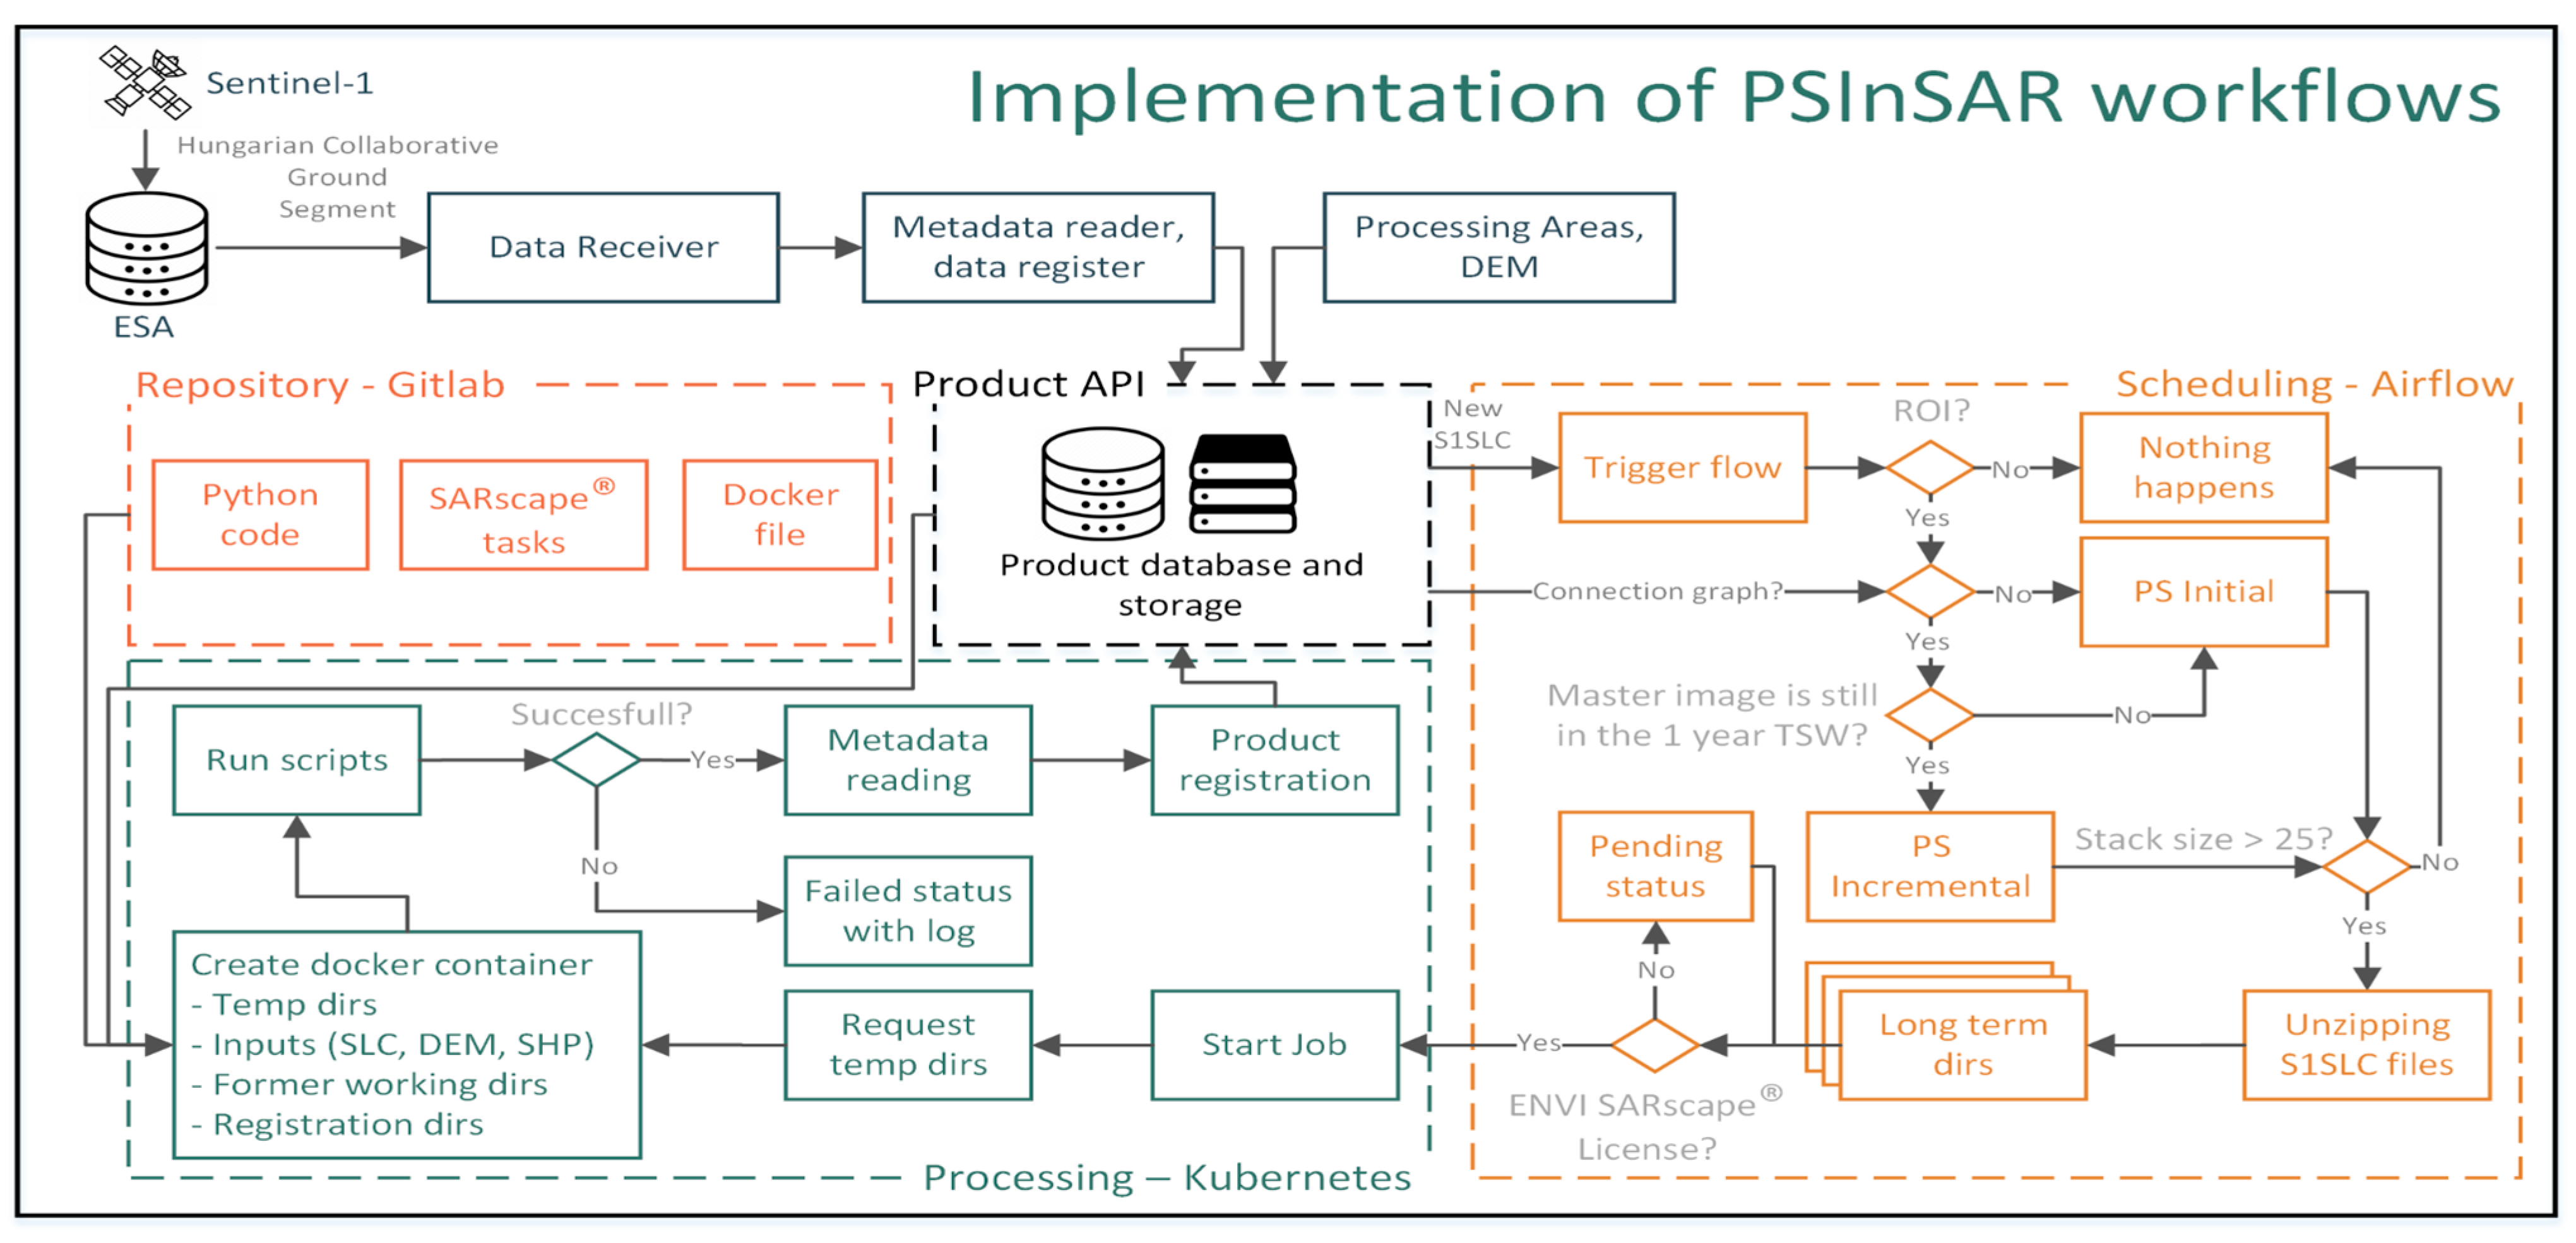
The InSAR processing pipeline (
Figure 2) was part of a nationwide Earth Observation project called the Földmegfigyelési Információs Rendszer (FIR-Earth Observation Information System). It was a complex EO-related national administration project involving the use of state-of-the-art DevOps processes. The hardware itself has more than 1000 CPU cores (700 cores dedicated to different remote sensing workflows), 768 GB RAM, and two NVIDIA Tesla V100 GPUs. The GPU cards were exclusively dedicated to the InSAR processing workflow, and the 2 PB of storage provides nearly limitless storage. The Sentinel-1 Persistent Scatterer processing was integrated into a DevOps environment and a Function-as-a-Service (FaaS) solution was implemented [
40]. The Apache Airflow [
41] schedules and monitors workflows on the cluster machine. Directed Acyclic Graphs (DAG) control the POD processes of Kubernetes cluster [
42], where Docker images as a sound containerization solution [
43,
44], provide the necessary step for the InSAR data processing. It means a working environment, which comprises of a Docker image, where the Operating System (OS), SARscape
® installer, SARscape
® patches ENVI installer and the Python environment are mounted.
The core part of the PS InSAR processing chain is the ENVI SARscape® 5.5.2.software. The processing chain comprises from the standard steps of PS processing in SARscape®. The first part is about the creation of a connection graph (by geometries), where a master image and secondary images were selected. This is followed by the image coregistration and the interferometric step, where the differential interferograms are created from the stacks (between the master and secondary images). These interferograms then further analysed in the “Fist Inversion” step, searching for PS points (identifying scatterers with permanent phase stability). Within this step, a linear displacement model is established for all detected points. The following stage is the “Second Inversion”, with atmospheric modelling and noise removal, performed by low and high pass filters. The last processing step is the geocoding, performed by evaluating the SRTM3 DEM.
SARscape
® can take the advantage of the GPU computational capacity, and utilising the advantage of the cluster environment, allows the Persistent Scattering (PS) workflow to run in parallel. Two fundamental PS processing workflows were formulated with the initial PS processing chain, being triggered when the targeted site was handled for the first time. The reactive orchestrator (Kubernetes) asks for a previous connection graph of PS processing, and if it is not available an Initial PS workflow will be generated if the Product API records any new relevant (overlapping any ROIs) S1 data from the FIR data storage. Product API is responsible for supplying data for processing and saving results via REST API into the FIR product database. If the PS connection graph already exists, an Incremental process is mounted by the Airflow DAG (
Figure 2). Therefore, incremental processing is initiated when a new acquisition is detected in the storage. Two important additional factors are involved in the system before the final processing—the Temporal Sliding Window (TSW) of the reference image should be set for a one-year cycle, and also, the image stack size should be more than 25 acquisitions, before running PS processing of SARscape
®. The TSW of the reference image is designed to select the acquisitions fit to the one-year timeframe of the processing, as well as to the position of the master image. With new incoming images, the TSW will be shifted towards time (oldest image will be excluded, new image will be included in the stack). The unzipped S1 files are stored in Long Term Directories and the PS pipeline processing is waiting for either available computational resources or licenses. If all the conditions are given, Kubernetes POD is triggered and the SARscape
® PS workflow runs fully automated. All the code is stored in GitLab [
45], and different orchestrator APIs harmonize the processing pipelines with the given hardware and software capacities. Cogent design elements of the processing system ensure the nearly unlimited capacity of the processing system. Bottlenecks may occur due to the number of different software licenses and of course the hardware capacity but the general framework of the InSAR processing solution is universal and able to serve additional end-user demands even in larger countries than Hungary without any further major development tasks.
2.4. Corner Reflector Installation
After clients finalized their decision on the number of CRs and selected the sites, further field work was carried out by geodetic experts who were responsible for the technical implementation of CR placement. They could finalize the exact position of CRs and supervise the implementation. It is worth mentioning that the orientation of CRs and the recommended positions were in accordance with well-known good practice [
46,
47]. In addition, continual collaboration with the operators of the water facilities was also needed to finetune CR placement so as not to disturb their operational work.
2.5. Special Early Warning System
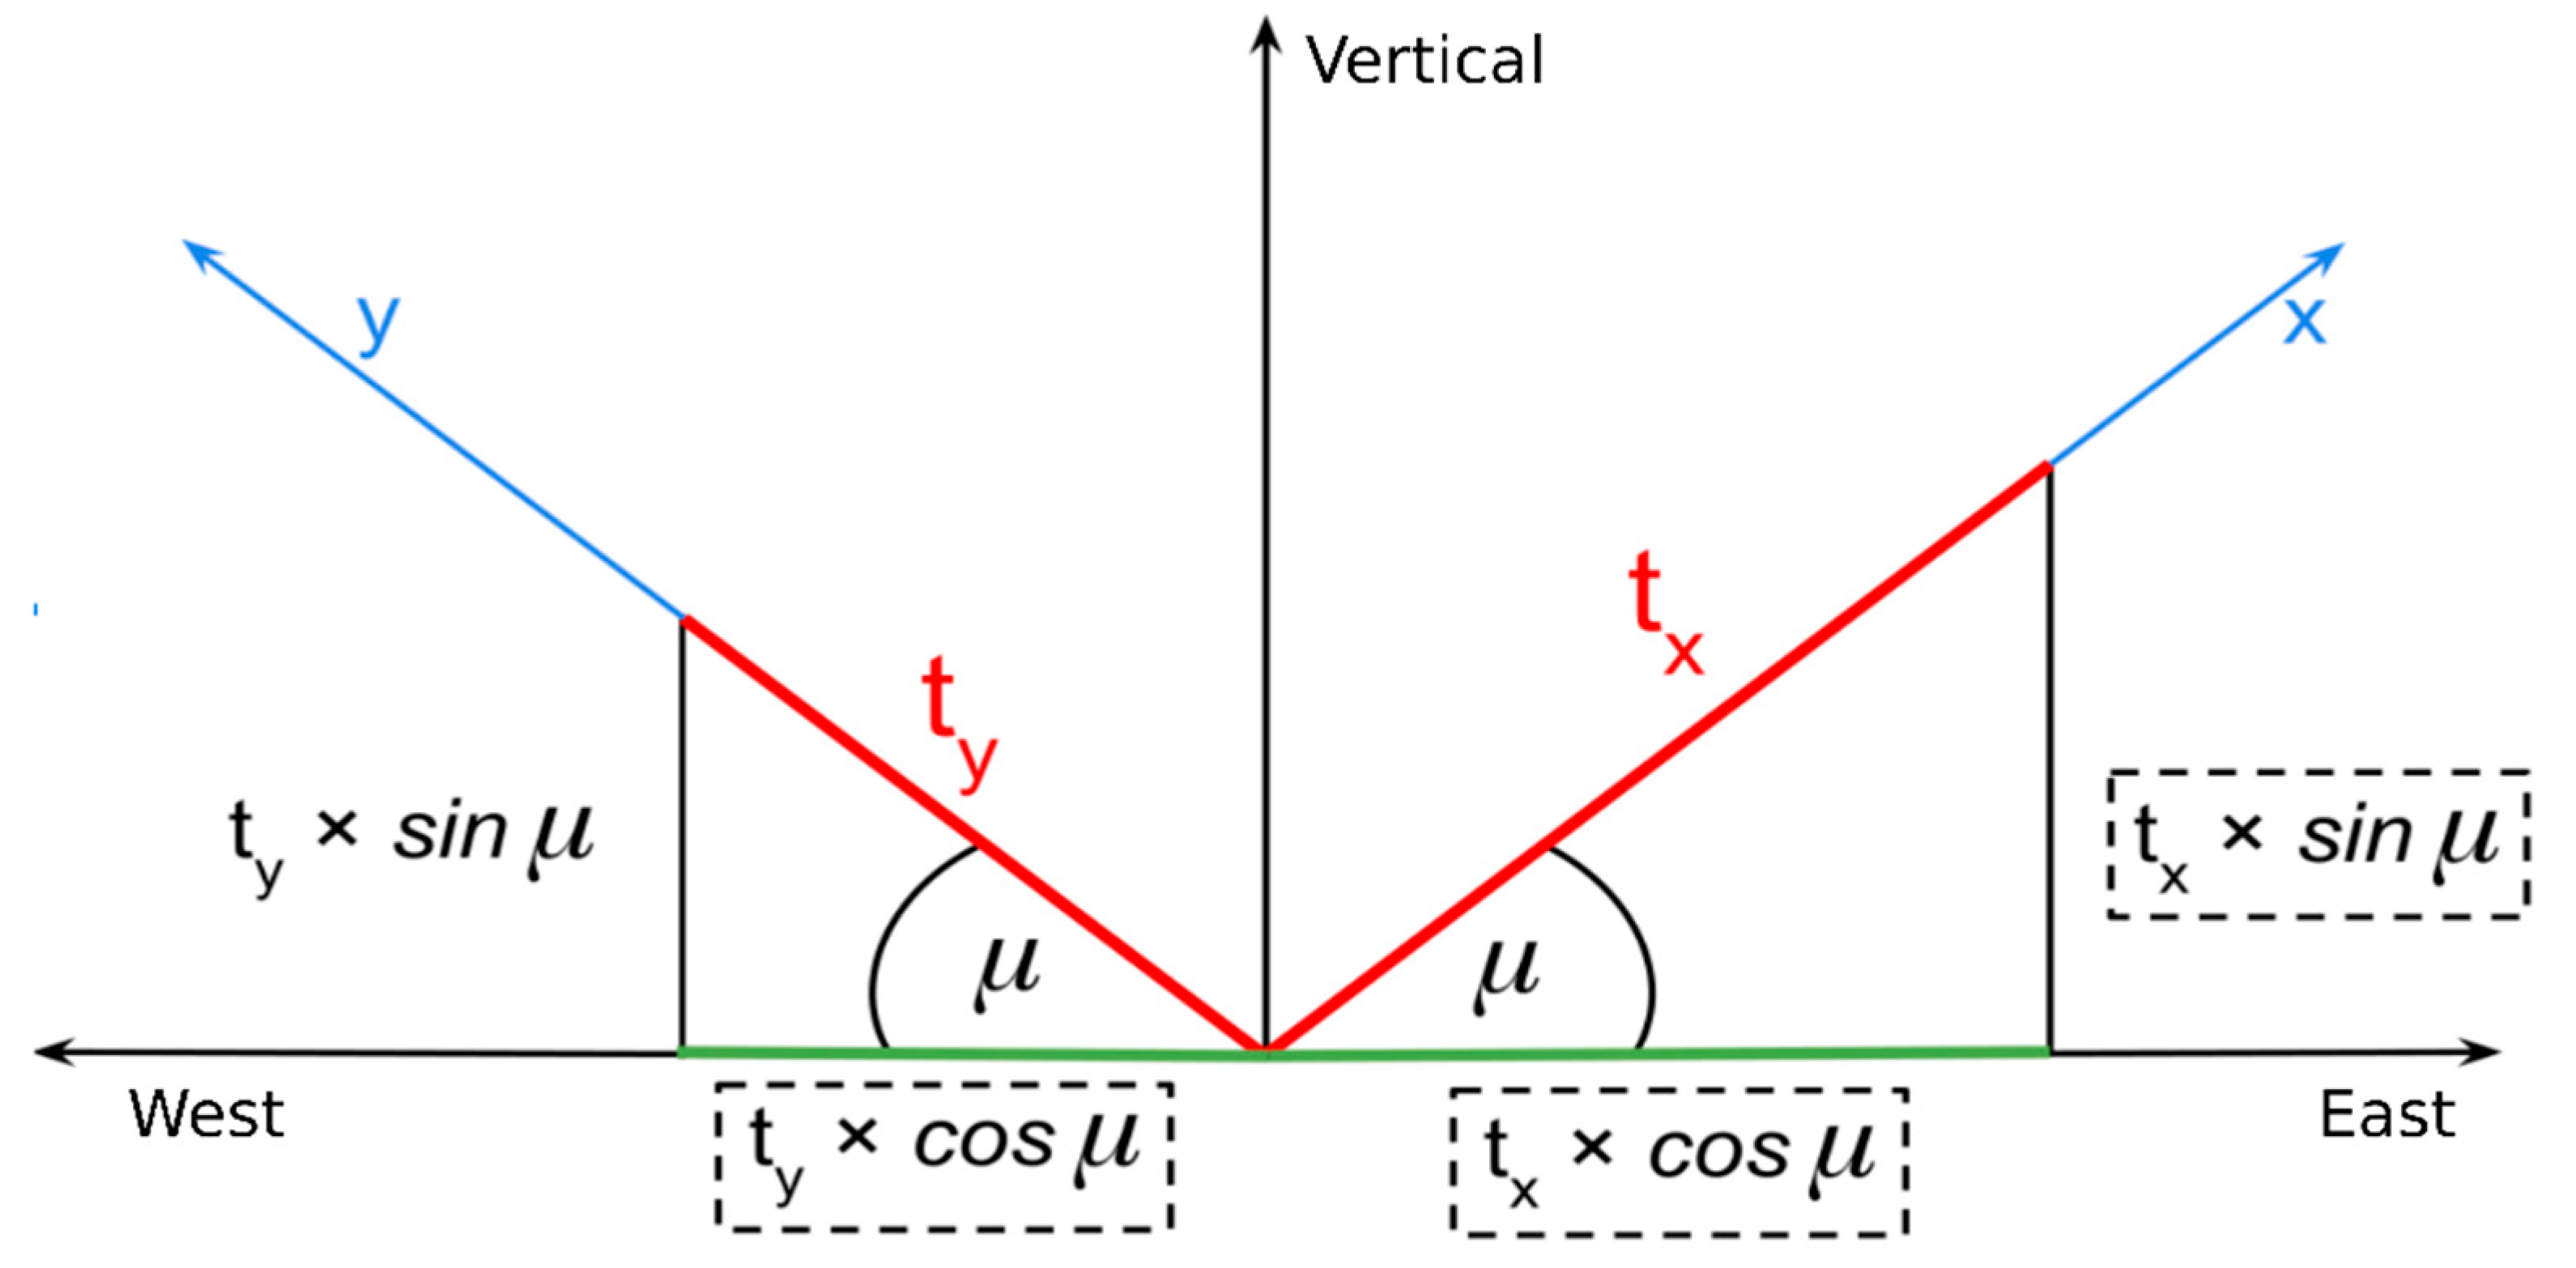
The basis of the warning system comprises of different components. Mathematicians, structural engineers, and InSAR experts worked together to come up with a suitable model for this complex process. The first phase of the system development was to record the various parameters which can be measured according to SAR geometry. The line of site dimension (LOS) is always computable when at least one PS point is located on the target. If ascending and descending measurements are present on the target within a certain distance from each other, we can combine them to vertical and East–West horizontal gradients [
48] giving us a 2D measurement (
Figure 3). However, it should be mentioned that the estimation of vertical and east–west components from ascending and descending Sentinel-1 data can introduce a bias when North–South displacements are not negligible.
The combination of ascending and descending geometries provides additional details of object stability status. This results in a more detailed structural engineering assessment for the targeted objects. Essentially, it is an orbital segment of the warning system, however, it has a terrestrial aspect as well. The various factors were taken into consideration for water management constructions and each object was assessed individually, as well as an investigation of the special environmental conditions in combination with the structural components. Based on this complete and multifaceted evaluation, a threshold value was assigned for each facility, and when this threshold value is exceeded a warning alert for the individual structure is given. Threshold values usually range between 10 and 30 mm/y (total displacement calculated from the annual velocity values of the points) and vary according to objects of water facilities. In common with another early warning system [
49], our system also provides different alert levels: green means no alert, yellow signifies that something should be checked or monitored, orange is a moderate warning, and red signifies a critical status.
2.6. Dedicated User Interface
The web-based user interface was built to serve the end-users’ requirements. The previously outlined early warning system logic was implemented on the PostgreSQL PostGIS backend. The hardware components of the frontend are located on another server of HDMS. The RabbitMQ system connects the two facilities, using standard open-source messaging services to give a notification about the creation of the PSInSAR results. According to different spatial database views, an opensource GIS server, MapServer, publishes the relevant spatial datasets related to the selected facility. The platform used for the web interface was Angular [
50]. In addition to the web map services, different plots and information are displayed on the site using standard data transmission services, such as Open Geospatial Consortium (OGC), Web Mapping Service (WMS), and OGC Web Feature Service (WFS). Users can select the relevant site, edit the main parameters of the objects, download reports, and display different plots. Additionally, the system can automatically send warning messages to the facility manager when the displacement of the water facility exceeds the defined threshold value. The end-user does not have access to intervene in the processing chain and has no permission or authorization to modify the SAR data workflow.
2.7. System Performance Testing
Starting of the PS processing of each site within 24 h after a new incoming SLC image arrives was a clearly defined user request. Therefore, we executed/monitored the processing time of the study areas. However, we should mention before the description of the tests that the FIR system itself, runs several other jobs too (such as forest detection, flood monitoring, burn area identification, etc.) which can have a significant effect on the interferometric processing time in the sense of number of available ENVI and SARscape licenses and available GPU and CPU cores. On the other hand, system performance depends both on the present hardware and the software solution and the former can be very easily changed and of course, the processing times will change regarding the new configuration. Therefore, the testing was performed in two different phases. The first was the initial modular testing, when we tested the performance (processing time) of each InSAR module. These runtimes have been not affected by other processes since they were run on the same hardware before launching the live system.
Final performance tests were executed on the live system. During the testing of the software performance, we took 150 random samples from PS processing times of sites in ascending and descending geometries and of course from the combination of geometries. Sampling of the processes was executed several different times, in all three cases to monitor the performance of the system before and after fine-tuning the processing chains. Considering the number of sites (63 facilities), each site was represented at least twice in the test data in ascending, descending, and also in geometry combinations. Sampling happened in the live system disregarding other non-InSAR processes started by the computer (which significantly influenced the capabilities of the system). The start time of the process was recorded as the creation date of the last SLC image at the given site in each geometry, while the end date was the creation date of the final product. In the case of ascending and descending data combination, the start date was the creation of the first available file for the combination, while the end date was the creation date of the final product. End- and starting date differences were further analysed in R software. Important to add that the test runs were load tests of the entire FIR development, therefore during the PS processing other routine satellite image processing also were executed.
3. Results
3.1. Preparatory Works
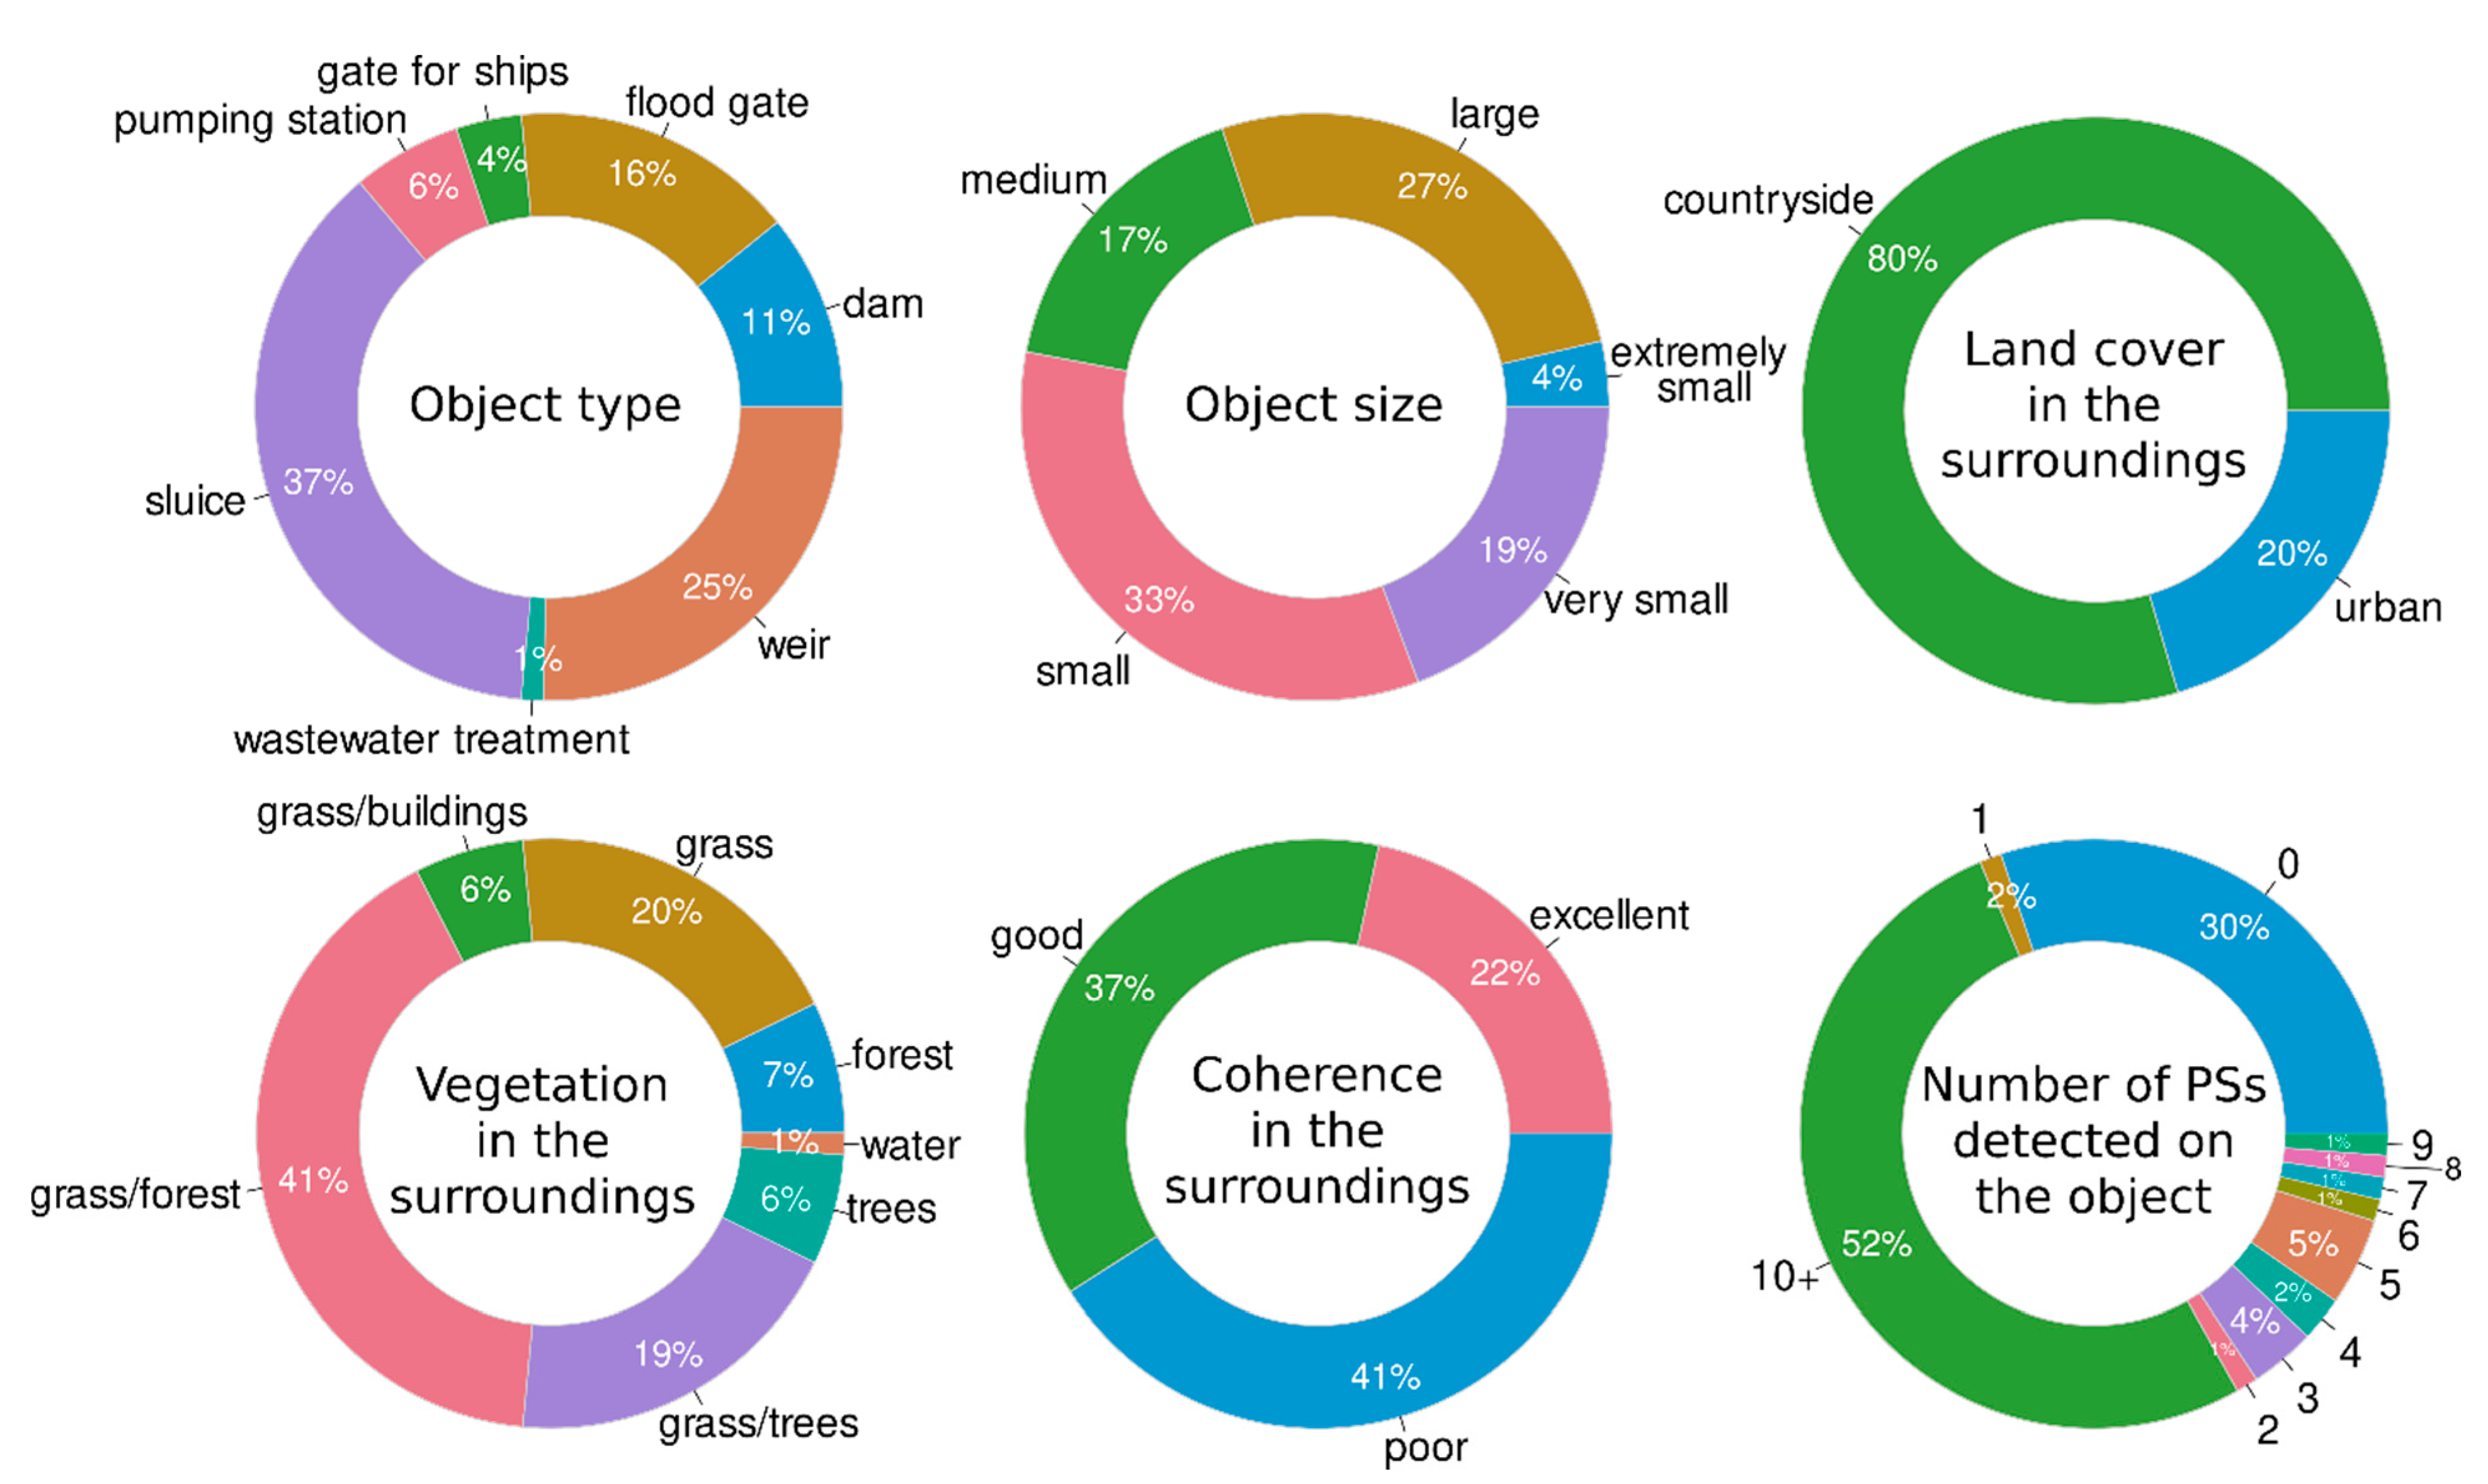
As a result of consultation with the operators of the water management facilities, important information was collected which helped to differentiate the structures into categories. In total there were eight types of water facilities (
Figure 4), dominated by sluices, weirs, floodgates, and dams. It should be mentioned that there are only functional differences between floodgates and sluices, which means that collectively they are the most common type. Object size reflects the overall heterogeneity of the facilities, where the detection of facilities with small, very small and extremely small sizes may be challenging for S1. In total, 80% of the facilities are in rural areas, where forests, groves, and grassland often shade and reduce the visibility of the structures. The coherence is excellent in only 22% of facilities and there were no PSs found for 30% of the objects. On the other hand, 37% of the facilities are covered by good coherence and more than 50% are detectable with more than 10 PSs.
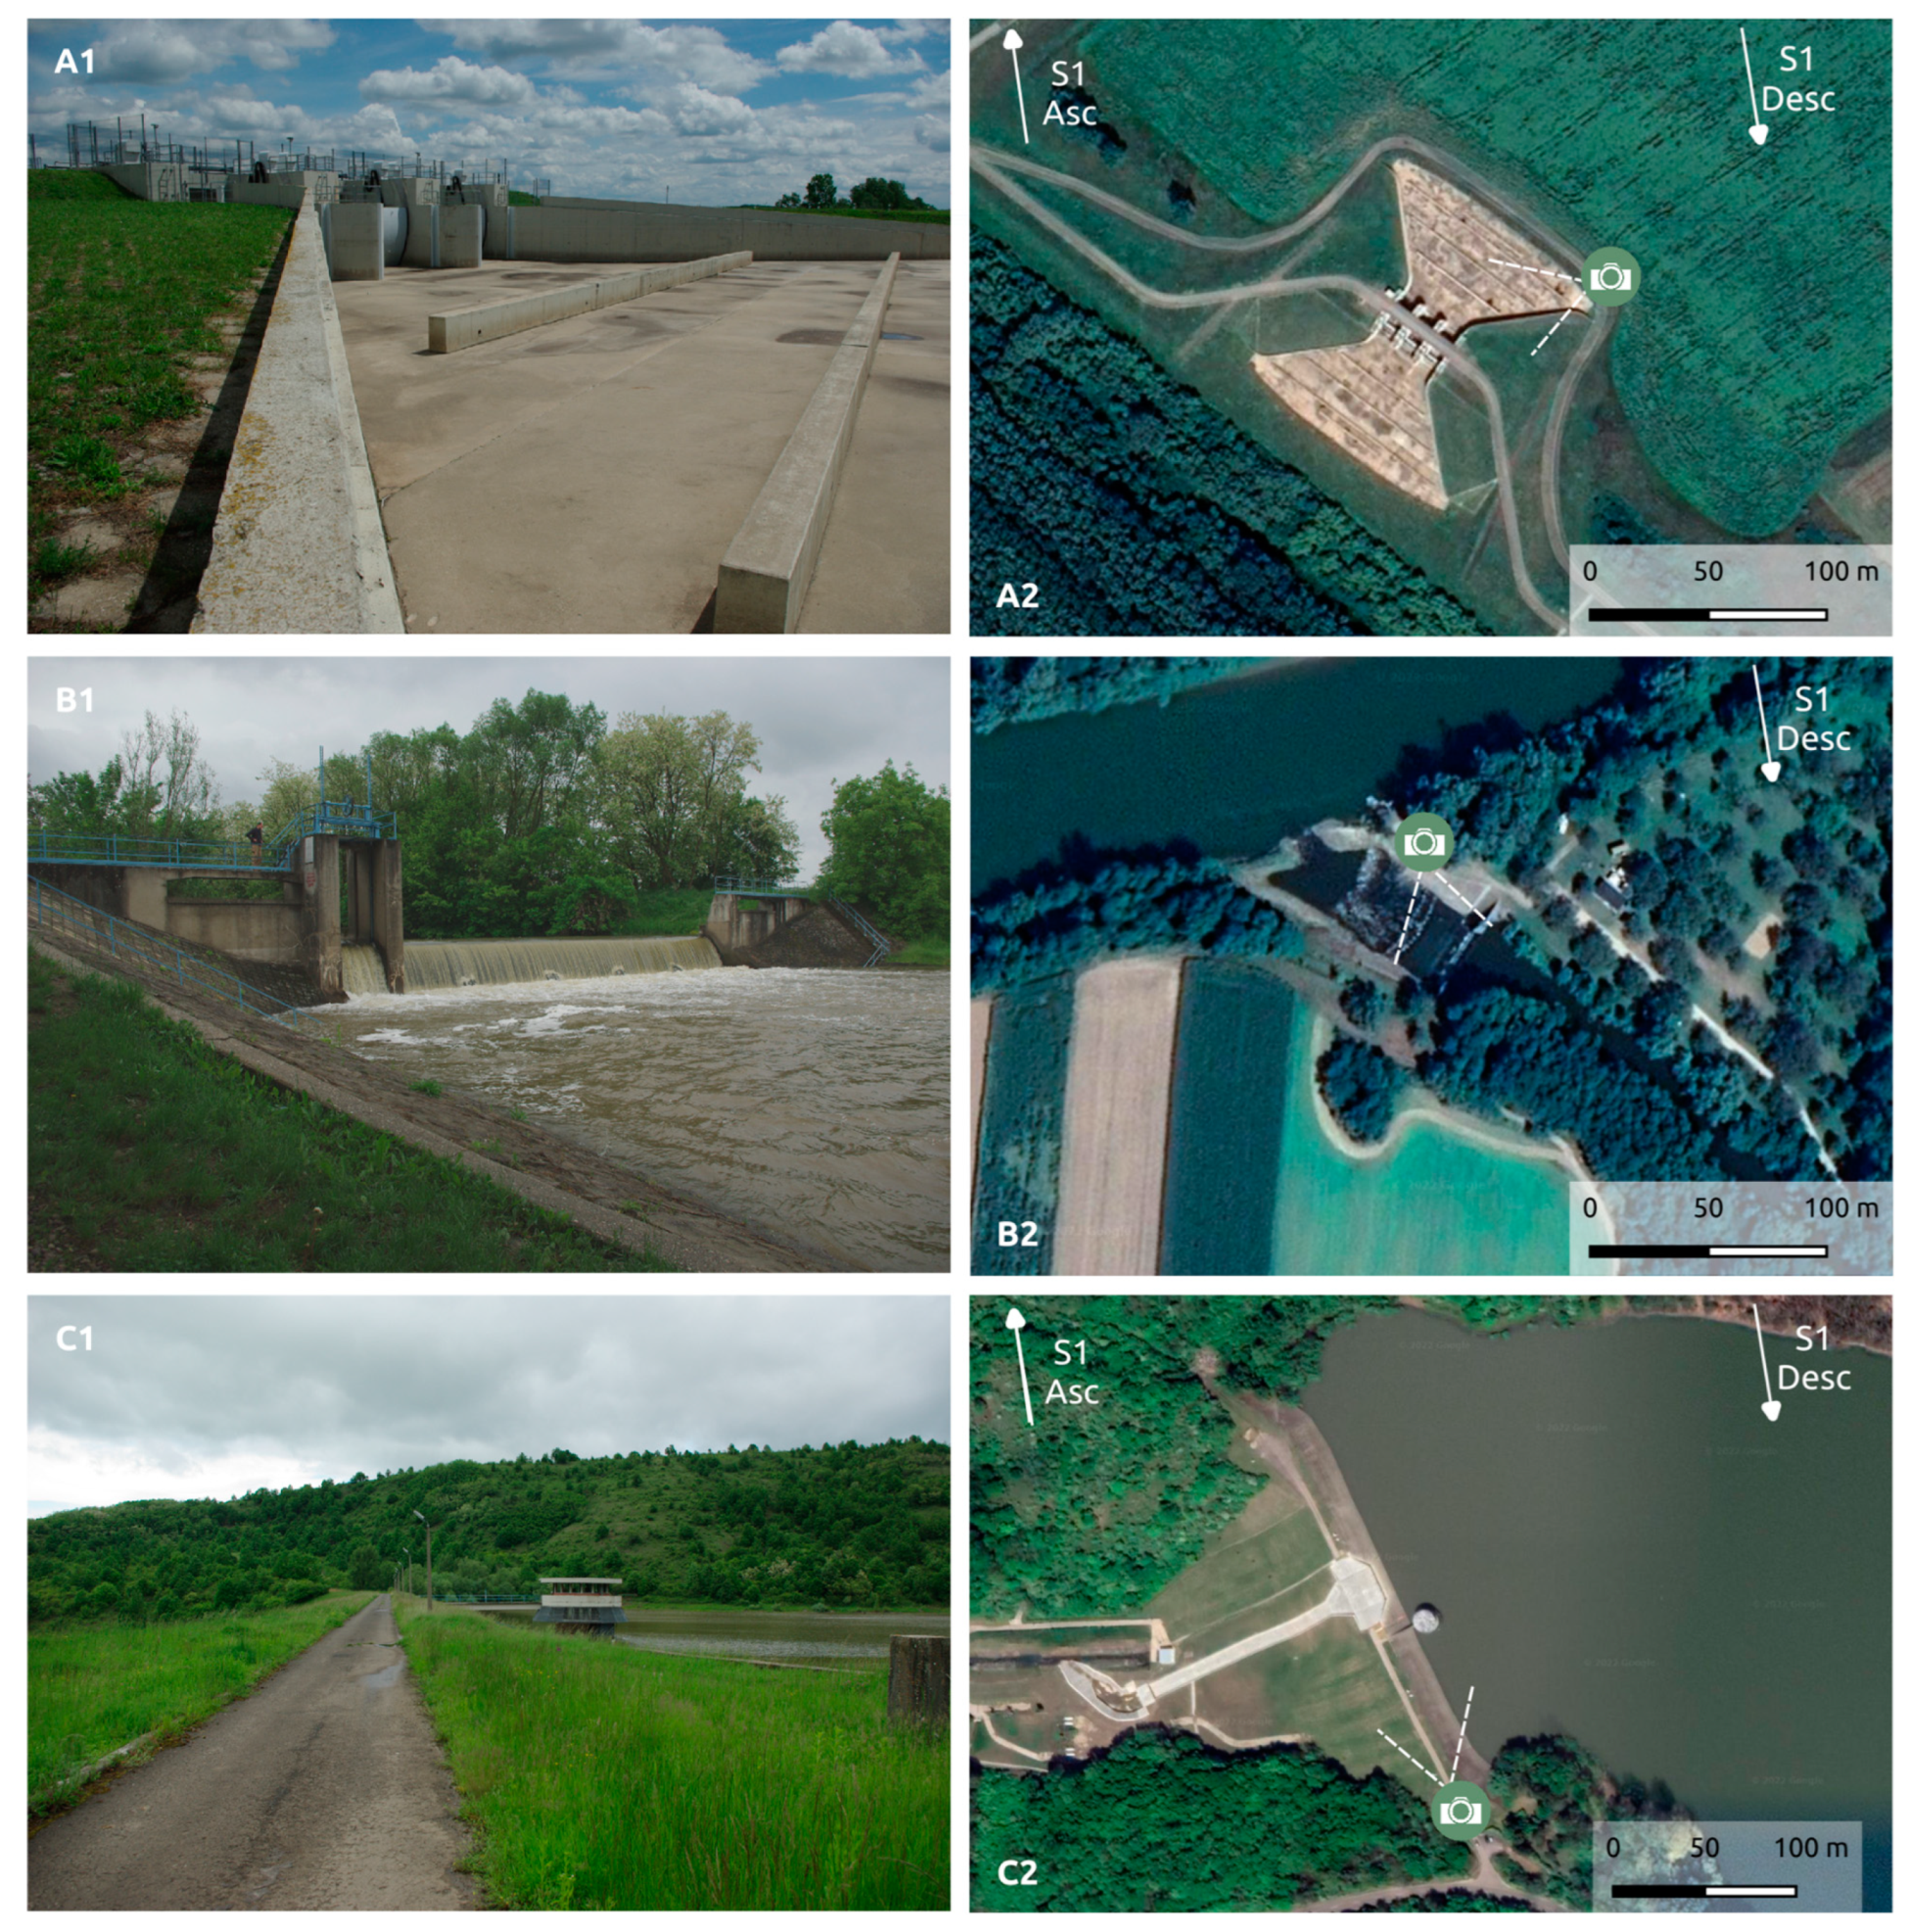
There are three typical facility types as highlighted in
Figure 5. Large modern flood gates in good condition and clearly defined reinforced concrete structures (A1) reflect stable signals toward the satellite even if the orientation of the object (A2) is not ideal regarding the satellites’ orbits. Overall, 25% of the facilities are weirs (B1), where usually the service buildings are detectable since their main structural elements are below the waterline. Their detectability is highly dependent on their size, design and the vegetation cover surrounding them. B1 and B2 show weirs with small service buildings, which cannot be measured by the sensor. In addition, the installation of CRs is also not possible due to tree shading and the moving parts of the weir.
Dams of water reservoirs (11% of facilities) are often unmeasurable due to the grass cover on the earthworks. Usually, their overflow drain is the only feature which provides higher intensity, however, even they cannot provide accurate phase information due to fluctuating water levels and the double bounce nature of the signal. The detectability of these objects, however, is easily improved with CRs. The general backscattering of dams is low, and they are usually in a wide-open area, where trees and other objects do restrict the placements of CRs.
Out of the 83 objects at 63 water management sites, 51 objects could be regularly monitored using PS techniques without any further improvements, which left 32 objects where the PS algorithm did not find any PSs.
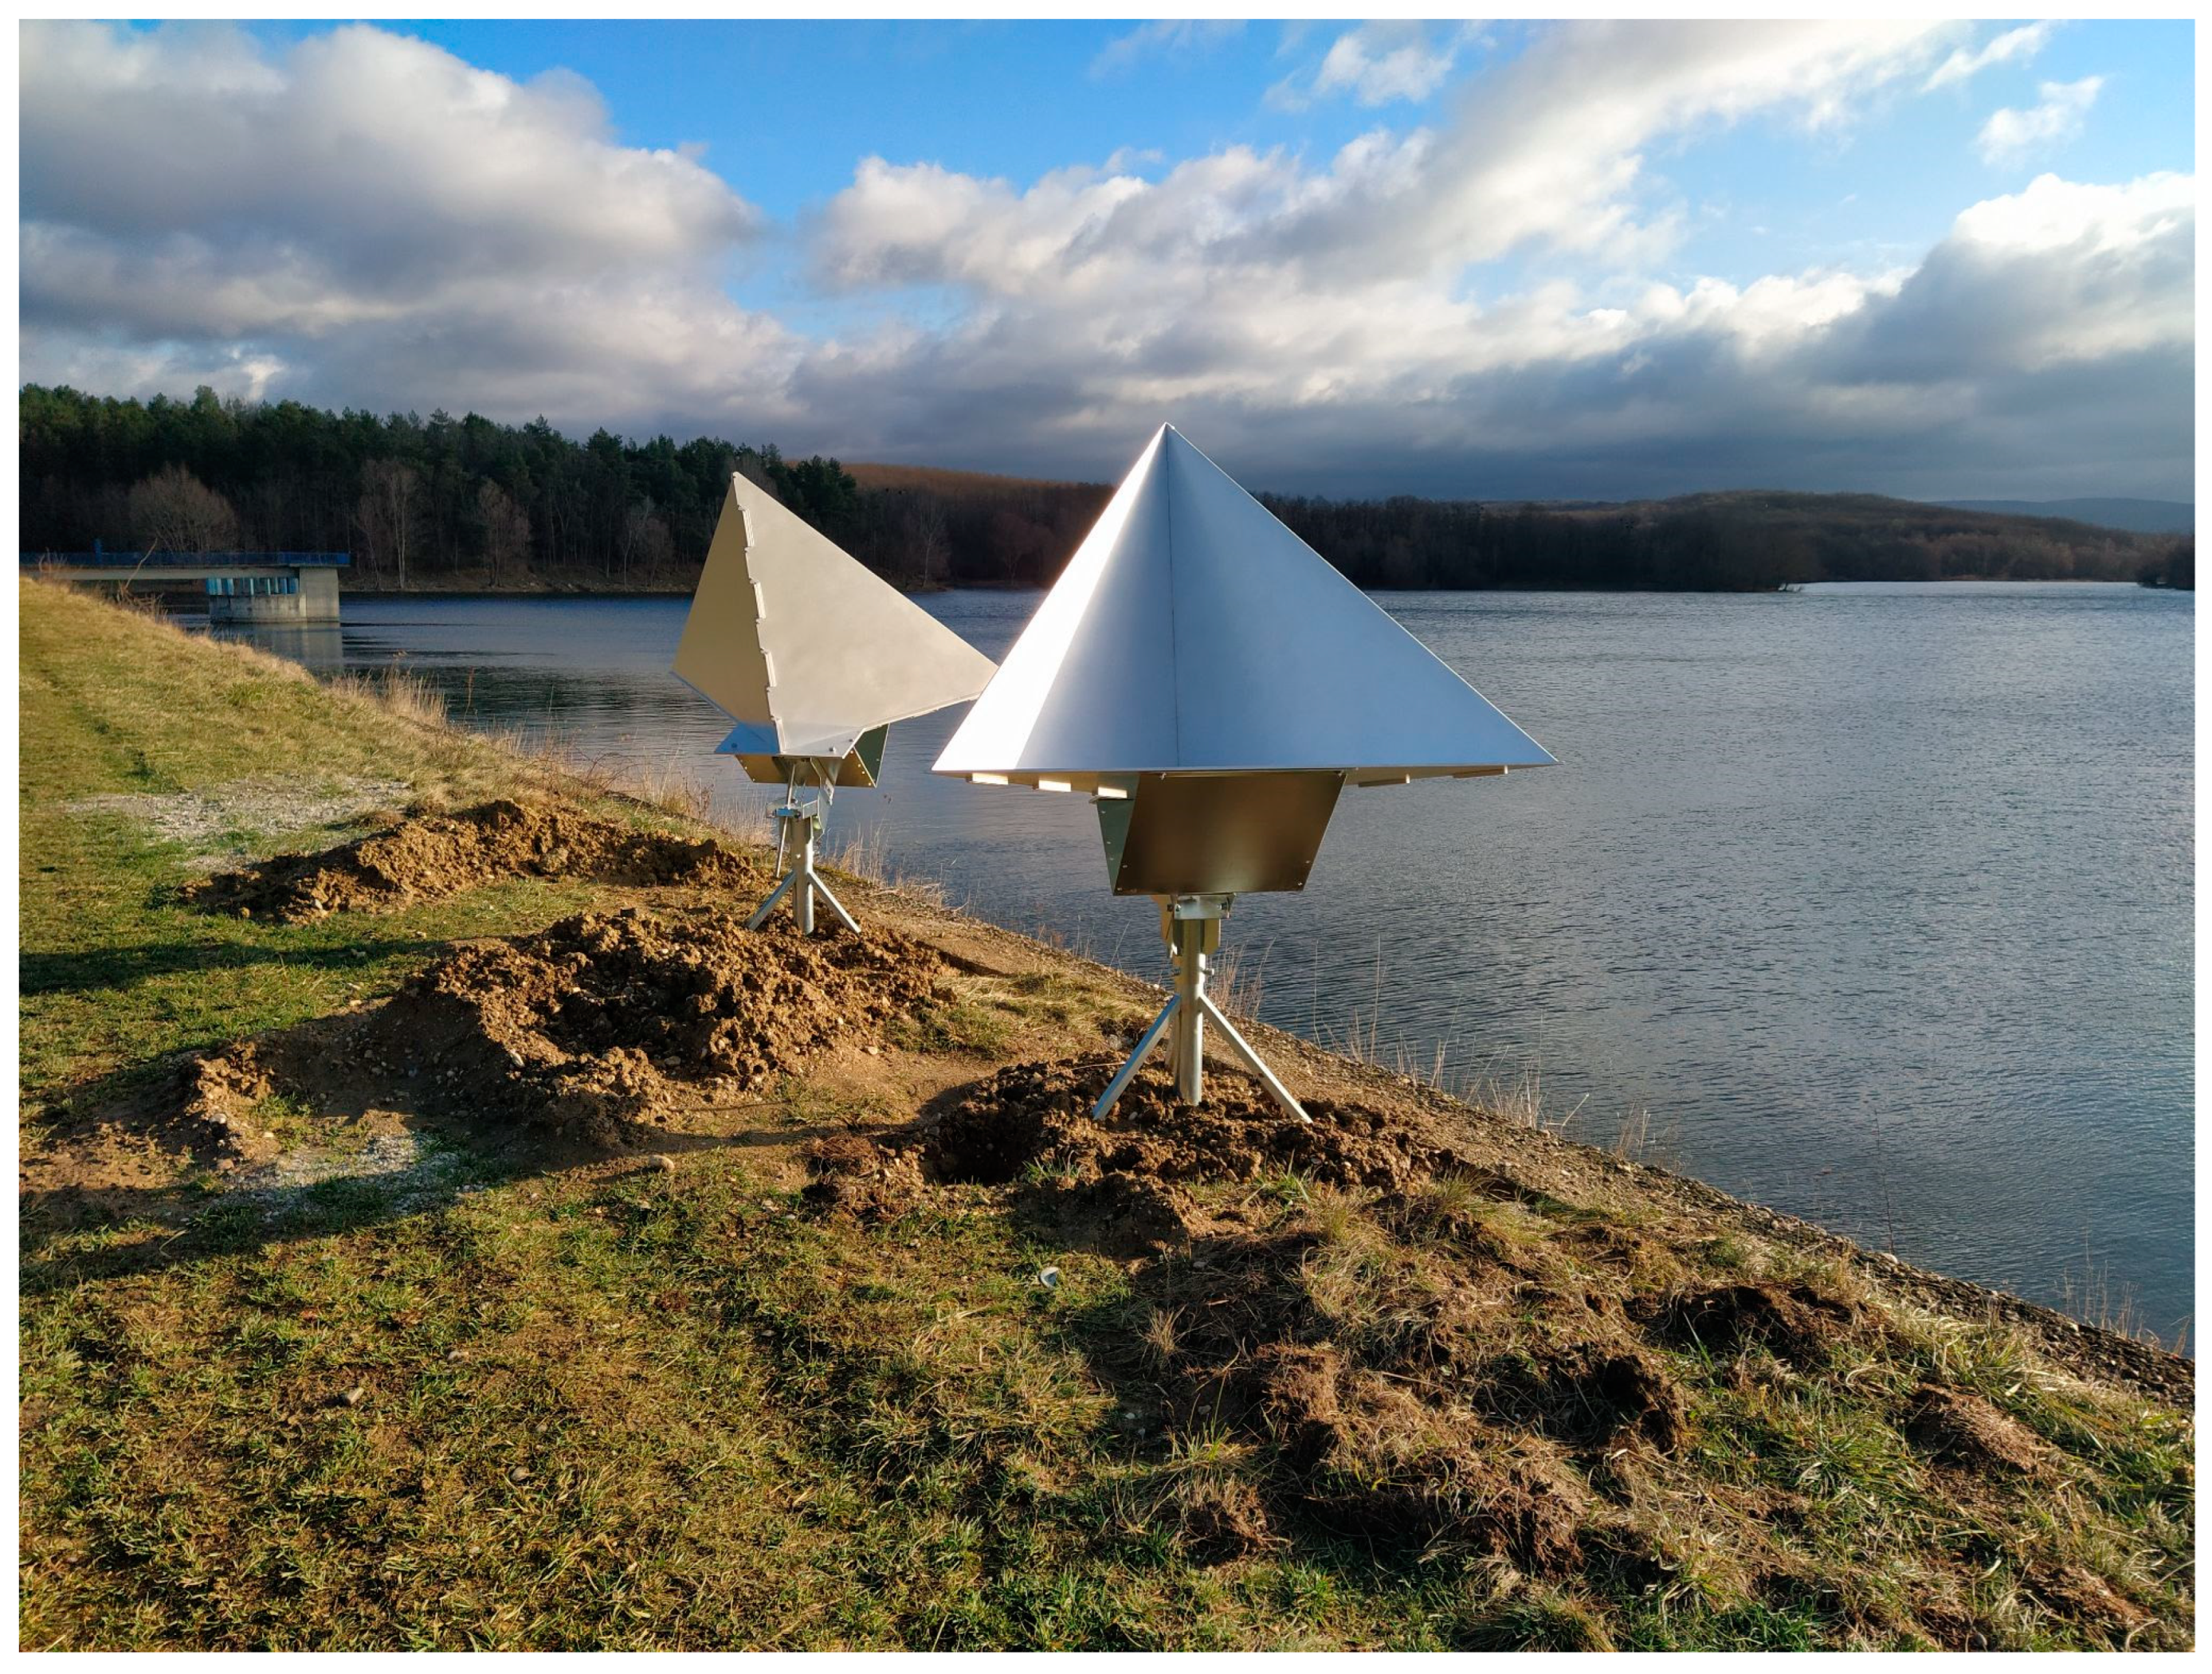
Upon further fieldwork at each location, it became apparent that from the 32 questionable sites, 10 objects could be improved leaving 22 sites where it was not possible. There were several reasons for this, for example, the small size of the object, or the presence of moving parts which limited the placement of the 2-metre diameter CRs. Other reasons included dense vegetation cover (with trees shading along the direction of ascending and descending geometry), or the site was under reconstruction. The relatively high price of CRs was another important aspect for the clients which limited the number of CRs. Overall, 24 single-sided CRs were allocated to 7 water facilities. Ideally CRs were installed towards both ascending and descending geometries (
Figure 6) at the same time, and a maximum of 3 CR pairs were installed for each site at different points of the structure. On some sites, however, only 1 CR was installed due to local site conditions. With correct CR installation, the number of the observable sites increased to 58, making up 70% of the total objects. The mean backscattering of the sites made it apparent that the minimum radar cross-section of each CR should not be lower than 36 dB, which also assisted with the final CR selection. Finally, the CR manufactured by Elital Srl provided the sufficient (36 dB) radar cross-section (RCS), while the CRs of other competitors remained far below that number.
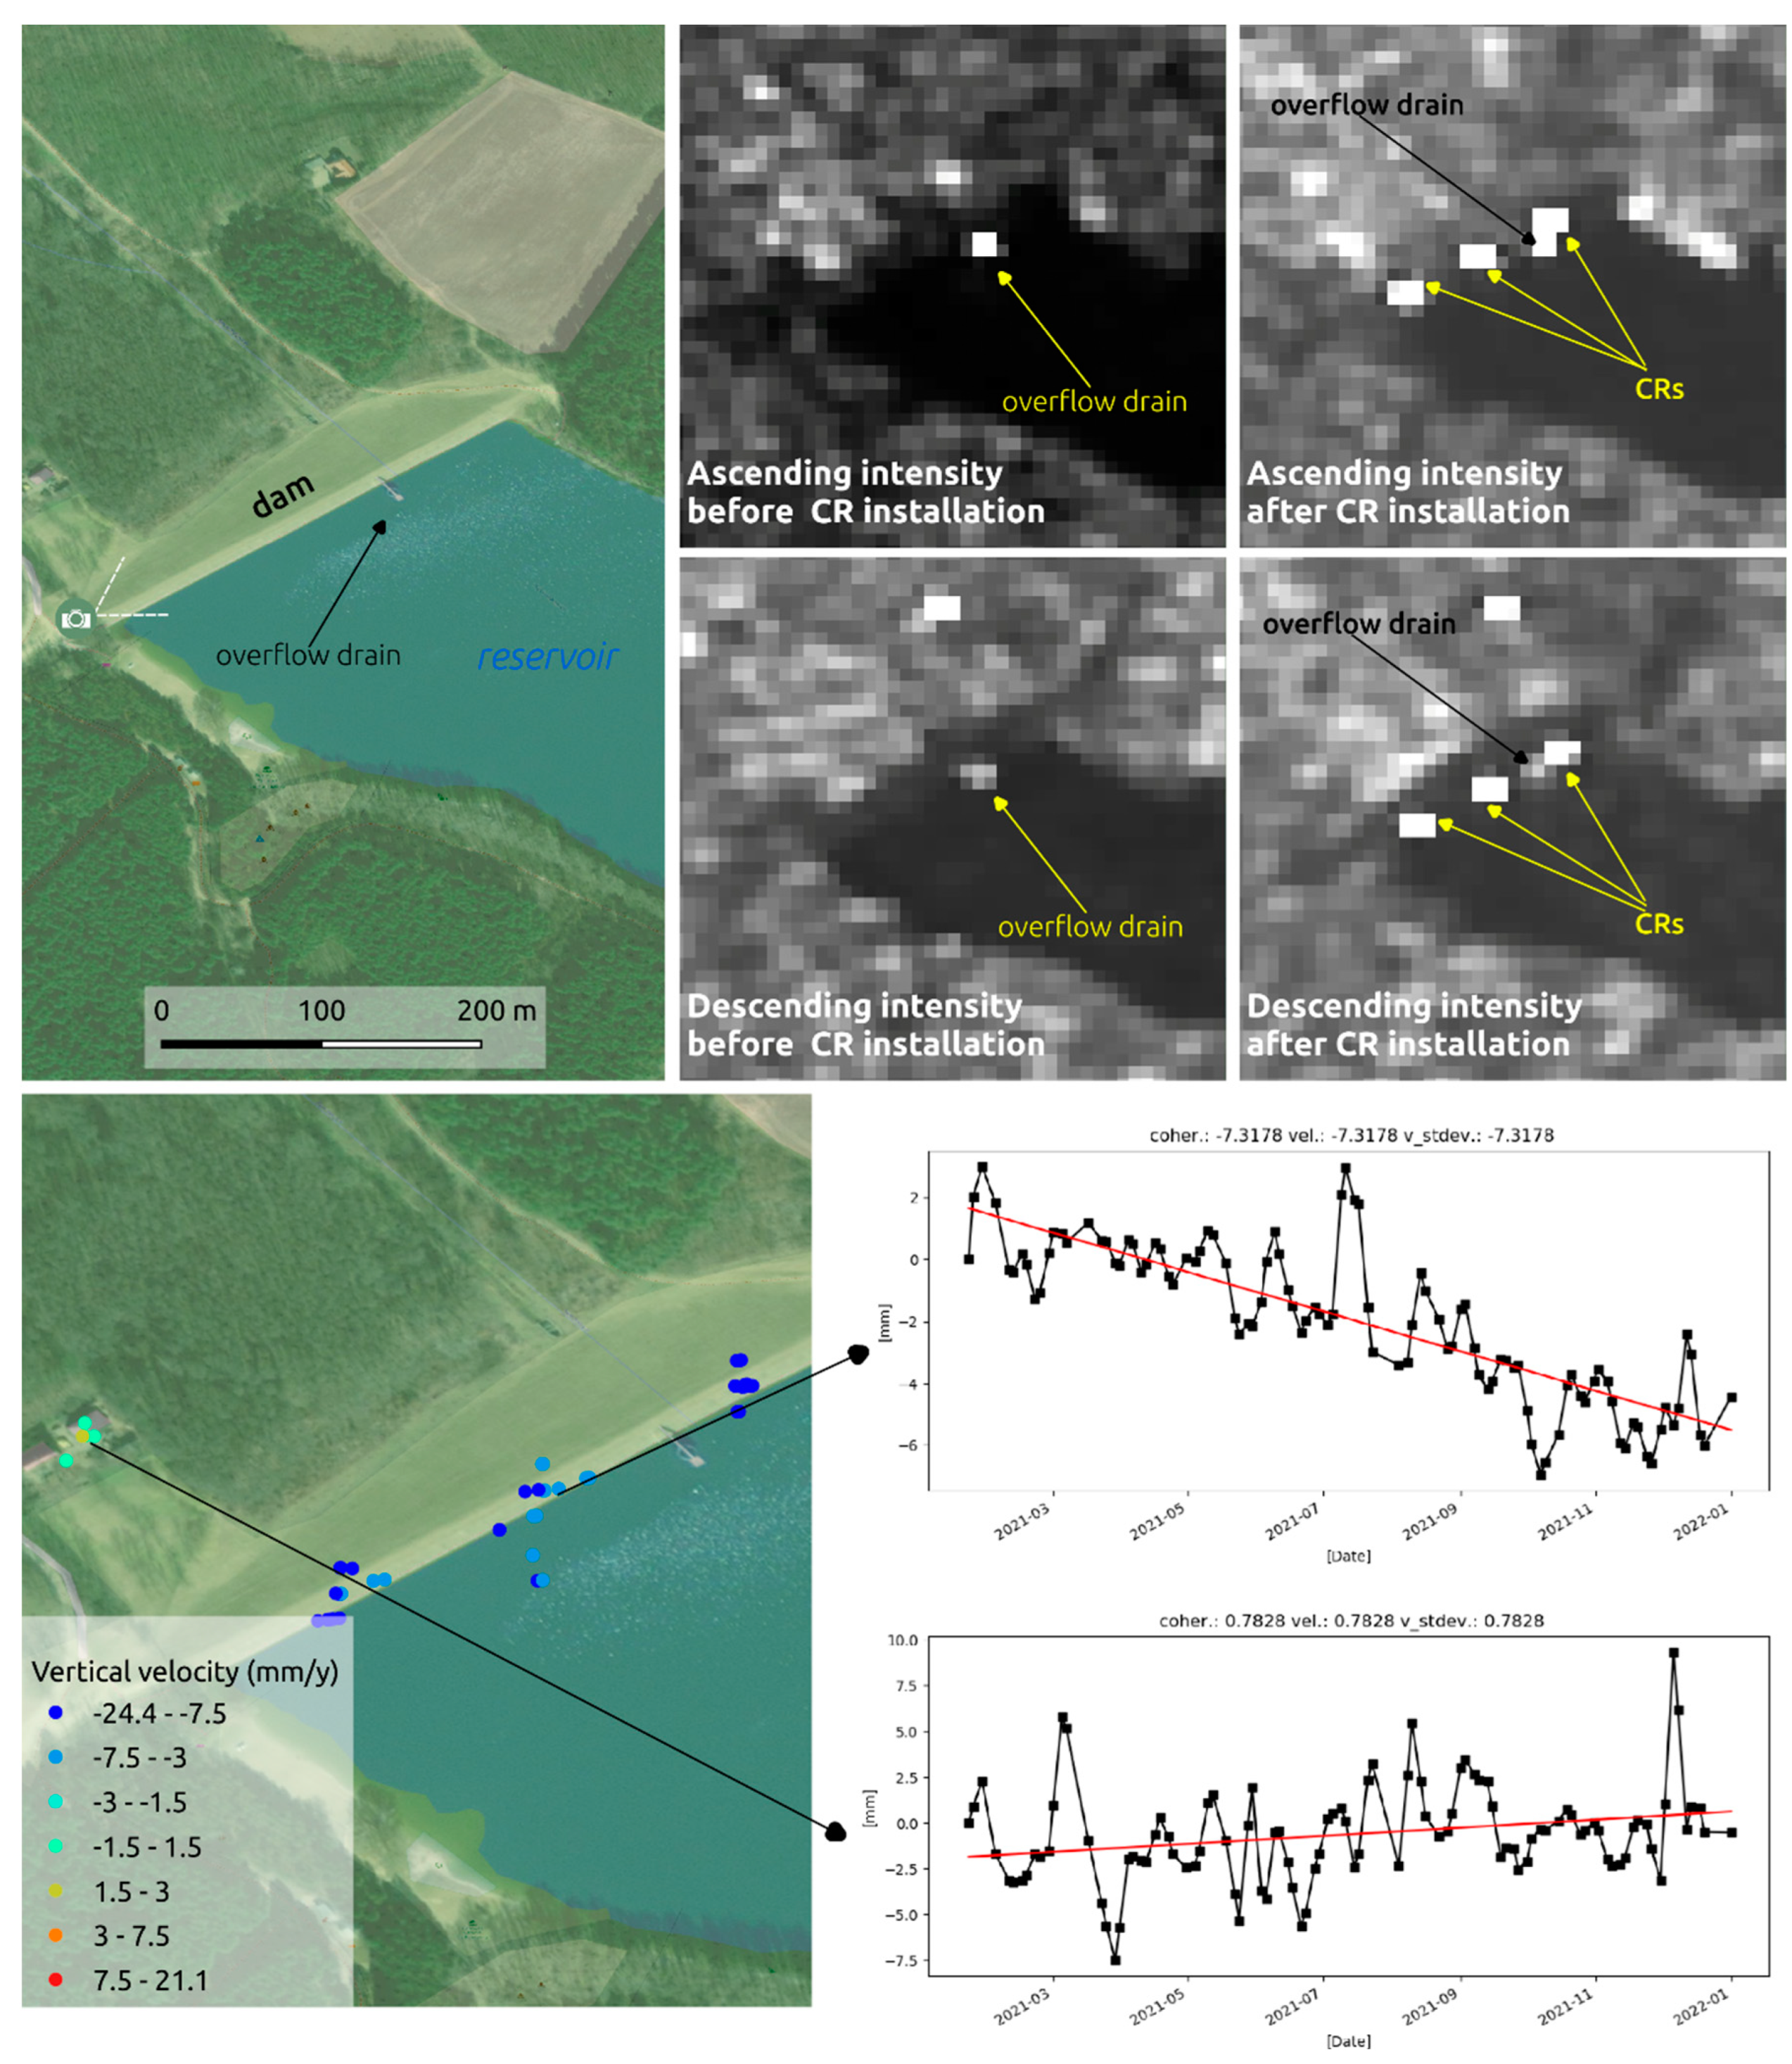
Figure 7 shows the vegetation on the earthworks (dam of a reservoir), where only the overflow drain provided higher coherence (and only in ascending geometry), and the grass surface of the object reflected an uncorrelated signal making it impossible to monitor the object. To compensate for this, three CR pairs, facing both ascending and descending S1 orbits, were installed on the crown of the dam which led to a significant improvement in the coherence (right side of the figure) and allowing the detection of the objects in both geometries. This made it possible to combine the measurements of both orbits and calculate the east–west and vertical displacements of CRs. The CRs on the top of the dam reflect continuous subsidence, however, this is due to the compaction of the soil after their installation.
3.2. System Development and Performance
The PS processing pipeline described earlier can process the S1 measurement within 24 h of the data being downloaded into the Hungarian Collaborative Ground Segment. This means that end-users receive any possible alarm notifications within a day of new S1 images being acquired. The processing time of the new Sentinel-1 data depends on several factors, the first being the available computational resources on the cluster machine. Although Kubernetes orchestrator checks this parameter, it does not specifically monitor the type of resources which are available (CPU or GPU). If there are enough processing units available, then the workflow will be triggered. GPU-supported processes are faster due to the implemented parallelization. Another determining factor of the processing time is unzipping the processing chain which is relatively time-consuming. Separate API analyses free ENVI and SARscape licenses, and if there are enough free instances then the workflow is initiated.
Different PS task methods (initial, incremental, combined) also have an impact on the processing time. It is important to highlight that the average area of the ROI’s is around 25 km2. Initial processing means that a full stack of new acquisitions is processed which takes 90–120 min during the initial modular testing, depending on GPU or CPU utilization. The incremental workflow covers those cases, when we have the preliminary results (from previous incremental or initial run) and the previous connection graph and interferograms of reference and secondary images are available, then only 15–30 min of processing time is needed. Combined workflow fuses ascending and descending geometry PS measurements in order to extract the vertical and horizontal components of the movements. This task is completed relatively quickly, taking about 2–3 min.
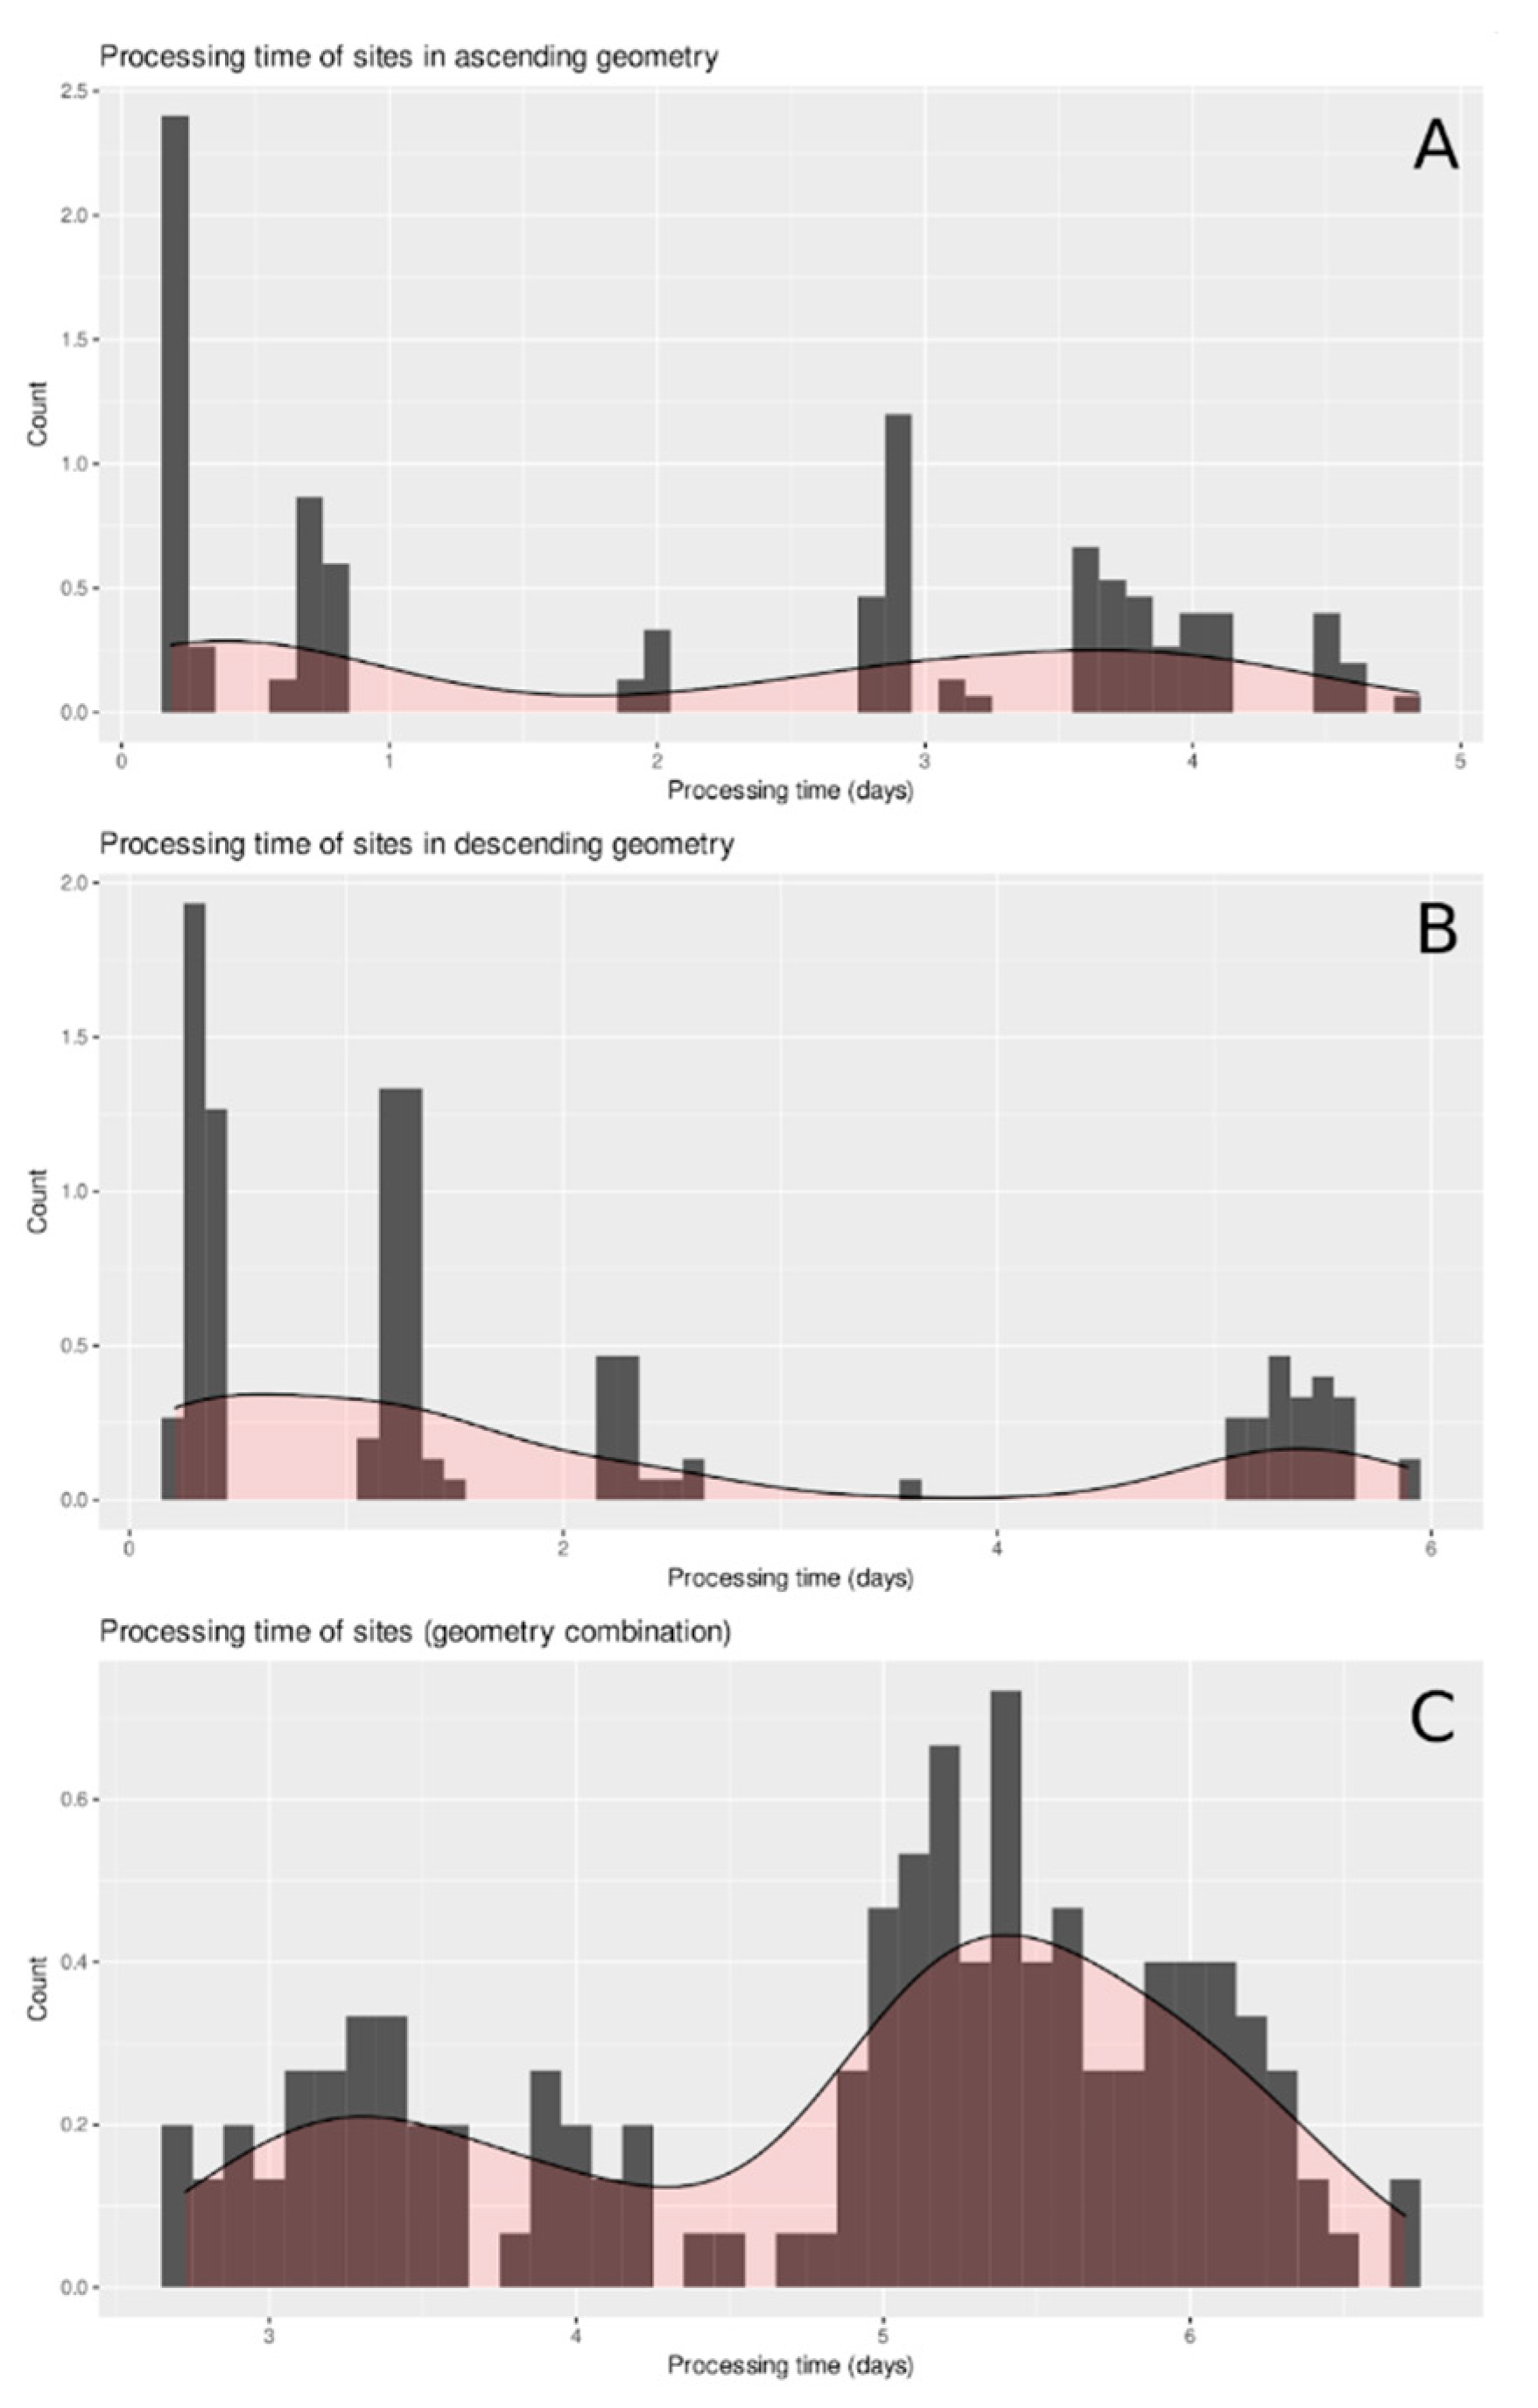
Taking into account the final performance test result of the system, it is obvious that the aforementioned processing times have been exceeded by the live system (
Figure 8 and
Table 1). Most of the PS processing has been finished within 1.9 and 2.1 days in ascending and descending data on average, while combination jobs of LOS data have taken ca. 5 days. It means that the system is capable of processing an acquisition before a new one arrives even in the worst cases, and it is also capable to calculate combined data in most cases. It should be also noted that the sampling of the live system was performed using several iterations and the performance significantly improves with time thanks to the fine-tuning procedure.
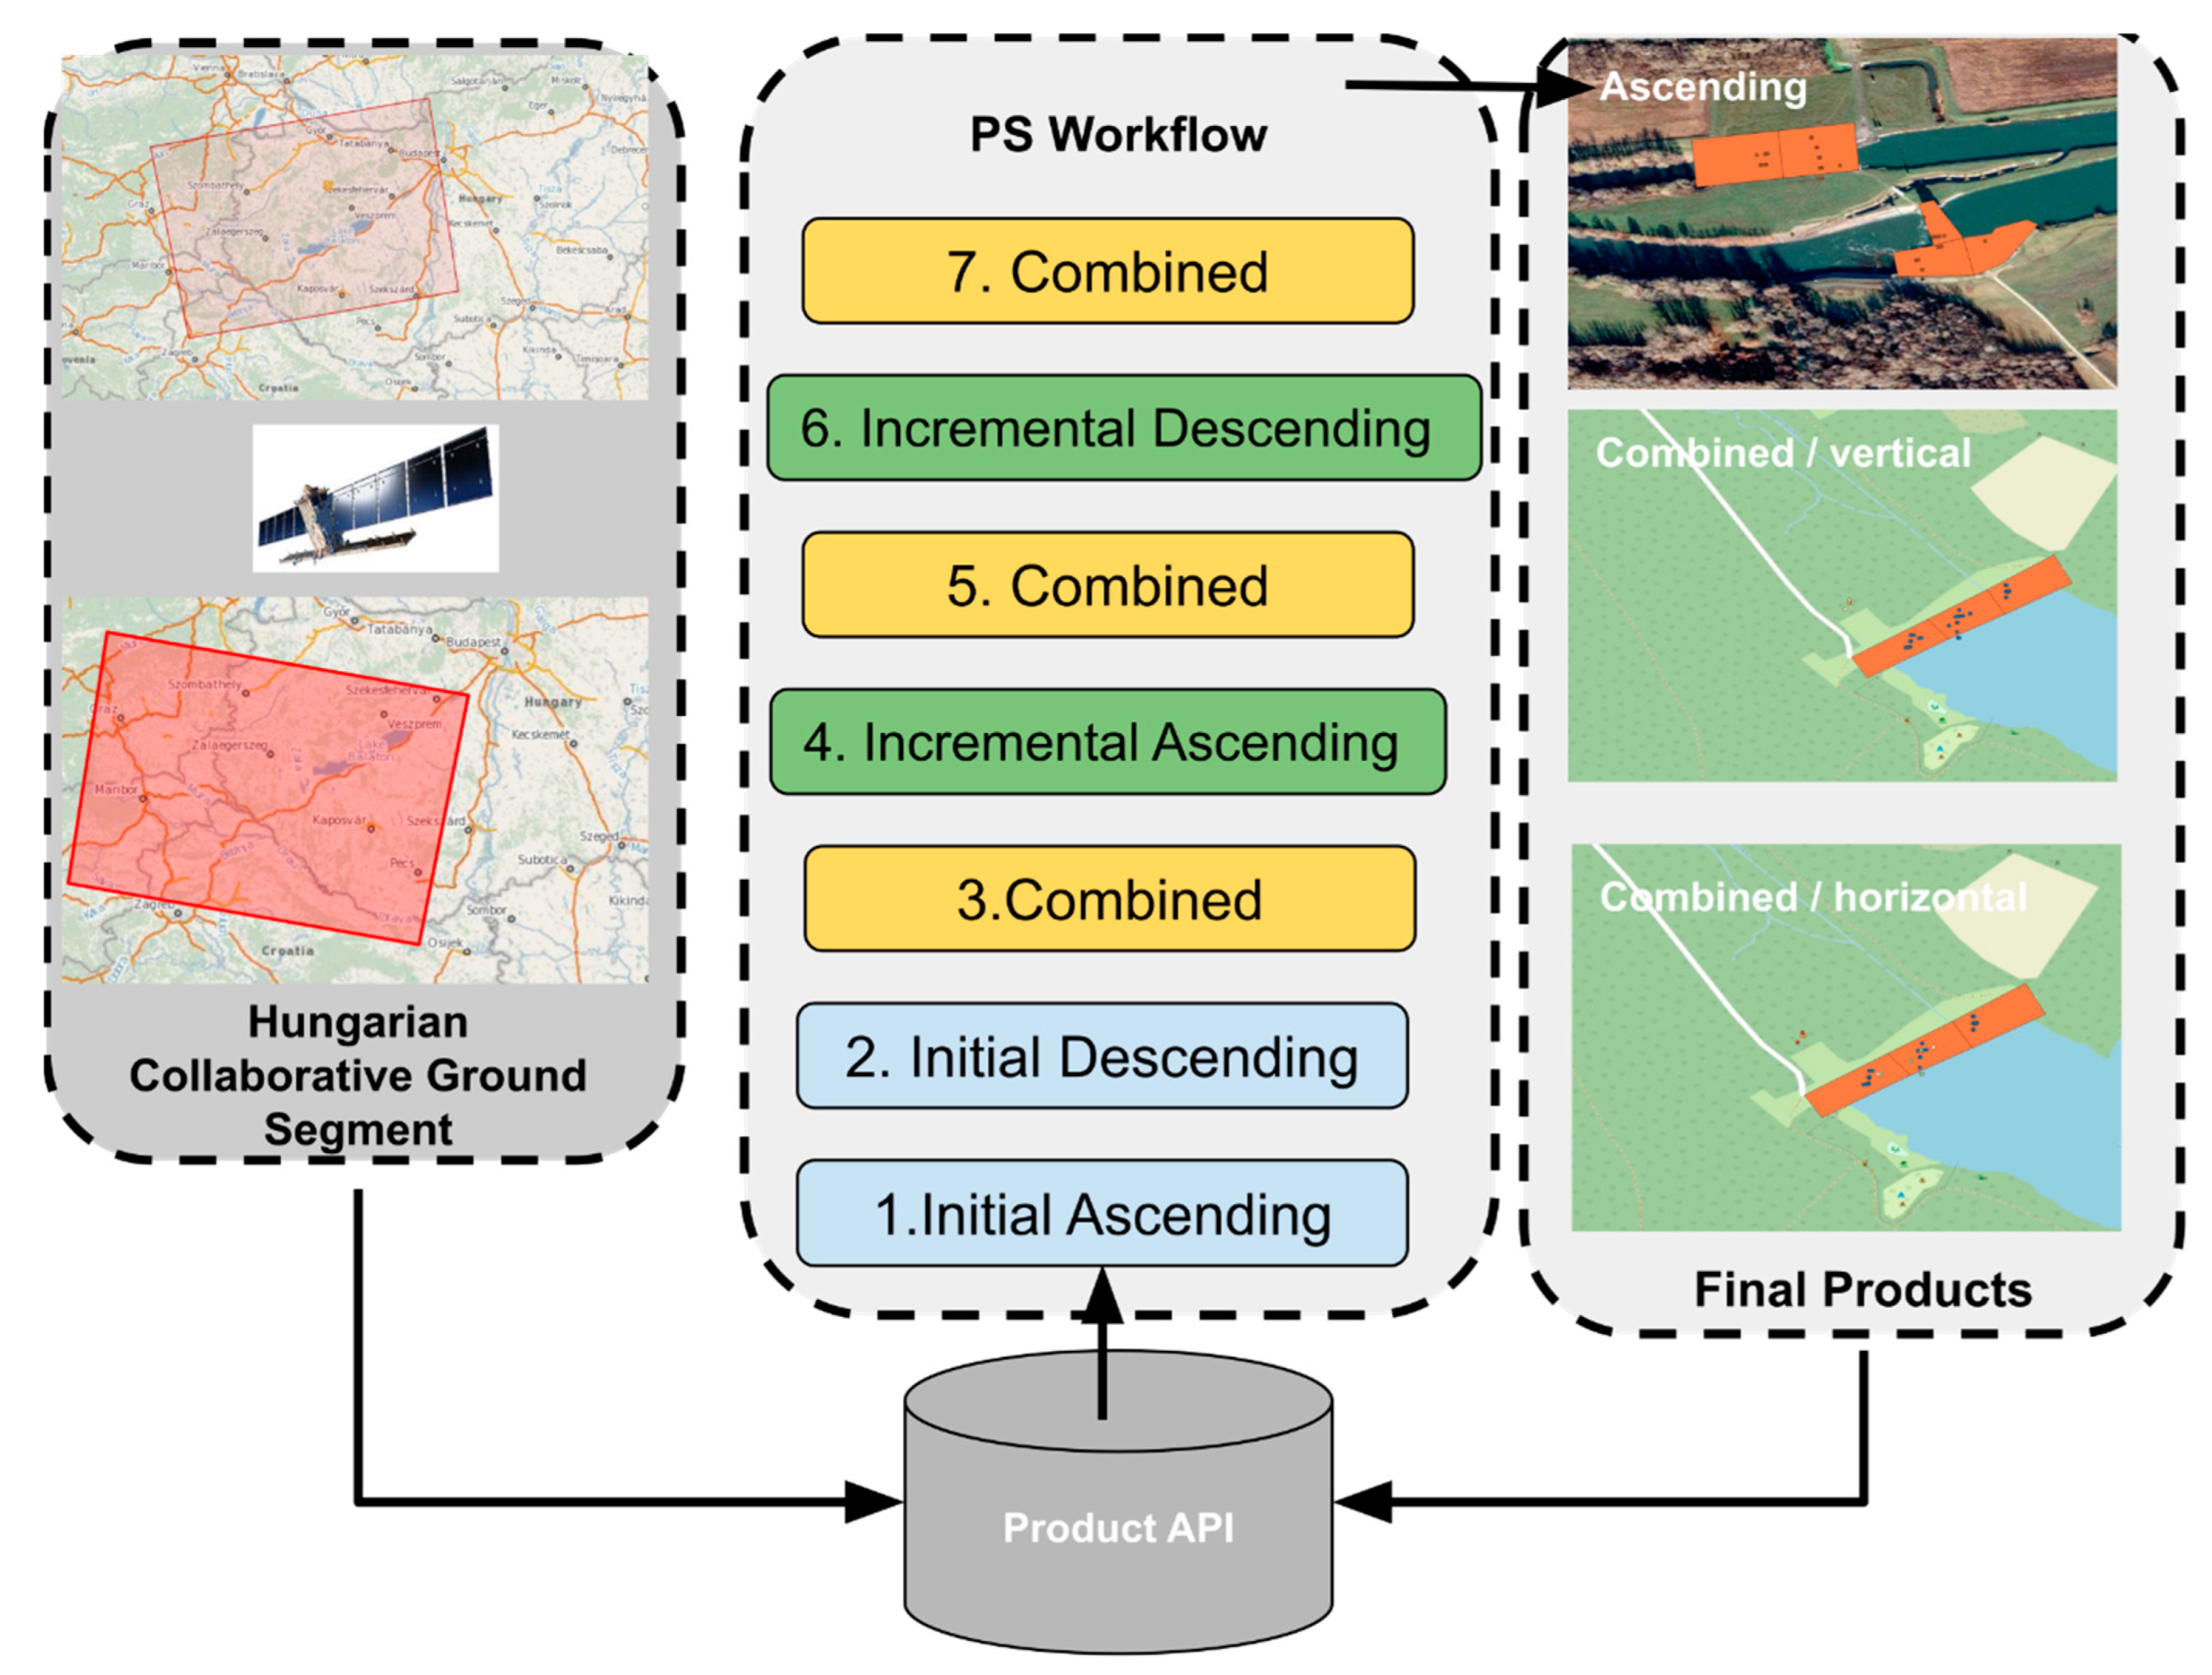
At this point, it is important to highlight that each site follows a special processing workflow. The sequence of PS processing is due to the time sliding window (TSW) period and the descending/ascending acquisition geometries. In every monitored area, the PS job starts with an initial ascending or descending process (
Figure 9), which follow each other (1–2). After the initial processing of ascending and descending geometry, a combined task is triggered (3). When a new image is available, an incremental ascending or descending workflow will follow the combined task, and after this incremental job, a combined task runs (4–7). If we set the TSW period to one year and new S1 images are available every 6 days, then after half a year (around the 50th job) the initial process will be executed (Sentinel-1B failure does not affect the processing chain). If for some reason, only ascending or descending S1 images can be used, the workflow still runs without issues, however, in this case, the combined workflow will not run, because only the results of one geometry are available.
3.3. Deployment of the Early Warning System
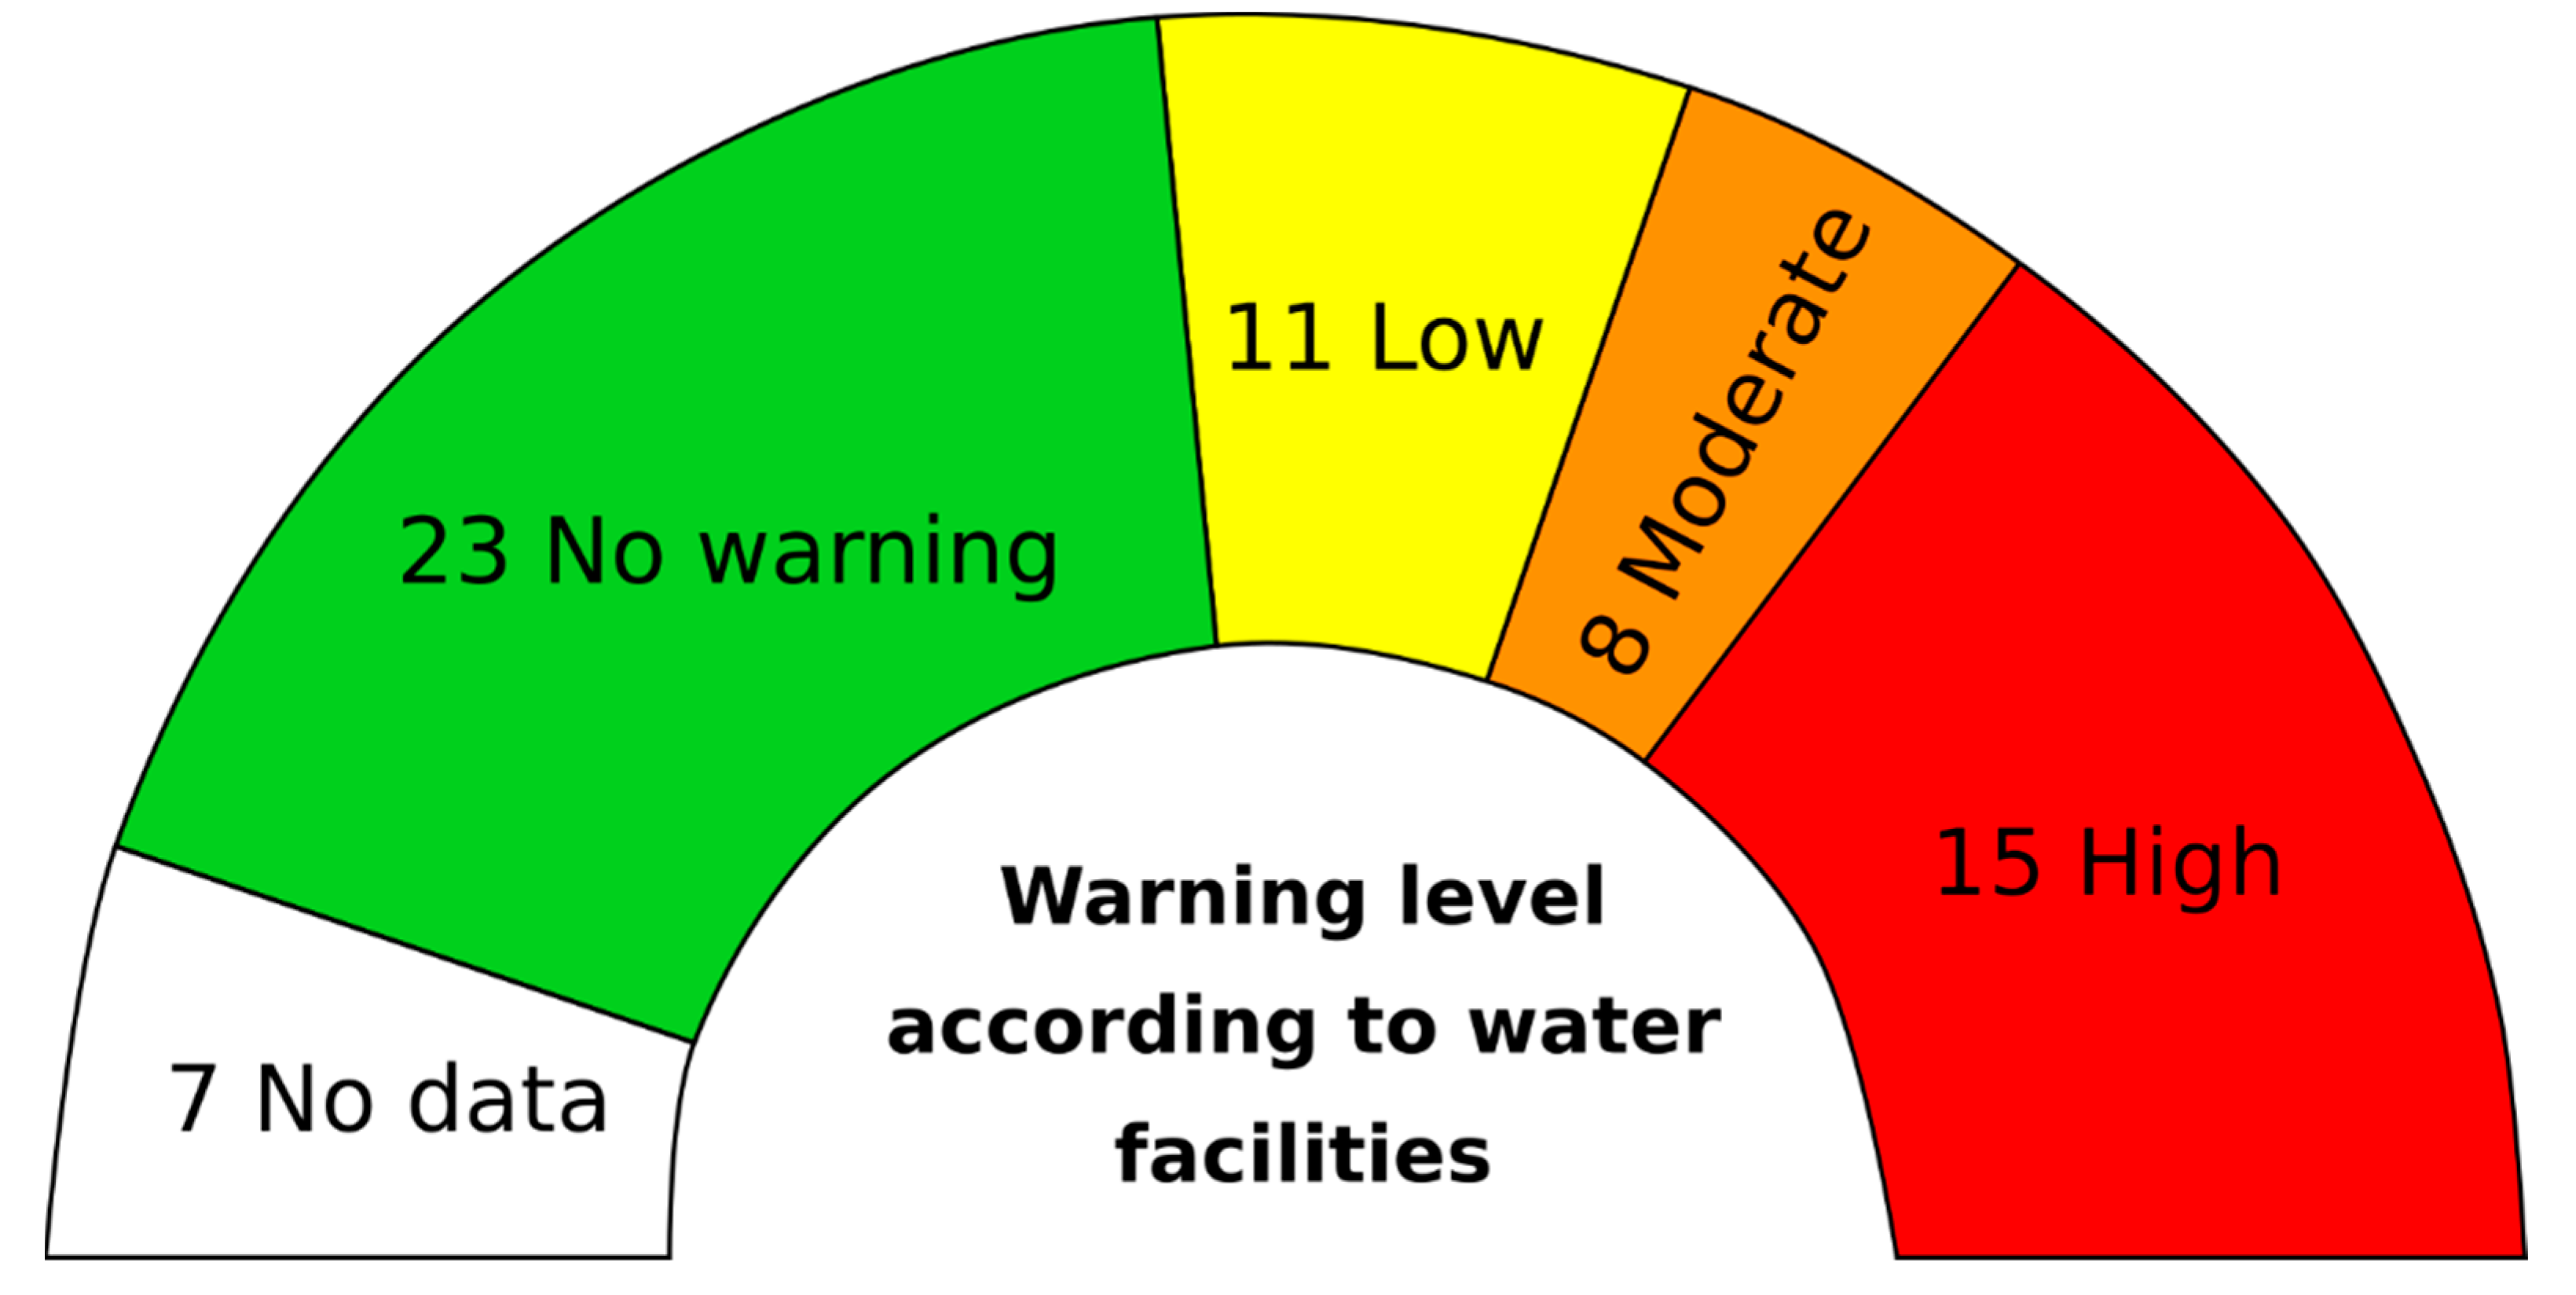
The headquarters of HDMS is the end-user of the system and is currently trialling this monitoring system. Preliminary results from the first year are shown in
Figure 10. Although this shows that a large number of water management objects are in the high-risk category, this does not reflect the real field conditions, since the facilities are known to be stable. It means that several aspects of the system (mainly the risk thresholds) are still in the validation and assessment phase. The validation procedure consists of multiple methodological approaches, the most important being comparing PS measurements with traditional levelling. On-site surveys and structural diagnostics are used in cases where significant displacement is measured by the PS monitoring system. Significant displacements are what overruns the displacement threshold defined by the scientific team of the system designers. These control processes allow more accurate threshold calibration for each object monitored. This validation process also provides a suitable basis for further legal regulation of the water management facilities.
The early warning system works as a preliminary “spatial decision support system”, and the results are treated accordingly. Currently, the annual geodetic survey is still the primary method to monitor these facilities.
One of the main results of the project was that the stakeholders clearly understood the advantage of InSAR based monitoring system and a legal process to reflect this has been initiated.
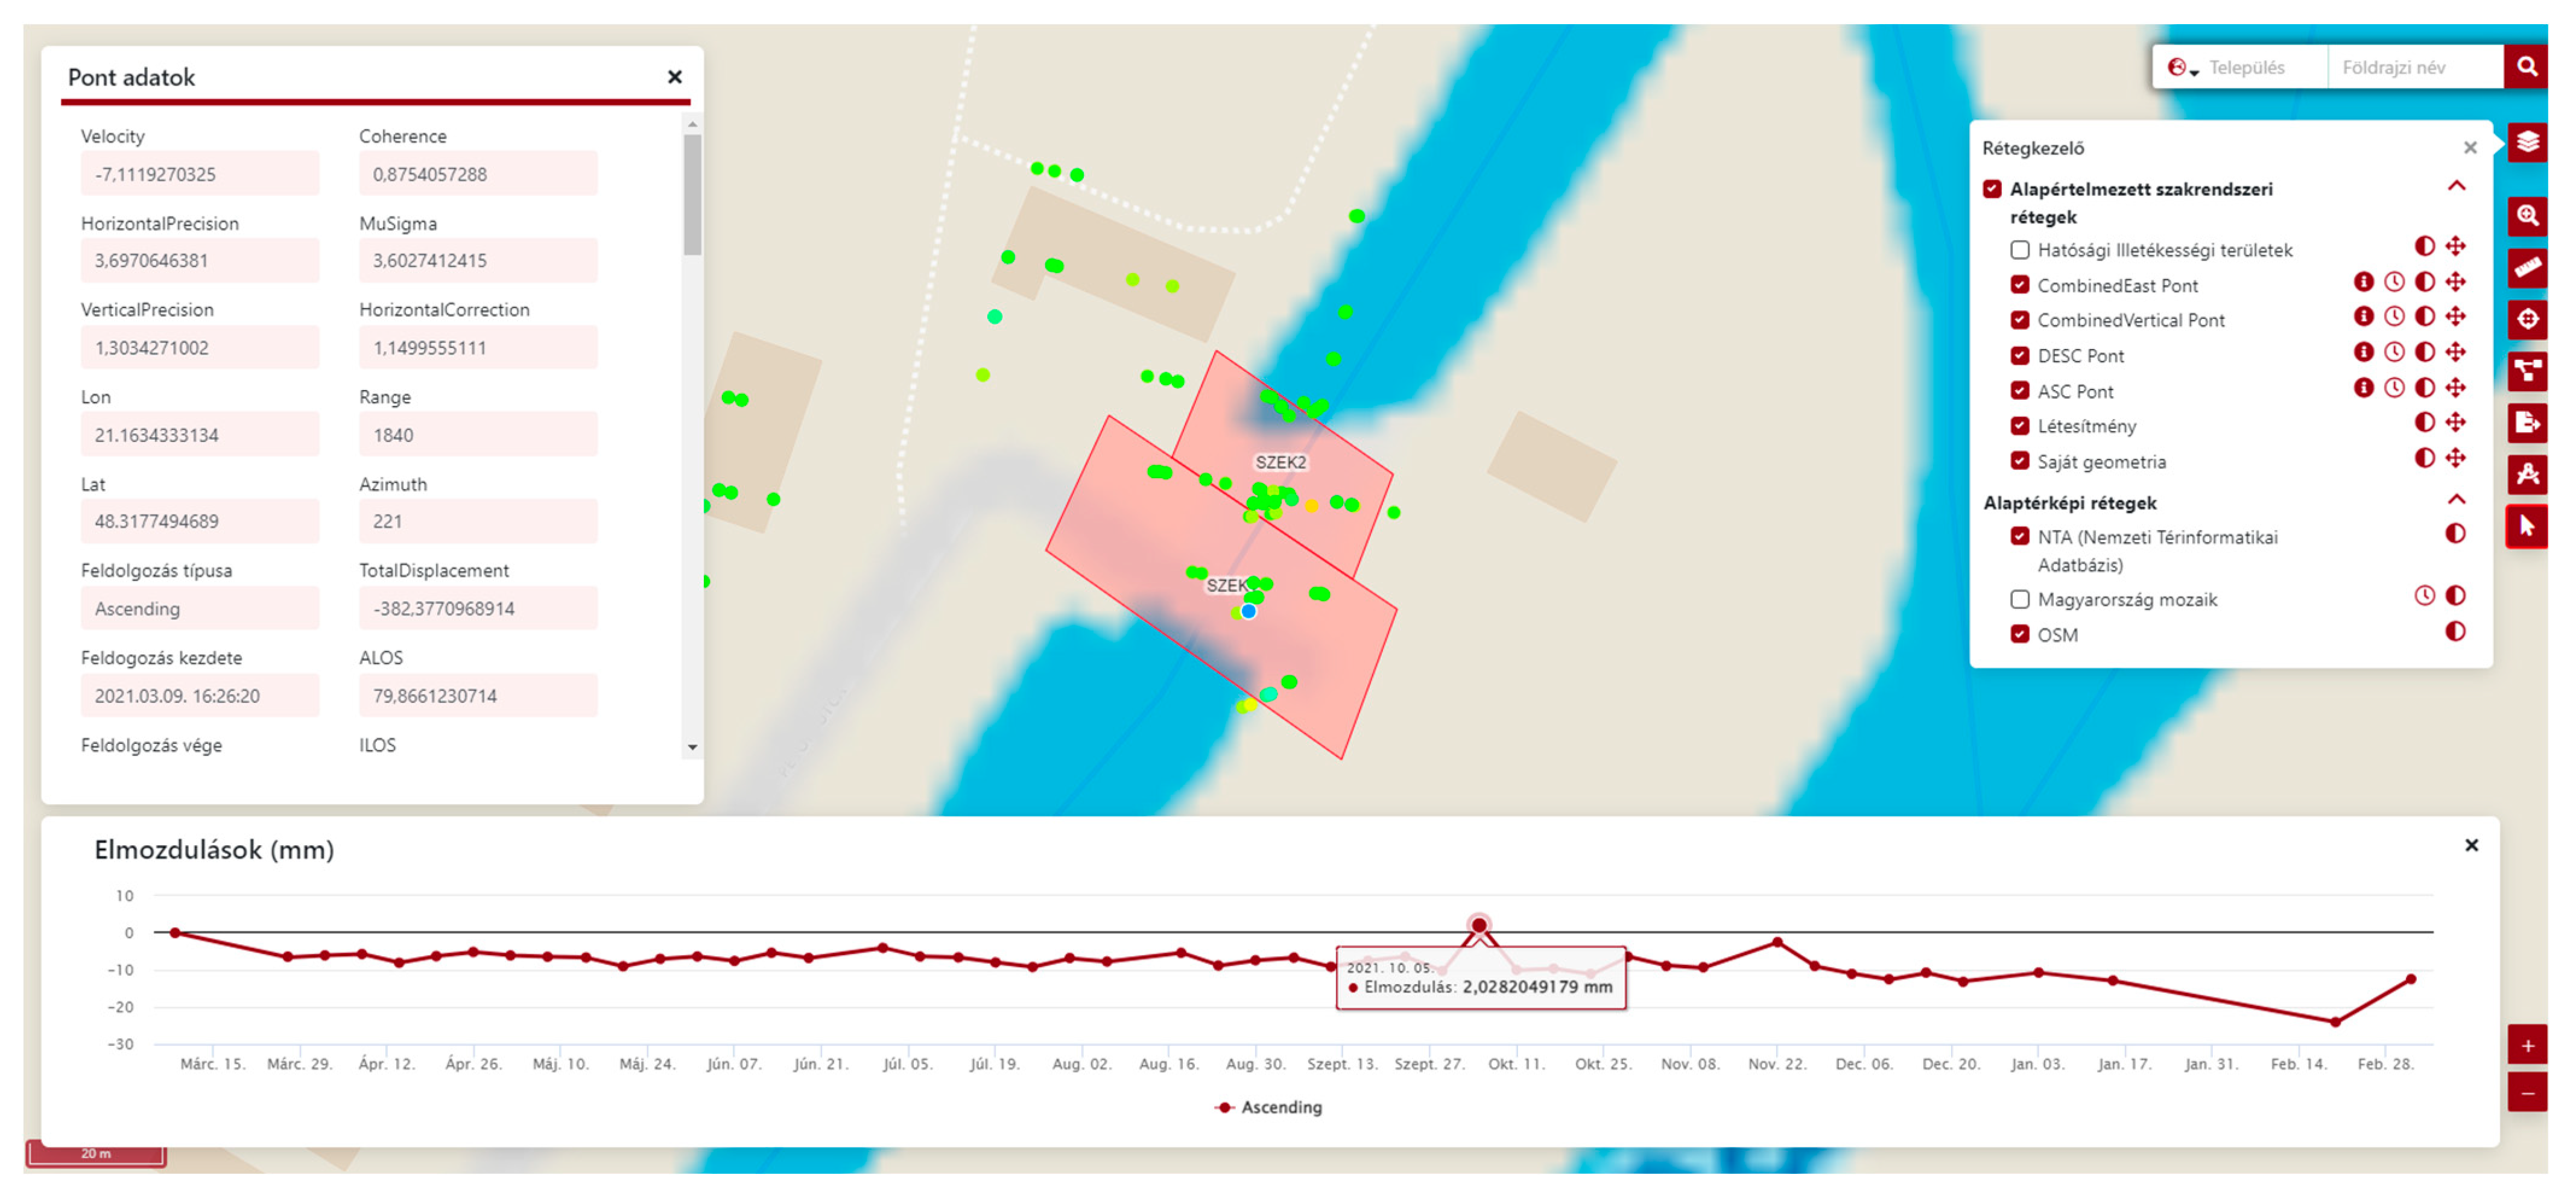
A further finding is that bigger structures, such as hydropower plants, weirs, sluices, and water treatment plants, which have a considerable number of PS points, would allow more complex analysis in the future. These bigger structures pose greater hydrological hazards than small installations. Although Sentinel-1 images are limited concerning small objects, they also pose a relatively small hazard from a disaster management viewpoint. This means that the Sentinel-1 sensor is capable of providing an officially acceptable solution for fully automated monitoring of critical infrastructure using free and open-source datasets. The system includes data processing, data transfer, backend warning system implementation, and GIS stack in order to create interactive online maps. The performance of the system satisfies the end-user requests and it creates a solid base for the country-wide continuous monitoring of water facilities. Thanks to the system design, high-resolution X-band acquisitions also can be processed if images are available. However, it requires the assistance of the operators. Each part of the system serves to fully utilize the Sentinel-1 monitoring system and make it more accessible for additional governmental implementation of InSAR technology. It is also important to highlight, that an easy to use, GIS-based user interface significantly improved the adoption of the system (
Figure 11).
One important aspect when designing the user interface was that the user can access all the relevant information on one screen. The dashboard-like design satisfies the user’s demands and ensures the exact site selection, and time-series display of the PS point, and also allows editing of the main parameters. An additional feature of the user interface is that the user is able to save the displacement data as a report file. In terms of user implementation, HDMS is particularly pleased with the new solution and is committed to making it fully operational over the next couple of years.
4. Discussion
Considering the development of the automated interferometric processing chain, several methodological approaches were formulated and described in the previous chapter. This section is dedicated to discussing the main cornerstones of the whole procedure, such as the role of the CRs, the system performance, the main questions of the early warning system and finally the role of the near real time processing in the light of the user requirements.
During the pre-processing phase of the work, it soon became obvious that even under the favourable conditions of the facilities (concrete structures, metal parts, etc.) only a limited number of the sites can be monitored without further on-site installations. The detectability of the facilities could only be improved by installing CRs, however, due to the high price of the devices and the limited budget, the site preparation for the CR site selection and installation required an enormous number of working hours and very careful planning. Considering the devices, their design is quite standard, and their size and weight vary according to the wavelength of the sensor and nearly the RCS of CRs differ. The limited number of manufacturers and the high standards required during manufacturing mean relatively high prices and fewer choices regarding the physical parameters of the CRs. However, only one CR placement was rejected due to the size of the CR and the lack of an empty place on the structure. Another solution could be the deployment of electronic CRs (ECR) where the space for the placement is limited but the price of ECRs are more than two times higher than the same of conventional CRs. Additionally, ECRs require regular maintenance, even if their batteries can last several months.
With the installation of the CRs 7 facilities appeared in the system. On the one hand, each CR produced more than one PS point at each geometry, which is unfortunate at the first glance (otherwise in a normal case we should receive only one PS/CR). On the other hand, the increased number of PS caused by the side lobes of the CRs, and their displacement trends are identical to the main lobe and do not have any negative effect on the warning system. However, finally, it should be taken into account that CRs reflect relatively significant displacements after their placement (therefore, higher warning levels) due to the soil compaction. Therefore, their signal should be carefully interpreted even months after their installation.
The operators requested that all the new incoming image has to be processed as soon as possible, therefore, we ran initial and final tests on the live system, to meet their requirements. Of course, the initial modular tests highly overperformed the processing times of the live system. As it was mentioned before, it is the result of many factors and with the finetuning of the system, processing times were reduced to a level, where SLC images can be processed and implemented to the time series before the next acquisition arrives. It shall be noted that with the failure of the Sentinel-1B (S1B), this feature is much less significant since the system must wait 12 days before the new acquisition. Furthermore, system performance always depends both on the hardware and the software and the former can easily be changed and, of course, processing times will change regarding the new hardware. Notwithstanding, the system shall be prepared for the launch of the upcoming S1B successor and later it shall be prepared to deal with new sensors (e.g., Sentinel-1 Next Generation [
51]), even sensors with different wavelengths (e.g., Rose-L [
52]) or higher resolution. However, it can be stated today that the present performance fits to the main user requirements and it is functioning with a reasonable performance.
One of the main outcomes of the system beyond the displacement data towards the user is the early warning system and its user interface. It plays an extremely important role in introducing the InSAR technology itself to the water facility operators and the authorities. As
Figure 10 suggests, that despite the careful setup of displacement threshold values, the warning system indicates 34 warnings from the low to high categories. We believe that most of them are false positives, and they are due to the lack of finetuning of thresholds. Warning signal-triggered field surveys can help to overcome this problem by ensuring that the structures are stable, and they can help to finetune the thresholds. The flexible user interface plays here an important role, where the users can maintain the pre-defined displacement values and finetune the system this way. Finetuning such a warning system is a long-lasting procedure but could help to protect these critical water facilities (emergency management aspect) and parallelly embed the InSAR technology in the decision-making procedures.
One of the main cornerstones was the “near real-time” processing capability of the system, which triggered long discussions during the system development. In the light of the system performance test, it is advantageous to tune the system towards the real-time processing from the technical perspective, since there are other processes in the present performance which can elongate PS processing times. Therefore, a more capable system (better hardware architecture and, e.g., GPU-based processing) can compensate for the delay caused by other ongoing processes. From the application point of view, the near real-time processing is less favourable or simply just not needed since a new single measurement cannot influence the measured general displacement trends (annual velocity). However, on the other hand, it is extremely useful to observe the temporal evolution of displacement velocities from time to time. These changes can also indicate changes in the behaviour of the structure. Hence, it shall be highlighted that the annual velocity of PS points is an important descriptor of the temporal behaviour of the points, which eliminates false alarms which could be triggered by fast jumps in the time series.
5. Conclusions
In this article, we have presented a comprehensive, fully automated, operational InSAR monitoring system and demonstrated the potential of a nearly real-time warning system for water facility management. The realization of this development is a result of numerous technical factors (large volume of Sentinel-1 data, High Performance Computing, GPU, cutting edge InSAR processing algorithms and complex solutions of SaaS). However, it is particularly important to also consider the practical aspects and accommodate specific requests from the end-user and those creating the system. Collaboration and constructive discussion of various users’ concerns and special technical conditions is the essence of an operational application. Our paper aims to make recommendations that improve the effectiveness of future dedicated InSAR monitoring systems.
First of all, a fully automated InSAR application without on-site fieldwork and considering the local conditions is complicated to adapt to the request of the end-users. Additionally, it is impossible for the specific end user to understand the potential of the Sentinel-1 InSAR monitoring system without initial pre-processing of the detected area. This step provides useful information on the planned service and highlights the system’s limitations. Sentinel-1 is an appropriate choice for a nationwide operational monitoring system of hydrological sites, especially if the targeted side is larger than 1000–5000 m2 and even more so if it is located near grassland close to a built-up area and oriented towards the ascending or descending orbit.
It is important to consider a detailed technical analysis of the whole system when we would like to install the operational Sentinel-1 data-based monitoring system. The number and distribution of the targeted objects, the total size of the detected area, and the observation frequency of the object all influence the required hardware demands. It is useful to categorise different constructions according to their structure, functionality, orientation, and surrounding environment to avoid incorrect interpretation of the PS results.
To set up a financial plan for the complete InSAR technology-based early warning system, it is essential to consider the following factors: the number of the sites, the extent of the targeted objects, distribution of the sites according to the relative orbits number, processing frequency, applied InSAR technology (PS or SBAS), commercial or open access SAR data, and automated or manual systems.
The authors of this article and those involved in the project are confident that InSAR technology will play an increasingly important role in the large-scale monitoring of important infrastructure. In particular, further development is required to ensure the safety of populations facing threats through increasingly ageing infrastructure and extreme conditions brought about through climate change.
Author Contributions
Conceptualization, P.P., A.Z.-H., G.T. and L.R.; Methodology, P.P., A.Z.-H., L.R. and I.P.K.; Software, P.P., L.R. and A.Z.-H.; Validation, I.P.K., D.M.K., Z.O. and L.R.; Formal Analysis, L.R.; Investigation, L.R.; Resources, M.D., P.P. and A.Z.-H.; Data Curation, L.R., Writing—Original Draft Preparation, I.P.K., L.R., A.Z.-H., D.M.K. and P.P.; Writing—Review and Editing, I.P.K., L.R., A.Z.-H., D.M.K. and P.P.; Visualization, L.R. and I.P.K.; Supervision, P.P.; Project Administration, D.M.K., I.P.K. and P.B.; Funding Acquisition, I.P.K. and P.B.; Corresponding Author, I.P.K. All authors have read and agreed to the published version of the manuscript.
Funding
The project has been supported by the Thematic Excellence Programme of the Ministry for Innovation and Technology in Hungary (TKP2020-NKA-04) projects.
Conflicts of Interest
The authors declare no conflict of interest.
Abbreviations
| API | Application Programming Interface |
| CCD | Coherence Timeline |
| CR | Corner Reflector |
| DAG | Directed Acyclic Graphs |
| EGMS | European Ground Motion Service |
| ESA | European Space Agency |
| FaaS | Function as a Service |
| FIR | Earth Observation Information System (in Hungarian: Földmegfigyelési Információs Rendszer) |
| GIS | Geographic Information System |
| GNSS | Global Navigation Satellite System |
| GPS | Global Positioning System |
| HDMS | Hungarian Disaster Management Service |
| InSAR | Synthetic Aperture Radar Interferometry |
| ITS | Intensity Time Series |
| OGC | Open Geospatial Consortium |
| PS | Permanent Scatterers |
| PSInSAR | Permanent Scatterers Interferometric SAR technique |
| REST | Representational State Transfer |
| ROI | Region of Interest |
| SaaS | System as a Service |
| SAR | Synthetic Aperture Radar |
| SBAS | Small-Baseline Subsets |
| TSW | Temporal Sliding Window |
| WFS | Web Feature Service |
| WMS | Web Mapping Service |
References
- Crosetto, M.; Solari, L.; Mróz, M.; Balasis-Levinsen, J.; Casagli, N.; Frei, M.; Oyen, A.; Moldestad, D.A.; Bateson, L.; Guerrieri, L.; et al. The Evolution of Wide-Area DInSAR: From Regional and National Services to the European Ground Motion Service. Remote Sens. 2020, 12, 2043. [Google Scholar] [CrossRef]
- Torres, R.; Snoeij, P.; Geudtner, D.; Bibby, D.; Davidson, M.; Attema, E.; Potin, P.; Rommen, B.; Floury, N.; Brown, M.; et al. GMES Sentinel-1 mission. Remote Sens. Environ. 2012, 120, 9–24. [Google Scholar] [CrossRef]
- Costantini, M.; Ferretti, A.; Minati, F.; Falco, S.; Trillo, F.; Colombo, D.; Novali, F.; Malvarosa, F.; Mammone, C.; Vecchioli, F.; et al. Analysis of surface deformations over the whole Italian territory by interferometric processing of ERS, Envisat and COSMO-SkyMed radar data. Remote Sens. Environ. 2017, 202, 250–275. [Google Scholar] [CrossRef]
- Raspini, F.; Bianchini, S.; Ciampalini, A.; Del Soldato, M.; Solari, L.; Novali, F.; Del Conte, S.; Rucci, A.; Ferretti, A.; Casagli, N. Continuous, semi-automatic monitoring of ground deformation using Sentinel-1 satellites. Sci. Rep. 2018, 8, 7253. [Google Scholar] [CrossRef] [PubMed] [Green Version]
- Dehls, J.F.; Larsen, Y.; Marinkovic, P.; Lauknes, T.R.; Stødle, D.; Moldestad, D.A. INSAR.No: A National InSAR Deformation Mapping/Monitoring Service in Norway—From Concept to Operations. In Proceedings of the IGARSS 2019–2019 IEEE International Geoscience and Remote Sensing Symposium, Yokohama, Japan, 28 July 2019–2 August 2019. [Google Scholar] [CrossRef]
- Emil, M.K.; Sultan, M.; Alakhras, K.; Sataer, G.; Gozi, S.; Al-Marri, M.; Gebremichael, E. Countrywide Monitoring of Ground Deformation Using InSAR Time Series: A Case Study from Qatar. Remote Sens. 2021, 13, 702. [Google Scholar] [CrossRef]
- Foumelis, M.; Delgado Blasco, J.M.; Brito, F.; Pacini, F.; Pishehvar, P. Snapping for Sentinel-1 Mission on Geohazards Exploitation Platform: An Online Medium Resolution Surface Motion Mapping Service. In Proceedings of the 2021 IEEE International Geoscience and Remote Sensing Symposium IGARSS, Brussels, Belgium, 11–16 July 2021. [Google Scholar] [CrossRef]
- Kalia, A.C.; Frei, M.; Lege, T. 2021—BodenBewegungsdienst Deutschland (BBD): Konzept, Umsetzung und Service-Plattform. Available online: https://geodaesie.info/zfv/heftbeitrag/8701 (accessed on 9 May 2022).
- Thollard, F.; Clesse, D.; Doin, M.-P.; Donadieu, J.; Durand, P.; Grandin, R.; Lasserre, C.; Laurent, C.; Deschamps-Ostanciaux, E.; Pathier, E.; et al. FLATSIM: The ForM@ Ter LArge-Scale Multi-Temporal Sentinel-1 InterferoMetry Service. Remote Sens. 2021, 13, 3734. [Google Scholar] [CrossRef]
- Toma, S.A.; Teleagă, D.; Poncoş, V.; Grozea, C. Ground Motion Patterns Analysis from the National Persistent Scatterer Deformation Map of Romania. In Proceedings of the 2021 IEEE International Geoscience and Remote Sensing Symposium IGARSS, Brussels, Belgium, 11–16 July 2021. [Google Scholar] [CrossRef]
- Kovács, I.P.; Bugya, T.; Czigány, S.; Defilippi, M.; Lóczy, D.; Riccardi, P.; Ronczyk, L.; Pasquali, P. How to avoid false interpretations of Sentinel-1A TOPSAR interferometric data in landslide mapping? A case study: Recent landslides in Transdanubia, Hungary. Nat. Hazards 2018, 96, 693–712. [Google Scholar] [CrossRef] [Green Version]
- Kovács, I.P.; Bugya, T.; Czigány, S.Z.; Defilippi, M.; Dobre, B.; Fábián, S.Á.; Lóczy, D.; Riccardi, P.; Ronczyk, L.E.; Pasquali, P.A. Monitoring landslides using C-band interferometry. A case study: Dunaszekcső Landslide, Southern Transdanubia, Hungary. Studia Geomorphol. Carpatho-Balc. 2018, 51, 87–105. [Google Scholar]
- Chen, X.; Achilli, V.; Fabris, M.; Menin, A.; Monego, M.; Tessari, G.; Floris, M. Combining Sentinel-1 Interferometry and Ground-Based Geomatics Techniques for Monitoring Buildings Affected by Mass Movements. Remote Sens. 2021, 13, 452. [Google Scholar] [CrossRef]
- Pasquali, P.; Cantone, A.; Riccardi, P.; Defilippi, M.; Ogushi, F.; Gagliano, S.; Tamura, M. Mapping of Ground Deformations with Interferometric Stacking Techniques; Land applications of radar remote, sensing; Holecz, F., Pasquali, P., Milisavljevic, N., Eds.; InTechOpen: London, UK, 2014; pp. 231–258. [Google Scholar] [CrossRef] [Green Version]
- Wang, Q.; Zhao, Q.; Ding, J.; Fedotov, A.A.; Badenkod, V.; Liu, M.; Pepe, A. Investigation of the ground displacement in Saint Petersburg, Russia, using multiple-track differential synthetic aperture radar interferometry. Int. J. Appl. Earth Obs. Geoinf. 2020, 87, 102050. [Google Scholar] [CrossRef]
- Ferretti, A. Satellite InSAR Data. Reservoir Monitoring from Space; EAGE Publications: Bunnik, The Netherlands, 2014; p. 160. [Google Scholar]
- Sowter, A.; Bin Che Amata, M.; Cignab, F.; Marsha, S.; Athaba, A.; Alshammaria, L. Mexico City land subsidence in 2014–2015 with Sentinel-1 IW TOPS: Results using the Intermittent SBAS (ISBAS) technique. Int. J. Appl. Earth Obs. Geoinf. 2016, 52, 230–242. [Google Scholar] [CrossRef]
- Cerchiello, V.; Tessari, G.; Velterop, E.; Riccardi, P.; Defilippi, M.; Pasquali, P. Building Damage Risk by Modeling Interferometric Time Series. IEEE Geosci. Remote Sens. Lett. 2017, 14, 509–513. [Google Scholar] [CrossRef]
- Nappo, N.; Peduto, D.; Polcari, M.; Livio, F.; Ferrario, M.F.; Comerci, V.; Stramondo, S.; Michetti, A.M. Subsidence in Como historic centre (northern Italy): Assessment of building vulnerability combining hydrogeological and stratigraphic features, Cosmo-SkyMed InSAR and damage data. Int. J. Disaster Risk Reduct. 2021, 56, 102115. [Google Scholar] [CrossRef]
- Du, Z.; Ge, L.; Hay-Man Ng, A.; Zhu, Q.; Horgan, F.G.; Zhang, Q. Risk assessment for tailings dams in Brumadinho of Brazil using InSAR time series approach. Sci. Total Environ. 2020, 717, 137125. [Google Scholar] [CrossRef]
- Lazecky, M.; Hlavacova, I.; Bakon, M.; Papco, J.; de Sousa, J.J.M.; Kolomaznik, J. Satellite InSAR Applicability for Monitoring Bridge Deformations. In Maintenance, Monitoring, Safety, Risk and Resilience of Bridges and Bridge Networks; Bittencourt, T.N., Frangopol, D.M., Beck, A.T., Eds.; CRC Press: Boca Raton, FL, USA, 2016. [Google Scholar] [CrossRef]
- Biondi, F.; Addabbo, P.; Liberata Ullo, S.; Clemente, C.; Orlando, D. Perspectives on the Structural Health Monitoring of Bridges by Synthetic Aperture Radar. Remote Sens. 2020, 12, 3852. [Google Scholar] [CrossRef]
- Macchiarulo, V.; Milillo, P.; Blenkinsopp, C.; Reale, C.; Giardina, G. Multi-temporal InSAR for transport infrastructure monitoring: Recent trends and challenges. Proc. Inst. Civ. Eng.-Bridge Eng. 2022, 175, 1–26. [Google Scholar] [CrossRef]
- Riccardi, P.; Tessari, G.; Lecci, D.; Floris, M.; Pasquali, P. Use of Sentinel-1 SAR data to monitor Mosul dam vulnerability. In Geophysical Research Abstracts; EGU2017-13098; European Geosciences Union General Assembly: Vienna, Austria, 2017; Volume 19. [Google Scholar]
- Tong, X.; Sandwell, D.T.; Smith-Konter, B. High resolution interseismic velocity data along the San Andreas Fault from GPS and InSAR. J. Geophys. Res. Solid Earth 2013, 118, 369–389. [Google Scholar] [CrossRef] [Green Version]
- Weiss, J.R.; Walters, R.J.; Morishita, Y.; Wright, T.J.; Lazecky, M.; Wang, H.; Hussain, E.; Hooper, A.J.; Elliott, J.R.; Rollins, C. High-resolution surface velocities and strain for Anatolia from Sentinel-1 InSAR and GNSS data. Geophys. Res. Lett. 2020, 47, e2020GL087376. [Google Scholar] [CrossRef]
- Xu, X.; Sandwell, D.T.; Klein, E.; Bock, Y. Integrated Sentinel-1 InSAR and GNSS Time-Series Along the San Andreas Fault System. J. Geophys. Res. Solid Earth 2021, 126, e2021JB022579. [Google Scholar] [CrossRef]
- European Ground Motion Service (EGMS) White Paper. Available online: https://land.copernicus.eu/user-corner/technical-library/egms-white-paper (accessed on 11 April 2022).
- The Intergovernmental Panel on Climate Change—IPCC2021. Available online: https://www.ipcc.ch/report/sixth-assessment-report-working-group-i/ (accessed on 9 May 2022).
- 2021: Summary Progress Update 2021: SDG 6—Water and Sanitation for All; UN Water: Geneva, Switzerland, 2021; Available online: https://www.unwater.org/app/uploads/2021/12/SDG-6-Summary-Progress-Update-2021_Version-July-2021a.pdf (accessed on 9 May 2022).
- EPA—The United States Environmental Protection Agency—Climate Change Adaptation Resource Center (ARC-X). Climate Impacts on Water Utilities. Available online: https://www.epa.gov/arc-x/climate-impacts-water-utilities#source (accessed on 9 May 2022).
- Borics, G.; Ács, É.; Boda, P.; Boros, E.; Erős, T.; Grigorszky, I.; Kiss, K.T.; Lengyel, S.; Reskóné, N.M.; Somogyi, B.; et al. Water bodies in Hungary—An overview of their management and present state. Hung. J. Hydrol. 2016, 96, 57–67. [Google Scholar]
- Lóczy, D. The Danube: Morphology, Evolution, and Environmental Issues. In Large Rivers; Gupta, A., Ed.; John Wiley: Chichester, NY, USA, 2022; pp. 335–367. [Google Scholar]
- Balatonyi, L.; Lengyel, B.; Berger, Á. Nature-based solutions as water management measures in Hungary. Mod. Geográfia 2022, 17, 73. [Google Scholar] [CrossRef]
- Andrásfalvy, B. A Duna Mente Népének Ártéri Gazdálkodása; Ekvilibrium: Budapest, Hungary, 2014; p. 438. [Google Scholar]
- Balatonyi, L.; Ligetvári, K.; Tóth, L.; Berger, Á. Water resources management and its homeland security aspect in Hungary. Sci. Secur. 2021, 2, 519–528. [Google Scholar] [CrossRef]
- Schweitzer, F. Strategy or disaster: Flood prevention-related issues and actions in the Tisza River Basin. Hung. Geogr. Bull. 2009, 58, 3–17. [Google Scholar]
- Ferro, A.; Brunner, D.; Bruzzone, L.; Lemoine, G. On the Relationship Between Double Bounce and the Orientation of Buildings in VHR SAR Images. IEEE Geosci. Remote Sens. Lett. 2011, 8, 612–616. [Google Scholar] [CrossRef]
- Ferretti, A.; Prati, C.; Rocca, F. Permanent scatterers in SAR interferometry. Trans. Geosci. Remote Sens. 2001, 39, 8–20. [Google Scholar] [CrossRef]
- Wu, J.; Wu, M.; Li, H.; Li, L.; Li, L. A Serverless-Based, On-the-Fly Computing Framework for Remote Sensing Image Collection. Remote Sens. 2022, 14, 1728. [Google Scholar] [CrossRef]
- Arjona, A.; Lópeza, P.G.; Sampéa, J.; Slominskib, A.; Villardb, L. Triggerflow: Trigger-based orchestration of serverless workflows. Future Gener. Comput. Syst. 2021, 124, 215–229. [Google Scholar] [CrossRef]
- Wang, Z.; Liu, H.; Han, L.; Huang, L.; Wang, K. Research and Implementation of Scheduling Strategy in Kubernetes for Computer Science Laboratory in Universities. Information 2021, 12, 16. [Google Scholar] [CrossRef]
- Zaragozí, B.M.; Trilles, S.; Navarro-Carrión, J.T. Leveraging Container Technologies in a GIScience Project: A Perspective from Open Reproducible Research. ISPRS Int. J. Geo.-Inf. 2020, 9, 138. [Google Scholar] [CrossRef] [Green Version]
- Merkel, D. Docker: Lightweight Linux containers for consistent development and deployment. Linux J. 2014, 239, 2. [Google Scholar]
- GitLab. Available online: https://www.gitlab.com (accessed on 27 April 2022).
- Garthwaite, M.C.; Nancarrow, S.; Hislop, A.; Thankappan, M.; Dawson, J.H.; Lawrie, S. The Design of Radar Corner Reflectors for the Australian Geophysical Observing System: A single design suitable for InSAR deformation monitoring and SAR calibration at multiple microwave frequency bands. Geosci. Aust. 2015, 3, 82751. [Google Scholar]
- Schubert, A.; Small, D.; Gisinger, C.; Balss, U.; Eineder., M. Corner Reflector Deployment for SAR Geometric Calibration and Performance Assessment; Ref: UZH-FRM4SAR-TN-100; Issue: 1.03; ESRIN: Frascati, Italy, 2018; Available online: https://calvalportal.ceos.org/documents/10136/11045/UZH-WP100-CALVAL-SETUP_v103.pdf/32295878-10d2-4a72-bb6f-e8353619e771 (accessed on 9 May 2022).
- Cigna, F.; Ramírez, R.E.; Tapete, D. Accuracy of Sentinel-1 PSI and SBAS InSAR Displacement Velocities against GNSS and Geodetic Leveling Monitoring Data. Remote Sens. 2021, 13, 4800. [Google Scholar] [CrossRef]
- Nof, R.N.; Abelson, M.; Raz, E.; Magen, Y.; Atzori, S.; Salvi, S.; Baer, G. SAR Interferometry for Sinkhole Early Warning and Susceptibility Assessment along the Dead Sea, Israel. Remote Sens. 2018, 11, 89. [Google Scholar] [CrossRef] [Green Version]
- Angular. Available online: https://angular.io/ (accessed on 9 May 2022).
- Bordoni, F. Sentinel-1 Next Generation C-Band SAR Phase 0 Study: Innovative Payload Concepts and Associated SAR Performance; HRWS-DLR-TN-0045; Project Report: 2019; DLR Microwaves and Radar Institute: Oberpfaffenhofen, Germany, 2019; p. 57. Available online: https://elib.dlr.de/130958/ (accessed on 30 June 2022).
- ESA Applications. Available online: https://www.esa.int/Applications/Observing_the_Earth/Copernicus/Contract_signed_for_new_Copernicus_ROSE-L_mission (accessed on 30 June 2022).
Figure 1.
Location of the surveyed Hungarian water management facilities (yellow circles) and the installed CRs (red circles).
Figure 1.
Location of the surveyed Hungarian water management facilities (yellow circles) and the installed CRs (red circles).
Figure 2.
InSAR processing pipeline of the FIR.
Figure 2.
InSAR processing pipeline of the FIR.
Figure 3.
The vertical and east–west components of the critical displacement values determined along the x and y axes of the displacement coordinate system in the coordinate system of the 2D measurements (tx = displacement threshold defined in the displacement coordinate system in the x-axis direction, ty = displacement threshold defined in the displacement coordinate system, in the y-axis direction, x = x-axis of the displacement coordinate system, y = y-axis of the displacement coordinate system).
Figure 4.
Main features of water management facilities summarized during the preparatory stage. (Object size contains categories extremely small object < 10 m2, very small objects < 100 m2, 100 m2 < small objects < 1000 m2, 1000 m2 < medium objects < 10,000 m2, and large objects > 10,000 m2. Coherence thresholds in the surroundings of facilities were the following: poor < 0.3, 0.3 < good < 0.5, excellent > 0.5).
Figure 5.
Typical detectable (A1), undetectable (B1) and improvable (C1) sites and their land cover from Google satellite images (A2–C2). Typical PS densities of site types are the following: undetectable site = 0 PS (but improvement is impossible with CR), detectable = usually 5 + PS, improvable = from 0 to 5 (but improvement is possible with CR).
Figure 6.
CR pair facing both ascending and descending S1 orbits on a reservoir dam (the overflow drain is in the upper left corner of the picture). Check
Figure 7 for localisation.
Figure 6.
CR pair facing both ascending and descending S1 orbits on a reservoir dam (the overflow drain is in the upper left corner of the picture). Check
Figure 7 for localisation.
Figure 7.
Improving the detectability of a dam with three pairs of CRs. Top left figure = overview of the dam from Google satellite images, top right figures = coherence of the site from ascending and descending geometry of S1, bottom figures = combined vertical PS measurements of the dam after CR installation and time series of one of the CRs and an adjacent stable building. (Please note, that if the area was not showing any PS where now the CR is, then the little new clusters of PS might relate with the side-lobes of the CR. In such a case, they would present the same displacement rate of the main lobe).
Figure 8.
Histogram of the processing time of the sites in ascending (A) and descending (B) geometries and geometry combination (C) in days.
Figure 8.
Histogram of the processing time of the sites in ascending (A) and descending (B) geometries and geometry combination (C) in days.
Figure 9.
General scheme of the S1 data processing methods.
Figure 9.
General scheme of the S1 data processing methods.
Figure 10.
Classification of object warning levels after one year of testing (object/given category).
Figure 10.
Classification of object warning levels after one year of testing (object/given category).
Figure 11.
Interactive user interface, with the objects of a water facility and their PSs. The time series and quality measures of the chosen PS are highlighted on the left side and bottom of the figure. The layer handling toolbox is on the right side of the figure. The displayed PS points are mostly stable (green color), while some shows a slight displacement towards the sensor (yellow color). Please note, that this interface is in Hungarian, so the decimal separators are commas, not periods.
Table 1.
Statistical descriptors of processing times in ascending and descending geometries and geometry combination (in days).
Table 1.
Statistical descriptors of processing times in ascending and descending geometries and geometry combination (in days).
| | Min. | 1st Qu. | Median | Mean | 3rd Qu. | Max. |
|---|
| Ascending geometry | 0.1858 | 0.2536 | 2.829 | 2.1505 | 3.6923 | 4.8418 |
| Descending geometry | 0.212 | 0.3956 | 1.2489 | 1.9875 | 2.373 | 5.89 |
| Geometry combination | 2.726 | 3.911 | 5.202 | 4.884 | 5.711 | 6.7 |
| Publisher’s Note: MDPI stays neutral with regard to jurisdictional claims in published maps and institutional affiliations. |
© 2022 by the authors. Licensee MDPI, Basel, Switzerland. This article is an open access article distributed under the terms and conditions of the Creative Commons Attribution (CC BY) license (https://creativecommons.org/licenses/by/4.0/).


 ,
, 


