Article

Using InSAR and PolSAR to Assess Ground Displacement and Building Damage after a Seismic Event: Case Study of the 2021 Baicheng Earthquake

1
State Key Laboratory of Desert and Oasis Ecology, Xinjiang Institute of Ecology and Geography, Chinese Academy of Sciences, Urumqi 830011, China
2
University of Chinese Academy of Sciences, Beijing 100049, China
3
Research Center for Ecology and Environment of Central Asia, Chinese Academy of Sciences, Urumqi 830011, China
4
Xinjiang Pamir Intracontinental Subduction National Field Observation and Research Station, Beijing 100049, China
*
Author to whom correspondence should be addressed.
Remote Sens. 2022, 14(13), 3009; https://doi.org/10.3390/rs14133009
Submission received: 9 May 2022 / Revised: 14 June 2022 / Accepted: 20 June 2022 / Published: 23 June 2022

Abstract

:
During unexpected earthquake catastrophes, timely identification of damaged areas is critical for disaster management. On the 24 March 2021, Baicheng county was afflicted by a Mw 5.3 earthquake. The disaster resulted in three deaths and many human injuries. As an active remote sensing technology independent of light and weather, the increasingly accessible Synthetic Aperture Radar (SAR) is an attractive data for assessing building damage. This paper aims to use Sentinel-1A radar images to rapidly assess seismic damage in the early phases after the disaster. A simple and robust method is used to complete the task of surface displacement analysis and building disaster monitoring. In order to obtain the coseismic deformation field, differential interferometry, filtering and phase unwrapping are performed on images before and after the earthquake. In order to detect the damage area of buildings, the Interferometric Synthetic Aperture Radar (InSAR) and Polarimetric Synthetic Aperture Radar (PolSAR) techniques are used. A simple and fast method combining coherent change detection and polarimetric decomposition is proposed, and the complete workflow is introduced in detail. In our experiment, we compare the detection results with the ground survey data using an unmanned aerial vehicle (UAV) after the earthquake to verify the performance of the proposed method. The results indicate that the experiment can accurately obtain the coseismic deformation field and identify the damaged and undamaged areas of the buildings. The correct identification accuracy of collapsed and severely damaged areas is 86%, and that of slightly damaged and undamaged areas is 84%. Therefore, the proposed method is extremely effective in monitoring seismic-affected areas and immediately assessing post-earthquake building damage. It provides a considerable prospect for the application of SAR technology.

1. Introduction

Earthquakes are one of the most destructive natural disasters, occurring with high frequency on a global scale. Some of the earthquakes are relatively small and humans cannot perceive them. However, when the magnitude reaches a certain degree, the destructive force of the earthquake is huge. At the same time, a series of secondary disasters, such as landslides, debris flows, tsunamis and so on, seriously threaten the safety of people’s lives and property and cause a devastating blow to the natural environment [1]. In particular, obtaining a reliable seismic damage map of urban areas is critical to managing civil protection interventions and assessing damage [2]. However, in the work of loss assessments of earthquake disasters, field survey is risky and inefficient. Further study of detecting damage and assessment of loss is essential.
Due to the challenges of field observation immediately after the event, remote sensing has become an effective technique for reliable disaster assessment and post-earthquake emergency response [3,4,5]. With the rapid development of the technology, remote sensing has played an increasingly important role in disaster assessment, rescue and relief, as well as recovery and reconstruction, due to its advantages, such as improved safety, rapid and comprehensive data collection, macroscopic and large coverage and freedom from the restrictions of ground natural conditions [6,7,8]. It is extremely important to obtain high-quality data sources in time for earthquake damage monitoring and emergency rescue by means of remote sensing [9,10]. Optical remote sensing belongs to passive remote sensing and its imaging is seriously affected by light conditions and is vulnerable to bad weather, such as clouds, fog and rain. When the weather conditions in the earthquake damaged area are poor, it is difficult for optical remote sensing to obtain effective images, which greatly affects the timeliness of emergency rescue. In contrast, Synthetic Aperture Radar (SAR) is an active earth observation system, which can detect distant targets both day and night and has a certain penetration ability [11]. SAR imaging is not limited by clouds, fog and rain and has the ability to acquire remote sensing data at night [12], effectively making up for the deficiency of optical remote sensing satellites.
Interferometric Synthetic Aperture Radar (InSAR) and Polarimetric Synthetic Aperture Radar (PolSAR) are two potential microwave remote sensing geophysical monitoring technologies developed in recent years that have been flexibly applied to the comprehensive analysis and assessment of earthquake disaster situation and loss [13]. Coherence, an important by-product of InSAR technology, is the basis of phase interference and represents the cross-correlation of phase information between images. The value of coherence ranges from 0 to 1, with lower values indicating stronger changes in the surface between the two acquisitions. Therefore, comparing the coherence of the interferograms before and after an earthquake can be used to monitor the surface changes caused by the earthquake and then to explore and evaluate the damage of buildings in the disaster [14,15]. Polarization decomposition is one of the key steps in PolSAR processing. Various polarization decomposition methods [16,17,18] have been proposed and gradually formed a relatively complete theoretical system. Polarization target decomposition refers to the decomposition of PolSAR data into several different components by using a polarimetric scattering matrix or other correlation matrix, thus obtaining the physical scattering mechanism and mining the ground object features contained in the polarimetric information. Polarization target decomposition can be divided into two categories. The first is coherent target decomposition. When the target characteristics are determined, the scattering matrix is steady and both the incident and scattered waves are fully polarized waves, the coherent target decomposition theory can be used to process PolSAR data. Li et al. [19] analyzed the scattering mechanism of landslides using the coherent target decomposition method for automatic extraction of a large-scale regional landslide. The second category is incoherent target decomposition. When the target characteristics are uncertain and the scattering properties change with time, the polarization scattering matrix cannot fully characterize the scattering characteristics of the target. Guo et al. [20] used the incoherent target decomposition approach to extract collapsed buildings in the 2010 Yushu earthquake based on post-event PolSAR data. In this case, the scattering target is usually decomposed by the incoherent decomposition method.
Among the various types of disasters caused by earthquakes, building damage is the most closely related to casualties and emergency response, which is the main basis for earthquake intensity assessment. Therefore, it is important to evaluate the damage of buildings in a timely and comprehensive way [21,22]. It is worth noting that the coseismic deformation field is the most intuitive expression of surface damage caused by the earthquake, which can vividly describe the scope and extent of the surface damage [23]. At the same time, the coseismic deformation field varies with a series of parameters, such as the nature of the seismogenic fault and the focal depth. Due to the advantages of SAR technology mentioned above, various coseismic deformation field and building damage assessment methods based on SAR have been proposed to minimize the loss and impact caused by disasters [24,25,26]. Massonnet et al. [27] extracted the coseismic deformation field of the Landers earthquake in California, USA, using two ERS-1 SAR images, and the deformation results were quite consistent with the field survey results. This is the first application of InSAR technology in seismic deformation monitoring, which pioneers the use of this technique for monitoring coseismic deformation. In subsequent studies, scholars have made more breakthrough achievements in coseismic deformation monitoring by using InSAR technology [28,29,30,31,32,33,34], which has pushed the application of InSAR technology to a new level. For building damage assessment based on SAR data, some researchers have used image amplitude information to calculate the intensity difference [35]. Some scholars have used interference results to obtain coherence coefficients [36]. Some people have used regression discriminant analysis [37]. Others have integrated different polarization methods [38]. They have successfully extracted the earthquake damage information of buildings.
At present, there are relatively few methods for extracting seismic damage information from radar images. In addition, the polarization decomposition technology is more often applied to full polarized data, while the polarization mode of the Sentinel-1 data is dual polarization. As a result, there are fewer studies using Sentinel-1 data in combination with polarization decomposition techniques to assess damage to building areas. The goal of this study is to complete the coseismic deformation monitoring and building damage information extraction of the Baicheng earthquake in a relatively short time, and compare with the results of the field investigation using an unmanned aerial vehicle (UAV).
Based on the Sentinel-1A SAR pre-event images and post-event images, the coseismic deformation field of the earthquake is extracted and analyzed by DInSAR (DIfferential Interferometric Synthetic Aperture Radar) technology. The recognition results of the affected building areas based on different methods, including phase coherence and polarization decomposition, are compared. We also propose using the combination of coherent change detection and polarimetric decomposition to increase the accuracy of the identified results by taking advantage of both approaches and compare the damage results with ground surveys using UAV. High-precision seismic damage information extraction is realized and the advantages of radar remote sensing in the early stages of earthquake damage assessment can be fully utilized.
This paper is organized as follows: Section 2 describes the materials and methods used in this paper. Section 3 discusses the coseismic deformation field and building damage map obtained in the earthquake affected area near Baicheng. Section 4 is the discussion. Finally, Section 5 summarizes the findings.

2. Materials and Methods
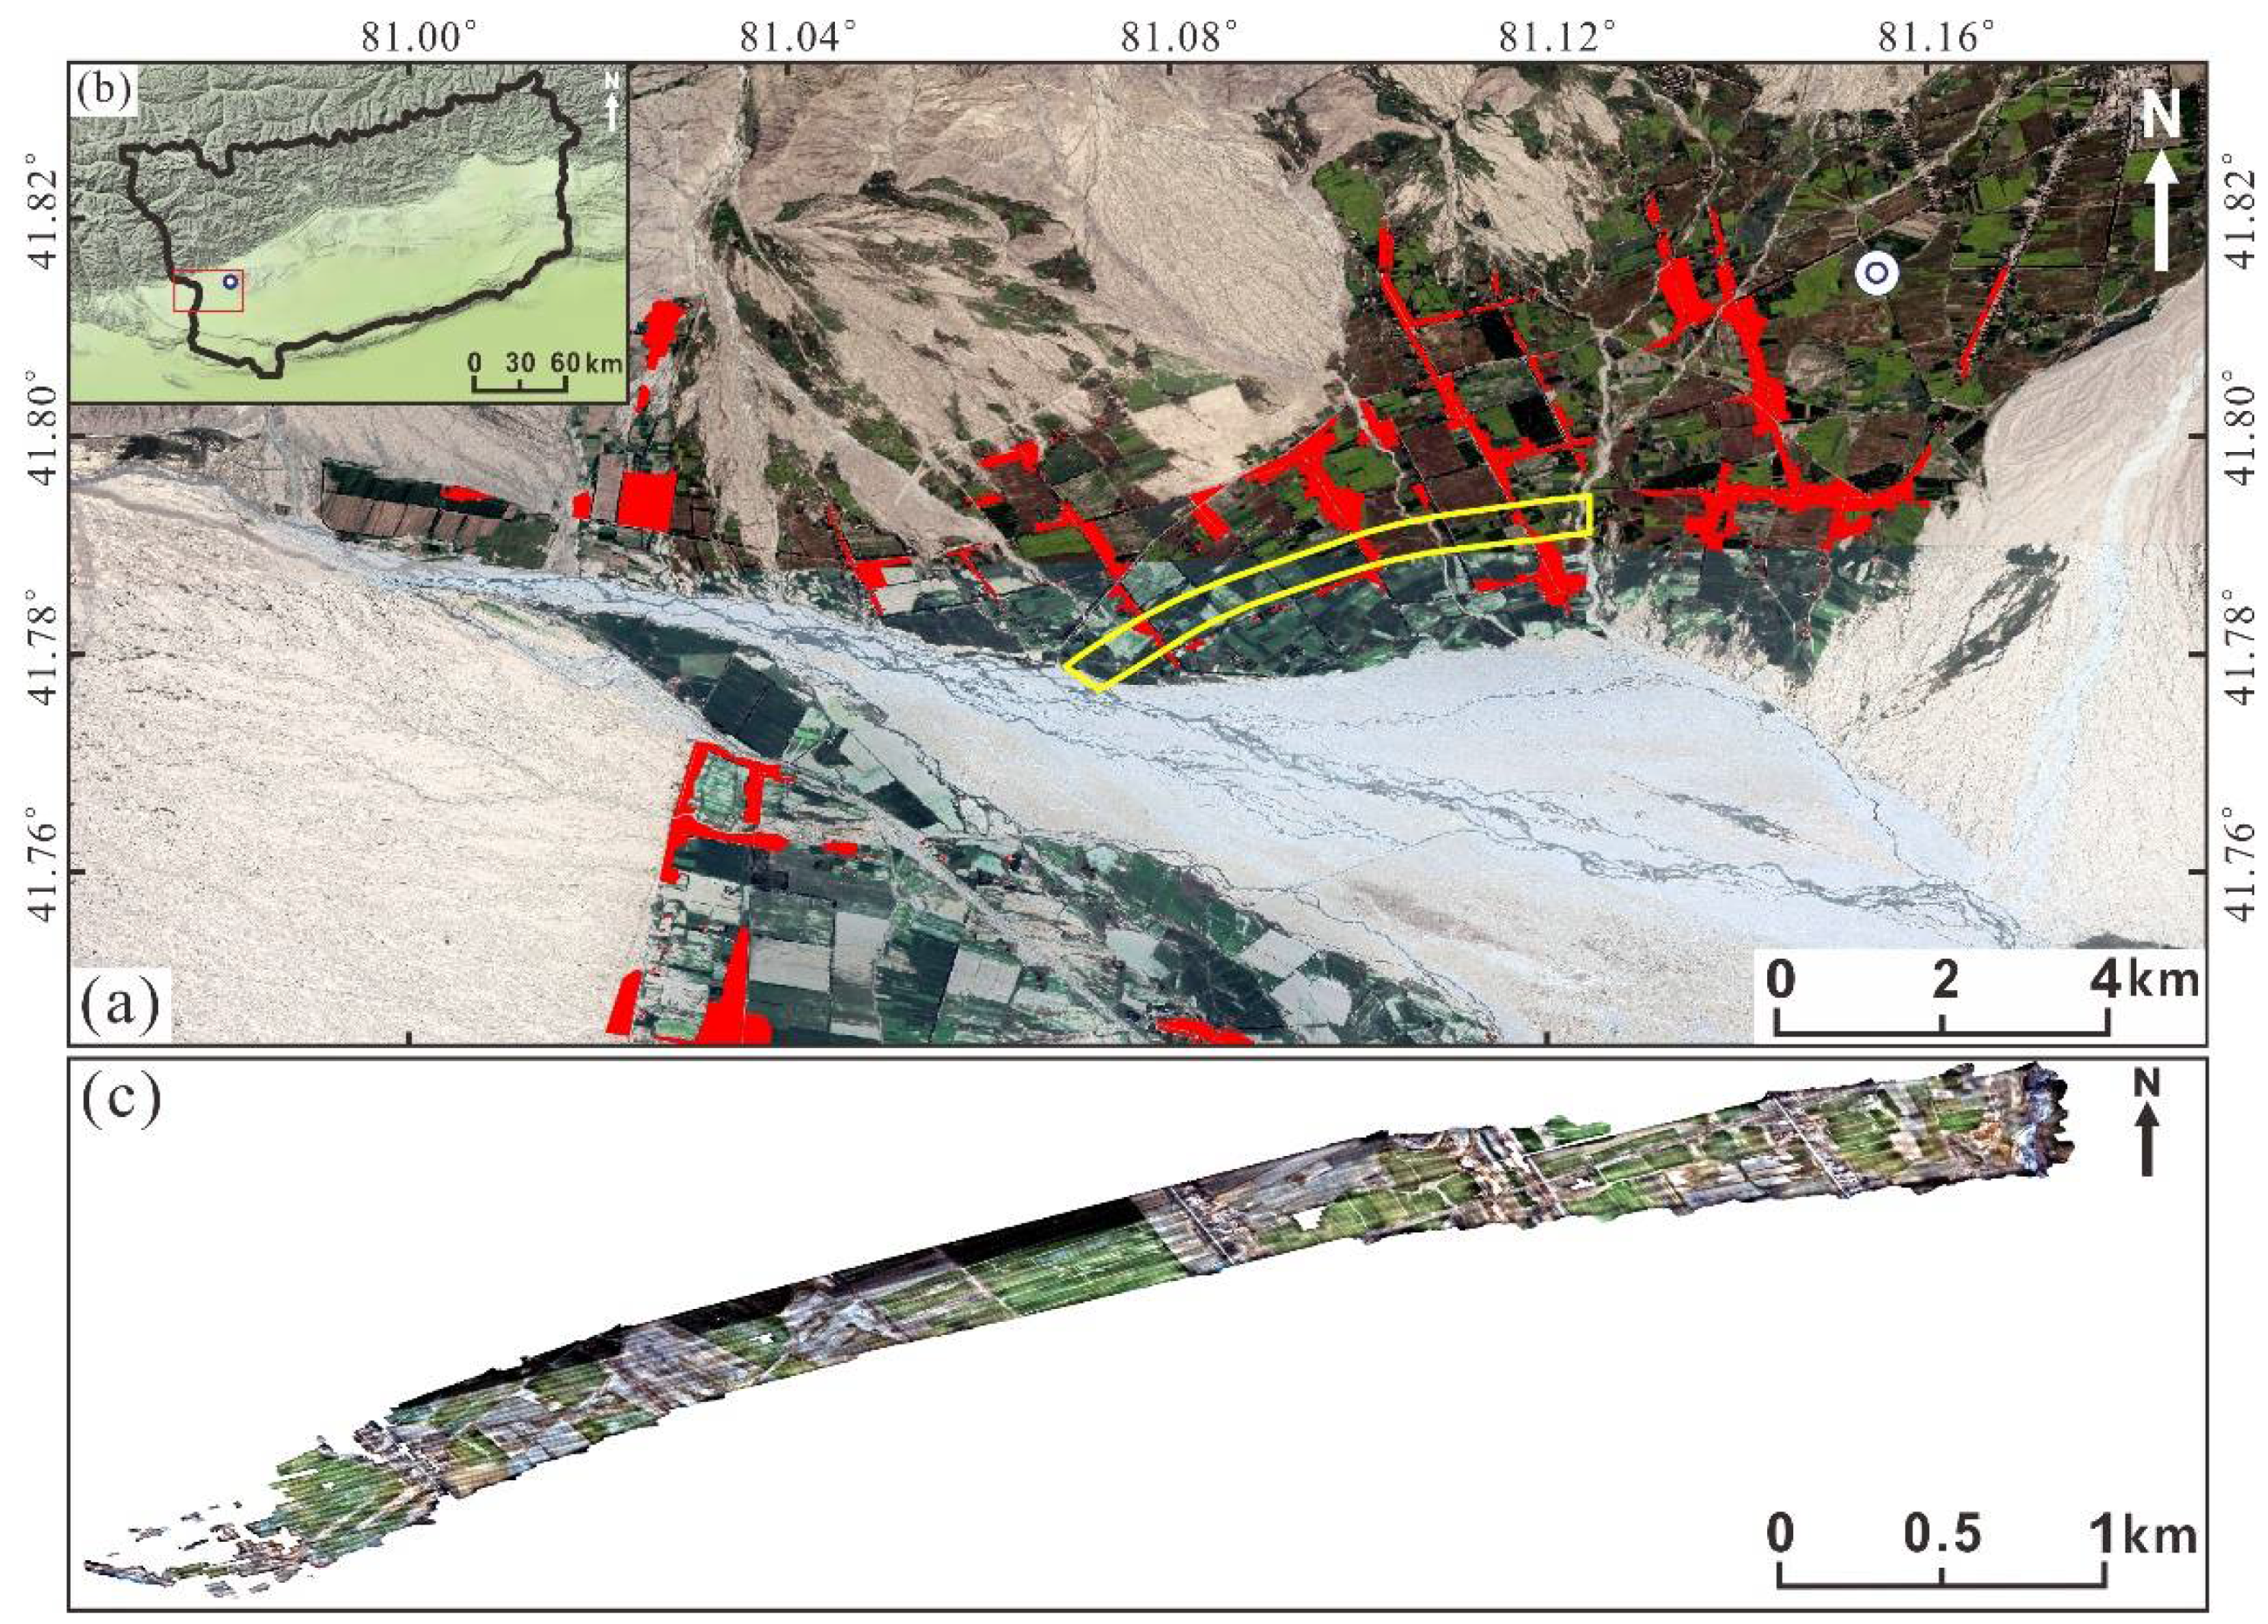
2.1. Study Area

In this paper, we focus our analysis on the city of Baicheng, Xinjiang (northwestern China, 81 ° 8 E, 41 ° 8 N). On the 24 March 2021, a Mw 5.3 earthquake struck Baicheng town, with an epicenter location near 41.82°N and 81.16°E, as shown in Figure 1a,b. The earthquake caused a surface rupture of about 4 km in length. In addition, large-scale buildings and other infrastructure were destroyed. Figure 1c shows the details of building damage in the area obtained by UAV after the earthquake.

2.2. Dataset

2.2.1. Sentinel-1A Data

In this study, we used Sentinel-1 data downloaded from the Copernicus Open Access Hub [39]. The images contain intensity and phase information, cover a width of 250 km in Interferometric Wide (IW) swath mode, with a spatial resolution of 5 m by 20 m, and are polarized in VV + VH. The pre-earthquake datasets were acquired on 1 March and 13 March 2021, and the post-earthquake dataset was obtained on the 25 March 2021, only one day after the catastrophic event. The orbits collected for the three times are ascending and the image information is shown in Table 1.

2.2.2. Auxiliary Data
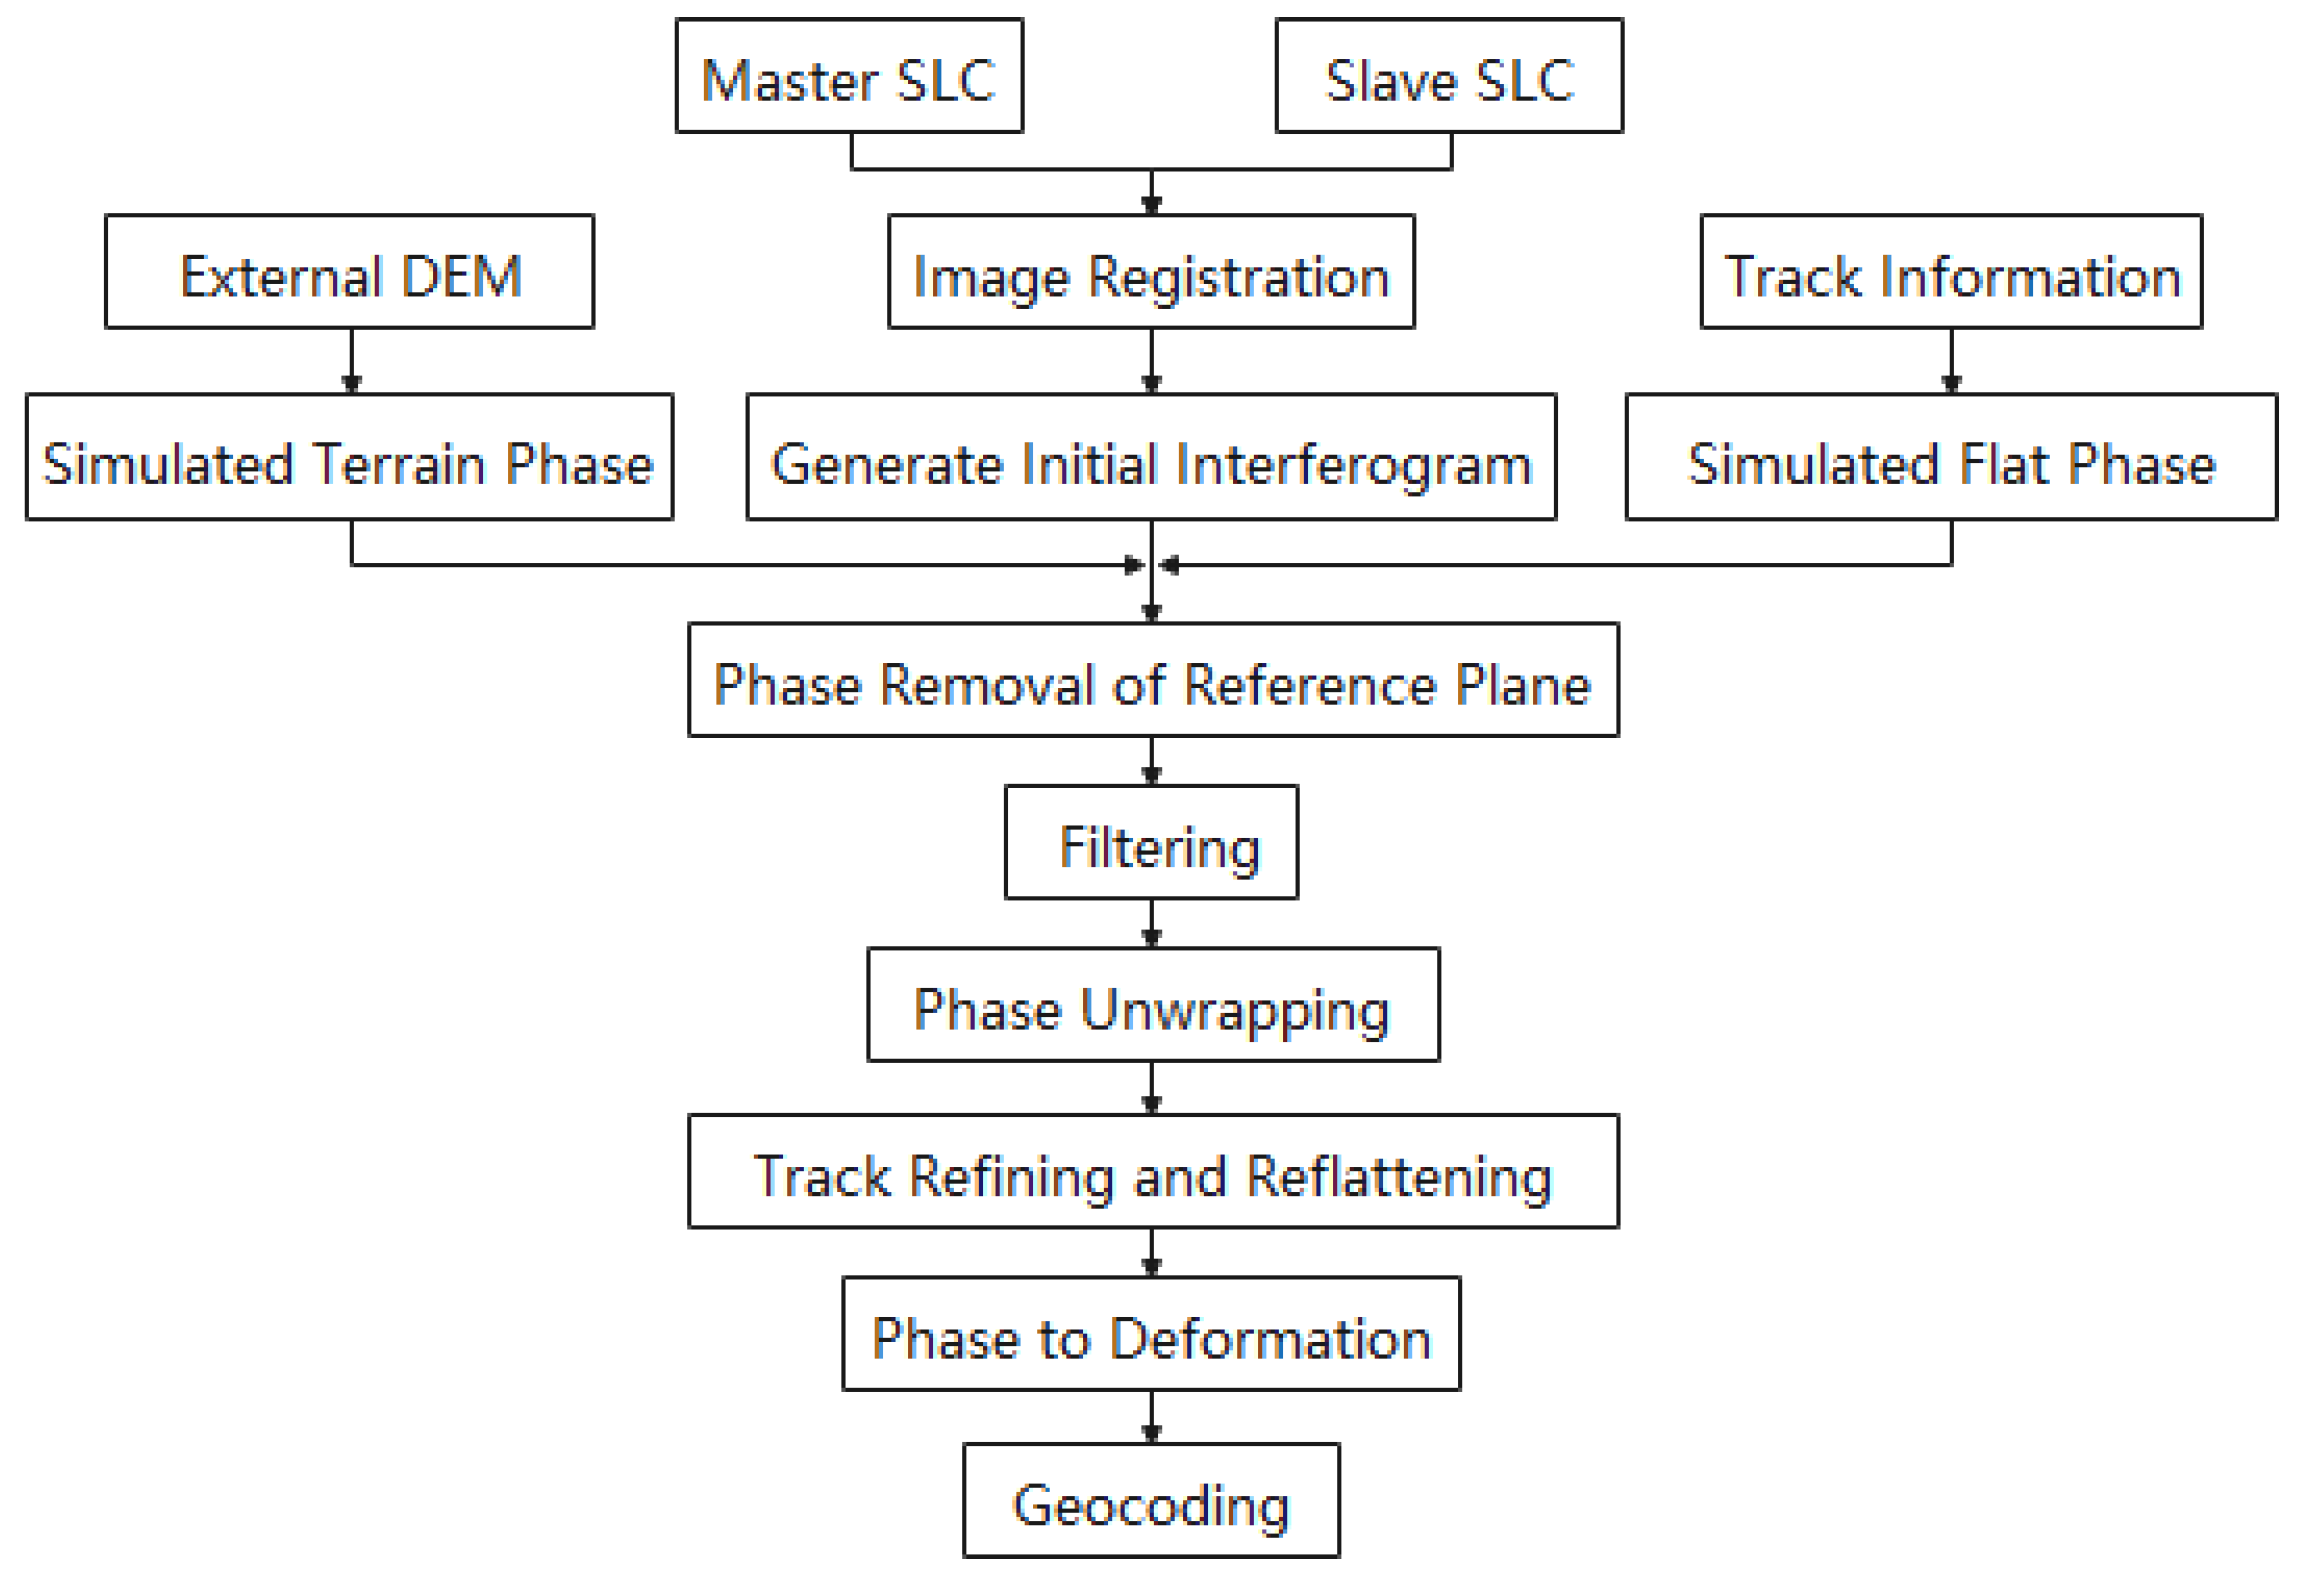
We used an UAV to obtain 3.5–10.3 cm resolution orthophoto images of the area for the further analysis of building damage after the earthquake on the 24 March 2021. The Digital Elevation Model (DEM) in this paper is the Shuttle Radar Topography Mission (SRTM), which is jointly measured by the National Aeronautics and Space Administration (NASA) and the National Imagery and Mapping Agency (NIMA) with a resolution of 30 m. We used Precise Orbit Determination (POD) Precise Orbit Ephemerides data to correct the orbit information, and the positioning accuracy was better than 5 cm.

2.3. Methods

This section describes the overall method and specific operation of the Sentinel-1 data processing and analysis by using SNAP (SeNtinel Application Platform) and SARscape module in ENVI5.6 to determine the coseismic deformation field and damaged area in Baicheng. We introduce the basic ideas and principles of data processing in detail, starting with differential interferometry, then phase coherence and finally polarimetric decomposition processing.

2.3.1. Differential Interferometry

Differential interferometry analyzes the phase information, obtains the corresponding phase difference of two or more images and then processes it through the steps shown in Figure 2. Finally, the land displacements of the corresponding region are obtained, achieving observation at the cm or even mm level.
For SAR image processing, co-registration is the process from rough registration to precise registration and then to resampling, which usually requires sub-pixel matching accuracy. The initial interference phase can be obtained by complex conjugate multiplication of the phases on the corresponding pixels for the master and slave images. This phase is mainly composed of five parts, which can be expressed by Equation (1).
Φ = Φ f l a t + Φ t o p o + Φ a t m + Φ d e f o + Φ n o i
where Φ f l a t is flat phase; Φ t o p o is topographic phase; Φ a t m is atmospheric delay phase; Φ d e f o is the deformation phase; and Φ n o i is the residual noise phase.
The ground deformation information can be obtained by removing the flat phase, topographic phase, atmospheric delay phase and residual noise phase. First, satellite orbit data and high-precision external DEM data are used to eliminate the flat effect phase and topographic phase. Then, we filter the differential interferogram to weaken the noise, improve the image signal-to-noise ratio (SNR) and make the phase clearer and more continuous and the fringe smoother and more reliable, ensuring the accuracy of subsequent data processing and deformation results. The next step is phase unwrapping, which is the top priority of InSAR processing. Since the phase value recorded by the differential interferogram is the principal value after removing the whole cycle number, it is concentrated between π , + π . Therefore, phase unwrapping is required to calculate the integer ambiguity of the interference phase and to extract the real phase difference of the master and slave radar images, obtaining the correct deformation information. In this paper, the Minimum Cost Flow method is selected, which uses a square grid, considers all of the pixels in the image and masks the pixels whose coherence is less than the threshold. In addition, orbit refinement and re-flattening are required to further correct the satellite orbit and phase offset. Then, the real phase difference in the master and slave images is converted into the deformation value, which is in the SAR image coordinate system. Finally, in order to facilitate future analysis, it needs to be transformed into the target geographic coordinate system through projection transformation.

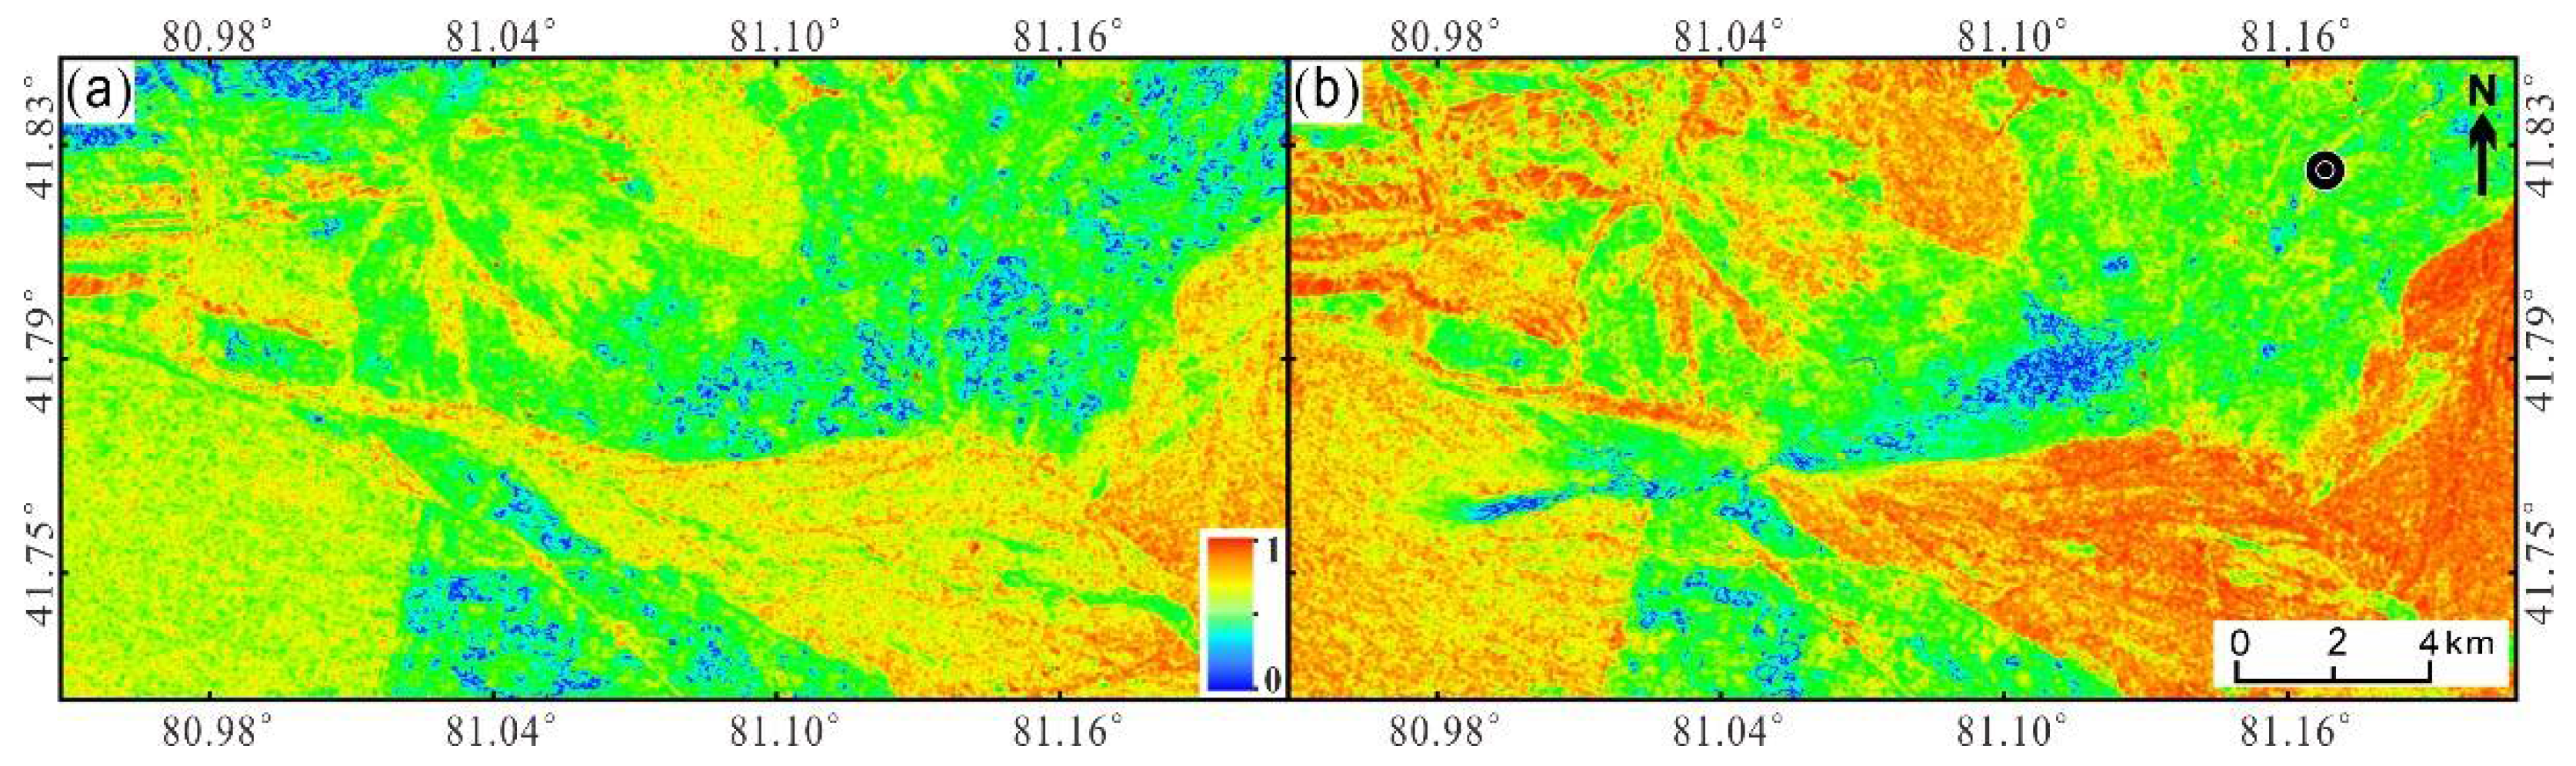
2.3.2. Phase Coherence

Phase coherence, which is sensitive to surface changes, can show the similarity of InSAR images between two acquisition periods. In addition, lower coherence means more significant changes in the surface between the two collections. The degree of damage caused by the earthquake is determined by calculating the variation in the coherence coefficients of the pre-seismic and coseismic interferogram [40,41], which has been shown to be effective.
γ = E s 1 · s 2 E s 1 2 · E s 2 2
Here,   s 1 and s 2   are corresponding complex pixel values of two images, s represents the complex conjugate of s ,   ·   is the absolute value and E · represents the mathematical expectation.
In the process of calculating interference coherence, it is not feasible to estimate the mathematical expected value of the radar signals. Therefore, it is assumed that the scatters are ergodic in the estimation window. Then, the coherence ensemble average can be estimated by the spatial mean, as shown in Equation (3) [42].
γ ^ = i = 1 N s 1 i · s 2 i · e j i i = 1 N s 1 i 2 · i = 1 N s 2 i 2
where i is the system phase of each pixel.
In order to evaluate the loss from an earthquake disaster, the normalized difference index of pre-seismic interferometric coherence graphs and coseismic interferometric coherence graphs can be used, as shown in Equation (4).
γ = γ pre γ co γ pre + γ co
Here, γ is the normalized coherence difference, and γ pre and γ co are the pre-seismic and coseismic coherence, respectively.
In addition, an earthquake damage visualization (EDV) technique was proposed by Sharma et al. [43], which can quickly evaluate the seismic damage by a red–green–blue (RGB) display of forward change (Equation (5a)), backward change (Equation (5b)) and change free (Equation (5c)).
R e d R = γ pre γ co γ pre + γ co
G r e e n G = γ co γ pre γ pre + γ co
B l u e B = γ pre + γ co 2.0

2.3.3. Polarimetric Decomposition

The PolSAR technology uses a variety of polarimetric combinations to obtain the backscattering coefficient of the target. For full-polarization radar images, Sinclair [44] used the polarized scattering matrix S to represent the observed radar reflection. S is a 2 2 complex matrix, which can be expressed by Equation (6) in the HV polarization basis.
S = S H H S H V S V H S V V
where S H H   and   S V V are the co-polarized components and S H V   and   S V H are the cross-polarized components. S p q p , q = h , v refers to the complex backscattering coefficient of the target when the radar electromagnetic wave is emitted with p and received with q . h and v represent the horizontal polarization direction and vertical polarization direction, respectively.
For a deterministic ground object, the polarized scattering matrix S can describe the amplitude, phase and polarization characteristics of ground objects more accurately. However, the actual PolSAR data often contain a large number of distributed ground targets. In this case, the scattering matrix S cannot accurately characterize the scattering characteristics of these targets. Therefore, we need to use second-order statistical features to describe the distributed ground targets. The commonly used ones are the polarization covariance scattering matrix and polarization coherent scattering matrix, which are obtained by using different orthogonal bases for matrix S .
The reciprocity theorem holds when the electromagnetic wave propagates in a uniform medium and the transmitting and receiving antennas are interchangeable. Subject to the reciprocity condition ( S V H = S H V ), the polarization scattering matrix S can be simplified as shown in Equations (7) and (8) [45].
K 3 L = S H H , 2 S H V , S V V T
K 3 P = 1 2 S H H + S V V , S H H S V V , 2 S H V T
where the coefficients 2 and 1 / 2 are used to ensure that the norm of the scattering vector is not transformed, i.e., that the energy is equal before and after decomposition.
Then, the polarization covariance matrix C 3 × 3 and polarization coherency matrix T 3 × 3 can be obtained by using K 3 L and K 3 P .
C 3 × 3 = K 3 L K 3 L T = S H H 2 2 S H H S H V S H H S V V 2 S H V S H H 2 S H V 2 2 S H V S V V S V V S H H 2 S V V S H V S V V 2
        T 3 × 3 = K 3 P K 3 P T = 1 2 S H H + S V V 2 S H H + S V V S H H S V V 2 S H H + S V V S H V S H H S V V S H H + S V V S H H S V V 2 2 S H H S V V S H V 2 S H V S H H + S V V 2 S H V S H H S V V 4 S H V 2
In the above, · denotes the ensemble average and superscript and T represent the complex conjugation and transposition, respectively. C 3 × 3 and T 3 × 3 have the same eigenvalues and can be converted into each other.
In the imaging process, speckle noise will be generated, so multilook and filtering processing are needed. Multilook processing is an indispensable part of distributed target recognition, which can greatly reduce the amount of data and effectively reduce the impact of speckle noise. As the number of views increases, the speckle noise decreases. In order to further reduce the influence of speckle noise, the Refined Lee Filter is used to process SAR data. In this method, the elements in the polarization matrix are filtered separately, the edge window is introduced into the judgment of polarization scattering, and the homogeneity of the filtering region is enhanced by removing different components. This way, not only can the speckle noise be removed, but the polarization information and edge details of each channel can be preserved.
The next step is polarization decomposition. Cloude decomposition is an incoherent object decomposition method for the polarization coherency matrix [46]. First, the coherency matrix T 3 × 3 is expressed as Equation (11).
T 3 × 3 = T 11 T 12 T 13 T 21 T 22 T 23 T 31 T 32 T 33 = U 3 U 3 H = U 3 λ 1 0 0 0 λ 2 0 0 0 λ 3 U 3 H  
where is the eigenvector, λ i   i = 1 , 2 , 3 is the eigenvalue of the coherency matrix and satisfy λ 1 λ 2 λ 3 0 , U 3 is a matrix composed of the eigenvectors of the polarization coherency matrix and column i is the eigenvector corresponding to the eigenvalue λ i . Since the scattering targets do not meet the reflection symmetry in nature, the polarimetric coherency matrix T can be expressed as Equation (12).
T = i = 1 3 λ i T i = λ 1 e 1 e 1 + λ 2 e 2 e 2 + λ 3 e 3 e 3  
where T i is the coherency matrix of the single view target, λ i is the eigenvalue and e i is the eigenvector.
In order to make full use of the information in the coherency matrix, Cloude and Pottier [46] proposed the H/A/alpha decomposition based on the above theory, in which the polarization entropy H given in Equation (13), the anisotropy A given in Equation (15) and the scattering angle α given in Equation (16) are functions of the eigenvalues of the coherency matrix, respectively. In this method, the scattering of all targets is regarded as a random representation of the average scattering mechanism and the target is decomposed into the sum of the scattering mechanisms of three physical quantities, analyzing the scattering characteristics of the target.
H = i = 1 3 P i log 3 P i      
P i = λ i / j = 1 3 λ j      
A = λ 2 λ 3 λ 2 + λ 3
α = P 1 cos 1 U 31 + P 2 cos 1 U 32 + P 3 cos 1 U 33  
where P i   is the occurrence probability of each scattering mechanism. H describes the randomness of different scattering mechanisms in the scattering process, and its range is 0 H 1 . When H = 0 , there is only one main scattering mechanism. When H = 1 , it indicates that the scattering target is completely random. A represents the degree of anisotropy for the target scattering, reflecting the magnitude relationship of the other two scattering mechanisms in addition to the optimal scattering mechanism. When A = 0 , two situations may occur. One is that a certain scattering property occupies the main component, so that λ 2 = λ 3 0 . The other is that the scattering mechanism belongs to a random variation process, so that λ 1 = λ 2 = λ 3 . α reflects that the average scattering degree of surface scattering and dihedral angle scattering is related to the physical mechanism of the scattering process for the target ground object. The value range of α is 0 ° α 90 ° and the scattering mechanism changes to anisotropy with the increase in α . α = 0 ° corresponds to surface scattering, α = 45 ° corresponds to volume scattering and α = 90 ° corresponds to dihedral scattering.

3. Results

3.1. Coseismic Deformation Field

In this paper, DInSAR technology is used to extract coseismic deformation field and coherence coefficient diagram, as shown in Figure 3. This experiment is implemented by ENVI SARscape software. We used the radar image on the 13 March 2021 as the master image for registration, and the image on the 25 March 2021 is registered with it. The registration accuracy can generally reach 1/8 pixel. Two images are processed by differential interference, the topographic phase and flat phase are removed by using high-precision external DEM and orbit information. This study carries out adaptive filtering on the interferogram to overcome the random noise. According to the differential interferogram, the whole deformation field is approximately ellipsoidal, accompanied by two concentric rings, which is roughly divided into eastern and western parts. The interference fringes of the coseismic deformation are smooth and visual, indicating that the earthquake caused surface deformation. In addition, the interference fringes are continuous and each fringe represents a displacement of 2.8 cm [47]. The next step was to acquire the absolute deformation of the surface, based on the Minimum Cost Flow method [32] that can unwrap the phase of the coseismic deformation interferogram and obtain the seismic deformation field. After orbit refining and re-flattening, the differential unwrapping phase is converted into the radar line-of-sight (LOS) directional deformation field. Figure 4 shows the coseismic deformation field after geocoding.
The information derived from Figure 4 shows that the surface deformation range is approximately 16.5 km long and 7.7 km wide. The magnitude of deformation in both the eastern and western parts of the deformation field is asymmetric. The magnitude of the deformation in the central region is large, especially in the east, and gradually decreases towards both ends of the deformation field. In Figure 4, the light yellow to dark yellow is the uplift area, with a maximum displacement of about 0.16 m. The light purple to dark purple shows a subsidence trend, with a maximum displacement of about 0.13 m. There is a certain degree of decorrelation between the two regions, which results from the surface rupture phenomenon caused by the earthquake.
Therefore, DInSAR technology can be used to monitor the coseismic deformation of the Baicheng earthquake and obtain the influence scope and damage degree of the earthquake. It is meaningful to study the damage of buildings only when the earthquake causes significant ground deformation. The above study shows that the Baicheng earthquake caused surface deformation. The coherence map obtained by DInSAR, as shown in Figure 3, provides a basis for the subsequent research on building seismic damage.

3.2. Building Damage Detection

In this study, the main technologies involved in building disaster damage identification include coherent change detection and polarimetric decomposition. The accuracy of the above two methods is verified according to the field survey UAV images, as shown in Figure 5. The UAV image is provided by the Seismological Bureau of Xinjiang Uygur Autonomous Region. Specifically, we divided the buildings investigated into damaged and undamaged areas, denoted as A and B, respectively, in advance. The damaged region C and undamaged region D identified by coherent change detection are superimposed with the verification data. In addition, the proportion of C in A and the proportion of D in B are calculated. The higher the proportion is, the higher the accuracy. The same verification method is applied to the accuracy analysis of building damage detection based on polarimetric decomposition. Based on Sentinel-1A data, we combine coherent change detection and polarimetric decomposition technology to obtain building damage results and damage assessment maps. The verification method is consistent with the above. The following is a detailed experimental analysis of the results.

3.2.1. Coherence-Based Analysis

Coherent change detection mainly uses the coherence map obtained by the DInSAR technology mentioned above to obtain the building damage area caused by earthquakes. The specific methods are as follows: in obtaining the coseismic deformation field, coherence map is also obtained. The same method and software are used to calculate the coherence map of Sentinel-1A radar data from the two images before the earthquake [47]. Figure 6a shows the pre-seismic coherence coefficient diagram, and Figure 6b shows the coseismic coherence coefficient diagram. The value range of coherence coefficient diagram is 0 to 1. The closer to 1, the higher the coherence. The closer to 0, the lower the coherence. Between two image acquisitions, high coherence means that the ground target remains unchanged, while low coherence means that the ground object has changed. In this study, the part with coherence value lower than 0.37 is defined as low coherence region. The areas with coherence lower than 0.37 in Figure 6a are basically attributed to vegetation, and the areas with coherence lower than 0.37 in Figure 6b are basically attributed to surface deformation caused by the Baicheng earthquake.
The normalization, mean and other indices of the pre-seismic coherence and coseismic coherence are calculated. Equation (5a) is the forward change, representing the change from pre-seismic to co-seismic. It monitors surface changes caused by earthquakes. Equation (5b) is the backward change, representing the change from co-seismic to pre-seismic. It monitors surface changes caused by factors other than earthquakes. Equation (5c) is unchanged, indicating that there is no change in the surface between pre-seismic and co-seismic. Assign Equation (5a), Equation (5b) and Equation (5c) to the three components of R, G and B, respectively. The RGB color composite image is generated. The damage assessment map (Figure 7) is made by using EDV technology to evaluate and judge the damaged and undamaged areas [47]. RGB color synthesis is generally using red, green, blue, three basic colors, according to a certain proportion of mixed into a variety of colors, as shown in Figure 8. We ignore surface deformation caused by factors other than earthquakes (green). Focus only on building changes caused by the earthquake (red) and no changes (blue). The amount of redness in the EDV indicates the severity of the damage to the building, as shown in Figure 8. For accuracy verification, we resampled the images to achieve the same resolution. The experimental results and the field measurement results of UAV are projected into the same coordinate system. We calculated the building area of the verification area, totaling 110,363 square meters. The damaged and undamaged areas were identified using UAV data and calculated to be 43,436 and 66,927 square meters, respectively. Calculate the area with a large proportion of R component (e.g., 1, 2, 12 in Figure 8) in Figure 7, totaling 66,336 square meters. Calculate the area containing a large amount of B component (e.g., 8–10 in Figure 8) in Figure 7, and the total area is 44,027 square meters. However, in some locations (yellow boxes in Figure 9), the EDV results are inaccurate. The EDV results and UAV data are superimposed and segmented by visual interpretation. The actual damaged area of the building is 40,921 square meters and the undamaged area is 41,512 square meters. According to the UAV images, the overall accuracy is 75%, the Kappa coefficient is 0.51, the correct identification accuracy of the collapsed and severely damaged areas is 94% and that of mildly damaged and undamaged areas is 62%, as shown in Table 2.

3.2.2. Polarimetry-Based Analysis

For the polarimetric decomposition, the scattering information under different polarization modes can be extracted. It has a strong anti-interference ability, which is conducive to the decomposition and analysis of the scattering mechanism [48]. It provides favorable data support for the identification and detection of building collapse and damage. Unfortunately, Sentinel-1A data are not obtained in full-polarization mode, but in dual-polarization VV + VH mode. Therefore, many decomposition methods for fully polarized data cannot be used for these data [49]. In this paper, SNAP software is used to reflect the scattering characteristics of buildings in the C-band radar images by H/A/alpha polarization decomposition. Figure 10a,b show the decomposition processing results before and after the earthquake, respectively. Figure 10c is the corresponding optical image obtained using Google Earth Engine (https://earthengine.google.com/), and accessed on 10 October 2021. The buildings in the study area are sparsely distributed. For the convenience of explanation, we superimposed the red building area on the basis of Figure 10c, as shown in Figure 10d. The polarization decomposition results consist roughly of several regions, labeled with capital letters (from A to E). A to D represent mountains, sandy land, rivers and farmland, respectively. The light part in E represents the building area, while the dark part represents the farmland. The damage assessment map of the building based on polarization decomposition is obtained through subtraction band operation, as shown in Figure 11. According to the ground survey, the overall accuracy is 82%, the Kappa coefficient is 0.62, the correct identification accuracy of the collapsed and severely damaged areas is 67% and that of slightly damaged and undamaged areas is 92%, as shown in Table 3.

3.2.3. Integrated Approaches

Each of the methods mentioned has its advantages in the identification of earthquake disasters in Baicheng. Coherent change detection and polarimetric decomposition can be combined to complement each other, thereby improving the accuracy of the assessment results. The decorrelation of phase coherence usually indicates the ground changes. The greater the degree of decorrelation is, the more obvious the ground changes and the greater the possibility of building collapse [50,51]. However, coherence is highly dependent on both the temporal and spatial baseline. Polarimetry information is sensitive to the properties of ground targets, such as dielectric constants, physical properties, geometry and orientation. It can provide richer information for understanding the backscattering mechanisms of ground targets. However, Sentinel-1 provides dual-polarization rather than full-polarization, and the resolution is relatively low [49]. Therefore, this study combines the two methods based on ArcGIS software. Equation (17) was used to calculate the two results, and the damage distribution diagram of buildings was obtained, as shown in Figure 12a. Figure 12b shows superimposed optical image and surface deformation results on Figure 12a. We found that the buildings were seriously damaged between the uplift area and the subsidence area. Due to the large surface changes, there is decoherence in this area. To some extent, this proves the accuracy of building earthquake damage information extraction.
B = A c o + A p o 2
A c o and A p o represent the results of coherent change detection and polarization decomposition, respectively. B represents the result of the integration method.
We used UAV images to verify the accuracy. It is found that the overall accuracy is 85%, the Kappa coefficient is 0.69, the correct identification accuracy of the collapsed and severely damaged areas is 86% and that of slightly damaged and undamaged areas is 84%, as shown in Table 4. The results show that the accuracy of the method based on the combination of coherent change detection and polarization decomposition is higher than that based on coherent change detection or polarization decomposition alone, as shown in Table 5. Figure 13 is a more intuitive representation of the three methods. For the recognition of A, coherent change detection performs better. For the identification of B, C and D, the integration method performs better. Therefore, the implementation of the integrated approach makes sense. On the whole, using Sentinel-1A radar data to monitor and evaluate building damage caused by an earthquake is extremely fast and effective.

4. Discussion

To detect the damage caused by the Baicheng earthquake, we extracted maps of surface deformation and building damage based on Sentinel-1A data. To a certain extent, the acquisition of surface deformation can verify the accuracy of building seismic damage information extraction. Where surface deformation is large, building damage should be correspondingly serious.
In this study, the extracted surface deformation field consists of two parts: east and west. The western part mainly occurred on sandy land and farmland, and the influence area was relatively small. The eastern part mainly occurred on buildings and farmland, with a large range of influence. The experiment focused on the surface deformation in the east. The eastern surface deformation field is divided into an uplift region and a subsidence region, accompanied by two deformation centers. There is decoherence between the two parts. We use coherent change detection and polarization decomposition technology to extract the seismic damage information of buildings. Before the accuracy verification, we superimposed the surface deformation map and the building damage assessment map. The results show that the severely damaged buildings are near the decoherence area and the deformation center. This shows that the building damage assessment map obtained by the experiment is effective.
However, there are some differences between the experimental results and the field investigation. The cause of the divergence can be attributed to nearby vegetation, which are able to trigger unnecessary detections [51,52]. This requires follow-up work to study how to weaken or eliminate the impact of vegetation. There is another problem to be discussed. UAV images were acquired after the earthquake. Then, it is possible that several of the damages are before the earthquake. One possible solution could be monitoring the building using multi-temporal InSAR techniques [25] to see if there were abrupt changes during the earthquake.

5. Conclusions

In this study, we evaluated the performance of DInSAR and PolSAR techniques in monitoring surface displacement and building damage. We detected the results of complex ground deformation in the earthquake damaged area. The interference fringes of the whole coseismic deformation field are very clear. In addition, the surface deformation range is about 16.5 km long and 7.7 km wide. In the uplift region, the maximum deformation is about 0.16 m. In the subsidence area, the maximum deformation is about 0.13 m.
We propose a technique aimed at estimating the disaster damage in residential areas in a fast, robust and reliable way. In the collapsed and seriously damaged areas, the accuracy of coherent change detection is 94% and the accuracy of polarization decomposition is 67%. The performance of coherent change detection works better. In contrast, in the mildly damaged and undamaged regions, the accuracy of coherent change detection is 62% and the accuracy of polarization decomposition is 92%. The performance of polarization decomposition technology gives better results. As far as image analysis techniques were concerned, the combination of coherent change detection and polarization decomposition is considered to be the most effective in building damage identification. The overall accuracy is 85% and the Kappa coefficient is 0.69. The correct identification accuracy of the collapsed and severely damaged areas is 86% and that of slightly damaged and undamaged areas is 84%. The detection results of building damage are basically consistent with the verification data obtained from the field survey conducted by UAV after the earthquake. This shows that our method is timely and effective and it can be applied to other earthquake disaster response tasks in the emergency stage.
Even though substantial approaches for building damage assessment based on DInSAR and PolSAR techniques have been proposed, field survey remains the primary method for many relevant departments. This shows that the publicity and promotion of new technologies are not in place. In the future, researchers need to improve the validity and reliability of radar technology and prepare detailed technical guidelines and instructions. This way, the relevant departments can effectively grasp them.

Author Contributions

Conceptualization, X.S. and X.C.; methodology, X.S. and X.Z.; software, X.S.; validation, L.Y. and W.W.; formal analysis, X.S. and L.W.; investigation, X.Z.; resources, Y.Y.; data curation, X.S. and Y.Y.; writing—original draft preparation, X.S.; writing—review and editing, X.S. and X.C.; visualization, L.Y. and Y.Y.; supervision, X.C. and L.Y.; project administration, X.C.; funding acquisition, X.C. All authors have read and agreed to the published version of the manuscript.

Funding

This research was funded by the Strategic Priority Research Program of Chinese Academy of Sciences (Grant No. XDA20020101) and Strategic Priority Research Program of the Chinese Academy of Sciences (Grant No. XDA20060303).

Data Availability Statement

The data presented in this study are available on request from the corresponding author.

Conflicts of Interest

The authors declare no conflict of interest.

References

  1. Altan, O.; Toz, G.; Kulur, S.; Seker, D.; Volz, S.; Fritsch, D.; Sester, M. Photogrammetry and geographic information systems for quick assessment, documentation and analysis of earthquakes. ISPRS J. Photogramm. Remote Sens. 2001, 55, 359–372. [Google Scholar] [CrossRef]
  2. Anniballe, R.; Noto, F.; Scalia, T.; Bignami, C.; Stramondo, S.; Chini, M.; Pierdicca, N. Earthquake damage mapping: An overall assessment of ground surveys and VHR image change detection after L’Aquila 2009 earthquake. Remote Sens. Environ. 2018, 210, 0034–4257. [Google Scholar] [CrossRef]
  3. Metternicht, G.; Hurni, L.; Gogu, R. Remote sensing of landslides: An analysis of the potential contribution to geo-spatial systems for hazard assessment in mountainous environments. Remote Sens. Environ. 2005, 98, 284–303. [Google Scholar] [CrossRef]
  4. Voigt, S.; Kemper, T.; Riedlinger, T.; Kiefl, R.; Scholte, K.; Mehl, H. Satellite image analysis for disaster and crisis-management support. IEEE Trans. Geosci. Remote Sens. 2007, 45, 1520–1528. [Google Scholar] [CrossRef]
  5. Dong, L.; Shan, J. A comprehensive review of earthquake-induced building damage detection with remote sensing techniques. ISPRS J. Photogramm. Remote Sens. 2013, 84, 85–99. [Google Scholar] [CrossRef]
  6. ElGharbawi, T.; Tamura, M. Estimating deformation due to soil liquefaction in Urayasu city, Japan using permanent scatterers. ISPRS J. Photogramm. Remote Sens. 2015, 109, 152–164. [Google Scholar] [CrossRef] [Green Version]
  7. Moya, L.; Marval Perez, L.R.; Mas, E.; Adriano, B.; Koshimura, S.; Yamazaki, F. Novel unsupervised classification of collapsed buildings using satellite imagery, ha-zard scenarios and fragility functions. Remote Sens. 2018, 10, 296. [Google Scholar] [CrossRef] [Green Version]
  8. Ge, P.; Gokon, H.; Meguro, K.; Koshimura, S. Study on the intensity and co-herence information of high-resolution ALOS-2 SAR images for rapid massive land-slide mapping at a pixel level. Remote Sens. 2019, 11, 2808. [Google Scholar] [CrossRef] [Green Version]
  9. Freire, S.; Santos, T.; Navarro, A.; Soares, F.; Silva, J.; Afonso, N.; Fonseca, A.; Tenedório, J. Introducing mapping standards in the quality assessment of buildings extracted from very high resolution satellite imagery. ISPRS J. Photogramm. Remote Sens. 2014, 90, 1–9. [Google Scholar] [CrossRef] [Green Version]
  10. Shi, X.G.; Zhang, L.; Balz, T.; Liao, M.S. Landslide deformation monitoring using point-like target offset tracking with multi-mode high-resolution TerraSAR-X data. ISPRS J. Photogramm. Remote Sens. 2015, 105, 128–140. [Google Scholar] [CrossRef]
  11. Li, Y.; Martinis, S.; Wieland, M. Urban flood mapping with an active self-learning convolutional neural network based on TerraSAR-X intensity and interferometric coherence. ISPRS J. Photogramm. Remote Sens. 2019, 152, 178–191. [Google Scholar] [CrossRef]
  12. Monserrat, O.; Criosetto, M.; Luzi, G. A review of ground-based SAR interferometry for deformation measurement. ISPRS J. Photogramm. Remote Sens. 2014, 93, 40–48. [Google Scholar] [CrossRef] [Green Version]
  13. Raucoules, D.; Ristori, B.; Michele, M.; Briole, P. Surface displacement of the Mw 7 Machaze earthquake (Mozambique): Complementary use of multiband InSAR and radar amplitude image correlation with elastic modelling. Remote Sens. Environ. 2010, 114, 2211–2218. [Google Scholar] [CrossRef] [Green Version]
  14. Arciniegas, G.A.; Bijker, W.; Kerle, N.; Tolpekin, V.A. Coherence- and amplitude-based analysis of seismogenic damage in Bam, Iran, using ENVISAT ASAR data. IEEE Trans. Geosci. Remote Sens. 2007, 5, 1571–1581. [Google Scholar] [CrossRef]
  15. Watanabe, M.; Thapa, R.B.; Ohsumi, T.; Fujiwara, H.; Yonezawa, C.; Tomii, N.; Suzuki, S. Detection of damaged urban areas using interferometric SAR coherence change with PALSAR-2. Earth Planets Space 2016, 68, 131. [Google Scholar] [CrossRef] [Green Version]
  16. Cloude, S.R.; Pottier, E. An entropy based classification scheme for land applica-tions of polarimetric SAR. IEEE Trans. Geosci. Remote Sens. 1997, 35, 68–78. [Google Scholar] [CrossRef]
  17. Freeman, A.; Durden, S.L. A three-component scattering model for polarimetric SAR data. IEEE Trans. Geosci. Remote Sens. 1998, 36, 963–973. [Google Scholar] [CrossRef] [Green Version]
  18. Yamaguchi, Y.; Sato, A.; Boerner, W.M.; Sato, R.; Yamada, H. Four component scattering power decomposition with rotation of coherency matrix. IEEE Trans. Geosci. Remote Sens. 2011, 9, 2251–2258. [Google Scholar] [CrossRef]
  19. Li, N.; Wang, R.; Deng, Y.; Liu, Y.; Li, B.; Wang, C.; Balz, T. Unsupervised polarimetric synthetic aperture radar classification of large-scale landslides caused by Wenchuan earthquake in hue-saturation-intensity color space. J. Appl. Remote Sens. 2014, 8, 083595. [Google Scholar] [CrossRef]
  20. Guo, H.; Liu, L.; Fan, X.; Li, X.; Zhang, L. Earth Observation for Earthquake Disaster Monitoring and Assessment. In Earthquake Research and Analysis-Statistical Studies, Observations and Planning; Intech: Houston, TX, USA, 2012; pp. 293–312. [Google Scholar]
  21. Matsuoka, M.; Nojima, N. Building damage estimation by integration of seismic intensity information and satellite l-band Sar imagery. Remote Sens. 2010, 2, 2111–2126. [Google Scholar] [CrossRef] [Green Version]
  22. Liu, W.; Yamazaki, F.; Gokon, H.; Koshimura, S. Extraction of tsunami-flooded areas and damaged buildings in the 2011 Tohoku-Oki earthquake from terrasar-x intensity images. Earthq. Spectra 2013, 29 (Suppl. S1), S183–S200. [Google Scholar] [CrossRef] [Green Version]
  23. Gokon, H.; Koshimura, S.; Matsuoka, M. Object-based method for estimating tsunami-induced damage using TerraSAR-X data. J. Disaster Res. 2016, 11, 225–235. [Google Scholar] [CrossRef]
  24. Miura, H.; Midorikawa, S.; Matsuoka, M. Building damage assessment using high-resolution satellite Sar images of the 2010 Haiti earthquake. Earthq. Spectra 2016, 32, 591–610. [Google Scholar] [CrossRef]
  25. Liu, W.; Yamazaki, F. Extraction of collapsed buildings in the 2016 Kumamoto earthquake using multi-temporal palsar-2 data. J. Disaster Res. 2017, 12, 241–250. [Google Scholar] [CrossRef]
  26. Bai, Y.; Gao, C.; Singh, S.; Koch, M.; Adriano, B.; Mas, E.; Koshimura, S. A framework of rapid regional tsunami damage recognition from post-event TerraSAR-X imagery using deep neural networks. IEEE Trans. Geosci. Remote Sens. 2018, 15, 43–47. [Google Scholar] [CrossRef] [Green Version]
  27. Massonnet, D.; Rossi, M.; Carmona, C.; Adragna, F.; Peltzer, G.; Feigl, K.; Rabaute, T. The displacement field of the Landers earthquake mapped by radar interferometry. Nature 1993, 364, 138–142. [Google Scholar] [CrossRef]
  28. Zhao, L.L.; Yang, J.; Li, P.X.; Zhang, L.P.; Shi, L.; Lang, F.K. Damage assessment in urban areas using post-earthquake airborne PolSAR imagery. Int. J. Remote Sens. 2013, 34, 8952–8966. [Google Scholar] [CrossRef]
  29. Karimzadeh, S.; Matsuoka, M.; Miyajima, M.; Adriano, B.; Fallahi, A.; Karashi, J. Sequential SAR Coherence Method for the Monitoring of Buildings in Sarpole-Zahab, Iran. Remote Sens. 2018, 10, 1255. [Google Scholar] [CrossRef] [Green Version]
  30. Yao, Y.; Wen, S.; Yang, L.; Wu, C.; Sun, X.; Wang, L.; Zhang, Z. A Shallow and left-lateral rupture event of the 2021 Mw 5.3 Baicheng earthquake: Implications for the diffuse deformation of Southern Tianshan. Earth Space Sci. 2022, 9, e2021EA001995. [Google Scholar] [CrossRef]
  31. Jiang, H.J.; Feng, G.C.; Wang, T.; Bürgmann, R. Toward Full Exploitation of Coherent and Incoherent Information in Sentinel-1 TOPS Data for Retrieving Surface Displacement: Application to the 2016 Kumamoto (Japan) Earthquake. Geophys. Res. Lett. 2017, 44, 1758–1767. [Google Scholar] [CrossRef] [Green Version]
  32. Chen, Q.; Liu, X.W.; Zhang, Y.J.; Zhao, J.; Xu, Q.; Yang, Y.; Liu, G.X. A nonlinear inversion of InSAR-observed coseismic surface deformation for estimating variable fault dips in the 2008 Wenchuan earthquake. Int. J. Appl. Earth Obs. Geoinf. 2019, 76, 179–192. [Google Scholar] [CrossRef]
  33. Fielding, E.J.; Liu, Z.; Stephenson, O.L.; Zhong, M.; Liang, C.; Moore, A. Surface Deformation Related to the 2019 Mw 7.1 and 6.4 Ridgecrest Earthquakes in California from GPS, SAR Interferometry, and SAR Pixel Offsets. Seismol. Res. Lett. 2020, 91, 2035–2046. [Google Scholar] [CrossRef]
  34. He, Z.; Chen, T.; Wang, M.; Li, Y. Multi-Segment Rupture Model of the 2016 Kumamoto Earthquake Revealed by InSAR and GPS Data. Remote Sens. 2020, 12, 3721. [Google Scholar] [CrossRef]
  35. Matsuoka, M.; Yamazaki, F. Use of SAR imagery for monitoring areas damaged due to the 2006 Mid Java, Indonesia earthquake. In Proceedings of the 4th International Workshop on Remote Sensing for Post-Disaster Response 2006, Cambridge, UK, 25–26 September 2006. [Google Scholar]
  36. Zhang, X.; Liu, W.; He, S. Urban change detection in TerraSAR image using the difference method and SAR coherence coefficient. J. Eng. Sci. Technol. Rev. 2018, 11, 18–23. [Google Scholar]
  37. Matsuoka, M.; Estrada, M. Development of earthquake-induced building damage estimation model based on ALOS/PALSAR observing the 2007 Peru earthquake. J. Disaster Res. 2013, 8, 346–355. [Google Scholar] [CrossRef] [Green Version]
  38. Karimzadeh, S.; Mastuoka, M. Building damage assessment using multisensor dual-polarized synthetic aperture radar data for the 2016 M6.2 Amatrice earthquake, Italy. Remote Sens. 2017, 9, 330. [Google Scholar] [CrossRef] [Green Version]
  39. Copernicus Open Access Hub. Available online: https://scihub.copernicus.eu/ (accessed on 10 October 2021).
  40. Yonezawa, C.; Takeuchi, S. Decorrelation of SAR data by urban damages caused by the 1995 Hyogoken-Nanbu earthquake. Int. J. Remote Sens. 2001, 22, 1585–1600. [Google Scholar] [CrossRef]
  41. Zebker, H.; Villasenor, J. Decorrelation in interferometric radar echoes. IEEE Trans. Geosci. Remote Sens. 1992, 30, 950–959. [Google Scholar] [CrossRef] [Green Version]
  42. Zebker, H.; Chen, K. Accurate estimation of correlation in InSAR observations. IEEE Trans. Geosci. Remote Sens. 2005, 2, 124–127. [Google Scholar] [CrossRef]
  43. Sharma, R.C.; Tateishi, R.; Hara, K.; Nguyen, H.T.; Gharechelou, S.; Nguyen, L.V. Earthquake damage visualization (EDV) technique for the rapid detection of earthquake-induced damages using SAR data. Sensors 2017, 17, 235. [Google Scholar] [CrossRef]
  44. Sinclair, G. The transmission and reception of elliptically polarized waves. Proc. IRE 1950, 38, 148–151. [Google Scholar] [CrossRef]
  45. Lee, J.S.; Grunes, M.R.; Pottier, E. Quantitative comparison of classification capability: Fully polarimetric versus dual and single-polarization SAR. IEEE Trans. Geosci. Remote Sens. 2001, 39, 2343–2351. [Google Scholar]
  46. Cloude, S.R.; Pottier, E. A review of target decomposition theorems in radar polarimetry. IEEE Trans. Geosci. Remote Sens. 1996, 34, 498–518. [Google Scholar] [CrossRef]
  47. Tamkuan, N.; Nagai, M. Sentinel-1A Analysis for Damage Assessment: A Case Study of Kumamoto Earthquake in 2016. MATTER Int. J. Sci. Technol. 2019, 5, 23–35. [Google Scholar] [CrossRef] [Green Version]
  48. Niu, C.; Zhang, H.; Liu, W.; Li, R.; Hu, T. Using a fully polarimetric SAR to detect landslide in complex surroundings: Case study of 2015 Shenzhen landslide. ISPRS J. Photogramm. Remote Sens. 2021, 174, 0924–2716. [Google Scholar] [CrossRef]
  49. Pinglan, G.; Hideomi, G.; Kimiro, M. A review on synthetic aperture radar-based building damage assessment in disasters. Remote Sens. Environ. 2020, 240, 0034–4257. [Google Scholar]
  50. Xu, X.; Sandwell, D.T.; Smith, K.B. Coseismic Displacements and Surface Fractures from Sentinel-1 InSAR: 2019 Ridgecrest Earthquakes. Seismol. Res. Lett. 2020, 91, 1979–1985. [Google Scholar] [CrossRef]
  51. Stilla, U.; Soergel, U.; Thoennessen, U. Potential and limits of InSAR data for building reconstruction in built-up areas. ISPRS J. Photogramm. Remote Sens. 2003, 58, 113–123. [Google Scholar] [CrossRef] [Green Version]
  52. Talledo, D.A.; Miano, A.; Bonano, M.; Carlo, F.D.; Lanari, R.; Manunta, M.; Meda, A.; Mele, A.; Prota, A.; Saetta, A.; et al. Satellite radar interferometry: Potential and limitations for structural assessment and monitoring. J. Build. Eng. 2022, 46, 103756. [Google Scholar] [CrossRef]
Figure 1. Study area. (a) Details of the Baicheng earthquake, as shown in an optical image obtained using Google Earth Engine (https://earthengine.google.com/), and accessed on 10 October 2021. Location of the hypocenter, drawn as a white circle. The red part is the building area, and the yellow polygon is the UAV operation range; (b) Location of the Baicheng county, drawn as a black polygon. The blue circle represents the location of the Baicheng earthquake. The red box represents the position of (a) in (b); (c) UAV images.
Remotesensing 14 03009 g001
Figure 2. DInSAR processing workflow.
Remotesensing 14 03009 g002
Figure 3. Basic steps of DInSAR.
Remotesensing 14 03009 g003
Figure 4. Surface deformation projected along the radar line of sight, obtained from DInSAR analysis. Location of the hypocenter, drawn as a blue circle.
Remotesensing 14 03009 g004
Figure 5. Examples of UAV images. (a) Collapsed building; (b) Severely damaged building; (c) Lightly damaged building; (d) Undamaged building.
Remotesensing 14 03009 g005
Figure 6. Coherence coefficient diagram. (a) Pre-seismic coherence coefficient diagram; (b) Coseismic coherence coefficient diagram. Location of the hypocenter, drawn as a black circle.
Remotesensing 14 03009 g006
Figure 7. Building damage assessment map. (a) Damage assessment map obtained by coherent change detection; (b) Overlay of Figure 5a based on optical image obtained using Google Earth Engine (https://earthengine.google.com/), and accessed on 10 October 2021.
Remotesensing 14 03009 g007
Figure 8. RGB color synthesis results in partial colors.
Remotesensing 14 03009 g008
Figure 9. Sample diagram of coherent change detection. (A) Lightly damaged building; (B) Severely damaged building. The yellow boxes indicate areas that are not correctly identified.
Remotesensing 14 03009 g009
Figure 10. Polarimetric decomposition results. (a) Polarization decomposition results of pre-seismic images; (b) Polarization decomposition results of coseismic images; (c) The corresponding optical image obtained using Google Earth; (d) On the basis of Figure 10c, the building area is superimposed in red. Location of the hypocenter, drawn as a white circle.
Remotesensing 14 03009 g010
Figure 11. Building damage assessment map. (a) Damage assessment map obtained by polarimetric decomposition; (b) Overlay of Figure 11a based on optical image obtained using Google Earth Engine (https://earthengine.google.com/), and accessed on 10 October 2021.
Remotesensing 14 03009 g011
Figure 12. Building damage assessment map. (a) Building damage assessment map based on the combination of coherent change detection and polarization decomposition; (b) Overlay of Figure 12a based on surface deformation results and optical image obtained using Google Earth Engine (https://earthengine.google.com/), and accessed on 10 October 2021. The dashed black line indicates the threshold of the LOS deformation field. (cf) images are taken from UAV. (c) Field investigation image corresponding to area c (collapsed building) in Figure 12a; (d) Field investigation image corresponding to area d (severely damaged building) in Figure 12a; (e) Field investigation image corresponding to area e (lightly damaged building) in Figure 12a; (f) Field investigation image corresponding to area f (undamaged building) in Figure 12a.
Remotesensing 14 03009 g012
Figure 13. Comparison of the results of the three methods. The first column is an example of UAV sampling: (A) collapsed building; (B) severely damaged building; (C) lightly damaged building; (D) undamaged building. The second column is the coherent change detection result corresponding to the first column. The third column is the polarization decomposition result corresponding to the first column. The fourth column is the result of the comprehensive detection method corresponding to the first column.
Remotesensing 14 03009 g013
Table 1. Details of Sentinel-1A images.
Acquisition DateProduct TypePolarization ModeBandSpace Baseline/mTime Baseline/d
1 March 2021SLCVV + VHC27.27
30.36
12
12
13 March 2021SLCVV + VHC
25 March 2021SLCVV + VHC
Table 2. Accuracy verification of coherent change detection.
CategoriesCoherent Change Detection
Damaged/m2Undamaged/m2Total/m2
Actual resultsDamaged/m240,921251543,436
Undamaged/m225,41541,51266,927
Total/m266,33644,027110,363
Table 3. Accuracy verification of polarimetric decomposition.
CategoriesPolarimetric Decomposition
Damaged/m2Undamaged/m2Total/m2
Actual resultsDamaged/m228,99814,43843,436
Undamaged/m2502561,90266,927
Total/m234,02376,340110,363
Table 4. Accuracy verification of building damage detection.
CategoriesBuilding Damage Detection
Damaged/m2Undamaged/m2Total/m2
Actual resultsDamaged/m237,434600243,436
Undamaged/m210,45556,47266,927
Total/m247,88962,474110,363
Table 5. The accuracy of the two different methods and the combined results.
CategoriesDamagedUndamagedOverall AccuracyKappa Coefficient
Coherent change detection94%62%75%0.51
Polarimetric decomposition67%92%82%0.62
Integration method86%84%85%0.69
Publisher’s Note: MDPI stays neutral with regard to jurisdictional claims in published maps and institutional affiliations.

