
Identification and Evaluation of the Polycentric Urban Structure: An Empirical Analysis Based on Multi-Source Big Data Fusion


Abstract
:1. Introduction
2. Materials and Methods
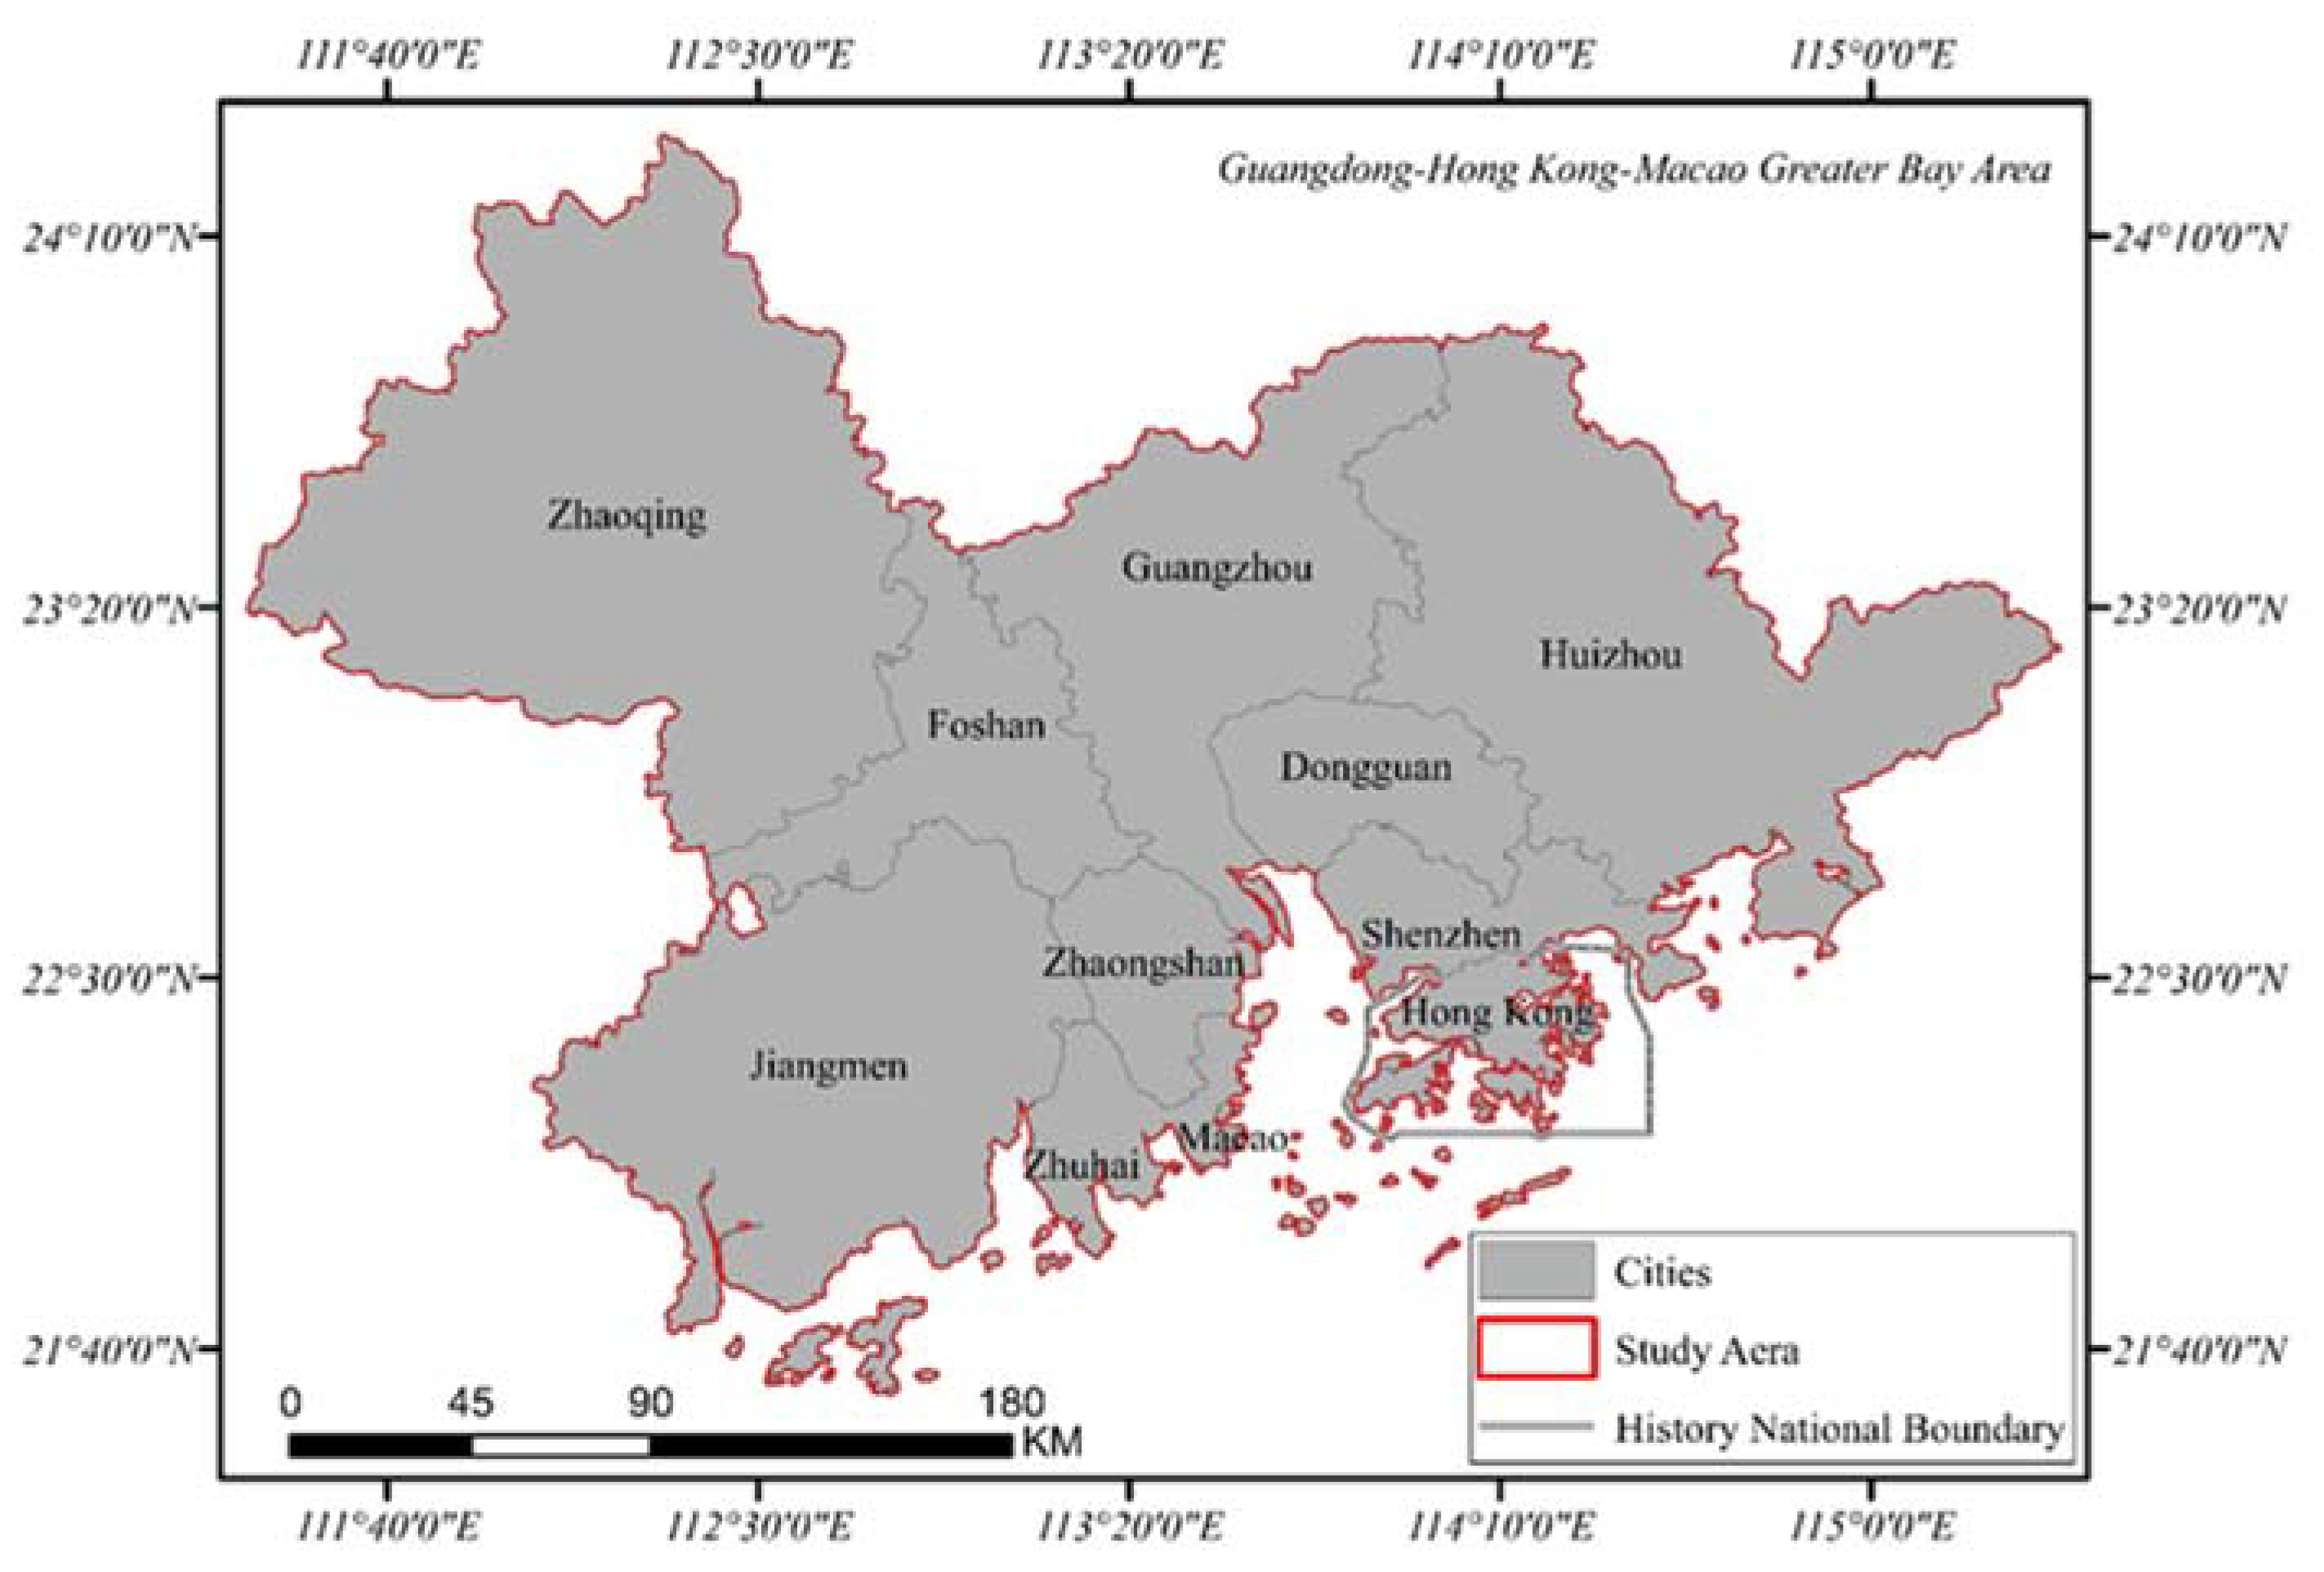
2.1. Study Area
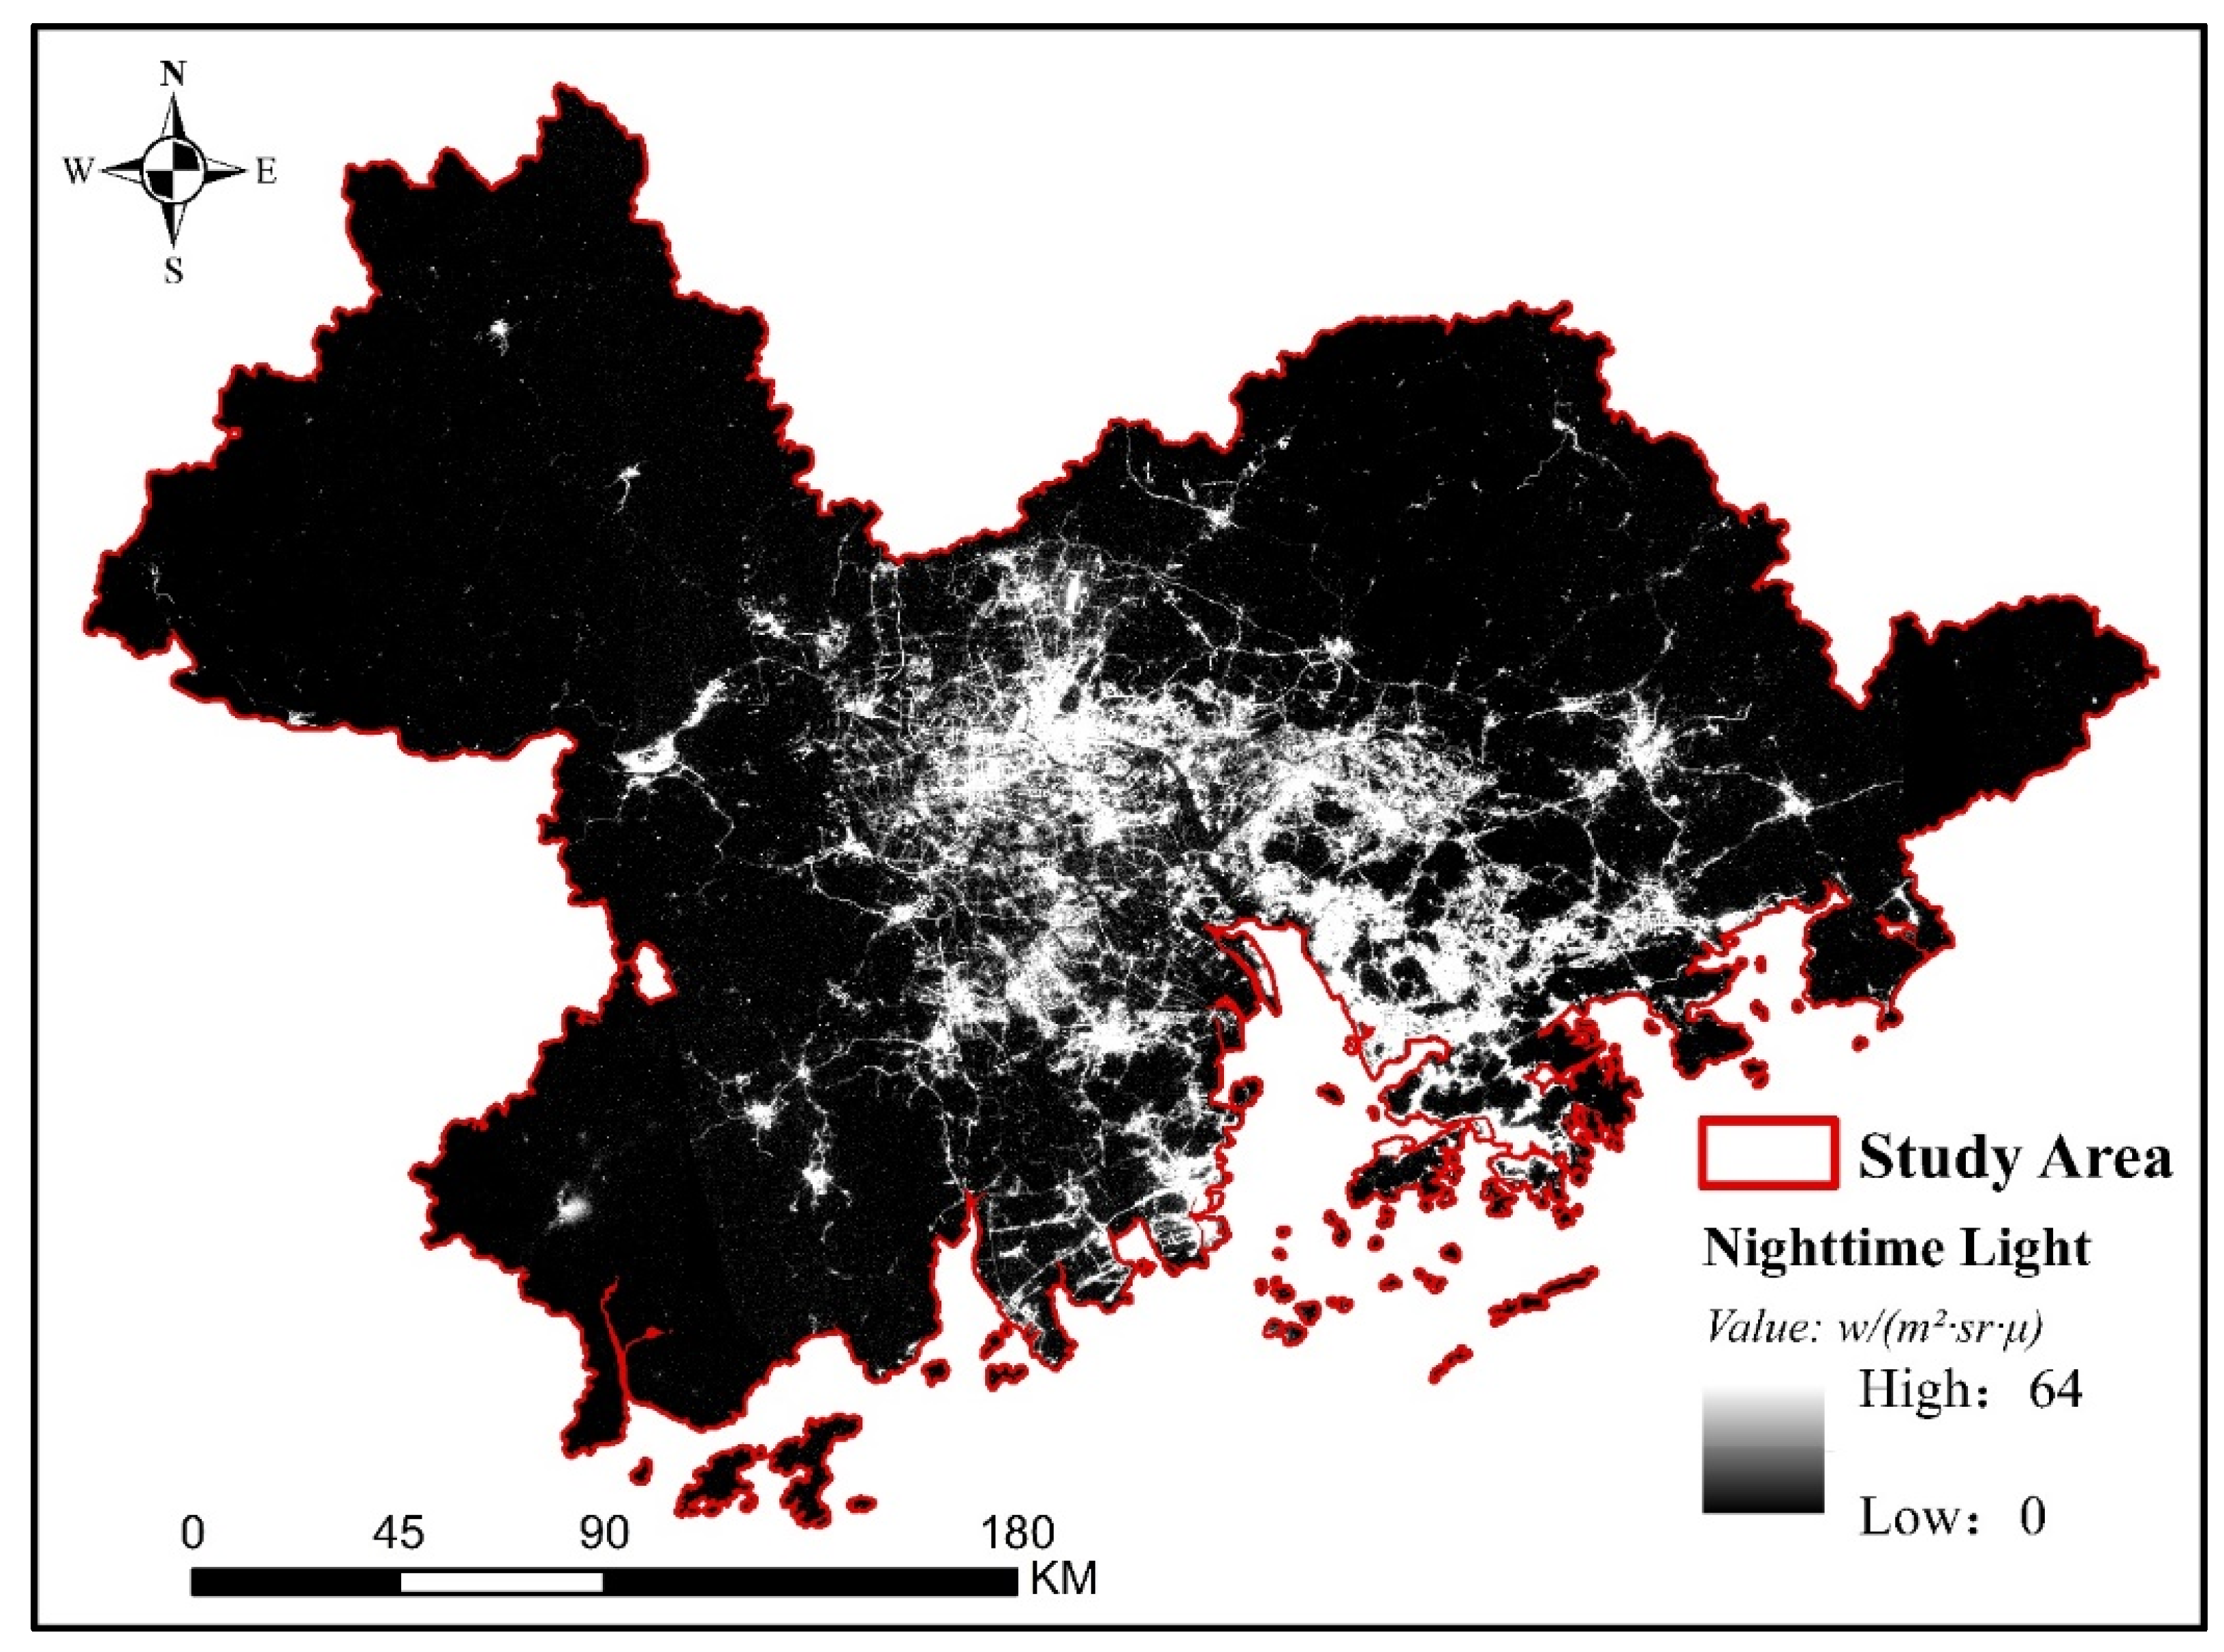
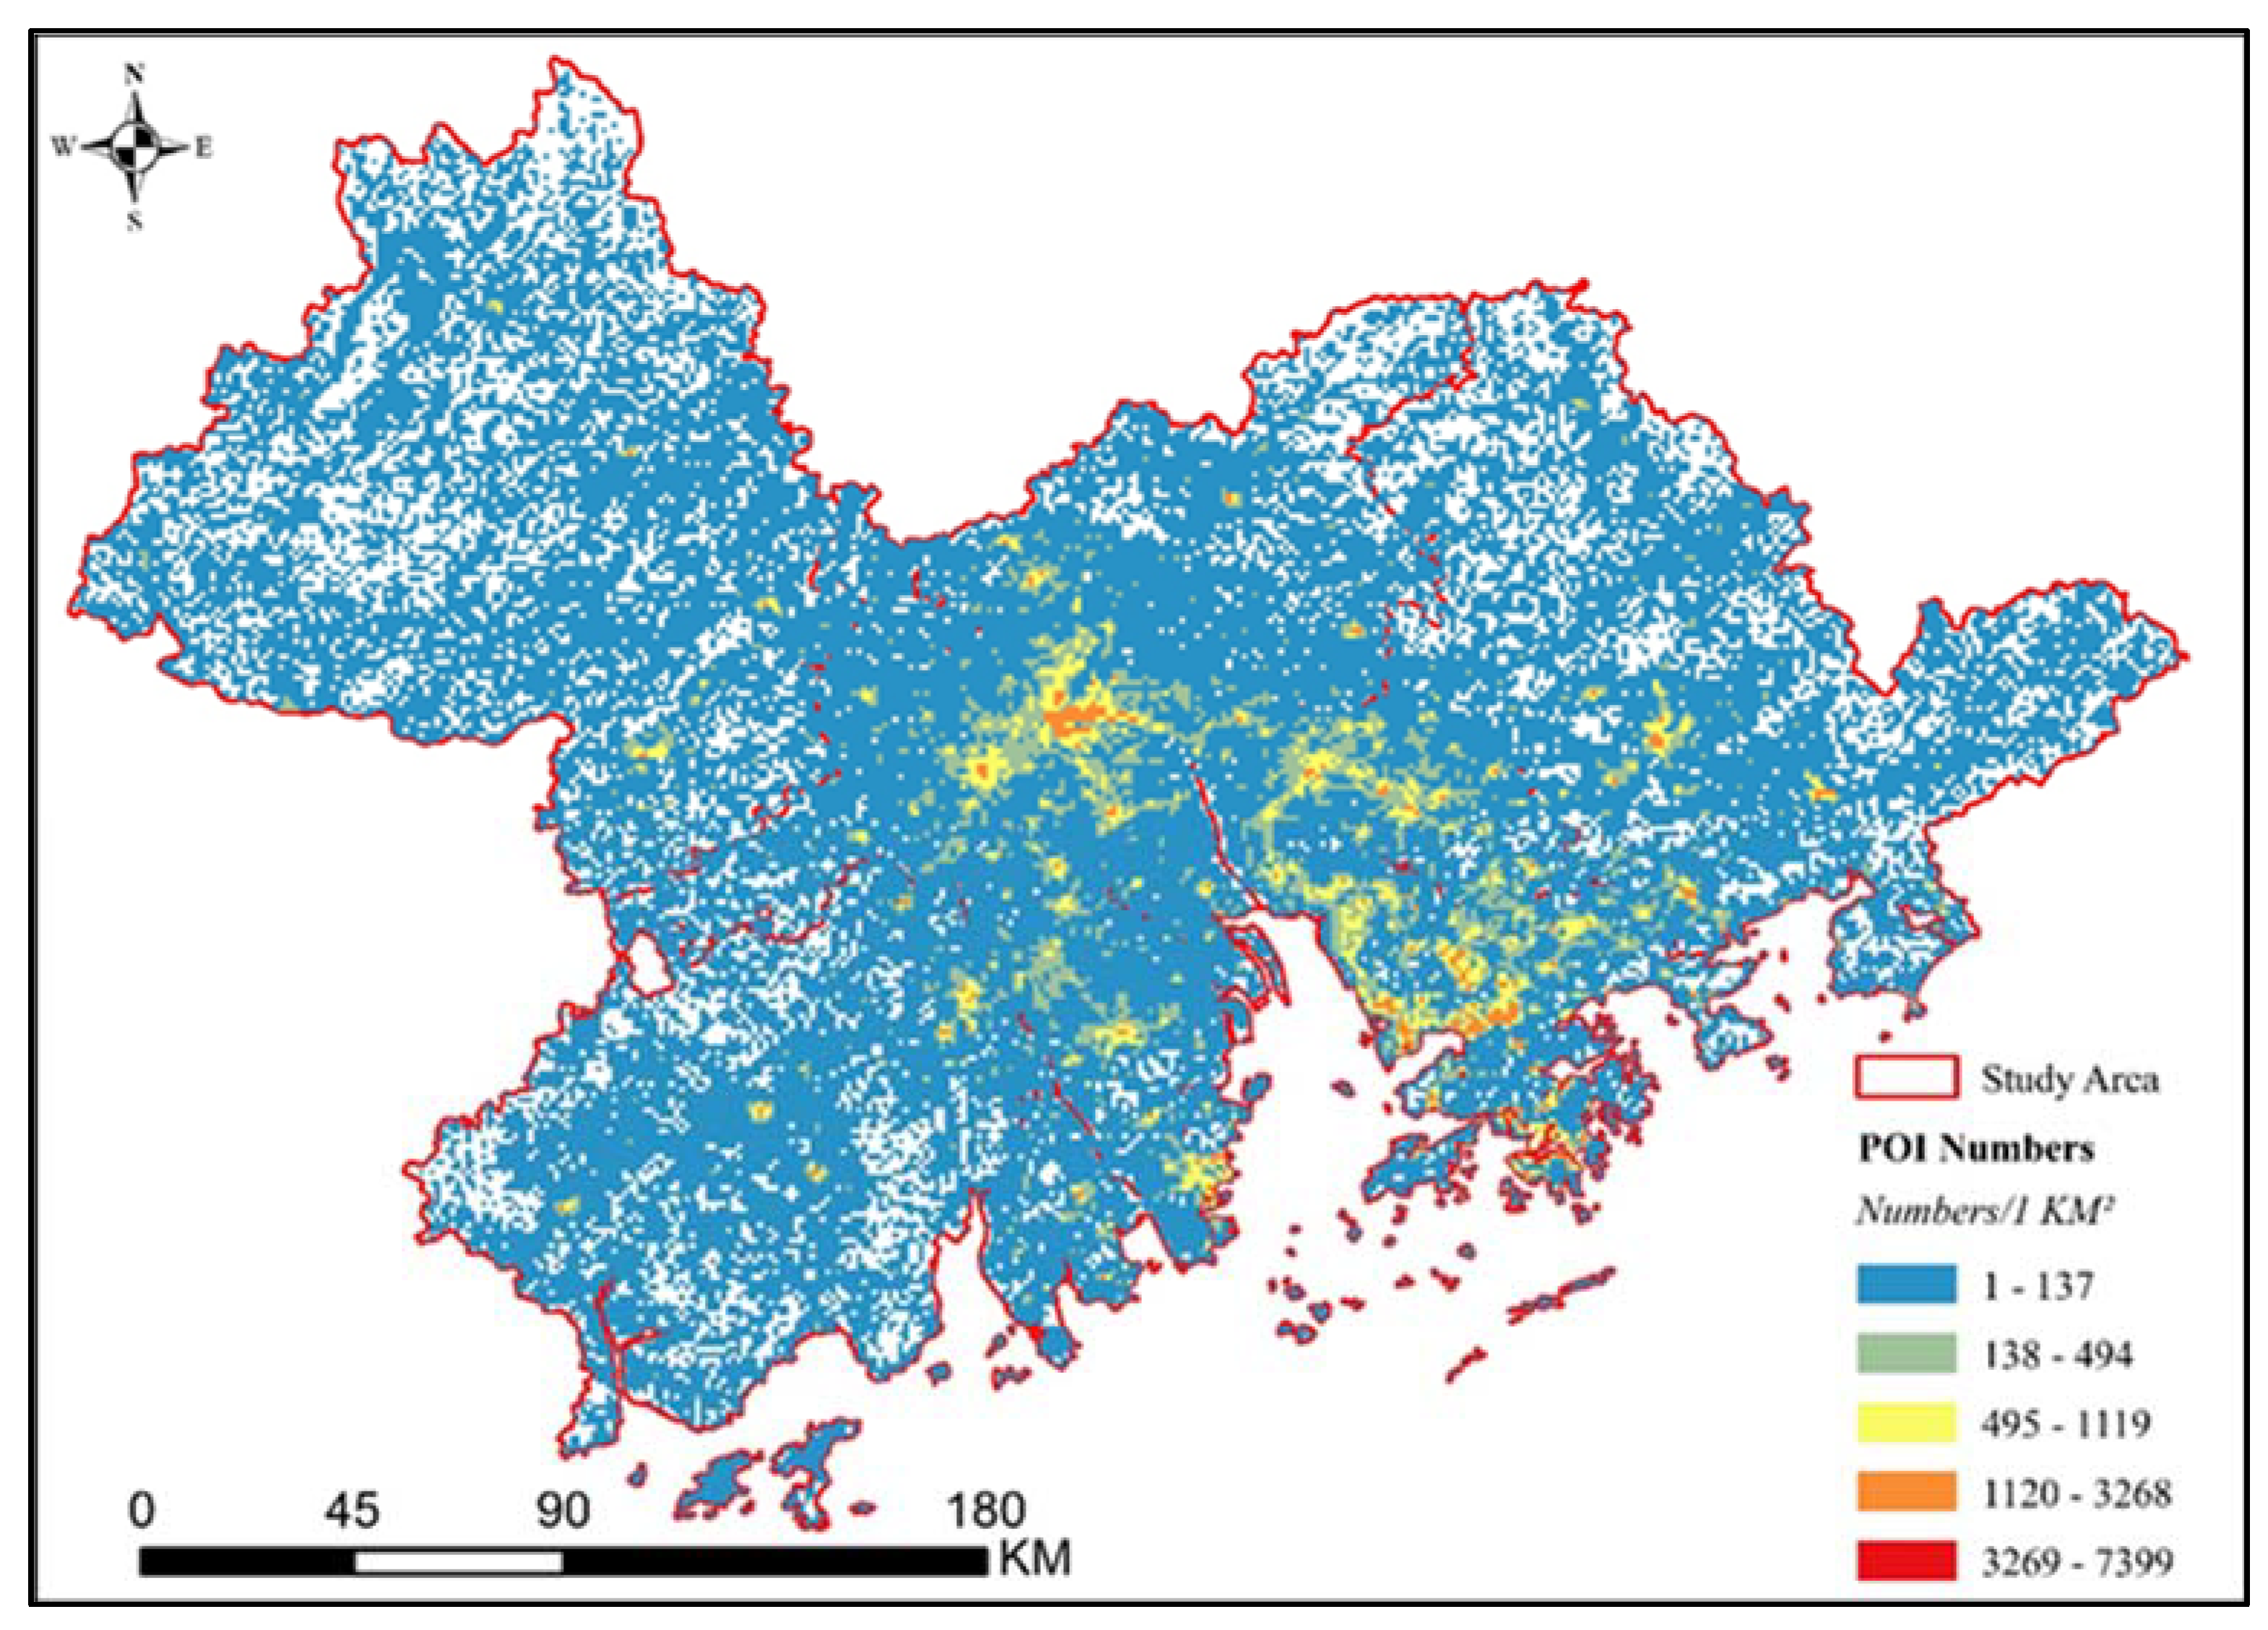
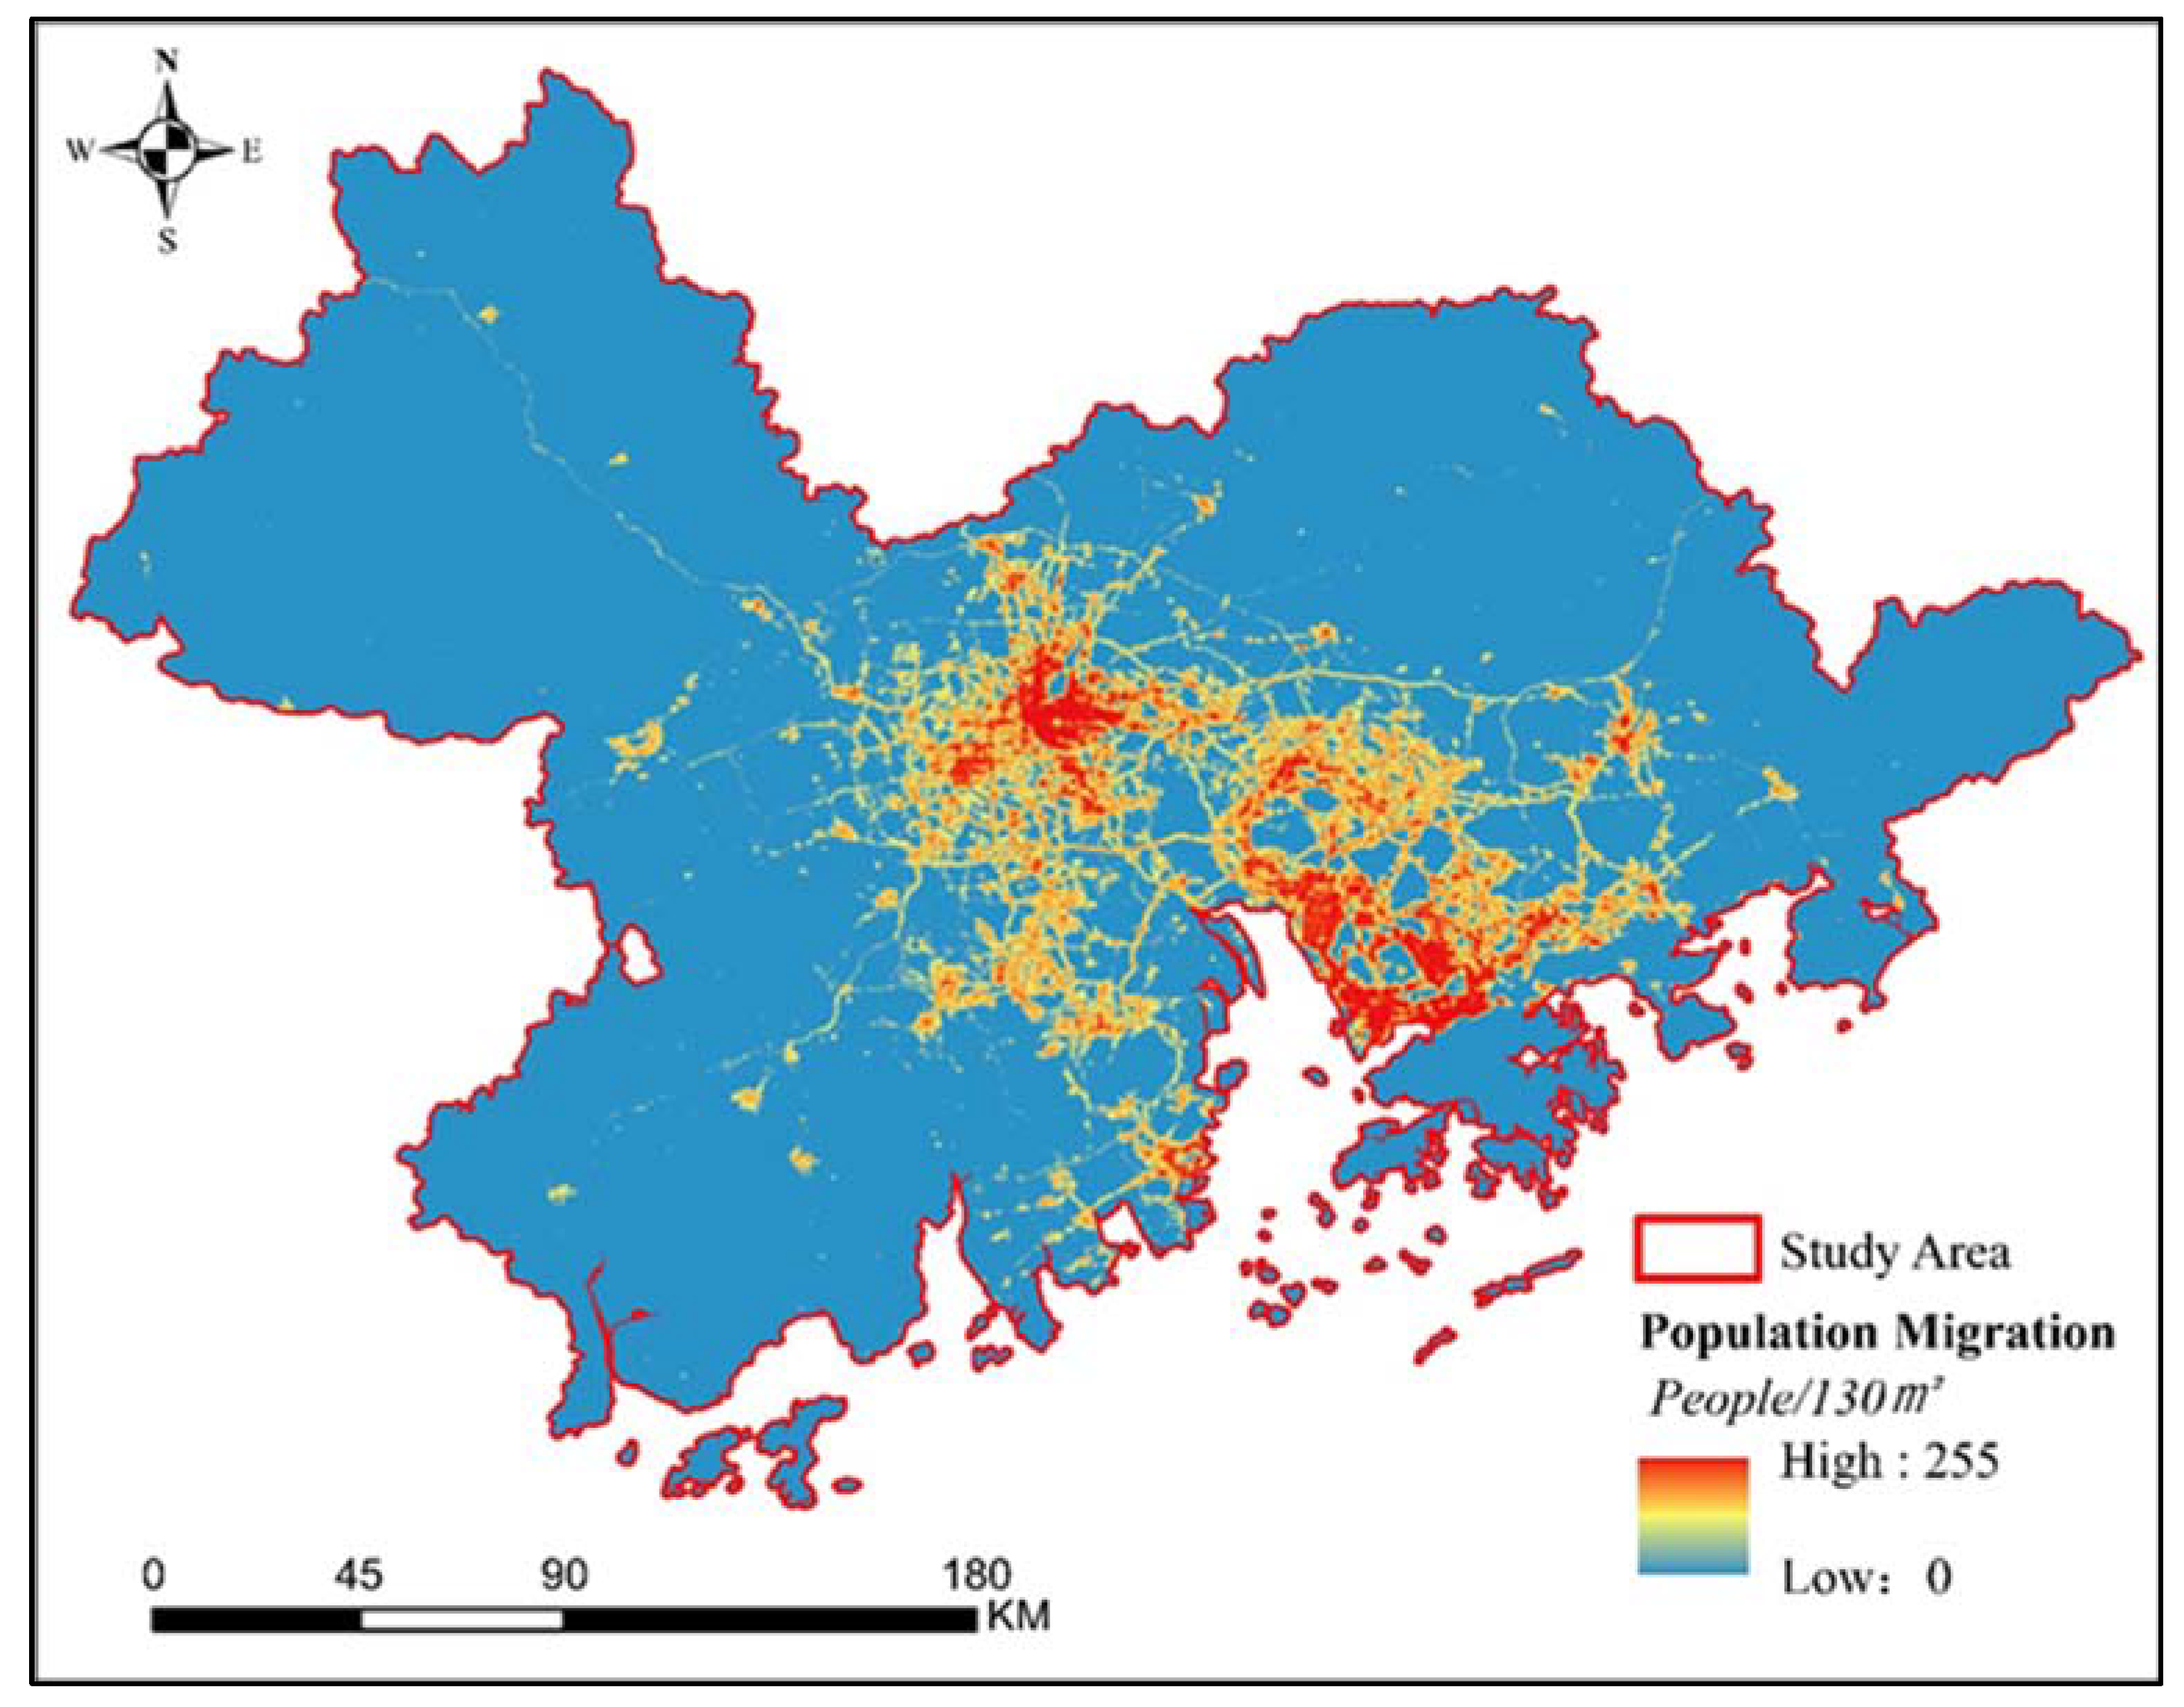
2.2. Study Data
2.3. Study Method
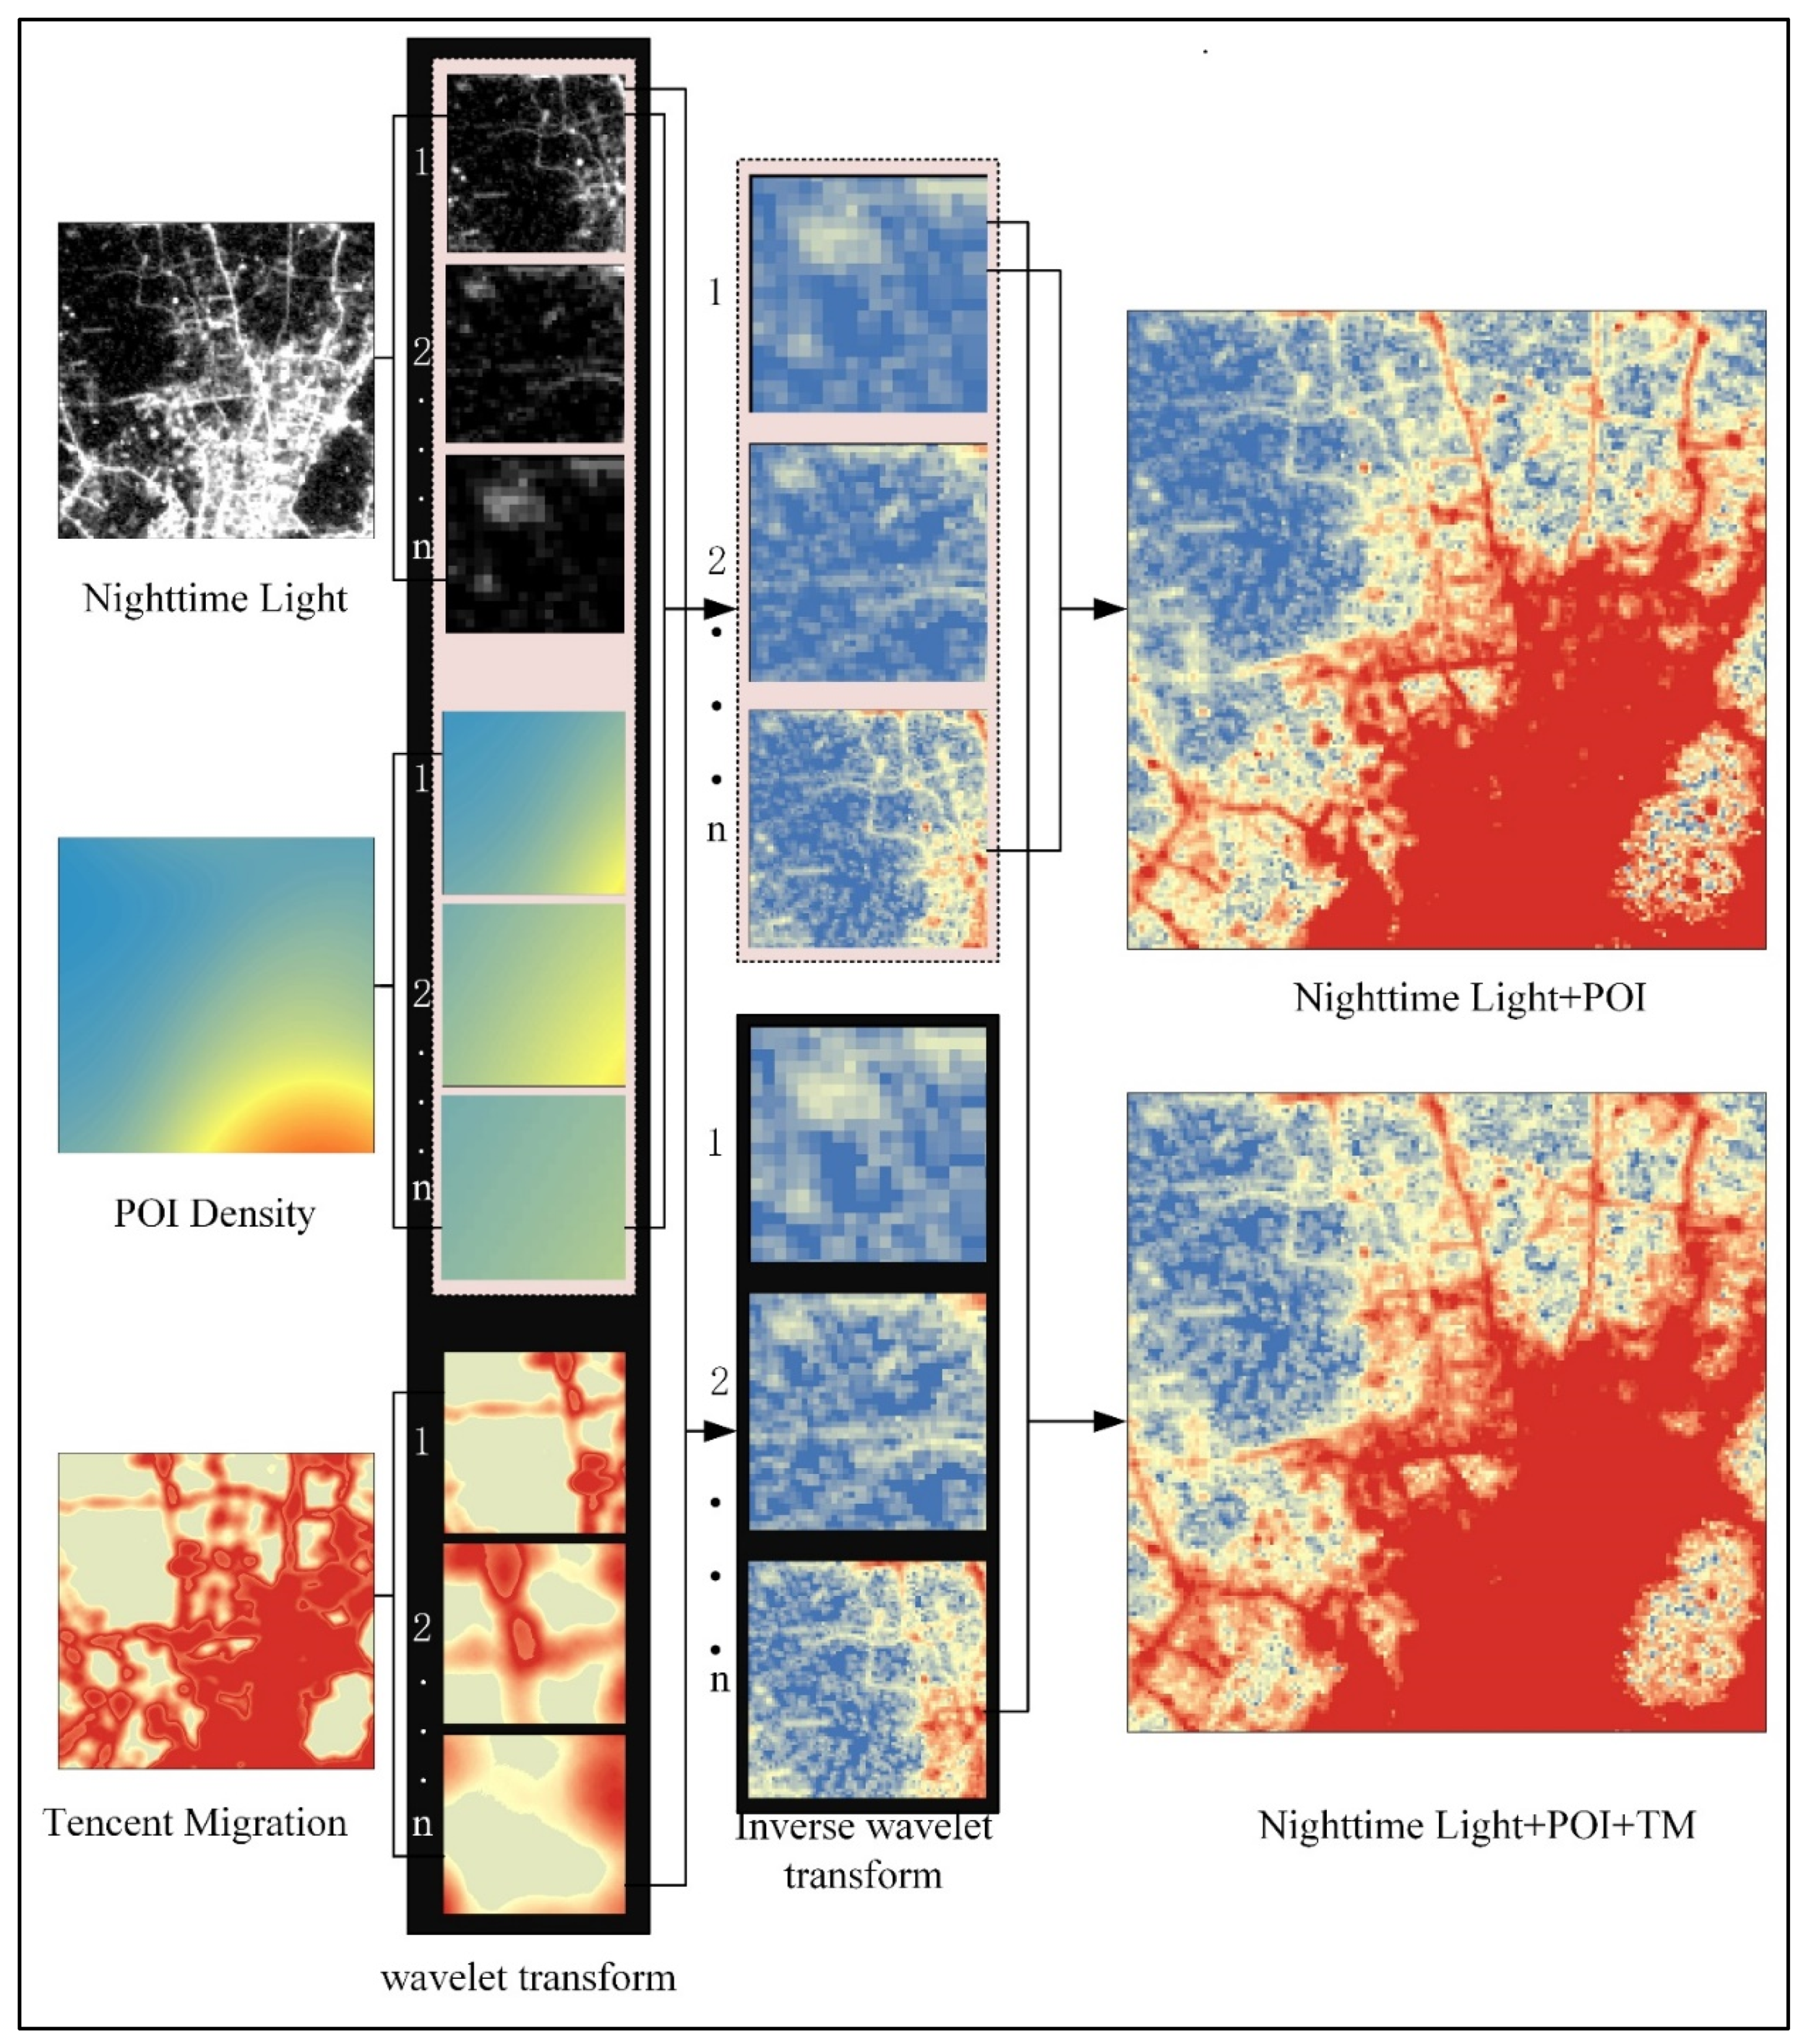
2.3.1. Wavelet Transform (WT)
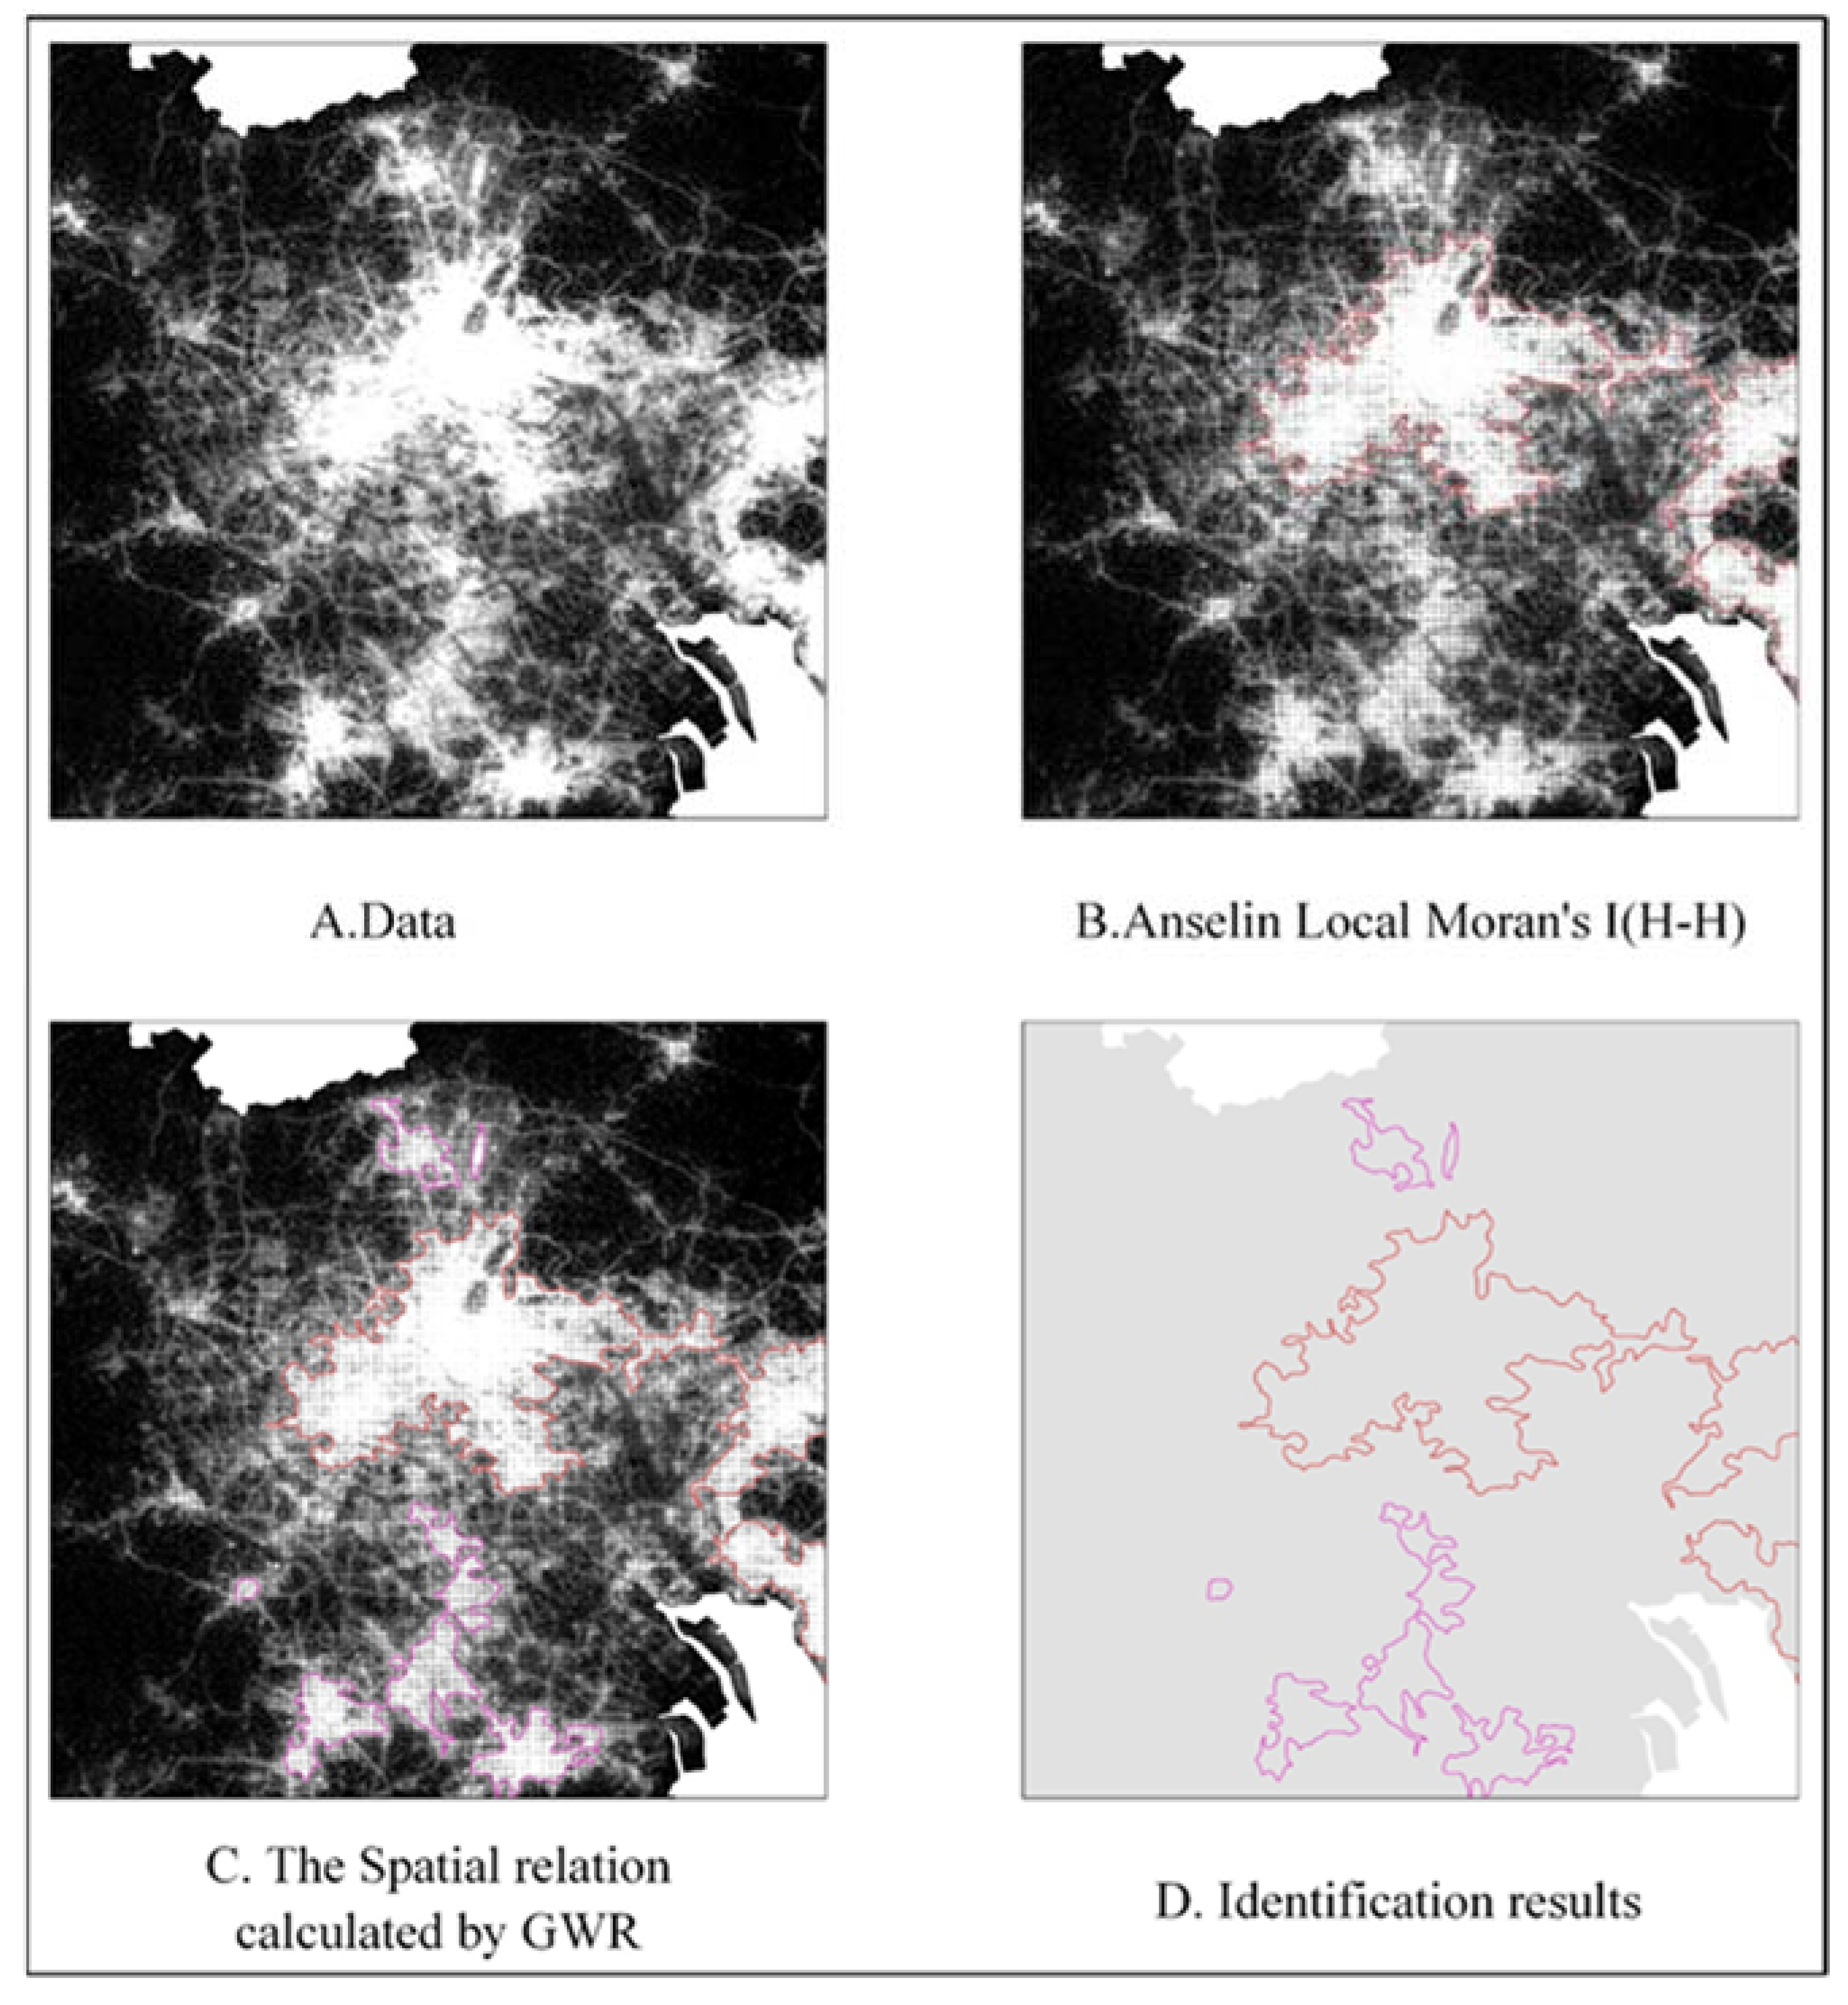
2.3.2. Spectral Difference Segmentation (SDS)
2.3.3. Clustering and Outlier Analysis
2.3.4. Geographically Weighted Regression (GWR)
3. Results
3.1. Fusion of Multi-Source Big Data
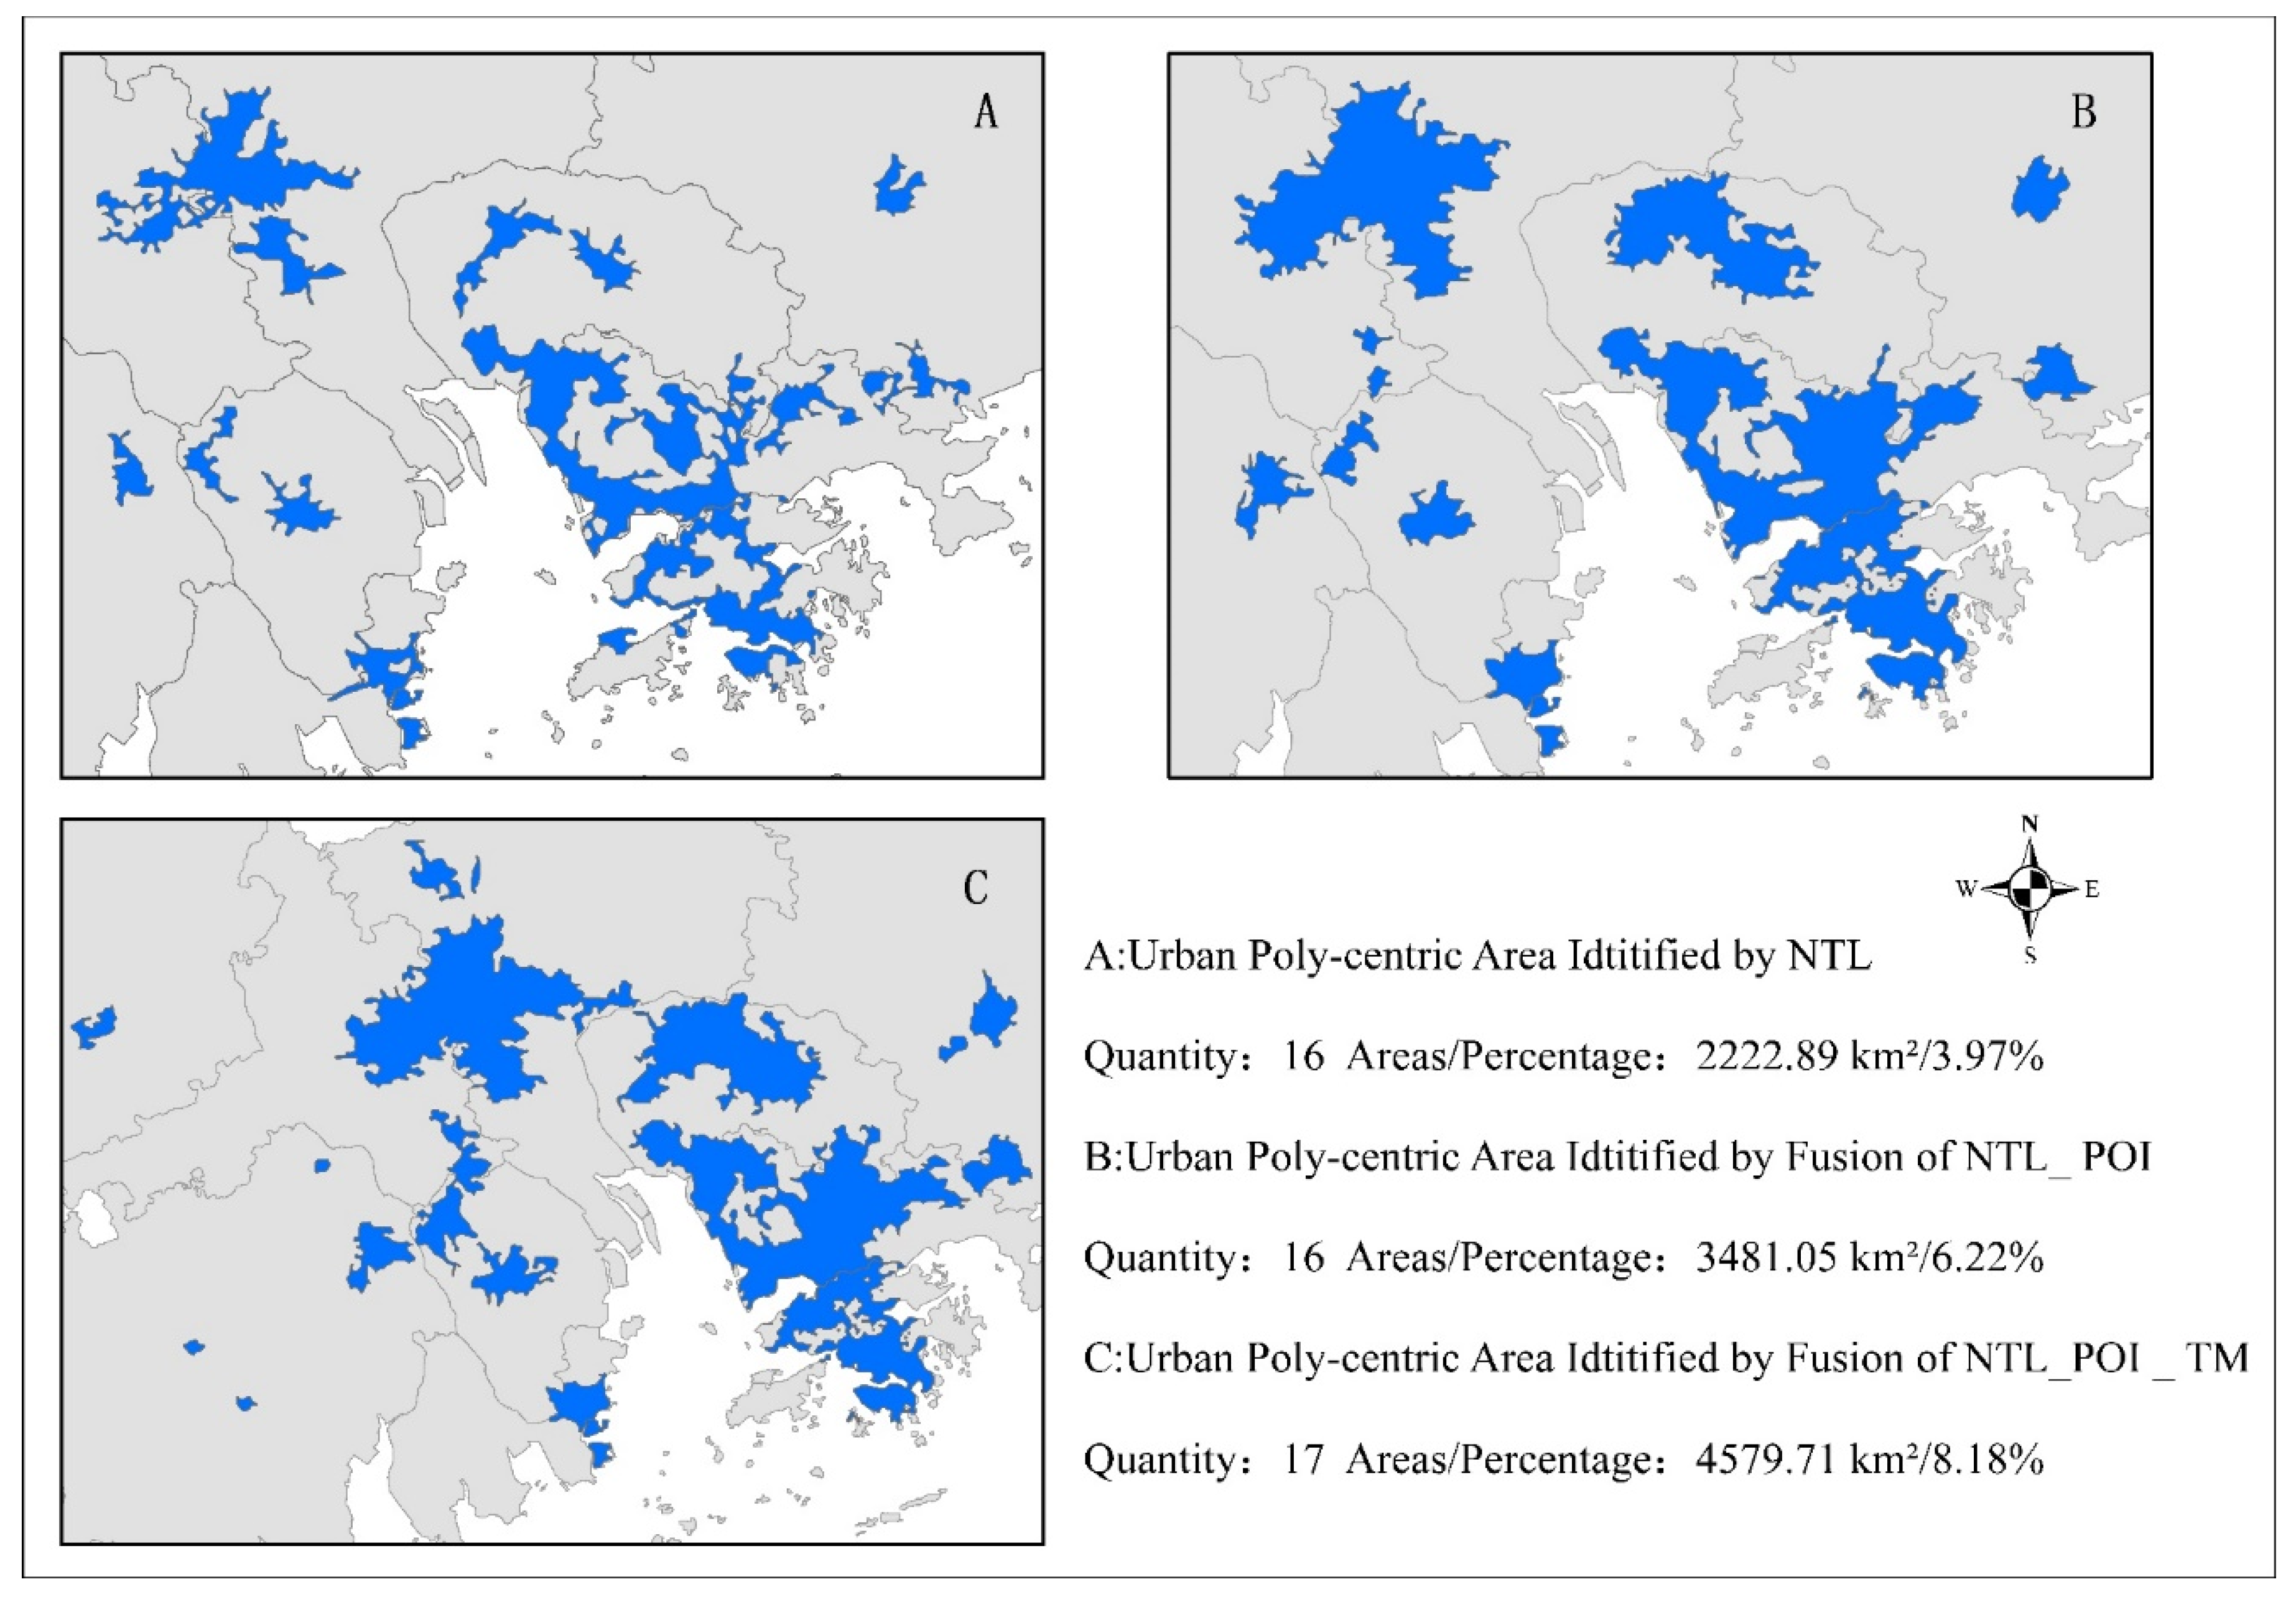
3.2. The Identification of Poly-Centers in the GBA
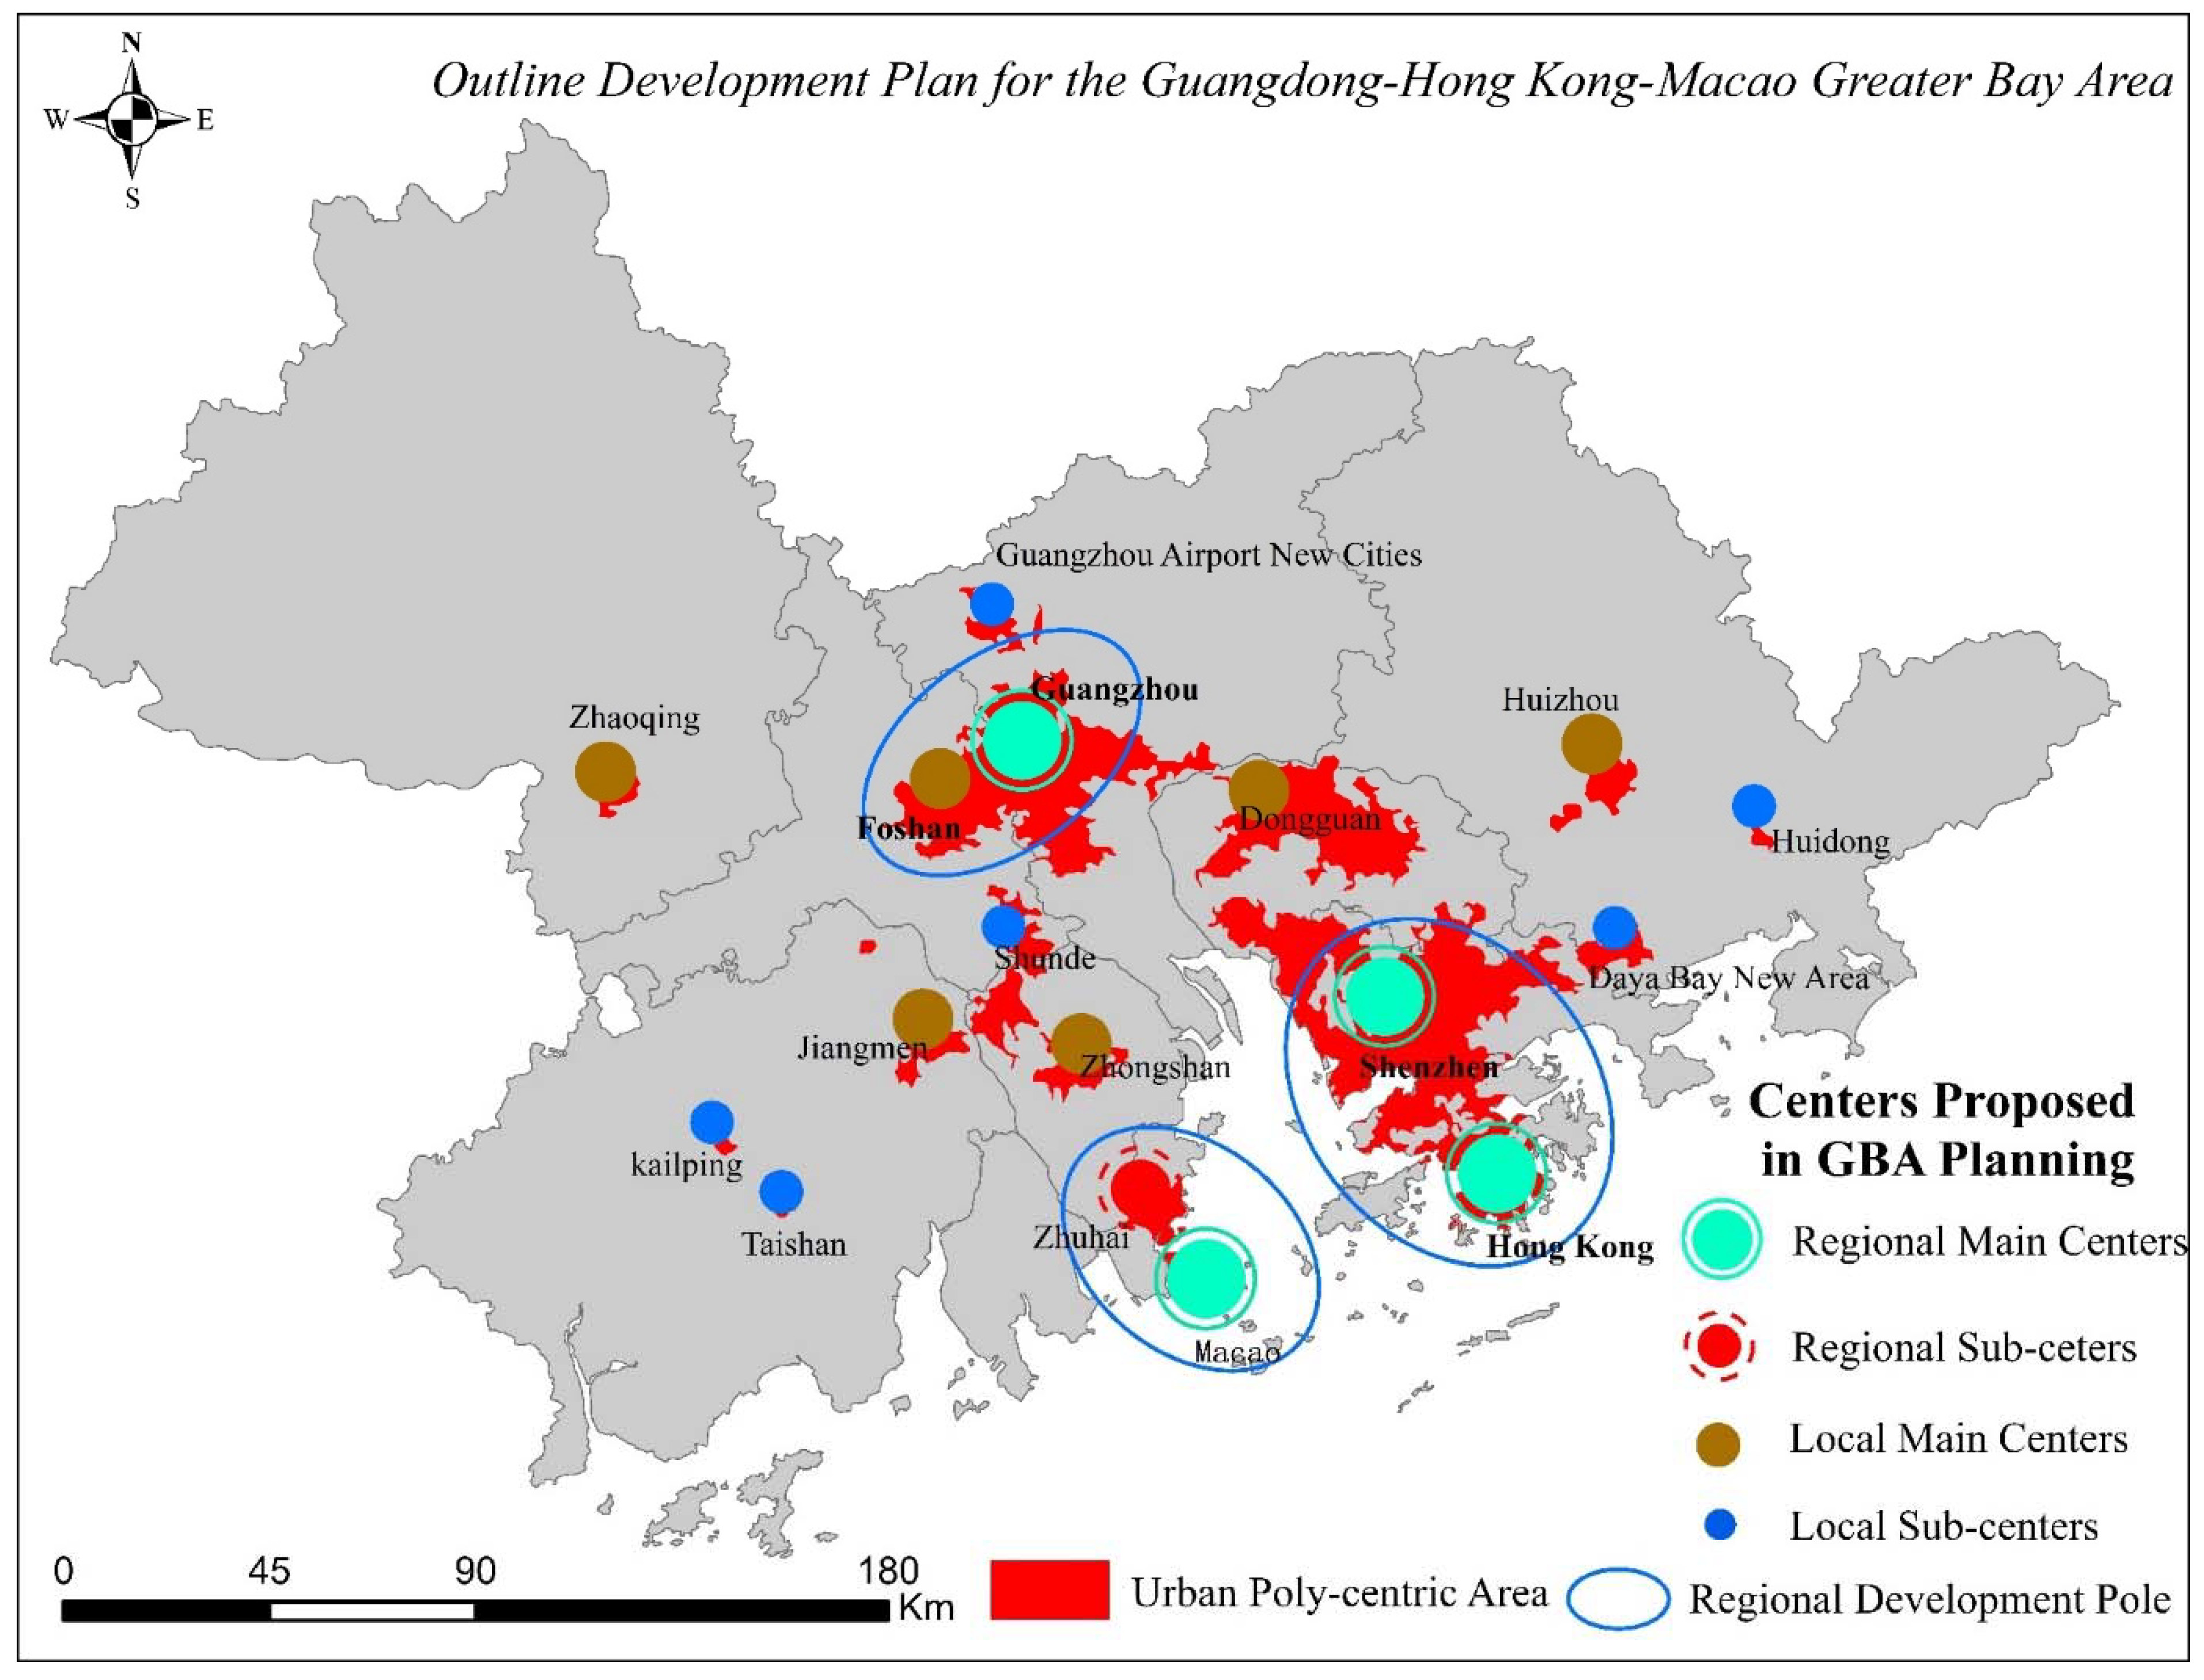
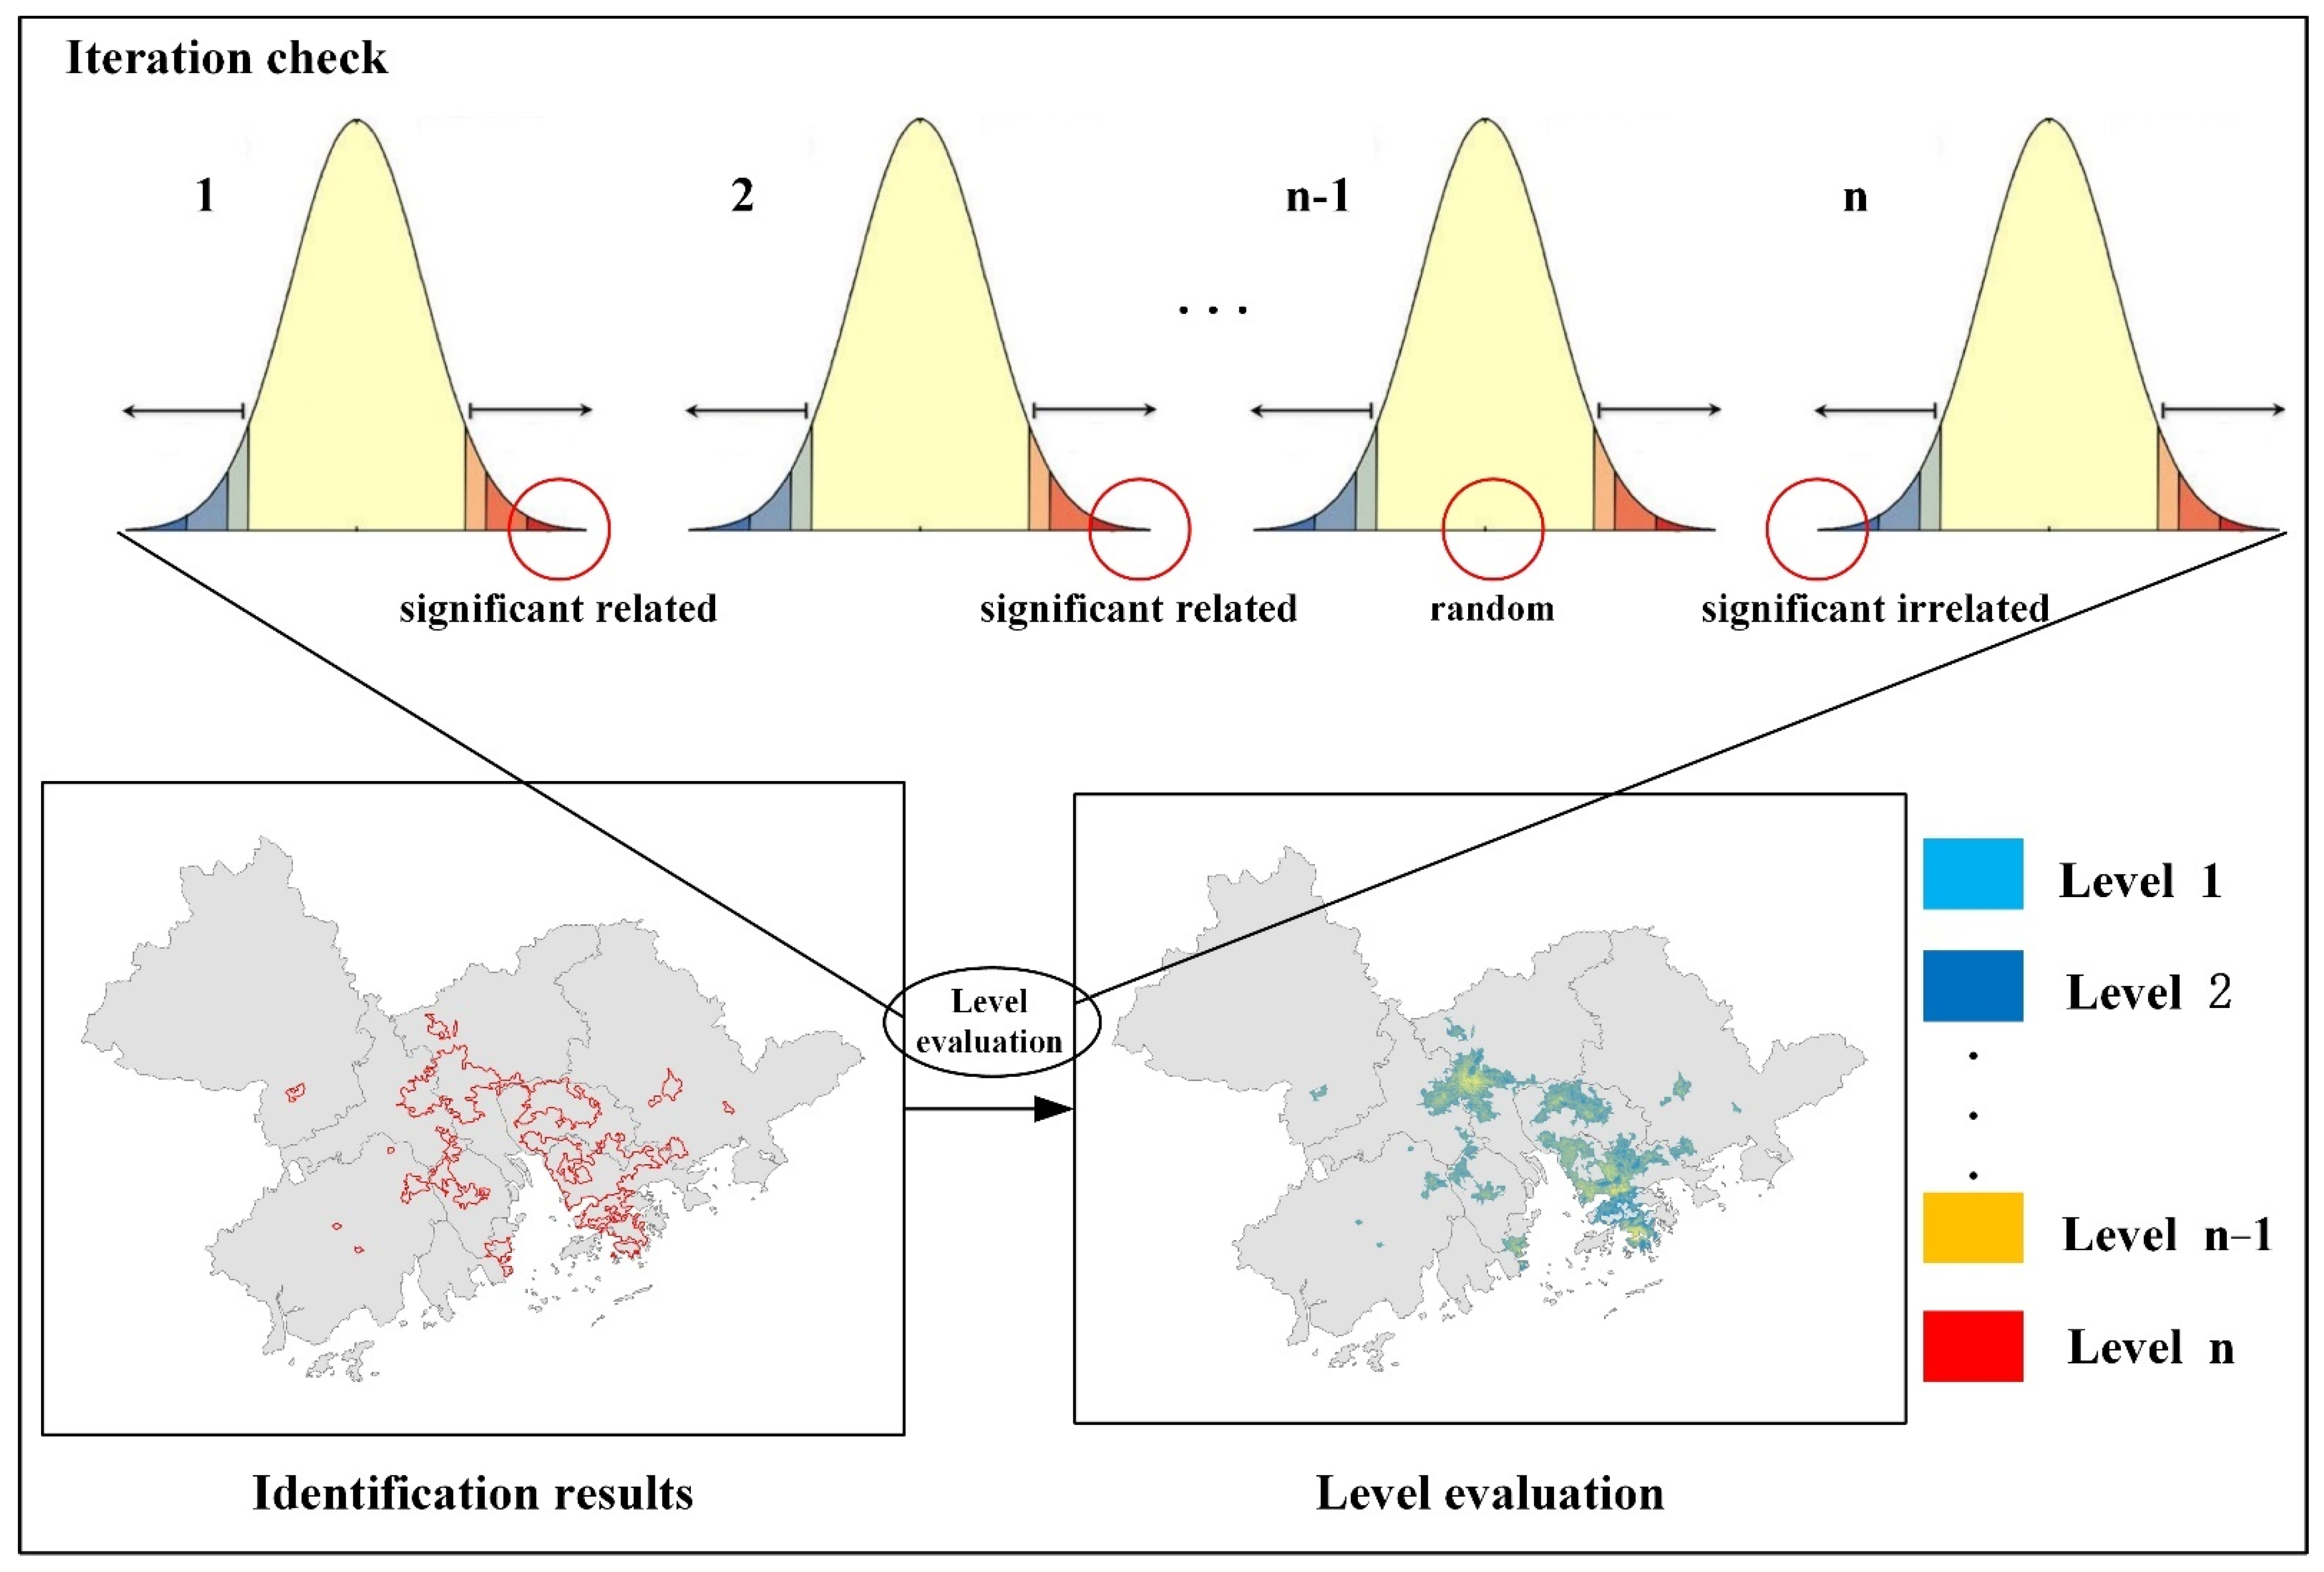
3.3. Validation of Identification Results
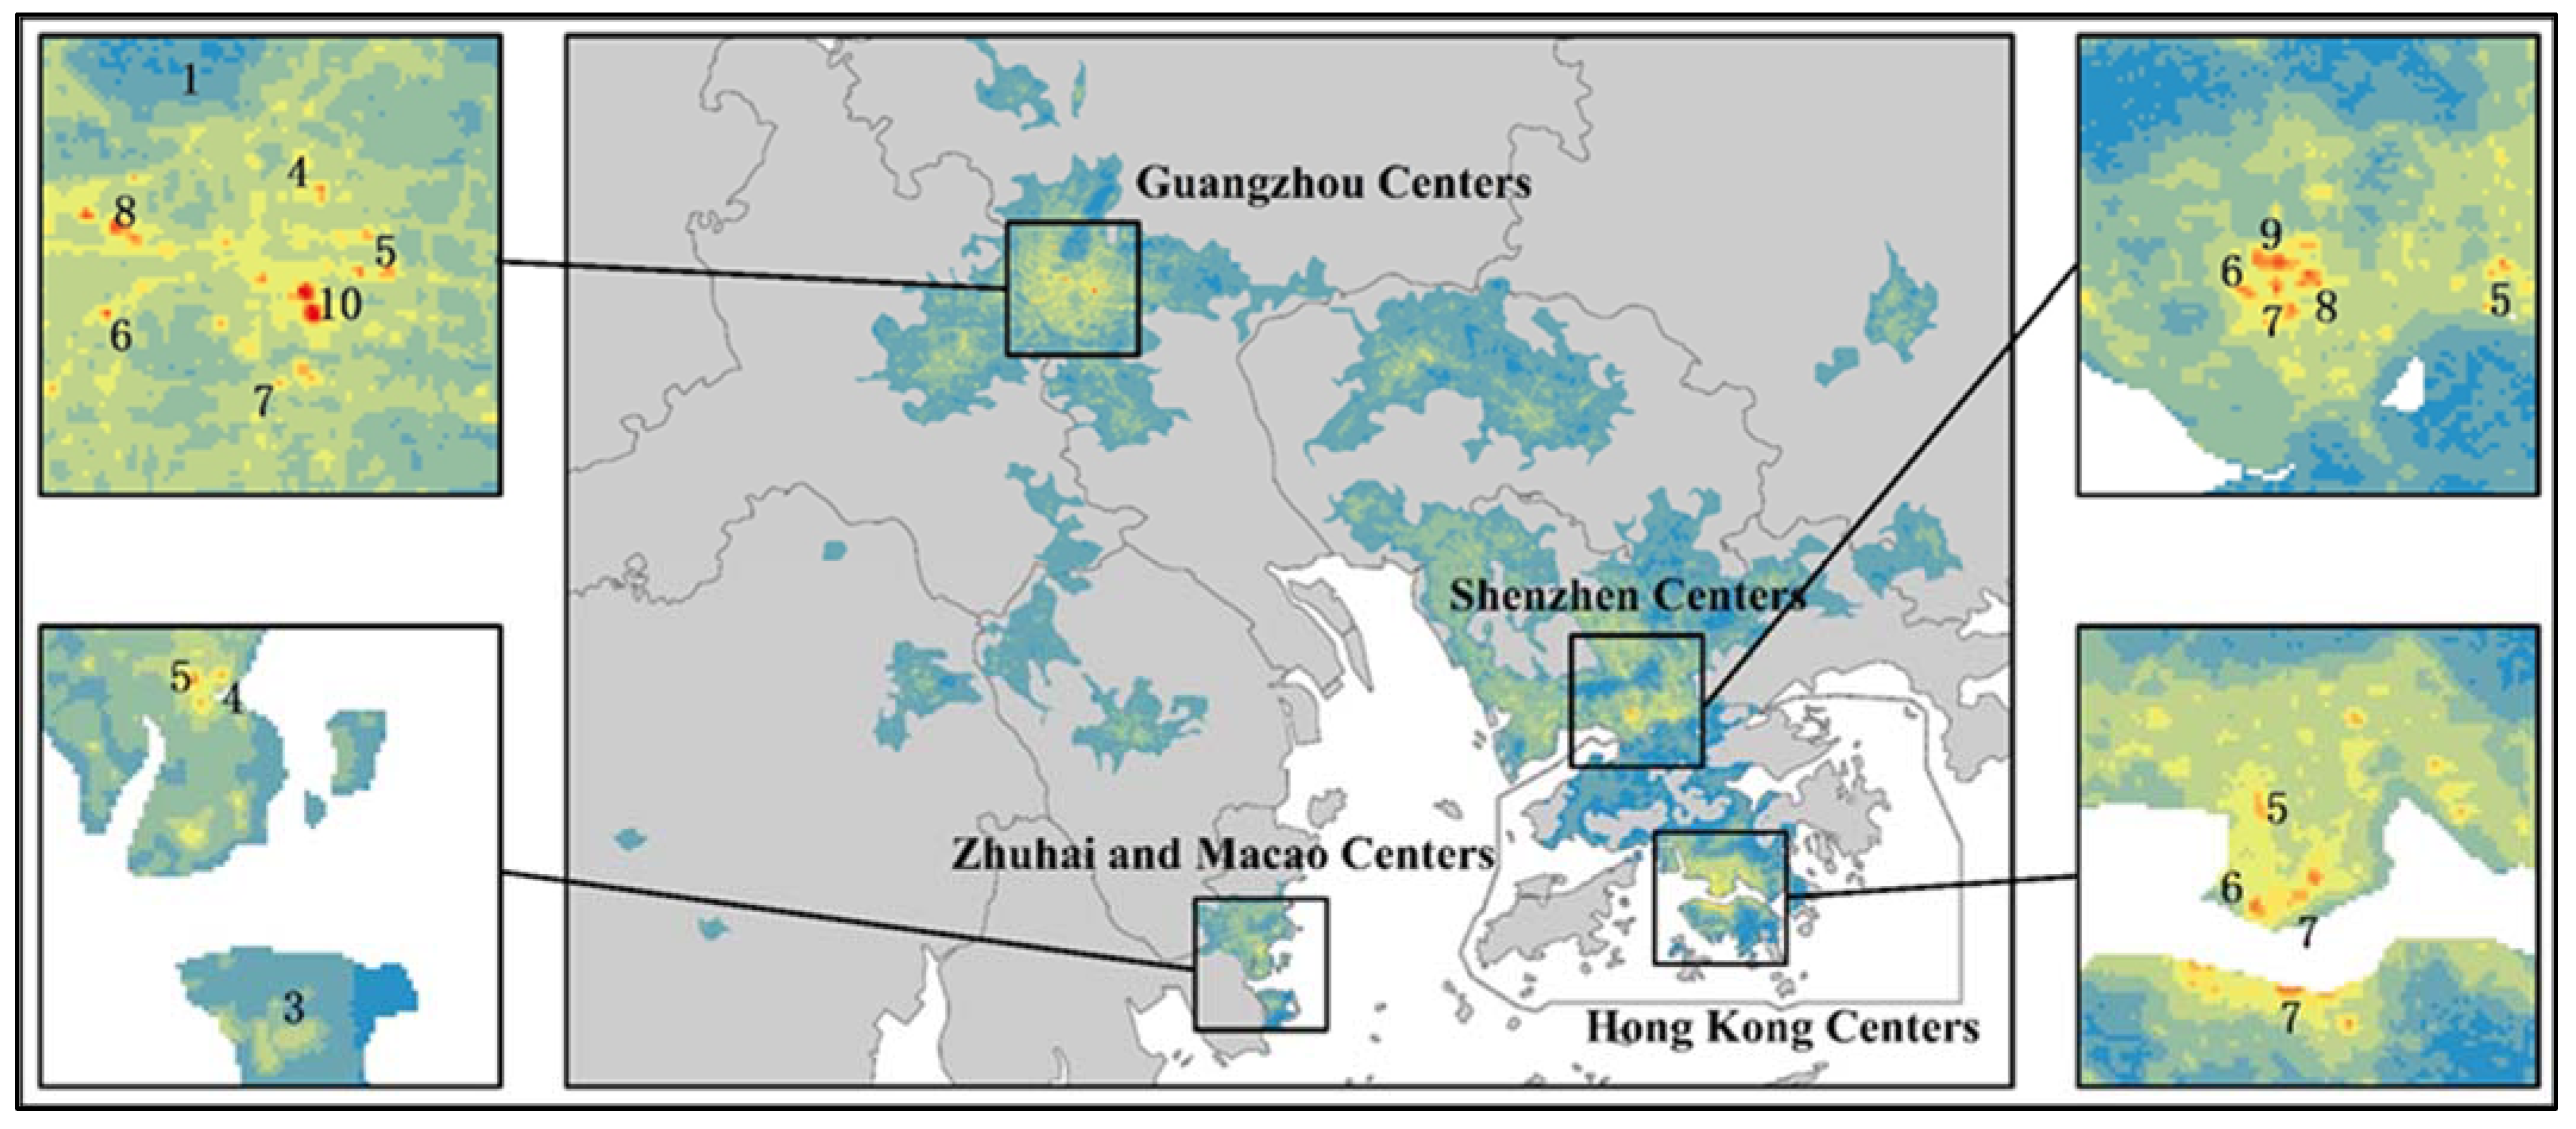
3.4. Hierarchy Evaluation of the Identified Urban Poly-Centers
4. Discussion
5. Conclusions
Author Contributions
Funding
Institutional Review Board Statement
Informed Consent Statement
Data Availability Statement
Acknowledgments
Conflicts of Interest
References
- Dong, L.; Longwu, L.; Zhenbo, W.; Liangkan, C.; Faming, Z. Exploration of Coupling Effects in the Economy–Society–Environment System in Urban Areas: Case Study of the Yangtze River Delta Urban Agglomeration. Ecol. Indic. 2021, 128, 107858. [Google Scholar] [CrossRef]
- Li, X.; Li, Y.P.; Huang, G.H.; Lv, J.; Ma, Y. A Multi-Scenario Input-Output Economy-Energy-Environment Nexus Management Model for Pearl River Delta Urban Agglomeration. J. Clean. Prod. 2021, 317, 128402. [Google Scholar] [CrossRef]
- Mou, J. Extracting Network Patterns of Tourist Flows in an Urban Agglomeration Through Digital Footprints: The Case of Greater Bay Area. IEEE Access 2022, 10, 16644–16654. [Google Scholar] [CrossRef]
- Abozeid, A.S.M.; AboElatta, T.A. Polycentric vs Monocentric Urban Structure Contribution to National Development. J. Eng. Appl. Sci. 2021, 68, 11. [Google Scholar] [CrossRef]
- Wang, J.; Dong, W. Multiple Effects of Urban Innovation Activities on Growth of Key Industries: Case Study in Hangzhou, China. J. Urban Plan. Dev. 2022, 148, 05021054. [Google Scholar] [CrossRef]
- Xu, R.; Yang, G.; Qu, Z.; Chen, Y.; Liu, J.; Shang, L.; Liu, S.; Ge, Y.; Chang, J. City Components–Area Relationship and Diversity Pattern: Towards a Better Understanding of Urban Structure. Sustain. Cities Soc. 2020, 60, 102272. [Google Scholar] [CrossRef]
- Yang, S.; Myung, J. Morphological Adaptation Types of Small-industrial Clusters to Traditional Urban Tissue—The 2000s′ Gold Jewelry Manufacturing in Seoul CBD, Korea. J. Asian Arch. Build. Eng. 2017, 16, 15–21. [Google Scholar] [CrossRef] [Green Version]
- Ma, M.; Liu, S.; Su, M.; Wang, C.; Ying, Z.; Huo, M.; Lin, Y.; Yang, W. Spatial Distribution and Potential Sources of Microplastics in the Songhua River Flowing through Urban Centers in Northeast China. Environ. Pollut. 2022, 292, 118384. [Google Scholar] [CrossRef]
- Kwan, S.C.; Saragih, I.J. Urban Environment and Cause Specific Visits to Community Health Centers of Medan City, Indonesia in 2016. Sustain. Cities Soc. 2020, 59, 102228. [Google Scholar] [CrossRef]
- Zhou, F.; Zhang, B. Detecting and Visualizing the Communities of Innovation in Beijing-Tianjin-Hebei Urban Agglomeration Based on the Patent Cooperation Network. Complexity 2021, 2021, 5354170. [Google Scholar] [CrossRef]
- Ma, H.; Xu, X. Knowledge Polycentricity of China’s Urban Agglomerations. J. Urban Plan. Dev. 2022, 148, 04022014. [Google Scholar] [CrossRef]
- McMillen, D.P. Nonparametric Employment Subcenter Identification. J. Urban Econ. 2001, 50, 448–473. [Google Scholar] [CrossRef]
- Redfearn, C.L. The Topography of Metropolitan Employment: Identifying Centers of Employment in a Polycentric Urban Area. J. Urban Econ. 2007, 61, 519–541. [Google Scholar] [CrossRef]
- Rao, Y.; Yang, J.; Dai, D.; Wu, K.; He, Q. Urban Growth Pattern and Commuting Efficiency: Empirical Evidence from 100 Chinese Cities. J. Clean. Prod. 2021, 302, 126994. [Google Scholar] [CrossRef]
- McMillen, D.P. Identifying Sub-centres Using Contiguity Matrices. Urban Stud. 2003, 40, 57–69. [Google Scholar] [CrossRef]
- McMillen, D.P. The Return of Centralization to Chicago: Using Repeat Sales to Identify Changes in House Price Distance Gradients. Reg. Sci. Urban Econ. 2003, 33, 287–304. [Google Scholar] [CrossRef]
- Liu, X.; Derudder, B.; Wang, M. Polycentric Urban Development in China: A Multi-Scale Analysis. Environ. Plan. B Urban Anal. City Sci. 2018, 45, 953–972. [Google Scholar] [CrossRef]
- McMillen, D.P. Employment Densities, Spatial Autocorrelation, and Subcenters in Large Metropolitan Areas. J. Reg. Sci. 2004, 44, 225–244. [Google Scholar] [CrossRef]
- Riguelle, F.; Thomas, I.; Verhetsel, A. Measuring Urban Polycentrism: A European Case Study and Its Implications. J. Econ. Geogr. 2007, 7, 193–215. [Google Scholar] [CrossRef]
- Garcia-López, M.À. Population Suburbanization in Barcelona, 1991–2005: Is Its Spatial Structure Changing? J. Hous. Econ. 2010, 19, 119–132. [Google Scholar] [CrossRef]
- Wang, Y.; Shen, Z. Comparing Luojia 1-01 and VIIRS Nighttime Light Data in Detecting Urban Spatial Structure Using a Threshold-Based Kernel Density Estimation. Remote Sens. 2021, 13, 1574. [Google Scholar] [CrossRef]
- He, X.; Zhu, Y.; Chang, P.; Zhou, C. Using Tencent User Location Data to Modify Night-Time Light Data for Delineating Urban Agglomeration Boundaries. Front. Environ. Sci. 2022, 10, 860365. [Google Scholar] [CrossRef]
- Long, Y. Redefining Chinese City System with Emerging New Data. Appl. Geogr. 2016, 75, 36–48. [Google Scholar] [CrossRef]
- Jiang, B.; Liu, X. Scaling of Geographic Space from the Perspective of City and Field Blocks and Using Volunteered Geographic Information. Int. J. Geogr. Inf. Sci. 2012, 26, 215–229. [Google Scholar] [CrossRef] [Green Version]
- Ou, J.; Liu, X.; Liu, P.; Liu, X. Evaluation of Luojia 1-01 Nighttime Light Imagery for Impervious Surface Detection: A Comparison with NPP-VIIRS Nighttime Light Data. Int. J. Appl. Earth Obs. Geoinf. 2019, 81, 1–12. [Google Scholar] [CrossRef]
- Chen, Z.; Yu, B.; Song, W.; Liu, H.; Wu, Q.; Shi, K.; Wu, J. A New Approach for Detecting Urban Centers and Their Spatial Structure with Nighttime Light Remote Sensing. IEEE Trans. Geosci. Remote Sens. 2017, 55, 6305–6319. [Google Scholar] [CrossRef]
- He, X.; Zhou, C.; Wang, Y.; Yuan, X. Risk Assessment and Prediction of COVID-19 Based on Epidemiological Data from Spatiotemporal Geography. Front. Environ. Sci. 2021, 9, 634156. [Google Scholar] [CrossRef]
- Lou, G.; Chen, Q.; He, K.; Zhou, Y.; Shi, Z. Using Nighttime Light Data and POI Big Data to Detect the Urban Centers of Hangzhou. Remote Sens. 2019, 11, 1821. [Google Scholar] [CrossRef] [Green Version]
- Chen, Y.; Yue, W.; La Rosa, D. Which Communities Have Better Accessibility to Green Space? An Investigation into Environmental Inequality Using Big Data. Landsc. Urban Plan. 2020, 204, 103919. [Google Scholar] [CrossRef]
- Zhou, C.; He, X.; Wu, R.; Zhang, G. Using Food Delivery Data to Identify Urban -Rural Areas: A Case Study of Guangzhou, China. Front. Earth Sci. 2022, 10, 860361. [Google Scholar] [CrossRef]
- He, X.; Zhou, C.; Zhang, J.; Yuan, X. Using Wavelet Transforms to Fuse Nighttime Light Data and POI Big Data to Extract Urban Built-Up Areas. Remote Sens. 2020, 12, 3887. [Google Scholar] [CrossRef]
- Liu, J.; Deng, Y.; Wang, Y.; Huang, H.; Du, Q.; Ren, F. Urban Nighttime Leisure Space Mapping with Nighttime Light Images and POI Data. Remote Sens. 2020, 12, 541. [Google Scholar] [CrossRef] [Green Version]
- Wang, L.; Fan, H.; Wang, Y. Improving Population Mapping Using Luojia 1-01 Nighttime Light Image and Location-Based Social Media Data. Sci. Total Environ. 2020, 730, 139148. [Google Scholar] [CrossRef]
- Li, F.; Yan, Q.; Bian, Z.; Liu, B.; Wu, Z. A POI and LST Adjusted NTL Urban Index for Urban Built-Up Area Extraction. Sensors 2020, 20, 2918. [Google Scholar] [CrossRef] [PubMed]
- Wang, M.; Song, Y.; Wang, F.; Meng, Z. Boundary Extraction of Urban Built-Up Area Based on Luminance Value Correction of NTL Image. IEEE J. Sel. Top. Appl. Earth Obs. Remote Sens. 2021, 14, 7466–7477. [Google Scholar] [CrossRef]
- Shi, K.; Chang, Z.; Chen, Z.; Wu, J.; Yu, B. Identifying and Evaluating Poverty Using Multisource Remote Sensing and Point of Interest (POI) Data: A Case Study of Chongqing, China. J. Clean. Prod. 2020, 255, 120245. [Google Scholar] [CrossRef]
- Ma, T. An Estimate of the Pixel-Level Connection between Visible Infrared Imaging Radiometer Suite Day/Night Band (VIIRS DNB) Nighttime Lights and Land Features across China. Remote Sens. 2018, 10, 723. [Google Scholar] [CrossRef] [Green Version]
- Jun, Z.; Xiao-Die, Y.; Han, L. The Extraction of Urban Built-Up Areas by Integrating Night-Time Light and POI Data—A Case Study of Kunming, China. IEEE Access 2021, 9, 22417–22429. [Google Scholar] [CrossRef]
- Zhang, J.; Yuan, X.; Tan, X.; Zhang, X. Delineation of the Urban-Rural Boundary through Data Fusion: Applications to Improve Urban and Rural Environments and Promote Intensive and Healthy Urban Development. Int. J. Environ. Res. Public Health 2021, 18, 7180. [Google Scholar] [CrossRef]
- He, X.; Yuan, X.; Zhang, D.; Zhang, R.; Li, M.; Zhou, C. Delineation of Urban Agglomeration Boundary Based on Multisource Big Data Fusion—A Case Study of Guangdong–Hong Kong–Macao Greater Bay Area (GBA). Remote Sens. 2021, 13, 1801. [Google Scholar] [CrossRef]
- Wu, W.; Zhao, H.; Jiang, S. A Zipf’s Law-Based Method for Mapping Urban Areas Using NPP-VIIRS Nighttime Light Data. Remote Sens. 2018, 10, 130. [Google Scholar] [CrossRef] [Green Version]
- Yang, X.; Ye, T.; Zhao, N.; Chen, Q.; Yue, W.; Qi, J.; Zeng, B.; Jia, P. Population Mapping with Multisensor Remote Sensing Images and Point-Of-Interest Data. Remote Sens. 2019, 11, 574. [Google Scholar] [CrossRef] [Green Version]
- Feng, X.; Zhang, W.; Su, X.; Xu, Z. Optical Remote Sensing Image Denoising and Super-Resolution Reconstructing Using Optimized Generative Network in Wavelet Transform Domain. Remote Sens. 2021, 13, 1858. [Google Scholar] [CrossRef]
- Jia, X.; Peng, Y.; Li, J.; Ge, B.; Xin, Y.; Liu, S. Dual-Complementary Convolution Network for Remote-Sensing Image Denoising. IEEE Geosci. Remote Sens. Lett. 2021, 19, 8018405. [Google Scholar] [CrossRef]
- Wang, K.; Chen, H.; Cheng, L.; Xiao, J. Variational-Scale Segmentation for Multispectral Remote-Sensing Images Using Spectral Indices. Remote Sens. 2022, 14, 326. [Google Scholar] [CrossRef]
- Li, J.; Zi, S.; Song, R.; Li, Y.; Hu, Y.; Du, Q. A Stepwise Domain Adaptive Segmentation Network with Covariate Shift Alleviation for Remote Sensing Imagery. IEEE Trans. Geosci. Remote Sens. 2022, 60, 5618515. [Google Scholar] [CrossRef]
- Fuentes, C.M.; Hernández, V. The Spatial Evolution of Employment Subcenters in Ciudad Juárez, Chihuahua (1994–2004): An Analysis Using Global and Local Spatial Autocorrelation Indicators. Estudios Demográficos Urbanos 2015, 30, 433–467. [Google Scholar] [CrossRef]
- Li, Y.; Derudder, B. Dynamics in the Polycentric Development of Chinese Cities, 2001–2016. Urban Geogr. 2020, 43, 272–292. [Google Scholar] [CrossRef]
- Caizhi, S.; Qifei, M.; Liangshi, Z. Analysis of Driving Mechanism Based on a GWR Model of Green Efficiency of Water Resources in China. Acta Geogr. Sin. 2020, 75, 05001022. [Google Scholar]
- Wang, Z.; Fan, C.; Zhao, Q.; Myint, S.W. A Geographically Weighted Regression Approach to Understanding Urbanization Impacts on Urban Warming and Cooling: A Case Study of Las Vegas. Remote Sens. 2020, 12, 222. [Google Scholar] [CrossRef] [Green Version]
- He, X.; Zhang, Z.; Yang, Z. Extraction of Urban Built-up Area Based on the Fusion of Night-Time Light Data and Point of Interest Data. R. Soc. Open Sci. 2021, 8, 210838. [Google Scholar] [CrossRef]
- Cai, J.; Huang, B.; Song, Y. Using Multi-Source Geospatial Big Data to Identify the Structure of Polycentric Cities. Remote Sens. Environ. 2017, 202, 210–221. [Google Scholar] [CrossRef]
- Yang, Z.; Chen, Y.; Guo, G.; Zheng, Z.; Wu, Z. Using Nighttime Light Data to Identify the Structure of Polycentric Cities and Evaluate Urban Centers. Sci. Total Environ. 2021, 780, 146586. [Google Scholar] [CrossRef]
- Strain, E.M.A.; Alexander, K.A.; Kienker, S.; Morris, R.; Jarvis, R.; Coleman, R.; Bollard, B.; Firth, L.B.; Knights, A.M.; Grabowski, J.H.; et al. Urban Blue: A Global Analysis of the Factors Shaping People’s Perceptions of the Marine Environment and Ecological Engineering in Harbours. Sci. Total Environ. 2019, 658, 1293–1305. [Google Scholar] [CrossRef] [PubMed]
- Hou, Y. Polycentric Urban Form and Non-work Travel in Singapore: A Focus on Seniors. Transp. Res. Part D Transp. Environ. 2019, 73, 245–275. [Google Scholar] [CrossRef]
- Yang, Z.; Chen, Y.; Wu, Z.; Qian, Q.; Zheng, Z.; Huang, Q. Spatial Heterogeneity of the Thermal Environment Based on the Urban Expansion of Natural Cities Using Open Data in Guangzhou, China. Ecol. Indic. 2019, 104, 524–534. [Google Scholar] [CrossRef]
- Liu, C.; Tang, Q.; Xu, Y.; Wang, C.; Wang, S.; Wang, H.; Li, W.; Cui, H.; Zhang, Q.; Li, Q. High-Spatial-Resolution Nighttime Light Dataset Acquisition Based on Volunteered Passenger Aircraft Remote Sensing. IEEE Trans. Geosci. Remote Sens. 2021, 60, 1001817. [Google Scholar] [CrossRef]
- Li, Y.; Ye, H.; Gao, X.; Sun, D.; Li, Z.; Zhang, N.; Leng, X.; Meng, D.; Zheng, J. Spatiotemporal Patterns of Urbanization in the Three Most Developed Urban Agglomerations in China Based on Continuous Nighttime Light Data (2000–2018). Remote Sens. 2021, 13, 2245. [Google Scholar] [CrossRef]
- Li, X.; Zhao, L.; Li, D.; Xu, H. Mapping Urban Extent Using Luojia 1-01 Nighttime Light Imagery. Sensors 2018, 18, 3665. [Google Scholar] [CrossRef] [Green Version]
- Sun, B.; Zhang, Y.; Zhou, Q.; Zhang, X. Effectiveness of Semi-Supervised Learning and Multi-Source Data in Detailed Urban Landuse Mapping with a Few Labeled Samples. Remote Sens. 2022, 14, 648. [Google Scholar] [CrossRef]
- Zikirya, B.; He, X.; Li, M.; Zhou, C. Urban Food Takeaway Vitality: A New Technique to Assess Urban Vitality. Int. J. Environ. Res. Public Health 2021, 18, 3578. [Google Scholar] [CrossRef]
- You, H.; Jin, C.; Sun, W. Spatiotemporal Evolution of Population in Northeast China during 2012–2017: A Nighttime Light Approach. Complexity 2020, 2020, 3646145. [Google Scholar] [CrossRef]
- Wang, X. Research on the Development Model of Chinese Urban and Rural Big Data Integration Brand Project Based on Ecological Perspective. J. Phys. Conf. Ser. 2021, 1992, 022124. [Google Scholar] [CrossRef]
- Ma, S.; Cai, Y.; Ai, B.; Xie, D.; Zhao, Y. Delimiting the Urban Growth Boundary for Sustainable Development with a Pareto Front Degradation Searching Strategy Based Optimization Model. J. Clean. Prod. 2022, 345, 131191. [Google Scholar] [CrossRef]
- Su, Y.; Wang, Y.; Wang, C.; Zhou, D.; Zhou, N.; Feng, W.; Ji, H. Coupling Relationships between Urban Form and Performance of Outdoor Environment at the Pedestrian Level. Build. Environ. 2022, 213, 108514. [Google Scholar] [CrossRef]
- Ma, M.; Lang, Q.; Yang, H.; Shi, K.; Ge, W. Identification of Polycentric Cities in China Based on NPP-VIIRS Nighttime Light Data. Remote Sens. 2020, 12, 3248. [Google Scholar] [CrossRef]
- He, X.; Cao, Y.; Zhou, C. Evaluation of Polycentric Spatial Structure in the Urban Agglomeration of the Pearl River Delta (PRD) Based on Multi-Source Big Data Fusion. Remote Sens. 2021, 13, 3639. [Google Scholar] [CrossRef]
- He, J.; Li, X.; Liu, P.; Wu, X.; Zhang, J.; Zhang, D.; Liu, X.; Yao, Y. Accurate Estimation of the Proportion of Mixed Land Use at the Street-Block Level by Integrating High Spatial Resolution Images and Geospatial Big Data. IEEE Trans. Geosci. Remote Sens. 2020, 59, 6357–6370. [Google Scholar] [CrossRef]
- Im, J.; Lu, Z.; Rhee, J.; Jensen, J.R. Fusion of Feature Selection and Optimized Immune Networks for Hyperspectral Image Classification of Urban Landscapes. Geocarto Int. 2012, 27, 373–393. [Google Scholar] [CrossRef]
- Cao, R.; Tu, W.; Yang, C.; Li, Q.; Liu, J.; Zhu, J.; Zhang, Q.; Li, Q.; Qiu, G. Deep Learning-Based Remote and Social Sensing Data Fusion for Urban Region Function Recognition. ISPRS J. Photogramm. Remote Sens. 2020, 163, 82–97. [Google Scholar] [CrossRef]
- Ma, X.; Li, C.; Tong, X.; Liu, S. A New Fusion Approach for Extracting Urban Built-up Areas from Multisource Remotely Sensed Data. Remote Sens. 2019, 11, 2516. [Google Scholar] [CrossRef] [Green Version]
- Zhong, Y.; Cao, Q.; Zhao, J.; Ma, A.; Zhao, B.; Zhang, L. Optimal Decision Fusion for Urban Land-Use/Land-Cover Classification Based on Adaptive Differential Evolution Using Hyperspectral and LiDAR Data. Remote Sens. 2017, 9, 868. [Google Scholar] [CrossRef] [Green Version]
- Ma, X.; Tong, X.; Liu, S.; Luo, X.; Xie, H.; Li, C. Optimized Sample Selection in SVM Classification by Combining with DMSP-OLS, Landsat NDVI and GlobeLand30 Products for Extracting Urban Built-Up Areas. Remote Sens. 2017, 9, 236. [Google Scholar] [CrossRef] [Green Version]
- Binter, A.-C.; Bernard, J.Y.; Mon-Williams, M.; Andiarena, A.; González-Safont, L.; Vafeiadi, M.; Lepeule, J.; Soler-Blasco, R.; Alonso, L.; Kampouri, M.; et al. Urban Environment and Cognitive and Motor Function in Children from Four European Birth Cohorts. Environ. Int. 2021, 158, 106933. [Google Scholar] [CrossRef] [PubMed]


| Analyzed Data | Spatial Resolution | Data Source | Accessed Time |
|---|---|---|---|
| Luojia-01 | 130 m × 130 m | http://59.175.109.173:8888/ | October 2018–March 2019 |
| POI | — | www.amap.com | January 2021 |
| Population migration | 25 m × 25 m | https://heat.qq.com/bigdata/index.html | January 2020–December 2020 |
| Indicators | Equation | Urban Center | Non Urban Center | Definition |
|---|---|---|---|---|
| Area | is the number of pixels; CS is the pixel size | |||
| Density standard deviation | >0 | ≈0 | is the value of th pixel, is the average value of pixels | |
| Compactness index | Close to 1 | Close to 0 | is the perimeter of the city center | |
| Elongation ratio | <3 | and are the major and minor axes of the minimum bounding rectangle in the city center, respectively |
| Validation Indicators | Nighttime Light | Nighttime Light + POI | Nighttime Light + POI + Population Migration |
|---|---|---|---|
| Accuracy | 78.13% | 87.37% | 93.22% |
| Kappa | 0.6637 | 0.7961 | 0.8744 |
| Cities and Development Corridors | The Highest Hierarchy of Urban Center | The Lowest Hierarchy of Urban Center | The Average Level of Urban Center |
|---|---|---|---|
| Hong Kong | 7 | 3 | 5 |
| Macau | 5 | 2 | 3.5 |
| Guangzhou | 10 | 3 | 6 |
| Shenzhen | 9 | 3 | 5.4 |
| Zhuhai | 7 | 2 | 3 |
| Dongguan | 7 | 2 | 3 |
| Zhongshan | 6 | 2 | 3.3 |
| Foshan | 5 | 1 | 1.8 |
| Huizhou | 4 | 1 | 1.5 |
| Zhaoqing | 5 | 1 | 2 |
| Jiangmen | 5 | 1 | 1.6 |
| Hong Kong-Shenzhen Development Corridor | 9 | 3 | 3.2 |
| Macau-Zhuhai Development Corridor | 7 | 2 | 2.4 |
| Guangzhou-Foshan Development Corridor | 10 | 1 | 4 |
Publisher’s Note: MDPI stays neutral with regard to jurisdictional claims in published maps and institutional affiliations. |
© 2022 by the authors. Licensee MDPI, Basel, Switzerland. This article is an open access article distributed under the terms and conditions of the Creative Commons Attribution (CC BY) license (https://creativecommons.org/licenses/by/4.0/).
Share and Cite
Zhou, Y.; He, X.; Zhu, Y. Identification and Evaluation of the Polycentric Urban Structure: An Empirical Analysis Based on Multi-Source Big Data Fusion. Remote Sens. 2022, 14, 2705. https://doi.org/10.3390/rs14112705
Zhou Y, He X, Zhu Y. Identification and Evaluation of the Polycentric Urban Structure: An Empirical Analysis Based on Multi-Source Big Data Fusion. Remote Sensing. 2022; 14(11):2705. https://doi.org/10.3390/rs14112705
Chicago/Turabian StyleZhou, Yuquan, Xiong He, and Yiting Zhu. 2022. "Identification and Evaluation of the Polycentric Urban Structure: An Empirical Analysis Based on Multi-Source Big Data Fusion" Remote Sensing 14, no. 11: 2705. https://doi.org/10.3390/rs14112705