
Detailed Three-Dimensional Building Façade Reconstruction: A Review on Applications, Data and Technologies


Abstract
:
1. Introduction
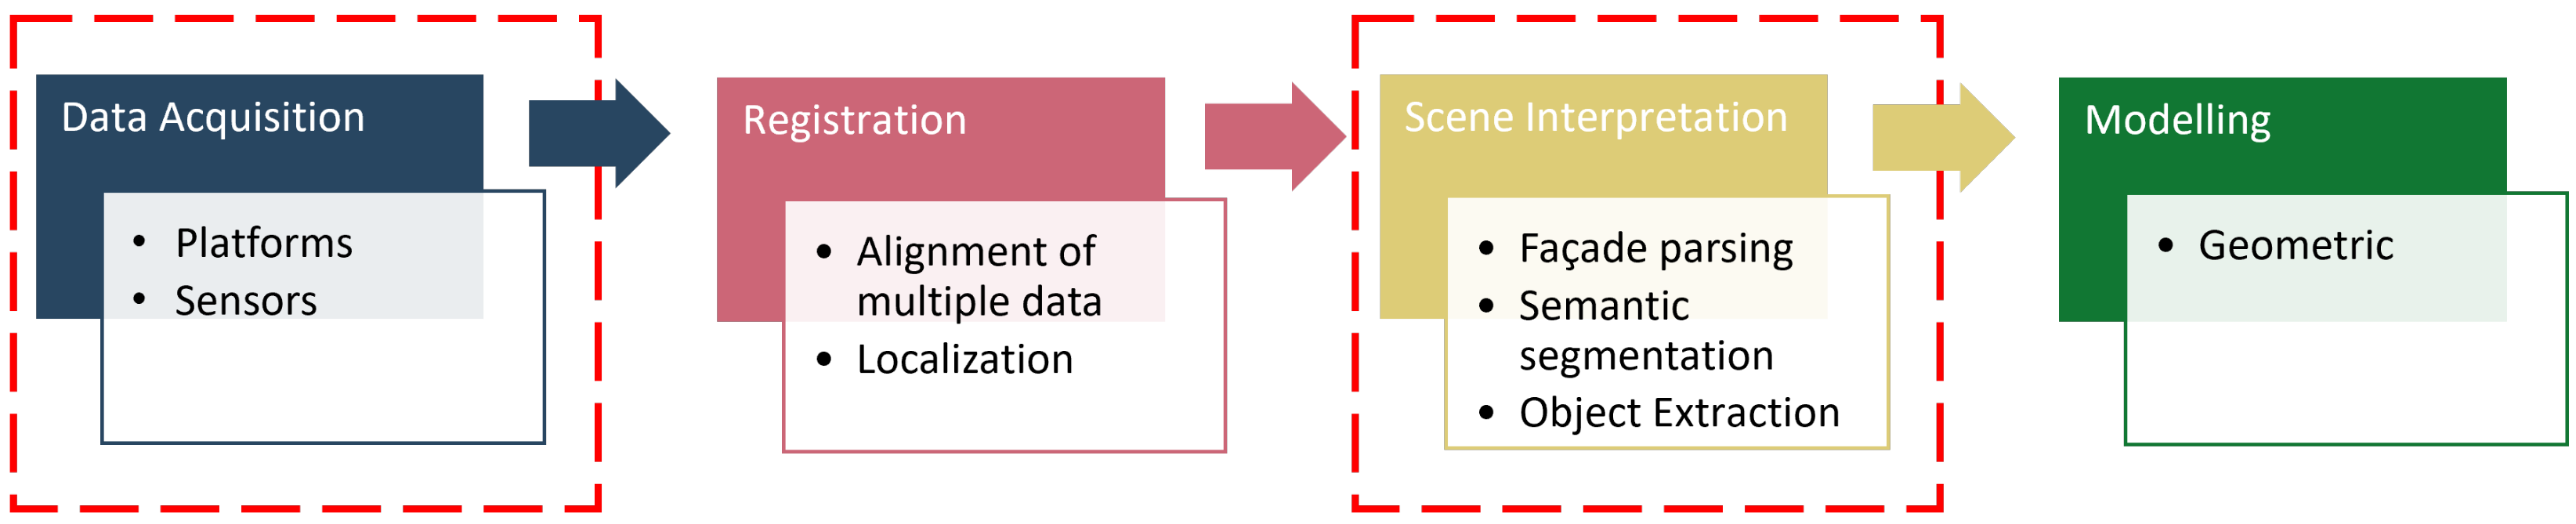
2. Methodology
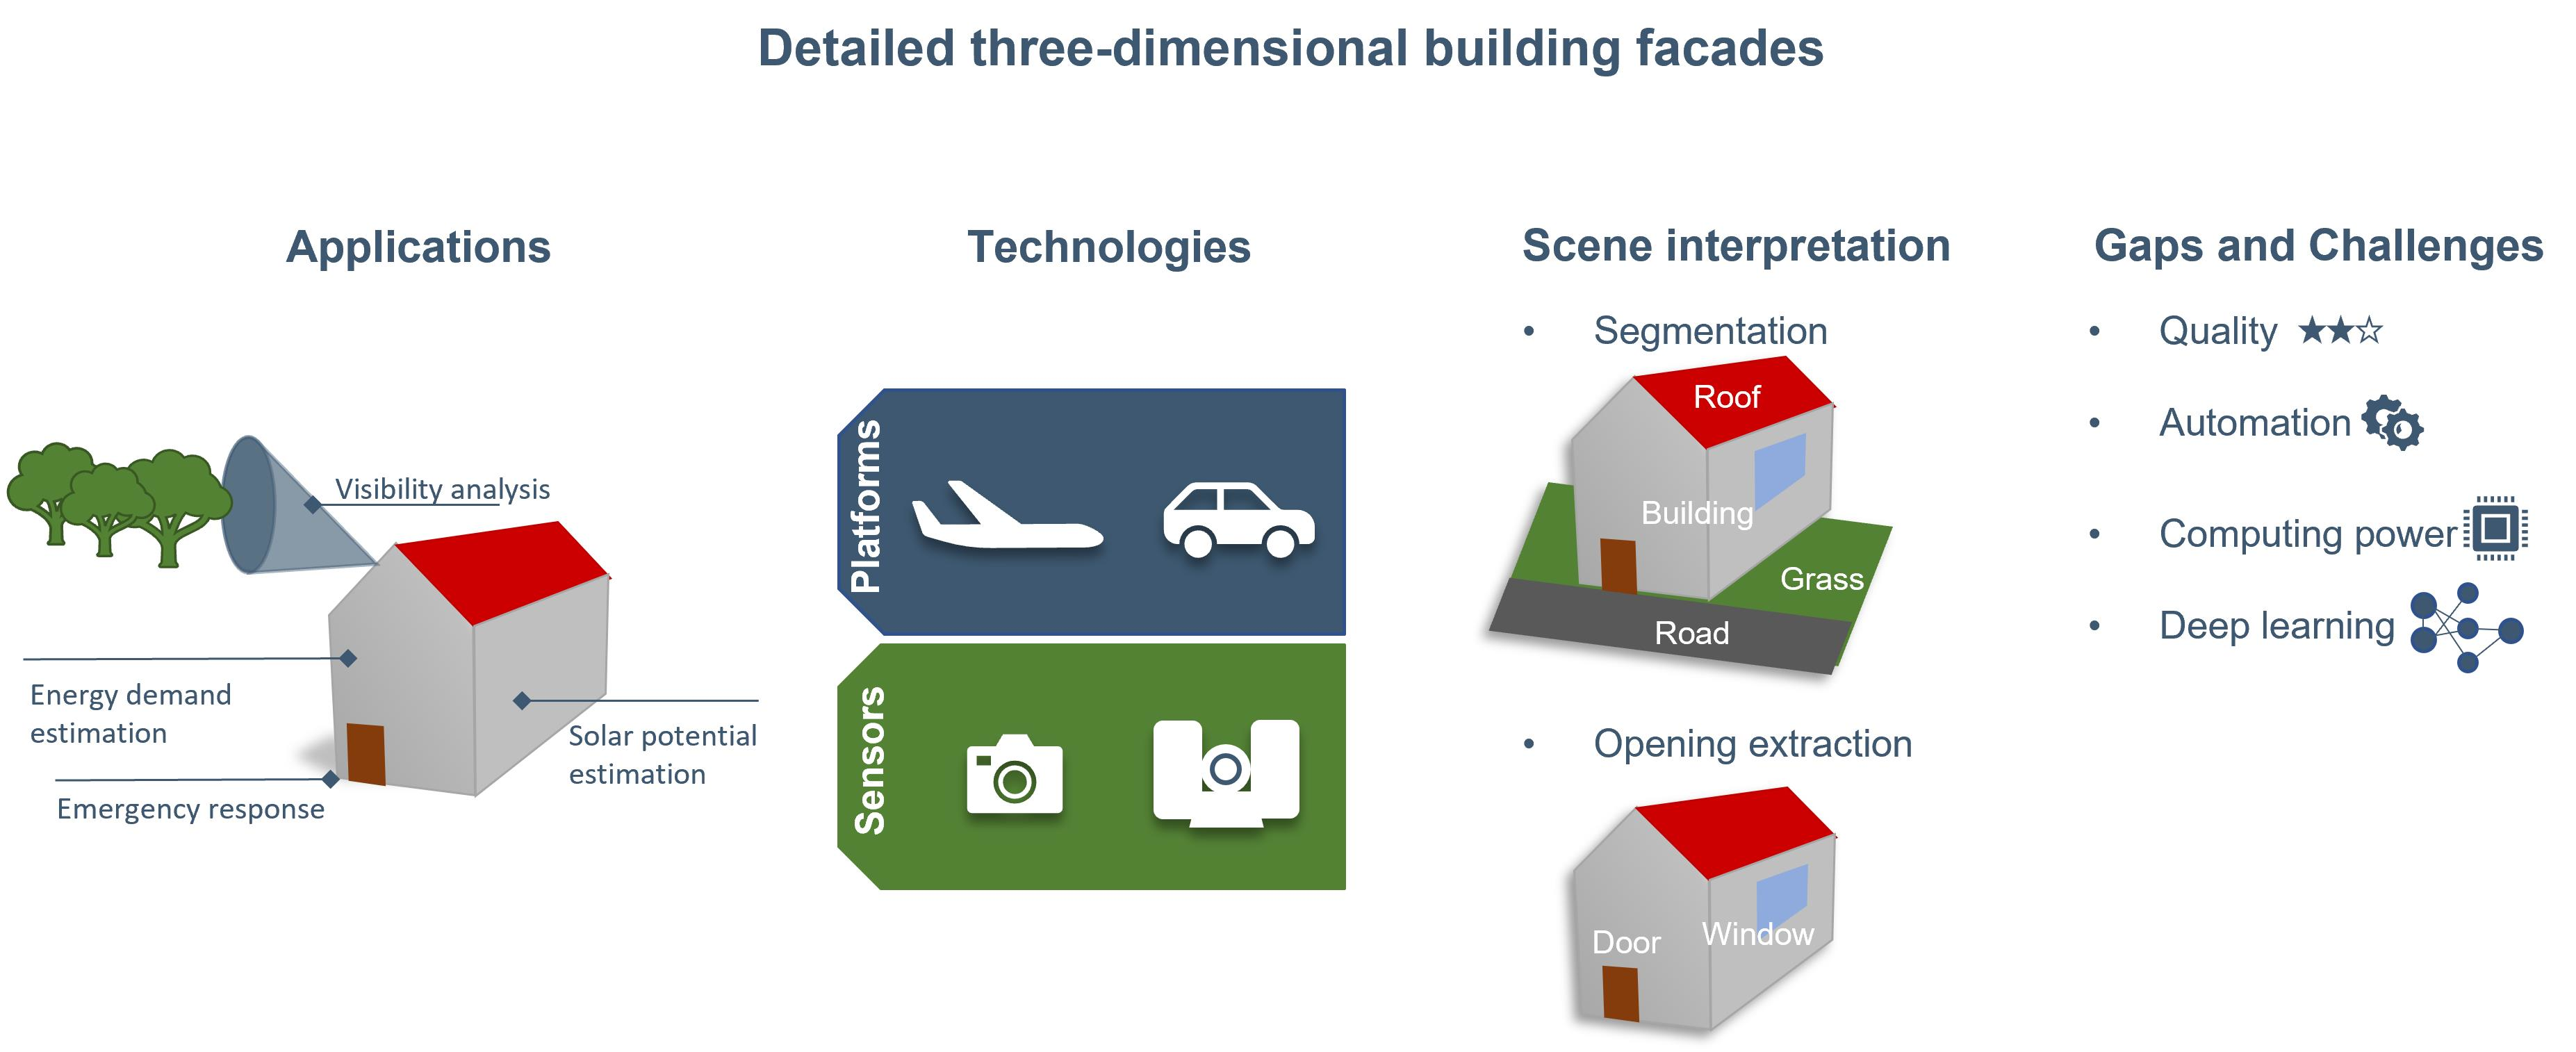
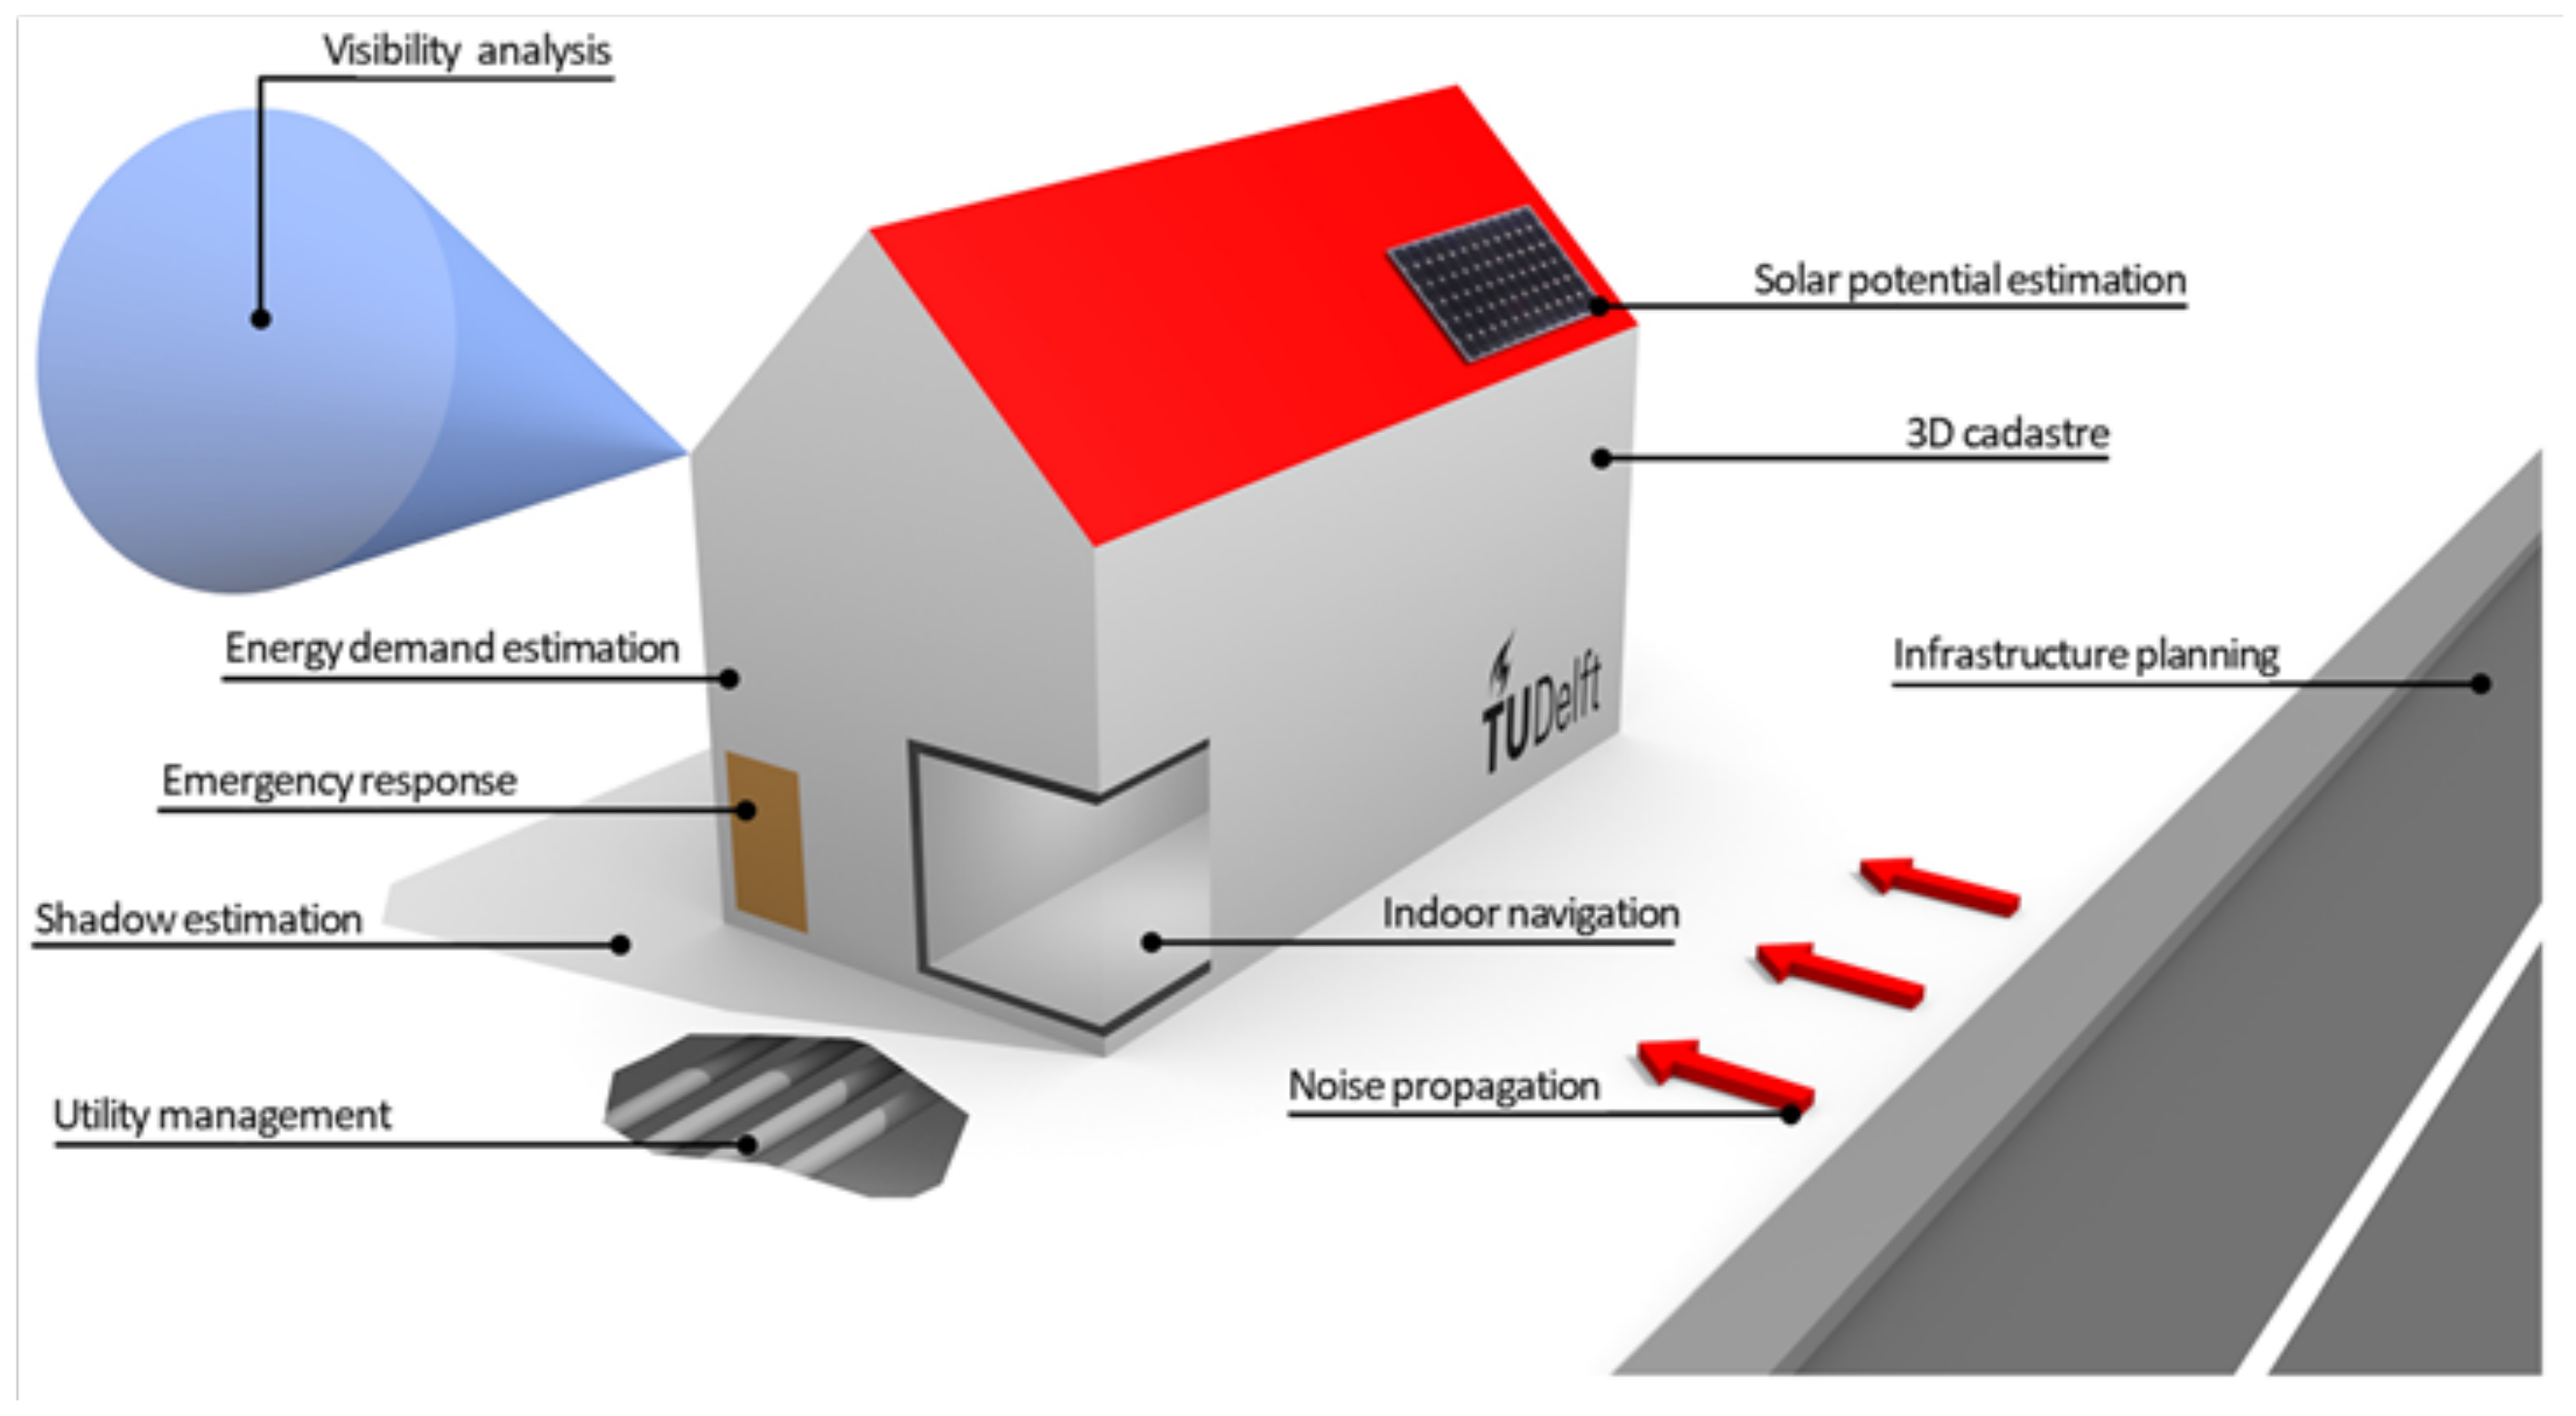
3. Applications
3.1. Building Information Modelling
3.2. Solar Energy Potential
3.3. Energy Analysis
3.4. Civil Engineering
3.5. Other Applications
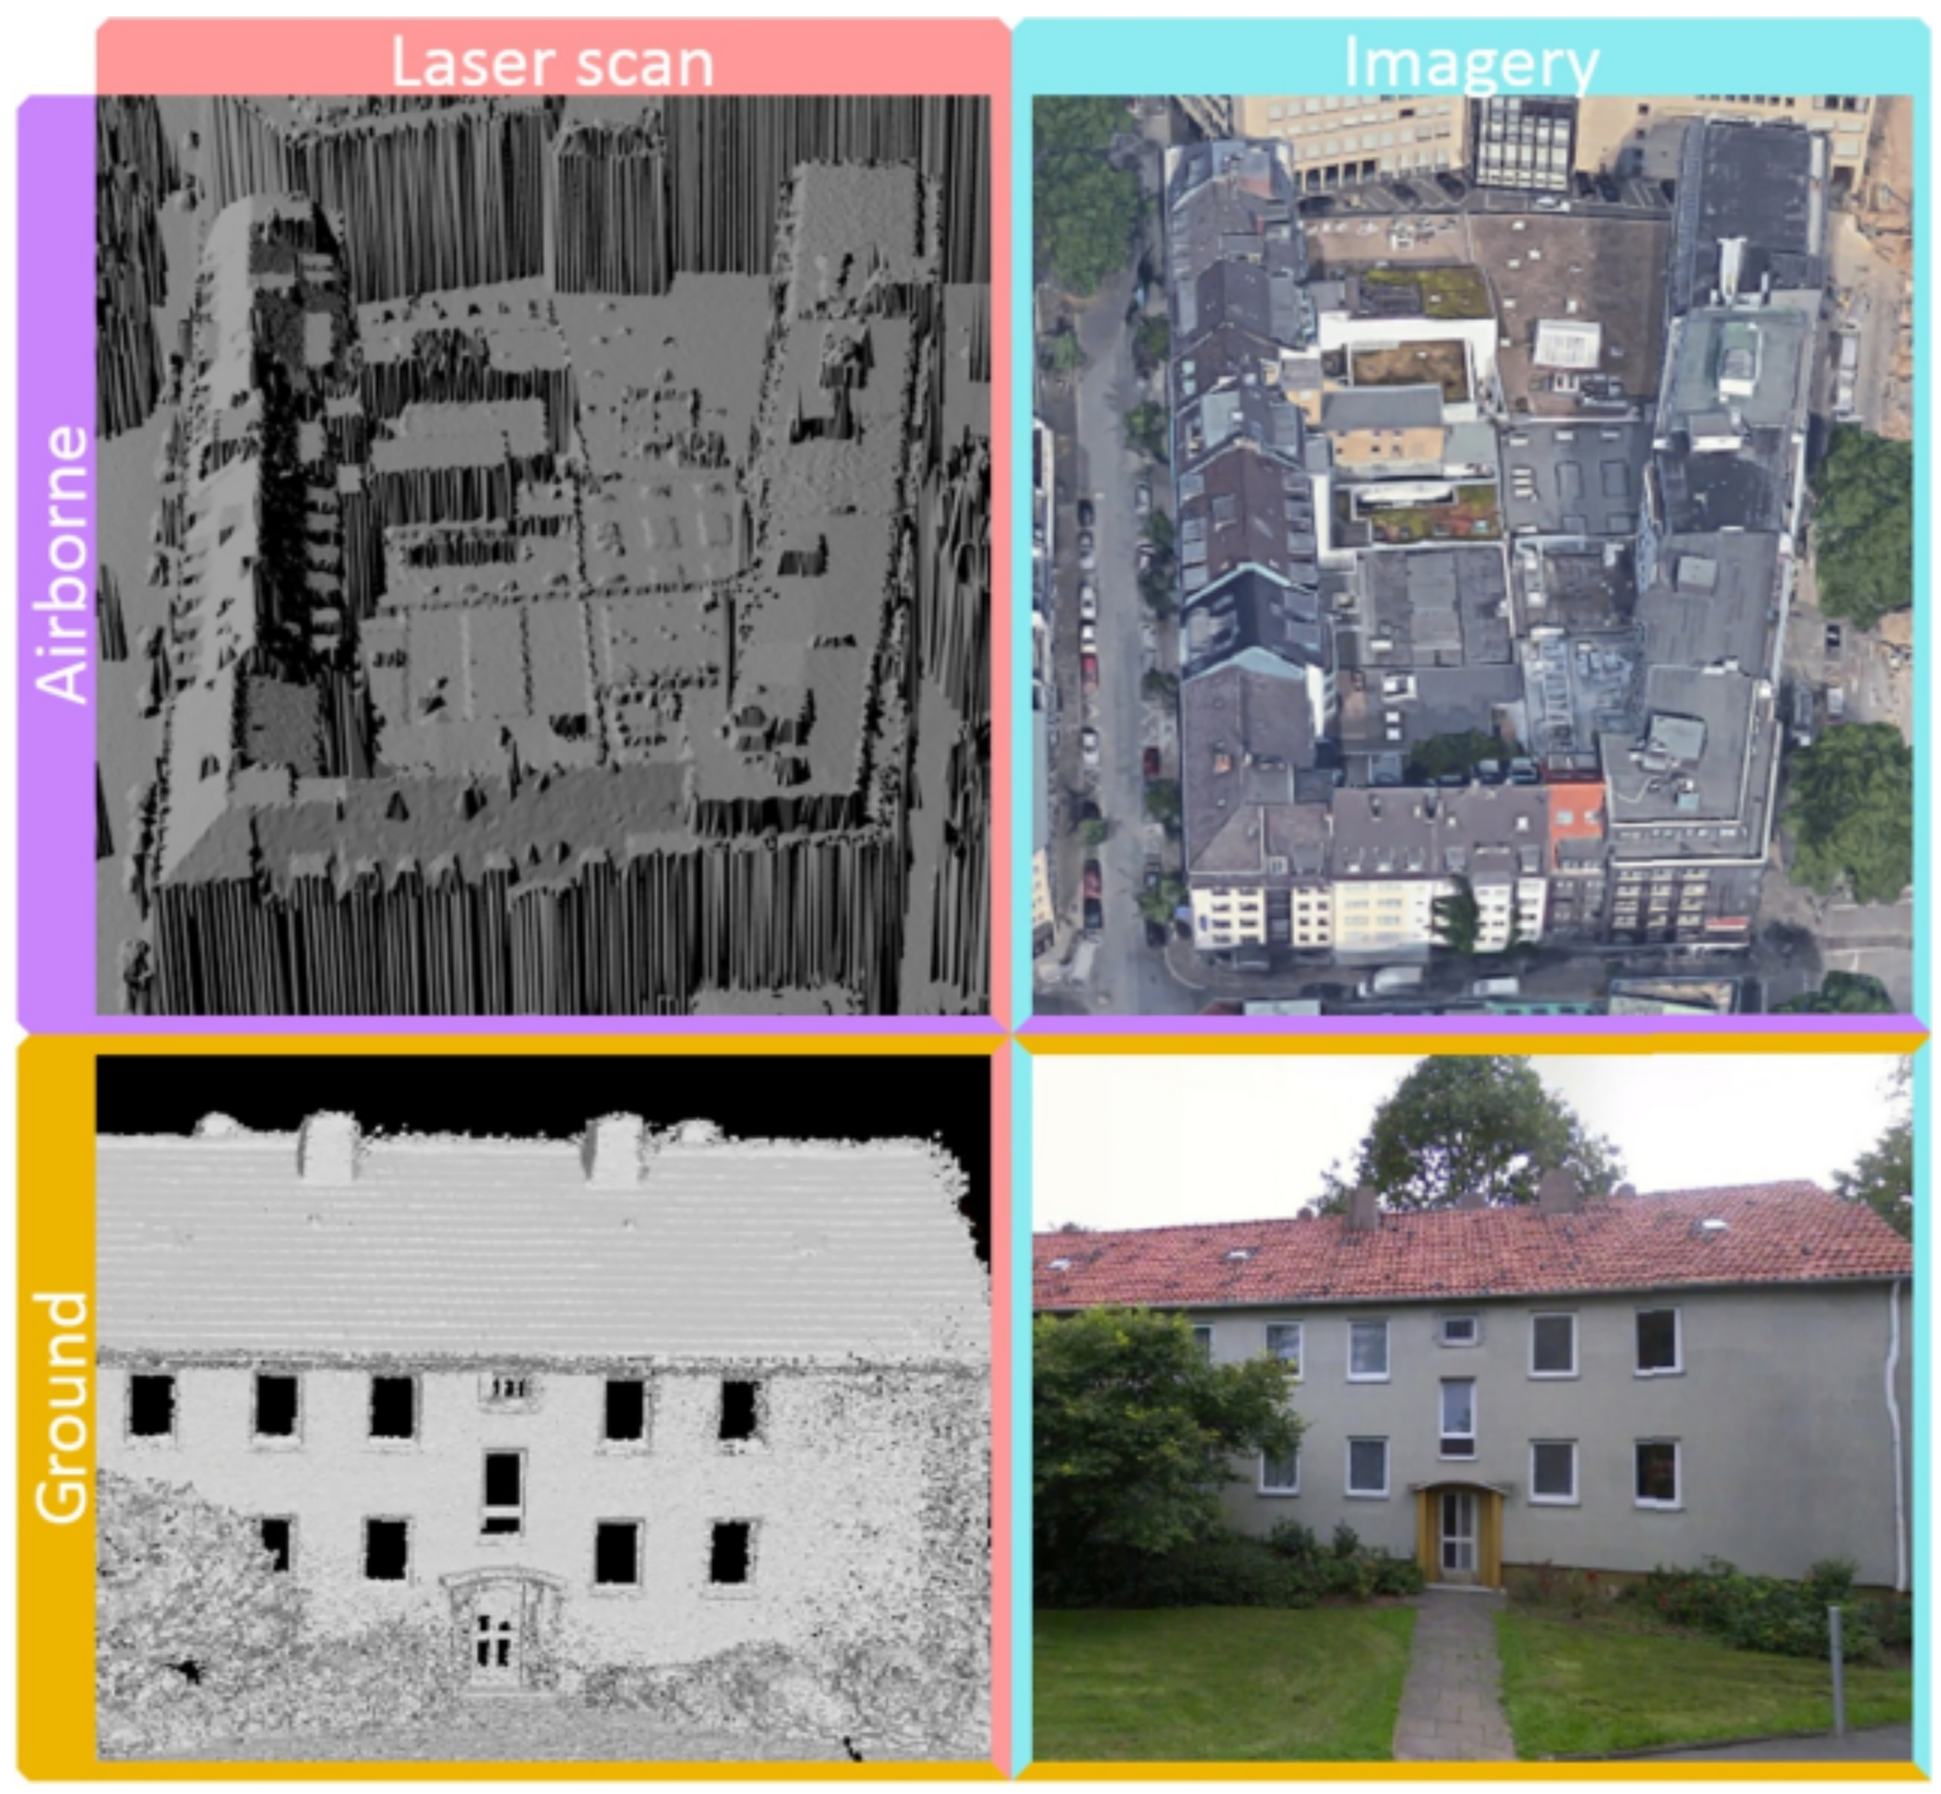
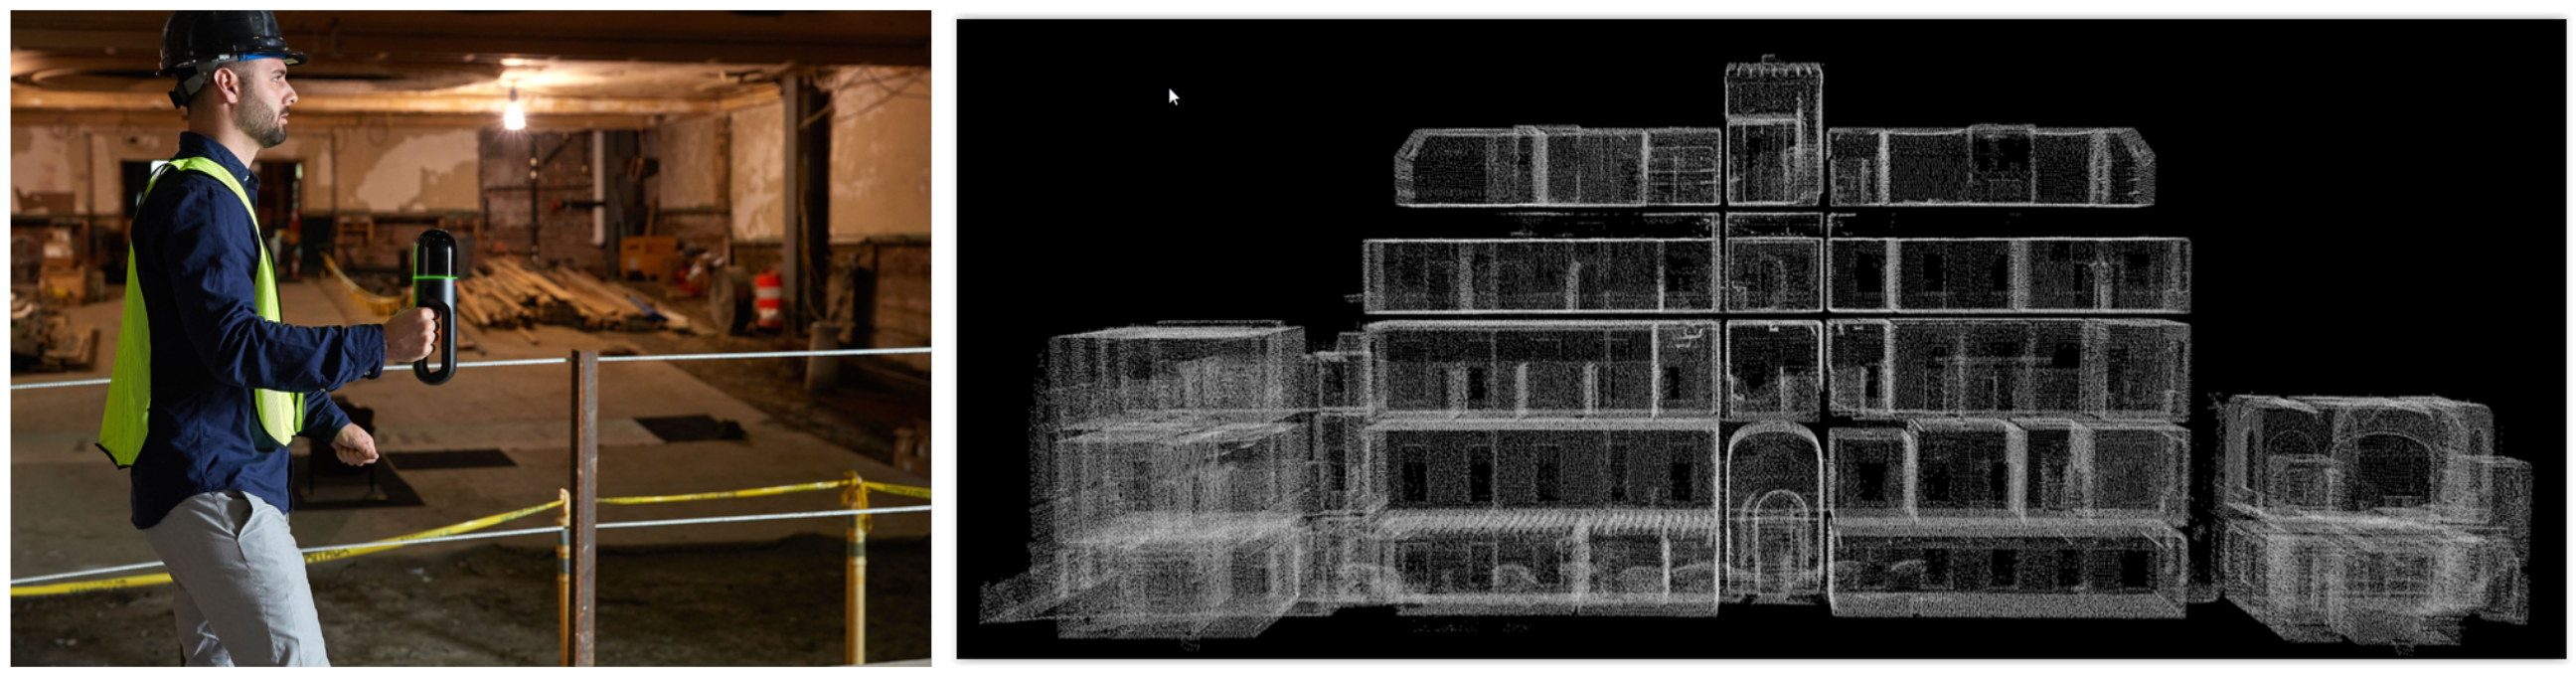
4. Platforms
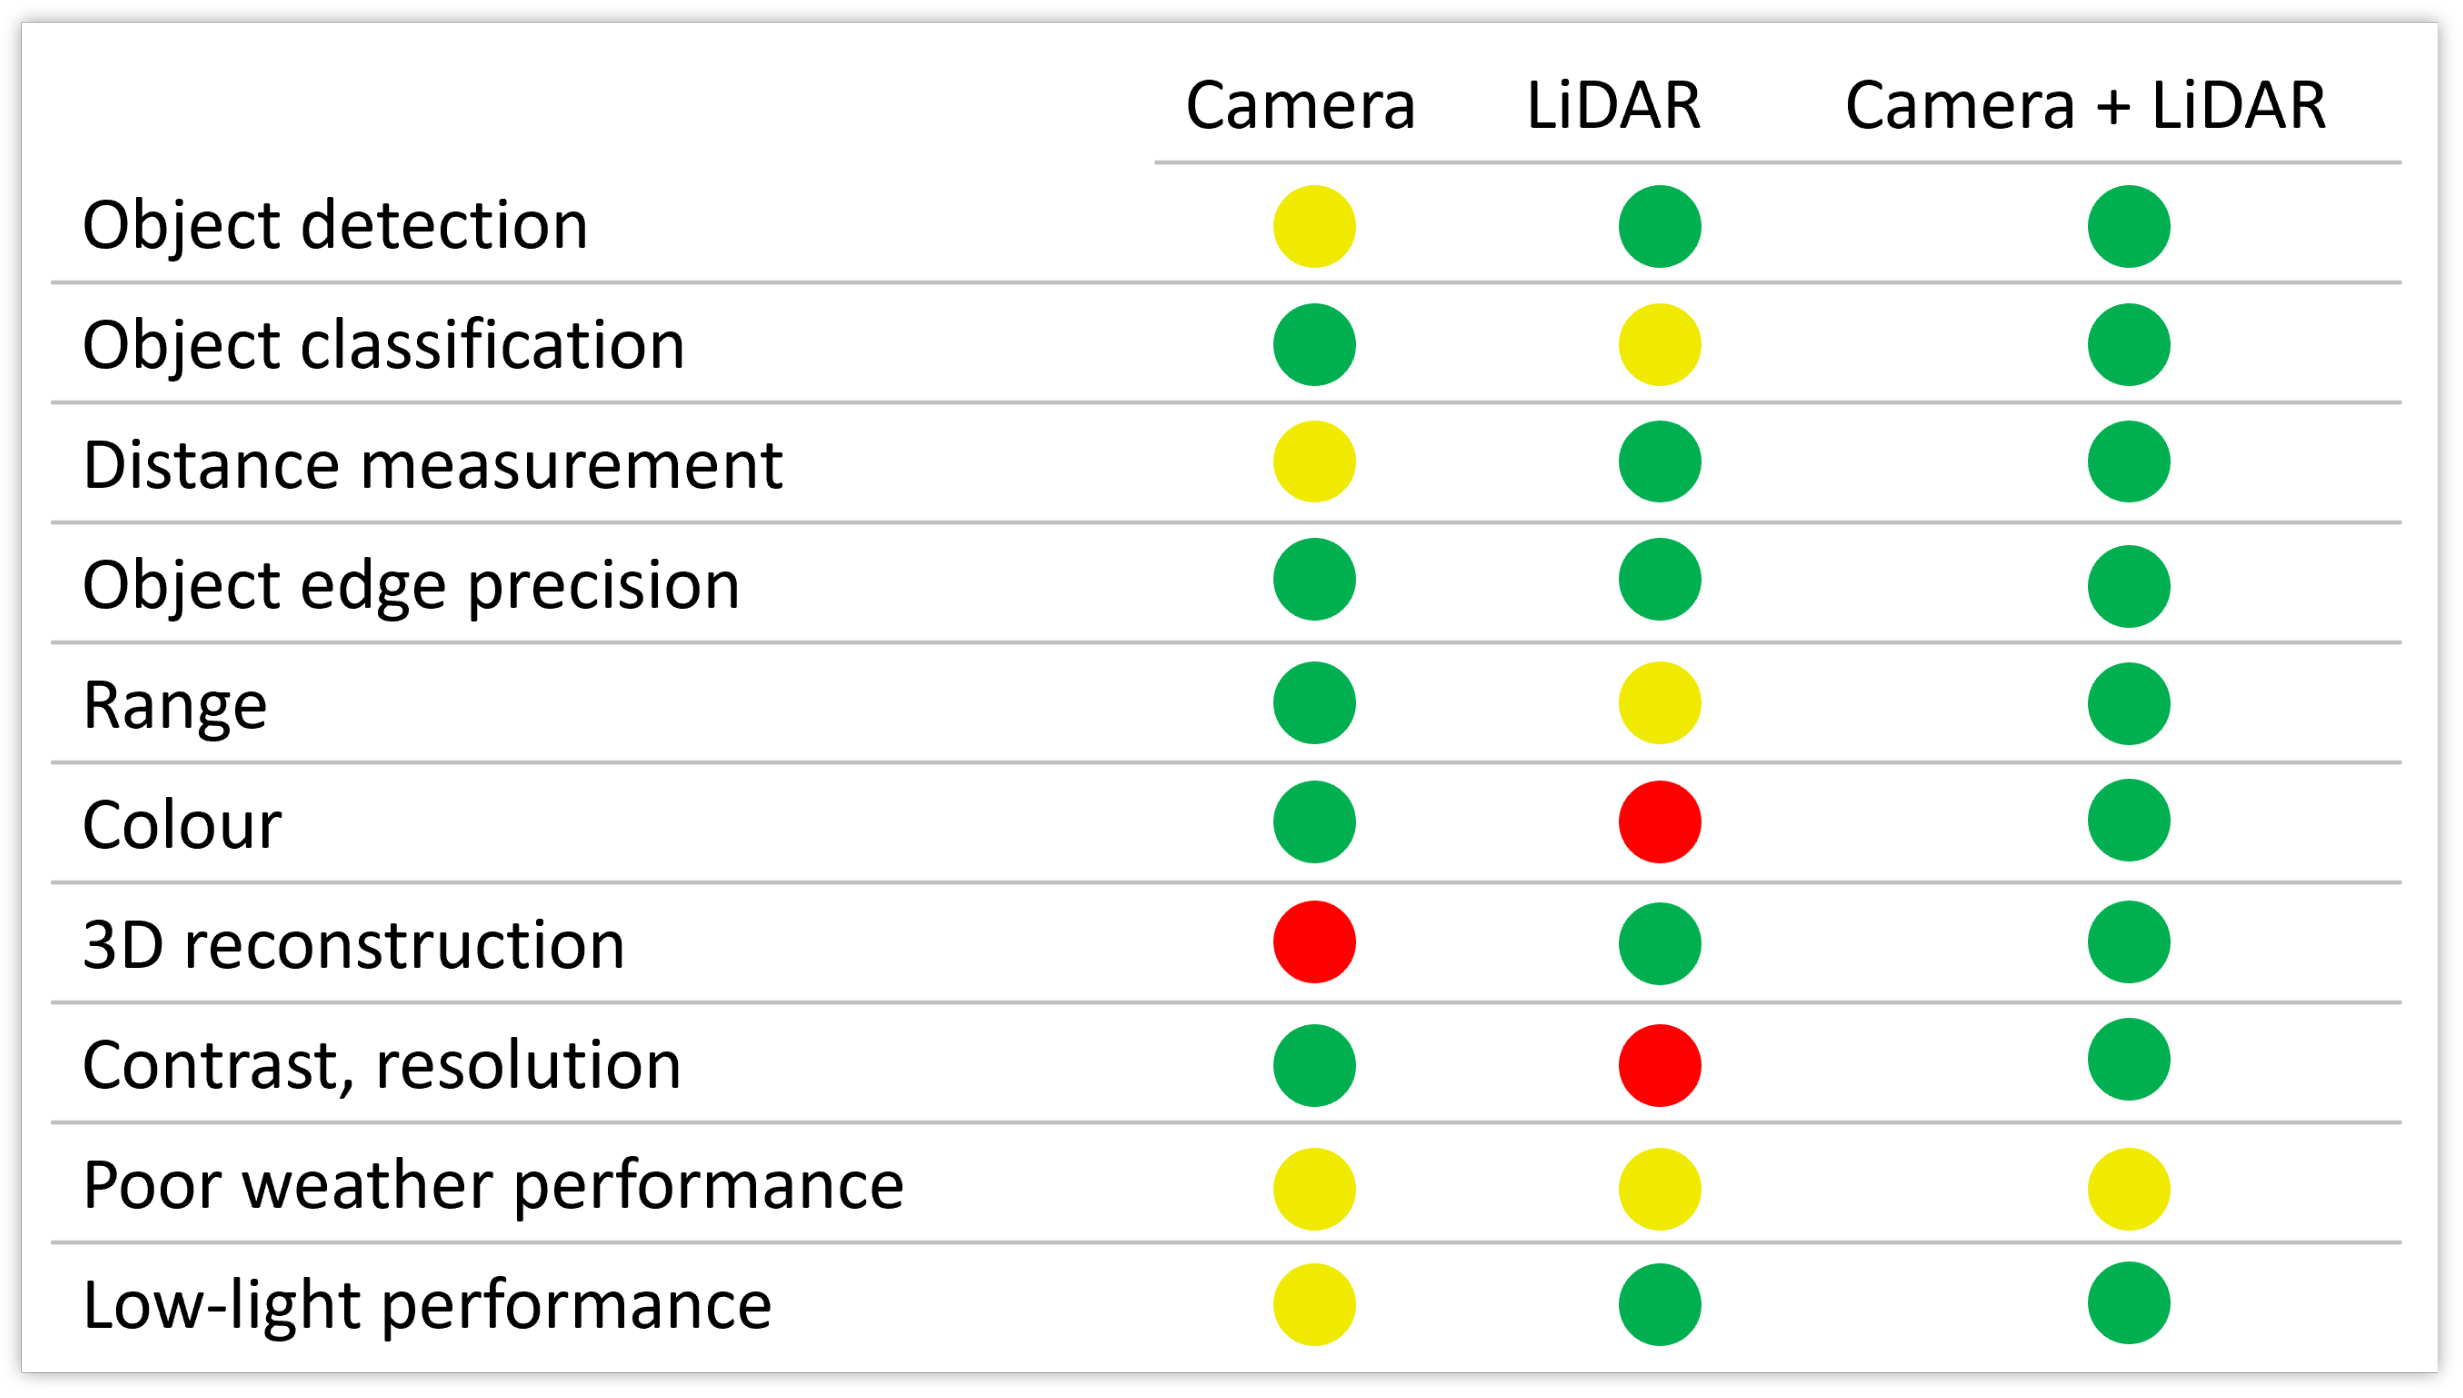
5. Data Types/Representation
6. Scene Interpretation
6.1. 3D Scene Interpretation
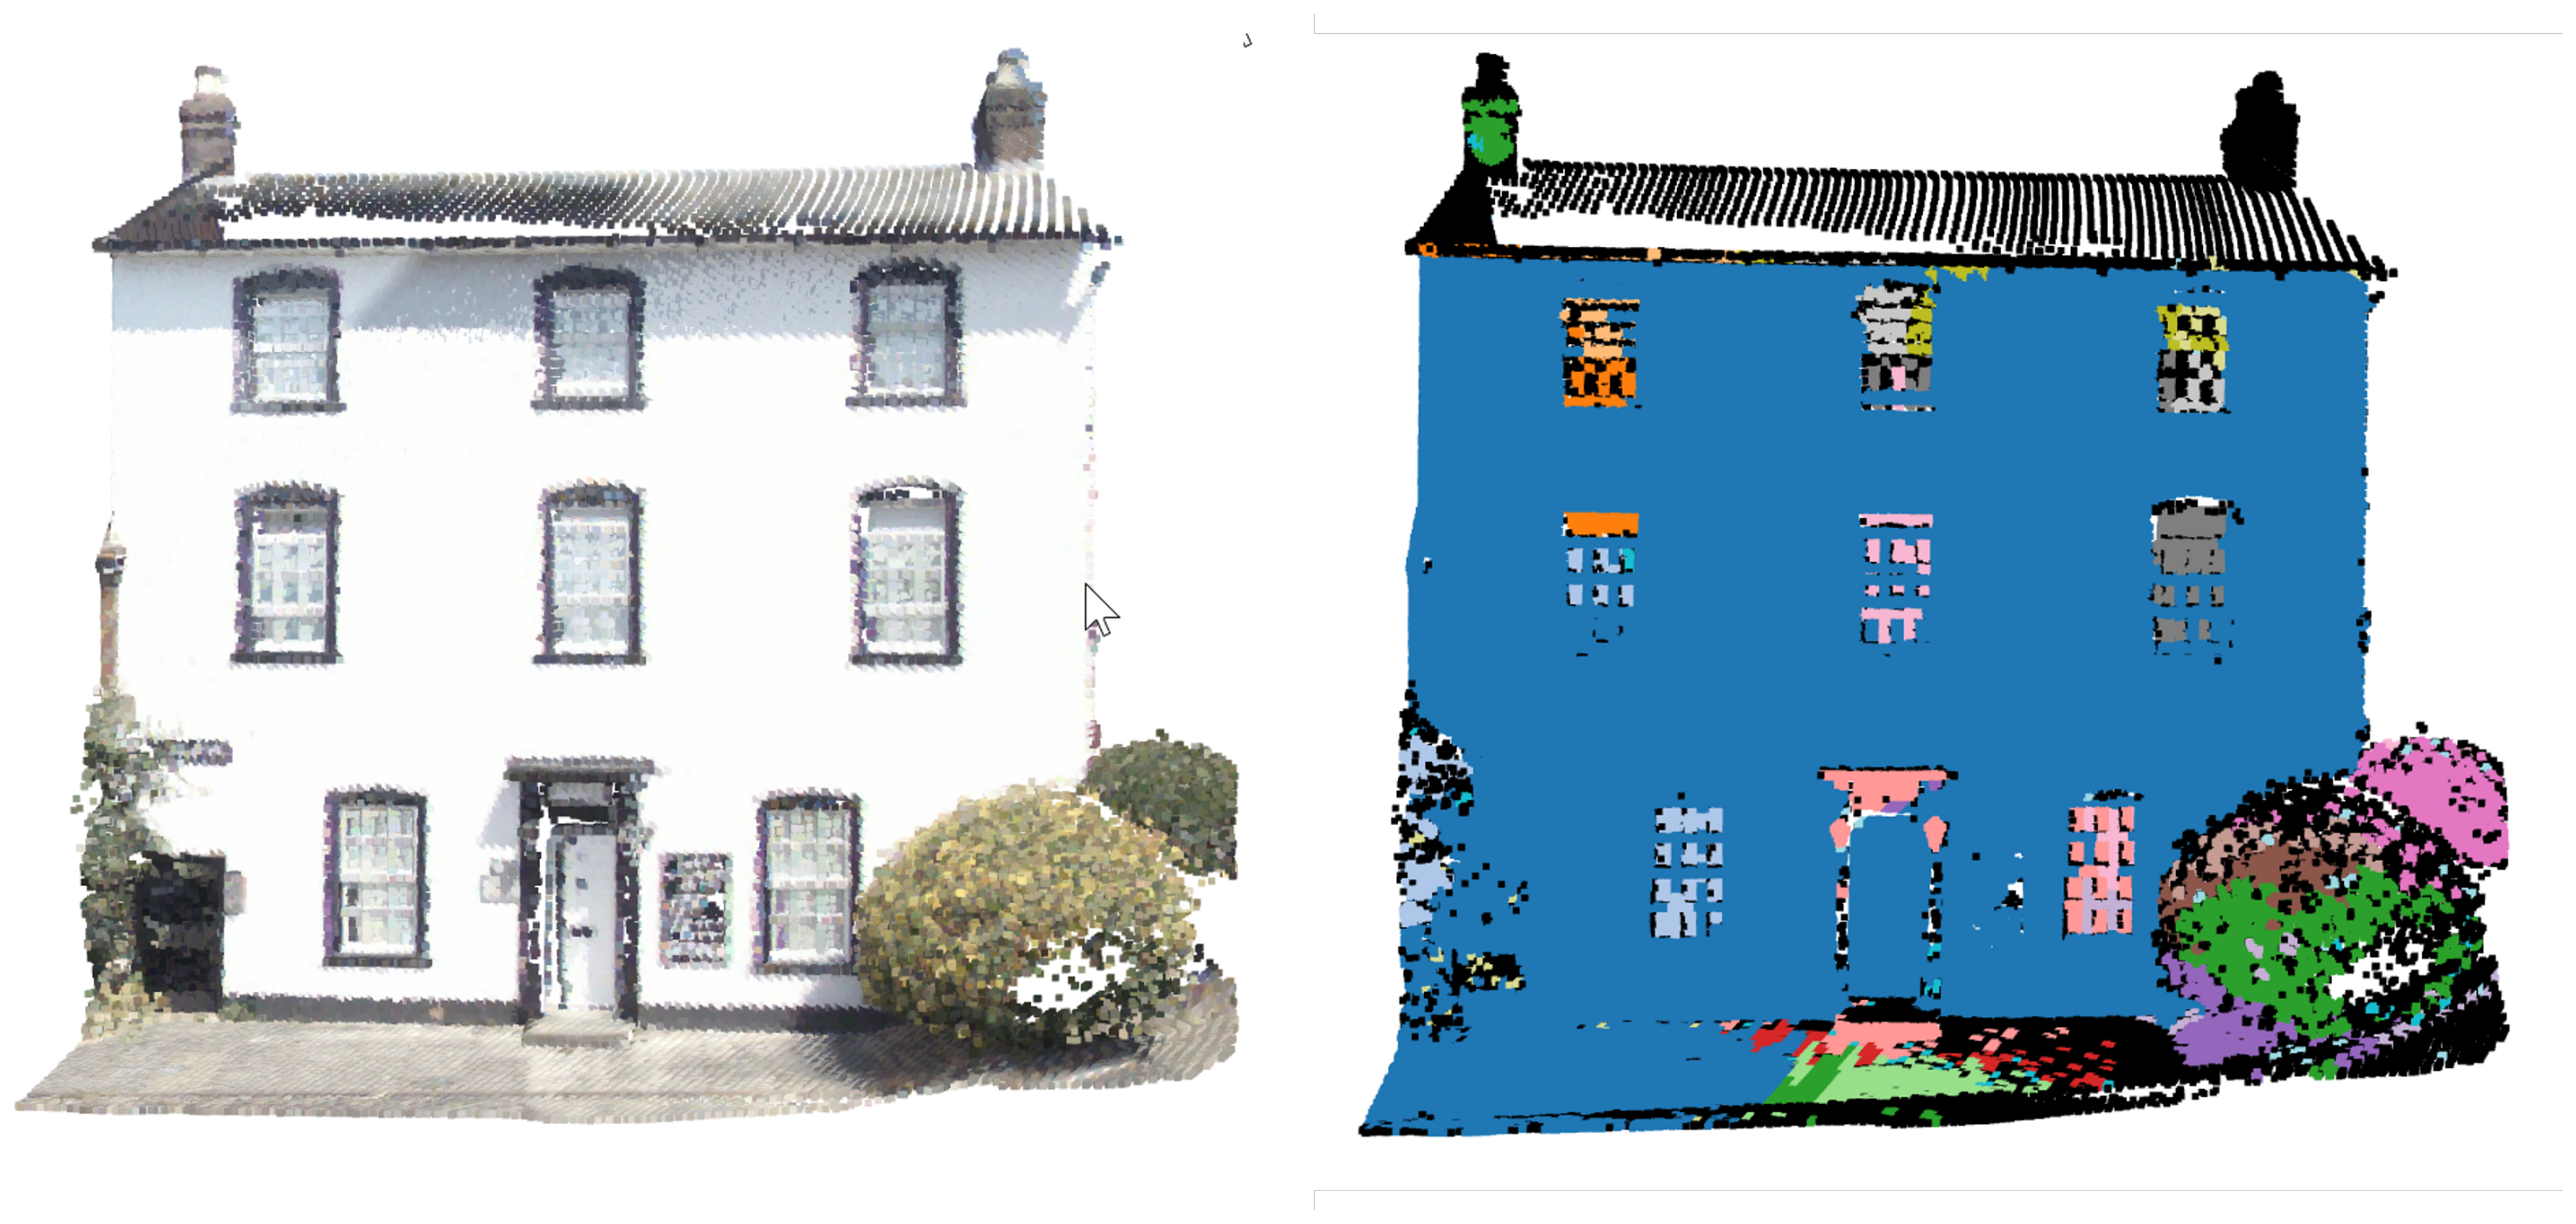
6.1.1. Segmentation
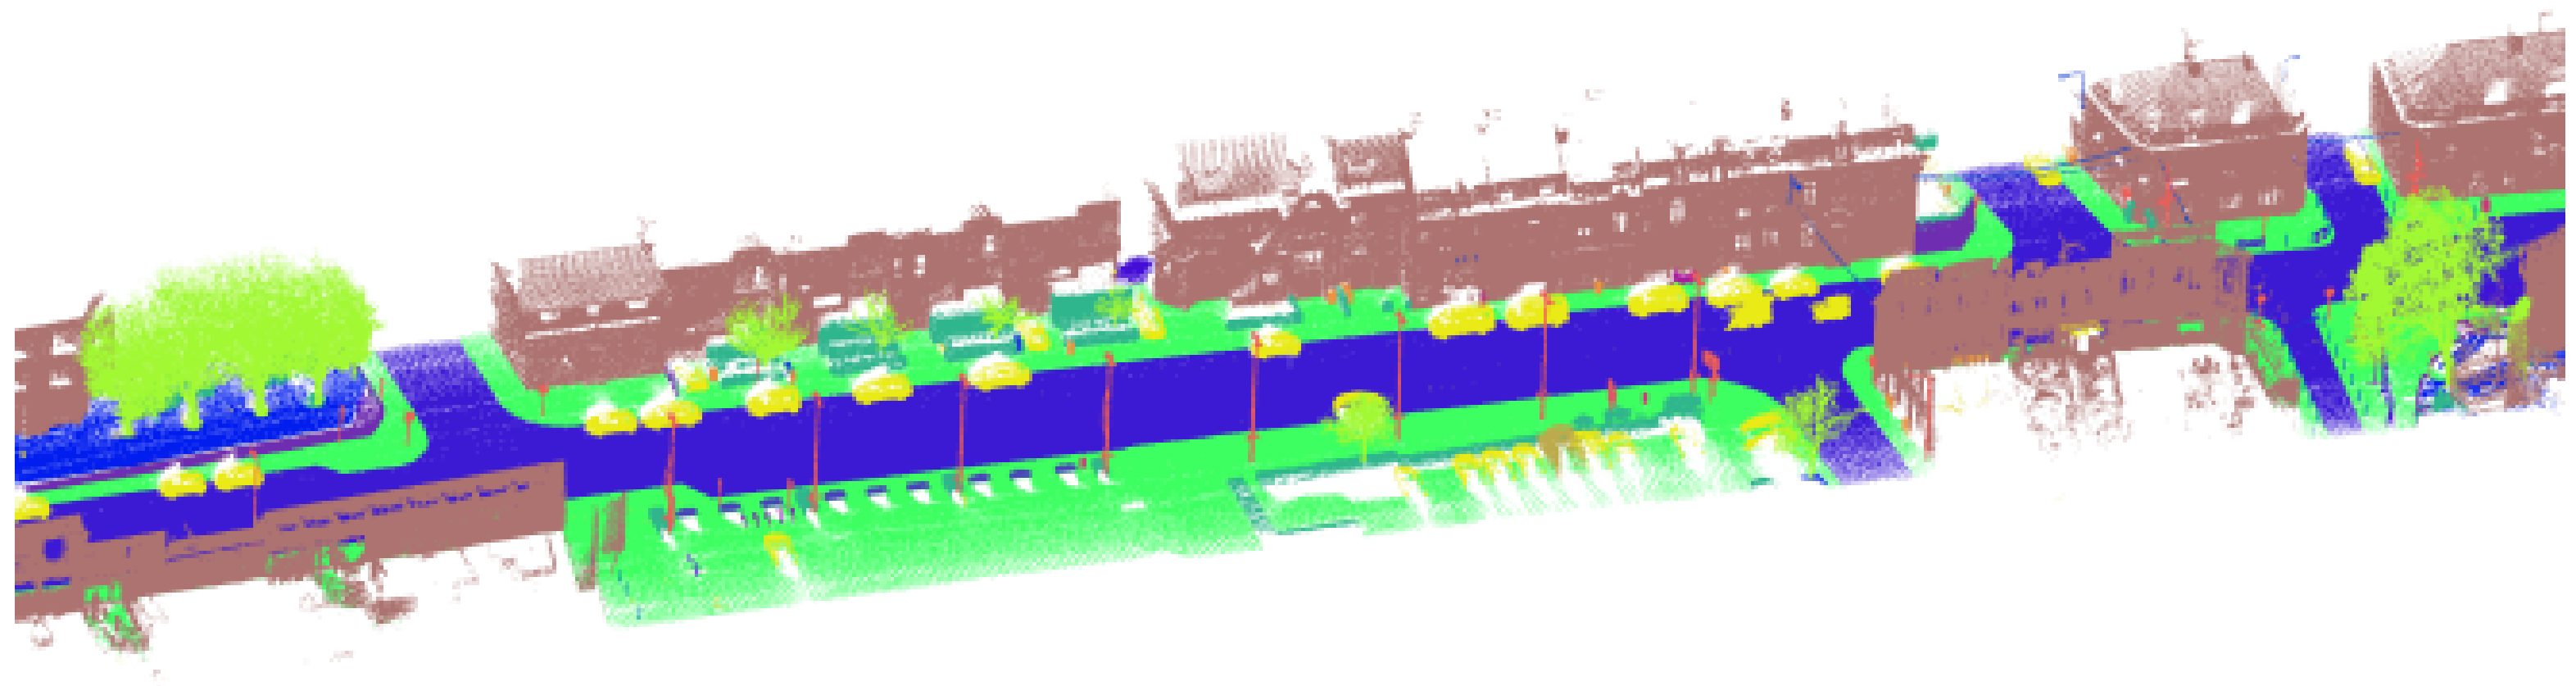
6.1.2. Scene Parsing
6.1.3. Façade Openings Extraction
6.2. 2D Scene Interpretation
6.2.1. Scene Parsing
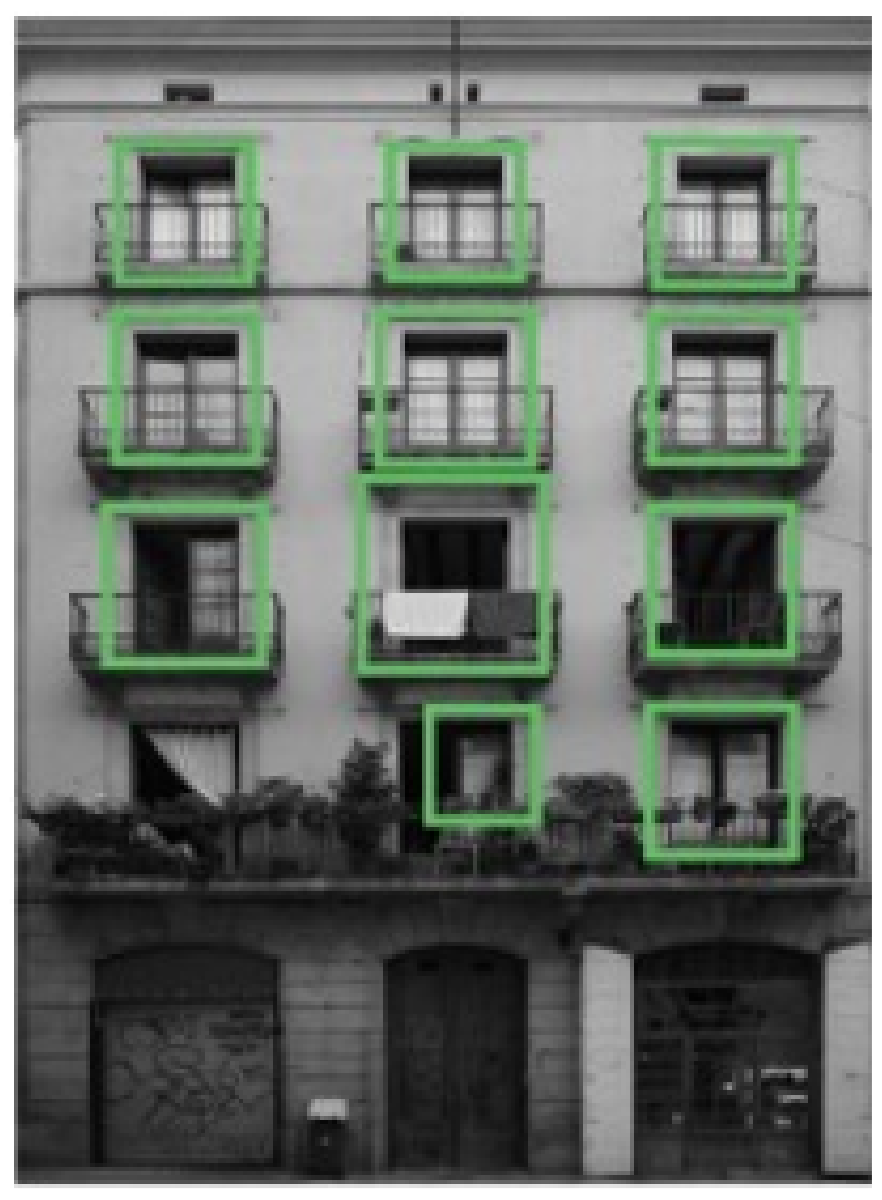
6.2.2. Façade Openings Extraction
6.3. Data Fusion for Scene Interpretation
7. Limitations and Challenges
- Automation: Automation of 3D building reconstruction has been an aim for researchers over the last couple of decades. However, the complexity of this task is high since we seek to reconstruct a well-defined underlying object; however, as we do not know the underlying object, it needs to be estimated from the data. Moreover, combining the above-mentioned data acquisition methods with the presented data processing techniques still relies upon many manual steps. Many new approaches require human intervention in setting up processing parameters, resulting in low levels of automation. Improving automation of the 3D building reconstruction by limiting the human input should involve designing concepts that create more intelligent and flexible workflows.
- Quality: The reconstruction of 3D buildings is directly related to level of detail (LoD) and level of accuracy (LoA), which are selected according to the application of the 3D model, method of data acquisition, processing and labour costs. The current low level of automation in the 3D reconstruction of buildings leads to the necessity of operator intervention. This intervention may concern data capture, data quality control, data processing settings, or the final result of the reconstruction assessment.Each operator has different knowledge and experience, which may affect the quality of the final 3D model. Therefore, it is imperative to develop good practice guidelines to eliminate the subjectivity between operators. Automation can be the solution to this problem. Hence, it is necessary to develop solutions for autonomous data processing that would minimize the need for intervention by an experienced operator.
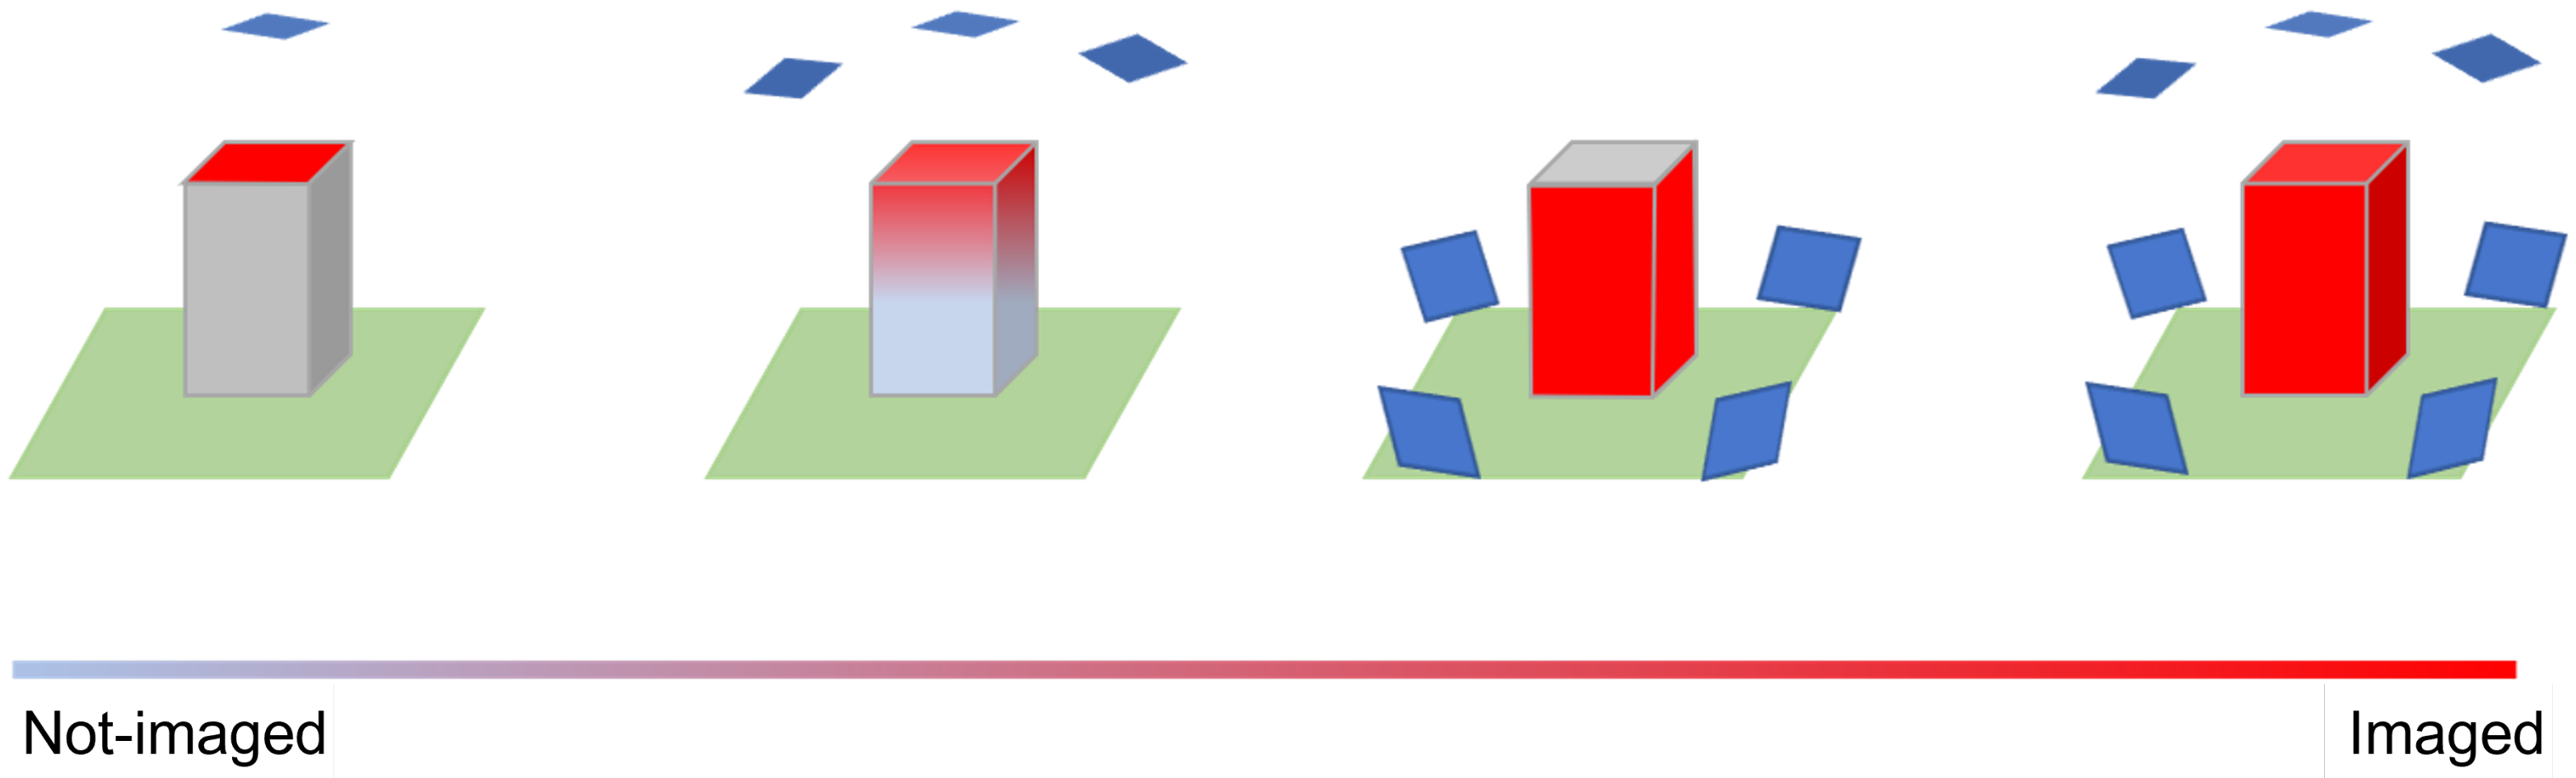
- Data acquisition: Due to its complexity, it is challenging to obtain a complete dataset for an urban environment. For instance, differences in the dimensions of the buildings lead to differences in the characteristics of the acquired dataset, e.g., a terrestrial point cloud captured for a tall building will be less dense in the higher parts as the sensor’s distance from the target will increase. Moreover, issues accessing buildings can result in gaps in the acquired point clouds and hence lower quality of the data used in 3D building reconstruction. Incomplete data are often the result of static objects (e.g., vegetation) or dynamic objects (e.g., vehicles and pedestrians) obscuring parts of buildings, while data acquisition at different times of the day may help limit dynamic occlusions [156], removing static occlusions is a more complex problem.In this regard, the fusion of data collected from various platforms offering different fields-of-view can help reduce the impact of static occlusions. For example, data from oblique cameras show blueprints of the building, which are hidden behind the stationary occluding object in the ground-level image. Another factor limiting data acquisition is the sensitivity of optical data to weather conditions (e.g., shadow and direct sunshine), resulting in a non-uniform image. One solution to this problem is incorporating data from laser scanning, which is more resistant to lightning and weather conditions.
8. Knowledge Gaps and Future Directions
- Deep-learning implementation: There been a recent rapid increase in the development and use of deep-learning algorithms for processing point clouds and images. However, the full application of these methods in reconstructing 3D buildings is still in its infancy. One of the reasons for this is the lack of proven, state-of-the-art methods that could be practically applied in commercial projects. In addition, most of the developed algorithms focus on modelling indoor environments that differ from the outdoor environment characterized by lower quality data (higher noise and outliers).The significant differences between outdoor and indoor environments therefore preclude the opportunity to interchange techniques used to reconstruct objects within each of these environments. Additionally, deep-learning approaches require a significant amount of test data to train the algorithm in order to recognize individual elements. The preparation of such data requires considerable time and manual work. Data collection itself is an expensive task, especially in the case of laser scanning over vast areas, and this is partly responsible for limiting the number of available datasets that could be used for training an algorithm.A possible solution to overcoming the requirement of an extensive training dataset is the current data-centric deep-learning trend that emphasizes data quality rather than quantity. Focusing on well-prepared training data instead of the selection of the hyperparameters of a deep-learning model could help in the development of more robust workflows for the reconstruction of 3D building models.
- Benchmark Datasets: Publicly available benchmark datasets are essential for the development and evaluation of new methods and algorithms since they enable the direct comparison with the existing strategies [157]. Despite the advantages and demand for benchmark datasets, the number of suitable, readily-available datasets available for the detailed segmentation of building façades remains low. One of the reasons for this may be the relatively recent interest in building modelling beyond its traditional representation in the form of a volumetric model.Additionally, let us assume that the façade openings are not only to be located on an image or a point cloud but also modelled (i.e., fitted into the body of the building). In this case, information is needed to reconstruct the object’s location in space, while it should not be an issue with point clouds, 2D image-based benchmark datasets need to include ancillary information, such as camera calibration parameters and sensor locations.Only such sets of comparative data permit an accurate validation of the results of 3D building reconstruction approaches. An additional requirement for creating a versatile and universal benchmark dataset is sufficient diversity of feature classes and their corresponding labels. Although currently low, the number of available benchmark datasets for complex urban environments is increasing with the advent of smart cars and autonomous vehicle applications (Table 5).Even though these datasets, which often consist of both 3D and 2D data, have a specific category of ’building’, they do not typically include sub-categories, such as windows or doors. This is, however, slowly changing and since 2020 there has been a growing interest in point cloud data that includes façade-level classes, such as windows, doors, balconies [158,159]. Benchmark datasets based only on images contain more detailed classes, which sometimes include windows and doors, however, they often lack the internal and external parameters, therefore making 3D reconstruction of building façades challenging.Table 5 summarises benchmark datasets commonly used for detailed façade segmentation (with camera images) as well as data from multimodal sensors with the potential to be used for complex 3D building reconstruction. However, it is worth recognising the problems related to the use of benchmark datasets presented in Table 5, especially the fact that these datasets were not explicitly designed for the detailed reconstruction of buildings. Benchmark datasets are designed with a specific application in mind; however, in many cases, their use goes beyond the boundaries of the tasks for which these datasets were originally created [160].In a recent study by Koch et al. [161], the problem of ’heavy borrowing’ of datasets within the machine-learning community was noted, where data created to solve one problem are used to solve another task, which can lead to misalignment. Many of the available benchmark datasets are generated in a specific geographic location, and using them elsewhere may yield poor outcomes. For example, a deep-learning model trained on data collected in the United States may not perform well on images from Asia.Additionally, factors, such as the sun path, weather conditions, variety of backgrounds and different camera specifications, can affect the model’s accuracy. At the moment, there are no available well-constructed benchmark datasets that can be used for detailed 3D building reconstruction. Despite the possibility of using the data presented in Table 5, it is necessary to approach them critically and verify that they are appropriate for the proposed application, or whether there is a need to create an entirely new dataset.
- Computing power and data bottlenecks: The variety of applications utilising 3D building models is leading to an increasing demand for data at different scales, from global to local. This, in turn, is associated with an increase in the amount of data that needs to be maintained, transmitted and processed. Although sophisticated methods for building reconstruction may produce more desirable results, the time associated with processing large volumes of data is typically greater than that of less complex techniques, subsequently reducing their cost-effectiveness.The solution to the big data processing problem may lie with high-performance computing (HPC) technologies, a set of tools and systems that provide significantly higher performance than a typical desktop computer, laptop, or workstation. HPC can be used to overcome the issue of slow data processing on a local system or limitations of CPU capacity. However, since HPC is often chargeable, a common method is to run a small-scale test on a local device and then migrate the analysis to HPC [162]. Ultimately, coping with big data may contribute to the development of machine-learning algorithms and the search for efficient data storage of pipelines [163,164].
- Completeness: 3D building reconstruction from images is a reverse-engineering task that requires methods to validate newly produced results. One of the metrics for estimating the quality of the obtained 3D building model is completeness. Completeness has two kinds of errors: omission and commission. The first relates to omitted building elements, while the second concerns elements incorrectly classified as part of the building.Assessing the completeness of 3D building models generated from terrestrial images is a challenging task due to elements that obscure the façade of the building (e.g., cars, people and vegetation) and a lack of reference data. Although blueprints and BIM can serve as a reference to assess the surface-based performance of developed algorithms, the available BIM and blueprints data are again limited. Therefore, it is essential to develop methods to readily determine the completeness of detailed building models.
9. Conclusions
Author Contributions
Funding
Data Availability Statement
Conflicts of Interest
References
- Billen, R.; Cutting-Decelle, A.; Marina, O.; De Almeida, J.; Caglioni, M.; Falquet, G.; Leduc, T.; Métral, C.; Moreau, G.; Perret, J.; et al. 3D City Models and Urban Information: Current Issues; EDP Sciences: Ulys, France, 2014. [Google Scholar]
- Biljecki, F.; Stoter, J.; Ledoux, H.; Zlatanova, S.; Çöltekin, A. Applications of 3D city models: State of the art review. SPRS Int. J. -Geo-Inf. 2015, 4, 2842–2889. [Google Scholar] [CrossRef] [Green Version]
- Stoter, A.; Ploeger, J.; Roes, H.; Van Der Riet, R.; Biljecki, E.; Ledoux, F. First 3D Cadastral Registration of Multi-Level Ownerships Rights in the Netherlands. In Proceedings of the 5th International FIG Workshop on 3D Cadastres, Athens, Greece, 18–20 October 2016; pp. 491–504. [Google Scholar]
- Chen, L.C.; Wu, C.H.; Shen, T.S.; Chou, C.C. The application of geometric network models and building information models in geospatial environments for fire-fighting simulations. Comput. Environ. Urban Syst. 2014, 45, 1–12. [Google Scholar] [CrossRef]
- Kaňuk, J.; Gallay, M.; Hofierka, J. Generating time series of virtual 3-D city models using a retrospective approach. Landsc. Urban Plan. 2015, 139, 40–53. [Google Scholar] [CrossRef]
- Prandi, F.; Soave, M.; Devigili, F.; Andreolli, M.; De Amicis, R. Services Oriented Smart City Platform Based On 3d City Model Visualization. ISPRS Ann. Photogramm. Remote Sens. Spat. Inf. Sci. 2014, 2, 59. [Google Scholar] [CrossRef] [Green Version]
- Ruohomaki, T.; Airaksinen, E.; Huuska, P.; Kesaniemi, O.; Martikka, M.; Suomisto, J. Smart City Platform Enabling Digital Twin. In Proceedings of the Ninth International Conference on Intelligent Systems 2018: Theory, Research and Innovation in Applications, IS 2018-Proceedings, Funchal, Portugal, 25–27 September 2018. [Google Scholar] [CrossRef]
- Neuhausen, M.; Obel, M.; Martin, A.; Mark, P.; König, M. Window detection in facade images for risk assessment in tunneling. Vis. Eng. 2018, 6, 1–16. [Google Scholar] [CrossRef] [Green Version]
- Gruen, A.; Schubiger, S.; Qin, R.; Schrotter, G.; Xiong, B.; Li, J.; Ling, X.; Xiao, C.; Yao, S.; Nuesch, F. Semantically enriched high resolution LoD 3 building model generation. Int. Arch. Photogramm. Remote Sens. Spat. Inf. Sci. 2019, 42, 11–18. [Google Scholar] [CrossRef] [Green Version]
- Xu, Y.; Stilla, U. Toward Building and Civil Infrastructure Reconstruction from Point Clouds: A Review on Data and Key Techniques. IEEE J. Sel. Top. Appl. Earth Obs. Remote Sens. 2021, 14, 2857–2885. [Google Scholar] [CrossRef]
- Min, Z.; Wang, J.; Meng, M.Q. Joint Rigid Registration of Multiple Generalized Point Sets with Hybrid Mixture Models. IEEE Trans. Autom. Sci. Eng. 2020, 17, 334–347. [Google Scholar] [CrossRef]
- Zhu, J.; Jiang, Z.; Evangelidis, G.D.; Zhang, C.; Pang, S.; Li, Z. Efficient registration of multi-view point sets by K-means clustering. Inf. Sci. 2019, 488, 205–218. [Google Scholar] [CrossRef] [Green Version]
- Cheng, L.; Chen, S.; Liu, X.; Xu, H.; Wu, Y.; Li, M.; Chen, Y. Registration of Laser Scanning Point Clouds: A Review. Sensors 2018, 18, 1641. [Google Scholar] [CrossRef] [Green Version]
- Elbaz, G.; Avraham, T.; Fischer, A. 3D point cloud registration for localization using a deep neural network auto-encoder. In Proceedings of the 30th IEEE Conference on Computer Vision and Pattern Recognition, Honolulu, HI, USA, 21–26 July 2017. [Google Scholar] [CrossRef]
- Yang, B.; Zang, Y. Automated registration of dense terrestrial laser-scanning point clouds using curves. ISPRS J. Photogramm. Remote Sens. 2014, 95, 109–121. [Google Scholar] [CrossRef]
- Xie, J.; Hsu, Y.F.; Feris, R.S.; Sun, M.T. Fine Registration of 3D Point Clouds with ICP Using an RGB-D Camera. J. Vis. Commun. Image Represent. 2013, 6938, 194–204. [Google Scholar]
- Fond, A.; Berger, M.O.; Simon, G. Model-image registration of a building’s facade based on dense semantic segmentation. Comput. Vis. Image Underst. 2021, 206, 103185. [Google Scholar] [CrossRef]
- Piasco, N.; Sidibé, D.; Demonceaux, C.; Gouet-Brunet, V. A survey on Visual-Based Localization: On the benefit of heterogeneous data. Pattern Recognit. 2018, 74, 90–109. [Google Scholar] [CrossRef] [Green Version]
- Sattler, T.; Maddern, W.; Toft, C.; Torii, A.; Hammarstrand, L.; Stenborg, E.; Safari, D.; Okutomi, M.; Pollefeys, M.; Sivic, J.; et al. Benchmarking 6DOF Outdoor Visual Localization in Changing Conditions. In Proceedings of the IEEE Computer Society Conference on Computer Vision and Pattern Recognition, Salt Lake City, UT, USA, 18–22 June 2018. [Google Scholar] [CrossRef] [Green Version]
- Schonberger, J.L.; Pollefeys, M.; Geiger, A.; Sattler, T. Semantic Visual Localization. In Proceedings of the IEEE Computer Society Conference on Computer Vision and Pattern Recognition, Salt Lake City, UT, USA, 18–22 June 2018. [Google Scholar] [CrossRef] [Green Version]
- Sattler, T.; Leibe, B.; Kobbelt, L. Efficient & Effective Prioritized Matching for Large-Scale Image-Based Localization. IEEE Trans. Pattern Anal. Mach. Intell. 2016, 39, 1744–1756. [Google Scholar] [CrossRef]
- Li, M.; Nan, L.; Smith, N.; Wonka, P. Reconstructing building mass models from UAV images. Comput. Graph. 2016, 54, 84–93. [Google Scholar] [CrossRef] [Green Version]
- Zhang, L.; Li, Z.; Li, A.; Liu, F. Large-scale urban point cloud labeling and reconstruction. ISPRS J. Photogramm. Remote. Sens. 2018, 138, 86–100. [Google Scholar] [CrossRef]
- Li, Z.; Zhang, L.; Mathiopoulos, P.T.; Liu, F.; Zhang, L.; Li, S.; Liu, H. A hierarchical methodology for urban facade parsing from TLS point clouds. ISPRS J. Photogramm. Remote Sens. 2017, 123, 75–93. [Google Scholar] [CrossRef]
- Rusu, R.B.; Marton, Z.C.; Blodow, N.; Dolha, M.; Beetz, M. Towards 3D Point cloud based object maps for household environments. Robot. Auton. Syst. 2008, 56, 927–941. [Google Scholar] [CrossRef]
- Ochmann, S.; Vock, R.; Klein, R. Automatic reconstruction of fully volumetric 3D building models from oriented point clouds. ISPRS J. Photogramm. Remote Sens. 2019, 151, 251–262. [Google Scholar] [CrossRef] [Green Version]
- Lin, H.; Gao, J.; Zhou, Y.; Lu, G.; Ye, M.; Zhang, C.; Liu, L.; Yang, R. Semantic decomposition and reconstruction of residential scenes from LiDAR data. ACM Trans. Graph. 2013, 32, 1–10. [Google Scholar] [CrossRef]
- Pomerleau, F.; Colas, F.; Siegwart, R. A Review of Point Cloud Registration Algorithms for Mobile Robotics. Found. Trends Robot. 2015, 4, 1–104. [Google Scholar] [CrossRef] [Green Version]
- Gimenez, L.; Hippolyte, J.L.; Robert, S.; Suard, F.; Zreik, K. Reconstruction of 3D building information models from 2D scanned plans. J. Build. Eng. 2015, 2, 24–35. [Google Scholar] [CrossRef]
- Musialski, P.; Wonka, P.; Aliaga, D.G.; Wimmer, M.; Van Gool, L.; Purgathofer, W. A Survey of Urban Reconstruction; Wiley Online Library: Hoboken, NJ, USA, 2013; Volume 32, pp. 146–177. [Google Scholar] [CrossRef]
- Haala, N.; Kada, M. An update on automatic 3D building reconstruction. ISPRS J. Photogramm. Remote Sens. 2010, 65, 570–580. [Google Scholar] [CrossRef]
- Neuhausen, M.; Koch, C.; König, M. Image-based Window Detection—An Overview. In Proceedings of the 23rd International Workshop of the European Group for Intelligent Computing in Engineering, Kraków, Poland, 29 June–1 July 2016. [Google Scholar]
- Lee, D.; Pietrzyk, P.; Donkers, S.; Liem, V.; van Oostveen, J. Modelling and observation of heat losses from buildings: The impact of geometric detail on 3D heat flux modelling. In Proceedings of the 33rd European Association of Remote Sensing Laboratories (EARSeL) Symposium, Matera, Italy, 3–6 June 2013. [Google Scholar]
- Deng, Y.; Cheng, J.C.; Anumba, C. Mapping between BIM and 3D GIS in different levels of detail using schema mediation and instance comparison. Autom. Constr. 2016, 67, 1–21. [Google Scholar] [CrossRef]
- Pătrăucean, V.; Armeni, I.; Nahangi, M.; Yeung, J.; Brilakis, I.; Haas, C. State of research in automatic as-built modelling. Adv. Eng. Inform. 2015, 29, 162–171. [Google Scholar] [CrossRef] [Green Version]
- Wang, J.; Sun, W.; Shou, W.; Wang, X.; Wu, C.; Chong, H.Y.; Liu, Y.; Sun, C. Integrating BIM and LiDAR for Real-Time Construction Quality Control. J. Intell. Robot. Syst. Theory Appl. 2015, 79, 417–432. [Google Scholar] [CrossRef]
- Tang, P.; Huber, D.; Akinci, B.; Lipman, R.; Lytle, A. Automatic Reconstruction of As-Built Building Information Models from Laser-Scanned Point Clouds: A Review of Related Techniques. Autom. Constr. 2010, 19, 829–843. [Google Scholar] [CrossRef]
- Freitas, S.; Catita, C.; Redweik, P.; Brito, M.C. Modelling solar potential in the urban environment: State-of-the-art review. Renew. Sustain. Energy Rev. 2015, 41, 915–931. [Google Scholar] [CrossRef]
- Desthieux, G.; Carneiro, C.; Camponovo, R.; Ineichen, P.; Morello, E.; Boulmier, A.; Abdennadher, N.; Dervey, S.; Ellert, C. Solar energy potential assessment on rooftops and facades in large built environments based on lidar data, image processing, and cloud computing. Methodological background, application, and validation in Geneva (solar cadaster). Front. Built Environ. 2018, 4, 1–22. [Google Scholar] [CrossRef]
- Catita, C.; Redweik, P.; Pereira, J.; Brito, M.C. Extending solar potential analysis in buildings to vertical facades. Comput. Geosci. 2014, 66, 1–12. [Google Scholar] [CrossRef]
- Gasparella, A.; Pernigotto, G.; Cappelletti, F.; Romagnoni, P.; Baggio, P. Analysis and modelling of window and glazing systems energy performance for a well insulated residential building. Energy Build. 2011, 43, 1030–1037. [Google Scholar] [CrossRef]
- Perera, D.W.U.; Pfeiffer, C.F.; Skeie, N.O. Modelling the Heat Dynamics of a Residential Building Unit: Application to Norwegian Buildings. Model. Identif. Control 2014, 35, 43–57. [Google Scholar] [CrossRef] [Green Version]
- Schwanebeck, M.; Krüger, M.; Duttmann, R. Improving GIS-Based Heat Demand Modelling and Mapping for Residential Buildings with Census Data Sets at Regional and Sub-Regional Scales. Energies 2021, 14, 1029. [Google Scholar] [CrossRef]
- Nageler, P.; Zahrer, G.; Heimrath, R.; Mach, T.; Mauthner, F.; Leusbrock, I.; Schranzhofer, H.; Hochenauer, C. Novel validated method for GIS based automated dynamic urban building energy simulations. Energy 2017, 139, 142–154. [Google Scholar] [CrossRef]
- Krüger, A.; Kolbe, T.H. Building analysis for urban energy planning using key indicators on virtual 3d city models—The energy atlas of Berlin. ISPRS-Int. Arch. Photogramm. Remote Sens. Spat. Inf. Sci. 2012, XXXIX-B2, 145–150. [Google Scholar] [CrossRef] [Green Version]
- Previtali, M.; Barazzetti, L.; Brumana, R.; Cuca, B.; Oreni, D.; Roncoroni, F.; Scaioni, M. Automatic façade modelling using point cloud data for energy-efficient retrofitting. Appl. Geomat. 2014, 6, 95–113. [Google Scholar] [CrossRef]
- Schlueter, A.; Thesseling, F. Building information model based energy/exergy performance assessment in early design stages. Autom.Constr. 2009, 18, 153–163. [Google Scholar] [CrossRef]
- Saran, S.; Wate, P.; Srivastav, S.K.; Krishna Murthy, Y.V. CityGML at semantic level for urban energy conservation strategies. Ann. GIS 2015, 21, 27–41. [Google Scholar] [CrossRef]
- Obel, M.; Mark, P.; Neuhausen, M.; König, M.; Schindler, S. Settlement risk assessment by means of categorized surface infrastructure. Structural analysis of historical constructions: Anamnesis, diagnosis, therapy, Controls. In Proceedings of the Tenth International Conference on Structural Analysis of Historical Constructions, Leuven, Belgium, 13–15 September 2016. [Google Scholar] [CrossRef]
- Neuhausen, M.; König, M. Automatic window detection in facade images. Autom. Constr. 2018, 96, 527–539. [Google Scholar] [CrossRef]
- Zhang, X.; Lippoldt, F.; Chen, K.; Johan, H.; Erdt, M.; Zhang, X.; Lippoldt, F.; Chen, K.; Johan, H.; Erdt, M. A Data-driven Approach for Adding Facade Details to Textured LoD2 CityGML Models. In Proceedings of the 14th International Joint Conference on Computer Vision, Imaging and Computer Graphics Theory and Applications, Prague, Czech Republic, 25–27 June 2019; pp. 294–301. [Google Scholar]
- Duarte, D.; Nex, F.; Kerle, N.; Vosselman, G. Damage detection on building façades using multi-temporal aerial oblique imagery. ISPRS Ann. Photogramm. Remote Sens. Spat. Inf. Sci. 2019, IV-2/W5, 29–36. [Google Scholar] [CrossRef] [Green Version]
- Kelly, T.; Guerrero, P.; Steed, A.; Wonka, P.; Mitra, N.J. FrankenGAN: Guided detail synthesis for building mass-models using style-synchonized GANs. arXiv 2018, arXiv:1806.07179. [Google Scholar] [CrossRef] [Green Version]
- Klem, D., Jr. Bird–window collisions: A critical animal welfare and conservation issue. J. Appl. Anim. Welf. Sci. 2015, 18, S11–S17. [Google Scholar] [CrossRef]
- Klem, D., Jr.; Farmer, C.J.; Delacretaz, N.; Gelb, Y.; Saenger, P.G. Architectural and landscape risk factors associated with bird—glass collisions in an urban environment. Wilson J. Ornithol. 2009, 121, 126–134. [Google Scholar] [CrossRef]
- Klem, D.; Keck, D.C.; Marty, K.L.; Ball, A.J.M.; Niciu, E.E.; Platt, C.T. Effects of window angling, feeder placement, and scavengers on avian mortality at plate glass. Wilson Bull. 2004, 116, 69–73. [Google Scholar] [CrossRef] [Green Version]
- Wang, R.; Peethambaran, J.; Chen, D. LiDAR Point Clouds to 3-D Urban Models: A Review. IEEE J. Sel. Top. Appl. Earth Obs. Remote Sens. 2018, 11, 606–627. [Google Scholar] [CrossRef]
- Lotte, R.G. 3-Dimensional (3D) Urban Mapping: A Study of Detection and Reconstruction of Building’s Facade Through Structure-From-Motion (SfM) and Convolutional Neural Network (CNN). Ph.D. Thesis, Instituto Nacional De Pesquisas Espaciais, State of Sao Paulo, Brazil, 2018. [Google Scholar]
- Frommholz, D.; Linkiewicz, M.; Poznanska, A.M. Inlining 3d reconstruction, multi-source texture mapping and semantic analysis using oblique aerial imagery. ISPRS-Int. Arch. Photogramm. Remote Sens. Spatial Inf. Sci. 2016, XLI-B3, 605–612. [Google Scholar] [CrossRef] [Green Version]
- Toschi, I.; Ramos, M.M.; Nocerino, E.; Menna, F.; Remondino, F.; Moe, K.; Poli, D.; Legat, K.; Fassi, F. Oblique photogrammetry supporting 3d urban reconstruction of complex scenarios. Int. Arch. Photogramm. Remote. Sens. Spat. Inf. Sci.-ISPRS Arch. 2017, 42, 519–526. [Google Scholar] [CrossRef] [Green Version]
- Nex, F.; Rupnik, E.; Remondino, F. Building Footprints Extraction from Oblique Imagery. ISPRS Ann. Photogramm. Remote Sens. Spat. Inf. Sci. 2013, 2, 61–66. [Google Scholar] [CrossRef] [Green Version]
- Rakha, T.; Gorodetsky, A. Review of Unmanned Aerial System (UAS) Applications in the Built Environment: Towards Automated Building Inspection Procedures Using Drones. Autom. Constr. 2018, 93, 252–264. [Google Scholar] [CrossRef]
- Lin, Y.; Hyyppä, J.; Kukko, A. Stop-and-go mode: Sensor manipulation as essential as sensor development in terrestrial laser scanning. Sensors 2013, 13, 8140–8154. [Google Scholar] [CrossRef] [PubMed] [Green Version]
- Novak, K. Mobile mapping systems: New tools for the fast collection of GIS information. In State-of-the-Art Mapping. International Society for Optics and Photonics; SPIE: Bellingham, WA, USA, 1993; Volume 1943, pp. 188–198. [Google Scholar]
- Newman, P.; Cole, D.; Ho, K. Outdoor SLAM using visual appearance and laser ranging. In Proceedings of the IEEE International Conference on Robotics and Automation, Orlando, FL, USA, 15–19 May 2006; Volume 2006. [Google Scholar] [CrossRef]
- Huber, D. Background Positioning for Mobile devices-Android vs. iphone. In Proceedings of the Joint Conference of IEEE Computer & Communication Societies, Shanghai, China, 10–15 April 2011; Volume 7. [Google Scholar]
- Poiesi, F.; Locher, A.; Chippendale, P.; Nocerino, E.; Remondino, F.; Van Gool, L. Cloud-based collaborative 3D reconstruction using smartphones. In Proceedings of the 14th European Conference on Visual Media Production (CVMP 2017), London, UK, 11–13 December 2017; pp. 1–9. [Google Scholar]
- Zhang, S.; Shan, J.; Zhang, Z.; Yan, J.; Hou, Y. Integrating smartphone images and airborne lidar data for complete urban building modelling. Int. Arch. Photogramm. Remote Sens. Spat. Inf. Sci. 2016, 41, 741–747. [Google Scholar] [CrossRef] [Green Version]
- Jeong, J.; Kim, T. Semi-automatic building models and façade texture mapping from mobile phone images. Int. Arch. Photogramm. Remote Sens. Spat. Inf. Sci. 2016, 41, 613. [Google Scholar] [CrossRef] [Green Version]
- Westoby, M.J.; Brasington, J.; Glasser, N.F.; Hambrey, M.J.; Reynolds, J.M. ’Structure-from-Motion’ photogrammetry: A low-cost, effective tool for geoscience applications. Geomorphology 2012, 179, 300–314. [Google Scholar] [CrossRef] [Green Version]
- Goodchild, M.F. Citizens as sensors: The world of volunteered geography. GeoJournal 2007, 69, 211–221. [Google Scholar] [CrossRef] [Green Version]
- Elwood, S. Volunteered geographic information: Future research directions motivated by critical, participatory, and feminist GIS. GeoJournal 2008, 72, 173–183. [Google Scholar] [CrossRef]
- Fan, H.; Wang, Y.; Gong, J. Layout graph model for semantic façade reconstruction using laser point clouds. Geo-Spat. Inf. Sci. 2021, 24, 403–421. [Google Scholar] [CrossRef]
- Daniel, F.; Kucherbaev, P.; Cappiello, C.; Benatallah, B.; Allahbakhsh, M. Quality control in crowdsourcing: A survey of quality attributes, assessment techniques, and assurance actions. ACM Comput. Surv. (CSUR) 2018, 51, 1–40. [Google Scholar] [CrossRef] [Green Version]
- Verykokou, S.; Ioannidis, C. Oblique Aerial Images: A Review Focusing on Georeferencing Procedures. Int. J. Remote Sens. 2018, 39, 3452–3496. [Google Scholar] [CrossRef]
- Remondino, F.; Toschi, I.; Gerke, M.; Nex, F.; Holland, D.; McGill, A.; Lopez, J.T.; Magarinos, A. Oblique aerial imagery for nma—some best practices. In Proceedings of the XXIII ISPRS Congress, Prague, Czech Republic, 12–19 July 2016; Volume XLI-B4, pp. 639–645. [Google Scholar] [CrossRef] [Green Version]
- Rupnik, E.; Nex, F.; Remondino, F. Oblique multi-camera systems-orientation and dense matching issues. In International Archives of the Photogrammetry, Remote Sensing and Spatial Information Sciences-ISPRS Archives; ISPRS: Vienna, Austria, 2014; Volume 40. [Google Scholar] [CrossRef] [Green Version]
- McManamon, P.F. LiDAR Technologies and Systems; SPIE Press Book: Bellingham, WA, USA, 2019. [Google Scholar] [CrossRef]
- Mikhail, E.M. Introduction to Modern Photogrammetry; Wiley Online Library: Hoboken, NJ, USA; Chichester, UK, 2001. [Google Scholar]
- Wolf, P.R.; Dewitt, B.A.; Wilkinson, B.E. Elements of Photogrammetry with Application in GIS; McGraw-Hill Education: Berkshire, UK, 1983; Volume 110. [Google Scholar]
- Che, E.; Jung, J.; Olsen, M.J. Object Recognition, Segmentation, and Classification of Mobile Laser Scanning Point Clouds: A State of the Art Review. Sensors 2019, 19, 810. [Google Scholar] [CrossRef] [Green Version]
- Haala, N.; Rothermel, M.; Cavegn, S. Extracting 3D urban models from oblique aerial images. In Proceedings of the 2015 Joint Urban Remote Sensing Event (JURSE), Lausanne, Switzerland, 30 March–1 April 2015; pp. 1–4. [Google Scholar]
- Bechtold, S.; Höfle, B. Helios: A multi-purpose lidar simulation framework for research, planning and training of laser scanning operations with airborne, ground-based mobile and stationary platforms. ISPRS Ann. Photogramm. Remote Sens. Spat. Inf. Sci. 2016, 3, 161–168. [Google Scholar] [CrossRef] [Green Version]
- Zhu, Q.; Li, Y.; Hu, H.; Wu, B. Robust point cloud classification based on multi-level semantic relationships for urban scenes. ISPRS J. Photogramm. Remote. Sens. 2017, 129, 86–102. [Google Scholar] [CrossRef]
- Ni, H.; Lin, X.; Ning, X.; Zhang, J. Edge detection and feature line tracing in 3D-point clouds by analyzing geometric properties of neighborhoods. Remote Sens. 2016, 8, 710. [Google Scholar] [CrossRef] [Green Version]
- Kedzierski, M.; Fryskowska, A. Methods of laser scanning point clouds integration in precise 3D building modelling. Meas. J. Int. Meas. Confed. 2015, 74, 221–232. [Google Scholar] [CrossRef]
- Kersten, T.; Mechelke, K.; Maziull, L. 3D model of Al Zubarah fortress in qatar-Terrestrial laser scanning vs. dense image matching. Int. Arch. Photogramm. Remote. Sens. Spat. Inf. Sci. 2015, 40, 1–8. [Google Scholar] [CrossRef] [Green Version]
- Recky, M.; Leberl, F. Windows detection using K-means in CIE-Lab color space. In Proceedings of the International Conference on Pattern Recognition, Istanbul, Turkey, 23–26 August 2010. [Google Scholar] [CrossRef]
- Wang, Q.; Tan, Y.; Mei, Z. Computational methods of acquisition and processing of 3D point cloud data for construction applications. Arch. Comput. Methods Eng. 2020, 27, 479–499. [Google Scholar] [CrossRef]
- Chen, D.; Zhang, L.; Mathiopoulos, P.T.; Huang, X. A methodology for automated segmentation and reconstruction of urban 3-D buildings from ALS point clouds. IEEE J. Sel. Top. Appl. Earth Obs. Remote Sens. 2014, 7, 4199–4217. [Google Scholar] [CrossRef]
- Vo, A.V.; Truong-Hong, L.; Laefer, D.F.; Bertolotto, M. Octree-based region growing for point cloud segmentation. ISPRS J. Photogramm. Remote Sens. 2015, 104, 88–100. [Google Scholar] [CrossRef]
- Xiao, J.; Adler, B.; Zhang, J.; Zhang, H. Planar segment based three-dimensional point cloud registration in outdoor environments. J. Field Robot. 2013, 30, 552–582. [Google Scholar] [CrossRef]
- Nurunnabi, A.; Belton, D.; West, G. Robust segmentation in laser scanning 3D point cloud data. In Proceedings of the 2012 International Conference on Digital Image Computing Techniques and Applications (DICTA), Fremantle, WA, Australia, 3–5 December 2012; pp. 1–8. [Google Scholar]
- Lu, X.; Yao, J.; Tu, J.; Li, K.; Li, L.; Liu, Y. Pairwise linkage for point cloud segmentation. ISPRS Ann. Photogramm. Remote Sens. Spat. Inf. Sci. 2016, 3, 201–208. [Google Scholar] [CrossRef] [Green Version]
- Xu, Y.; Yao, W.; Tuttas, S.; Hoegner, L.; Stilla, U. Unsupervised segmentation of point clouds from buildings using hierarchical clustering based on gestalt principles. IEEE J. Sel. Top. Appl. Earth Obs. Remote Sens. 2018, 11, 4270–4286. [Google Scholar] [CrossRef]
- Gadde, R.; Jampani, V.; Marlet, R.; Gehler, P.V. Efficient 2D and 3D Facade Segmentation Using Auto-Context. IEEE Trans. Pattern Anal. Mach. Intell. 2018, 40, 1273–1280. [Google Scholar] [CrossRef] [PubMed] [Green Version]
- Roynard, X.; Deschaud, J.E.; Goulette, F. Paris-lille-3d: A point cloud dataset for urban scene segmentation and classification. In Proceedings of the IEEE Conference on Computer Vision and Pattern Recognition Workshops, Salt Lake City, UT, USA, 18–22 June 2018; pp. 2027–2030. [Google Scholar]
- Becker, S.; Haala, N. Integrated LIDAR and image processing for the modelling of building facades. Photogramm. Fernerkund. Geoinf. 2008, 2, 65–81. [Google Scholar]
- Mesolongitis, A.; Stamos, I. Detection of windows in point clouds of urban scenes. In Proceedings of the 2012 IEEE Computer Society Conference on Computer Vision and Pattern Recognition Workshops, Providence, RI, USA, 16–21 June 2012; pp. 17–24. [Google Scholar] [CrossRef] [Green Version]
- Zolanvari, S.M.; Laefer, D.F.; Natanzi, A.S. Three-dimensional building façade segmentation and opening area detection from point clouds. ISPRS J. Photogramm. Remote Sens. 2018, 143, 134–149. [Google Scholar] [CrossRef]
- Pu, S.; Vosselman, G. Knowledge based reconstruction of building models from terrestrial laser scanning data. ISPRS J. Photogramm. Remote Sens. 2009, 64, 575–584. [Google Scholar] [CrossRef]
- Iman Zolanvari, S.M.; Laefer, D.F. Slicing Method for curved façade and window extraction from point clouds. ISPRS J. Photogramm. Remote Sens. 2016, 119, 334–346. [Google Scholar] [CrossRef]
- Truong-Hong, L.; Laefer, D.F.; Hinks, T.; Carr, H. Combining an angle criterion with voxelization and the flying voxel method in reconstructing building models from LiDAR data. Comput.-Aided Civ. Infrastruct. Eng. 2013, 28, 112–129. [Google Scholar] [CrossRef] [Green Version]
- Zhou, M.; Ma, L.; Li, Y.; Li, J. Extraction of building windows from mobile laser scanning point clouds. In Proceedings of the International Geoscience and Remote Sensing Symposium (IGARSS), Valencia, Spain, 22–27 July 2018. [Google Scholar] [CrossRef]
- Pu, S.; Vosselman, G. Extracting windows from terrestrial laser scanning. Intl Arch. Photogramm. Remote Sens. Spat. Inf. Sci. 2007, 36, 12–14. [Google Scholar]
- Li, J.; Xiong, B.; Qin, R.; Gruen, A. A flexible inference machine for global alignment of wall openings. Remote Sens. 2020, 12, 1968. [Google Scholar] [CrossRef]
- Li, J.; Xiong, B.; Biljecki, F.; Schrotter, G. A sliding window method for detecting corners of openings from terrestrial LiDAr data. In International Archives of the Photogrammetry, Remote Sensing and Spatial Information Sciences-ISPRS Archives; ISPRS: Vienna, Austria, 2018; Volume 42. [Google Scholar] [CrossRef] [Green Version]
- Dehbi, Y.; Hadiji, F.; Gröger, G.; Kersting, K.; Plümer, L. Statistical relational learning of grammar rules for 3D building reconstruction. Trans. GIS 2017, 21, 134–150. [Google Scholar] [CrossRef] [Green Version]
- Aijazi, A.K.; Checchin, P.; Trassoudaine, L. Automatic detection and feature estimation of windows for refining building facades in 3D urban point clouds. ISPRS Ann. Photogramm. Remote Sens. Spat. Inf. Sci. 2014, 2, 1–8. [Google Scholar] [CrossRef] [Green Version]
- Friedman, S.; Stamos, I. Online detection of repeated structures in point clouds of urban scenes for compression and registration. Int. J. Comput. Vis. 2013, 102, 112–128. [Google Scholar] [CrossRef]
- Koffka, K. Principles of Gestalt Psychology; Routledge: Oxfordshire, UK, 2013. [Google Scholar]
- Flemming, U. Syntactic Structures in Architecture: Teaching Composition with Computer Assistance; CUMINCAD: 1990. In Proceedings of the CAAD Futures ‘89 Conference, Boston, MA, USA, July 1989; 1990. [Google Scholar]
- Truong-Hong, L.; Laefer, D.F. Octree-based, automatic building facade generation from LiDAR data. Comput.-Aided Des. 2014, 53, 46–61. [Google Scholar] [CrossRef] [Green Version]
- Yang, J.; Shi, Z.K.; Wu, Z.Y. Towards automatic generation of as-built BIM: 3D building facade modeling and material recognition from images. Int. J. Autom. Comput. 2016, 13, 338–349. [Google Scholar] [CrossRef]
- Nguatem, W.; Drauschke, M.; Mayer, H. Localization of Windows and Doors in 3d Point Clouds of Facades. ISPRS Ann. Photogramm. Remote Sens. Spat. Inf. Sci. 2014, 2, 87. [Google Scholar] [CrossRef] [Green Version]
- Maddern, W.; Pascoe, G.; Linegar, C.; Newman, P. 1 Year, 1000km: The Oxford RobotCar Dataset. Int. J. Robot. Res. 2017, 36, 3–15. [Google Scholar] [CrossRef]
- Becker, S.; Haala, N. Combined feature extraction for façade reconstruction. In Proceedings of the ISPRS Workshop Laser Scanning, Espoo, Finland, 12–14 September 2007; pp. 241–247. [Google Scholar]
- Pu, S.; Vosselman, G. Building facade reconstruction by fusing terrestrial laser points and images. Sensors 2009, 9, 4525–4542. [Google Scholar] [CrossRef] [Green Version]
- Rahmani, K.; Mayer, H. High quality facade segmentation based on structured random forest, region proposal network and rectangular fitting. In ISPRS Annals of the Photogrammetry, Remote Sensing and Spatial Information Sciences; ISPRS: Vienna, Austria, 2018; Volume 4. [Google Scholar] [CrossRef] [Green Version]
- Yan, L.; Fan, B.; Liu, H.; Huo, C.; Xiang, S.; Pan, C. Triplet Adversarial Domain Adaptation for Pixel-Level Classification of VHR Remote Sensing Images. IEEE Trans. Geosci. Remote Sens. 2020, 58, 3558–3573. [Google Scholar] [CrossRef]
- Liu, H.; Xu, Y.; Zhang, J.; Zhu, J.; Li, Y.; Hoi, S.C. DeepFacade: A Deep Learning Approach to Facade Parsing with Symmetric Loss. IEEE Trans. Multimed. 2020, 22, 3153–3165. [Google Scholar] [CrossRef]
- Fathalla, R.; Vogiatzis, G. A deep learning pipeline for semantic facade segmentation. In Proceedings of the British Machine Vision Conference 2017, London, UK, 4–7 September 2017. [Google Scholar] [CrossRef]
- Mathias, M.; Martinović, A.; Van Gool, L. ATLAS: A Three-Layered Approach to Facade Parsing. Int. J. Comput. Vis. 2016, 118, 22–48. [Google Scholar] [CrossRef] [Green Version]
- Gadde, R.; Marlet, R.; Paragios, N. Learning Grammars for Architecture-Specific Facade Parsing. Int. J. Comput. Vis. 2016, 117, 290–316. [Google Scholar] [CrossRef] [Green Version]
- Teboul, O.; Kokkinos, I.; Simon, L.; Koutsourakis, P.; Paragios, N. Parsing facades with shape grammars and reinforcement learning. IEEE Trans. Pattern Anal. Mach. Intell. 2013, 35, 1744–1756. [Google Scholar] [CrossRef]
- Riemenschneider, H.; Krispel, U.; Thaller, W.; Donoser, M.; Havemann, S.; Fellner, D.; Bischof, H. Irregular lattices for complex shape grammar facade parsing. In Proceedings of the IEEE Computer Society Conference on Computer Vision and Pattern Recognition, Providence, RI, USA, 16–21 June 2012. [Google Scholar] [CrossRef]
- Martinović, A.; Mathias, M.; Weissenberg, J.; Gool, L.V. A three-layered approach to facade parsing. In European Conference on Computer Vision; Springer: Berlin/Heidelberg, Germany, 2012; pp. 416–429. [Google Scholar]
- Cohen, A.; Schwing, A.G.; Pollefeys, M. Efficient structured parsing of facades using dynamic programming. In Proceedings of the IEEE Conference on Computer Vision and Pattern Recognition, Columbus, OH, USA, 23–28 June 2014; pp. 3206–3213. [Google Scholar]
- Ma, W.; Ma, W.; Xu, S.; Zha, H. Pyramid ALKNet for Semantic Parsing of Building Facade Image. IEEE Geosci. Remote Sens. Lett. 2020, 18, 1009–1013. [Google Scholar] [CrossRef]
- Lotte, R.G.; Haala, N.; Karpina, M.; de Aragão, L.E.O.e.; Shimabukuro, Y.E. 3D façade labeling over complex scenarios: A case study using convolutional neural network and structure-from-motion. Remote Sens. 2018, 10, 1435. [Google Scholar] [CrossRef] [Green Version]
- Kong, G.; Fan, H. Enhanced facade parsing for street-level images using convolutional neural networks. IEEE Trans. Geosci. Remote Sens. 2020, 59, 10519–10531. [Google Scholar] [CrossRef]
- Martinovic, A.; Van Gool, L. Bayesian grammar learning for inverse procedural modeling. In Proceedings of the IEEE Computer Society Conference on Computer Vision and Pattern Recognition, Columbus, OH, USA, 25–27 June 2013. [Google Scholar] [CrossRef] [Green Version]
- Schmitz, M.; Mayer, H. A convolutional network for semantic facade segmentation and interpretation. Int. Arch. Photogramm. Remote Sens. Spat. Inf. Sci. 2016, 41, 709. [Google Scholar] [CrossRef] [Green Version]
- Ma, W.; Xu, S.; Ma, W.; Zha, H. Multiview Feature Aggregation for Facade Parsing. IEEE Geosci. Remote Sens. Lett. 2020, 19, 8003505. [Google Scholar] [CrossRef]
- Nishida, G.; Bousseau, A.; Aliaga, D.G. Procedural modeling of a building from a single image. In Computer Graphics Forum; Wiley Online Library: Hoboken, NJ, USA, 2018; Volume 37, pp. 415–429. [Google Scholar]
- Wu, F.; Yan, D.M.; Dong, W.; Zhang, X.; Wonka, P. Inverse procedural modeling of facade layouts. arXiv 2013, arXiv:1308.0419. [Google Scholar] [CrossRef] [Green Version]
- Teboul, O.; Simon, L.; Koutsourakis, P.; Paragios, N. Segmentation of building facades using procedural shape priors. In Proceedings of the IEEE Computer Society Conference on Computer Vision and Pattern Recognition, San Francisco, CA, USA, 13–18 June 2010. [Google Scholar] [CrossRef]
- Meixner, P.; Leberl, F.; Brédif, M. Interpretation of 2d and 3d building details on facades and roofs. ISPRS-Int. Arch. Photogramm. Remote Sens. Spat. Inf. Sci. 2011, XXXVIII-3/W22, 137–142. [Google Scholar] [CrossRef]
- Neuhausen, M.; Martin, A.; Obel, M.; Mark, P.; König, M. A cascaded classifier approach to window detection in facade images. In Proceedings of the 34th International Symposium on Automation and Robotics in Construction, Taipei, Taiwan, 28 June–1 July 2017. [Google Scholar] [CrossRef] [Green Version]
- Lee, S.C.; Nevatia, R. Extraction and integration of window in a 3D building model from ground view images. In Proceedings of the IEEE Computer Society Conference on Computer Vision and Pattern Recognition, Washington, DC, USA, 27 June–2 July 2004; Volume 2. [Google Scholar] [CrossRef]
- Hu, X.; Noskov, A.; Fan, H.; Novack, T.; Li, H.; Gu, F.; Shang, J.; Zipf, A. Tagging the main entrances of public buildings based on OpenStreetMap and binary imbalanced learning. Int. J. Geogr. Inf. Sci. 2021, 35, 1773–1801. [Google Scholar] [CrossRef]
- Tian, Y.; Yang, X.; Yi, C.; Arditi, A. Toward a computer vision-based wayfinding aid for blind persons to access unfamiliar indoor environments. Mach. Vis. Appl. 2013, 24, 521–535. [Google Scholar] [CrossRef] [PubMed] [Green Version]
- Díaz-Vilariño, L.; Verbree, E.; Zlatanova, S.; Diakité, A. Indoor modelling from SLAM-based laser scanner: Door detection to envelope reconstruction. In International Archives of the Photogrammetry, Remote Sensing and Spatial Information Sciences-ISPRS Archives; ISPRS: Vienna, Austria, 2017; Volume 42. [Google Scholar] [CrossRef] [Green Version]
- Liu, Y.; Liu, J.; Korah, T.; Hedau, V.; Parameswaran, V.; Grzeszczuk, R. Entrance Detection from Street-View Images. In Proceedings of the 27th IEEE Conference on Computer Vision and Pattern Recognition (CVPR), Columbus, OH, USA, 24–27 June 2014. [Google Scholar]
- Kang, J.; Deng, F.; Li, X.; Wan, F. Automatic texture reconstruction of 3d city model from oblique images. Int. Arch. Photogramm. Remote Sens. Spat. Inf. Sci. 2016, 41, 341–347. [Google Scholar] [CrossRef]
- Talebi, M.; Vafaei, A.; Monadjemi, A. Vision-based entrance detection in outdoor scenes. Multimed. Tools Appl. 2018, 77, 26219–26238. [Google Scholar] [CrossRef]
- Kang, S.J.; Trinh, H.H.; Kim, D.N.; Jo, K.H. Entrance detection of buildings using multiple cues. In Lecture Notes in Computer Science (Including Subseries Lecture Notes in Artificial Intelligence and Lecture Notes in Bioinformatics); LNAI; Springer: Berlin/Heidelberg, Germany, 2010; Volume 5990. [Google Scholar]
- Yang, L.; Sheng, Y.; Wang, B. 3D reconstruction of building facade with fused data of terrestrial LiDAR data and optical image. Optik 2016, 127, 2165–2168. [Google Scholar] [CrossRef]
- Lin, D.; Jarzabek-Rychard, M.; Tong, X.; Maas, H.G. Fusion of thermal imagery with point clouds for building façade thermal attribute mapping. ISPRS J. Photogramm. Remote Sens. 2019, 151, 162–175. [Google Scholar] [CrossRef]
- Zhu, J.; Xu, Y.; Hoegner, L.; Stilla, U. Direct co-registration of tir images and mls point clouds by corresponding keypoints. In ISPRS Annals of the Photogrammetry, Remote Sensing and Spatial Information Sciences; ISPRS: Vienna, Austria, 2019; Volume 4. [Google Scholar] [CrossRef] [Green Version]
- Fryskowska, A.; Stachelek, J. A no-reference method of geometric content quality analysis of 3D models generated from laser scanning point clouds for hBIM. J. Cult. Herit. 2018, 34, 95–108. [Google Scholar] [CrossRef]
- Costanzo, A.; Minasi, M.; Casula, G.; Musacchio, M.; Buongiorno, M.F. Combined use of terrestrial laser scanning and IR Thermography applied to a historical building. Sensors 2014, 15, 194–213. [Google Scholar] [CrossRef] [Green Version]
- Jarząbek-Rychard, M.; Lin, D.; Maas, H.G. Supervised detection of façade openings in 3D point clouds with thermal attributes. Remote Sens. 2020, 12, 543. [Google Scholar] [CrossRef] [Green Version]
- Lin, D.; Dong, Z.; Zhang, X.; Maas, H.G. Unsupervised window extraction from photogrammetric point clouds with thermal attributes. ISPRS Ann. Photogramm. Remote Sens. Spat. Inf. Sci. 2019, 4, 45–51. [Google Scholar] [CrossRef] [Green Version]
- Wang, Y.; Ma, Y.; Zhu, A.x.; Zhao, H.; Liao, L. Accurate facade feature extraction method for buildings from three-dimensional point cloud data considering structural information. ISPRS J. Photogramm. Remote Sens. 2018, 139, 146–153. [Google Scholar] [CrossRef]
- Omar, H.; Mahdjoubi, L.; Kheder, G. Towards an automated photogrammetry-based approach for monitoring and controlling construction site activities. Comput. Ind. 2018, 98, 172–182. [Google Scholar] [CrossRef]
- Xie, Y.; Tian, J.; Zhu, X.X. Linking Points with Labels in 3D: A Review of Point Cloud Semantic Segmentation. IEEE Geosci. Remote. Sens. Mag. 2020, 8, 38–59. [Google Scholar] [CrossRef] [Green Version]
- Wysocki, O.; Hoegner, L.; Stilla, U. TUM-FAÇADE: Reviewing and Enriching Point Cloud Benchmarks for FAÇADE Segmentation. Int. Arch. Photogramm. Remote Sens. Spat. Inf. Sci. 2022, 46, 529–536. [Google Scholar] [CrossRef]
- Matrone, F.; Lingua, A.; Pierdicca, R.; Malinverni, E.; Paolanti, M.; Grilli, E.; Remondino, F.; Murtiyoso, A.; Landes, T. A benchmark for large-scale heritage point cloud semantic segmentation. Int. Arch. Photogramm. Remote Sens. Spatial Inf. Sci. 2020, XLIII-B2-2020, 1419–1426. [Google Scholar] [CrossRef]
- Raji, I.D.; Bender, E.M.; Paullada, A.; Denton, E.; Hanna, A. AI and the everything in the whole wide world benchmark. arXiv 2021, arXiv:2111.15366. [Google Scholar]
- Koch, B.; Denton, E.; Hanna, A.; Foster, J.G. Reduced, Reused and Recycled: The Life of a Dataset in Machine Learning Research. arXiv 2021, arXiv:2112.01716. [Google Scholar]
- Nowogrodzki, A. Eleven tips for working with large data sets. Nature 2020, 577, 439–441. [Google Scholar] [CrossRef] [Green Version]
- Liu, K.; Boehm, J. Classification of big point cloud data using cloud computing. ISPRS-Int. Arch. Photogramm. Remote Sens. Spat. Inf. Sci. 2015, 40, 553–557. [Google Scholar] [CrossRef] [Green Version]
- Boehm, J.; Liu, K. NoSQL for storage and retrieval of large LiDAR data collections. ISPRS-Int. Arch. Photogramm. Remote Sens. Spat. Inf. Sci. 2015, 40, 577–582. [Google Scholar] [CrossRef] [Green Version]
- Geyer, J.; Kassahun, Y.; Mahmudi, M.; Ricou, X.; Durgesh, R.; Chung, A.S.; Hauswald, L.; Pham, V.H.; Mühlegg, M.; Dorn, S.; et al. A2D2: Audi Autonomous Driving Dataset. arXiv 2020, arXiv:2004.06320. [Google Scholar]
- Geiger, A.; Lenz, P.; Stiller, C.; Urtasun, R. Vision meets Robotics: The KITTI Dataset. Int. J. Robot. Res. 2013, 32, 1231–1237. [Google Scholar] [CrossRef] [Green Version]
- Huang, X.; Wang, P.; Cheng, X.; Zhou, D.; Geng, Q.; Yang, R. The ApolloScape Open Dataset for Autonomous Driving and Its Application. IEEE Trans. Pattern Anal. Mach. Intell. 2020, 42, 2702–2719. [Google Scholar] [CrossRef] [Green Version]
- Neuhold, G.; Ollmann, T.; Bulo, S.R.; Kontschieder, P. The Mapillary Vistas Dataset for Semantic Understanding of Street Scenes. In Proceedings of the IEEE International Conference on Computer Vision, Venice, Italy, 22–29 October 2017. [Google Scholar] [CrossRef]
- Cordts, M.; Omran, M.; Ramos, S.; Rehfeld, T.; Enzweiler, M.; Benenson, R.; Franke, U.; Roth, S.; Schiele, B. The Cityscapes Dataset for Semantic Urban Scene Understanding. In Proceedings of the IEEE Computer Society Conference on Computer Vision and Pattern Recognition, Las Vegas, NV, USA, 27–30 June 2016. [Google Scholar] [CrossRef] [Green Version]
- Hackel, T.; Savinov, N.; Ladicky, L.; Wegner, J.D.; Schindler, K.; Pollefeys, M. SEMANTIC3D.NET: A new large-scale point cloud classification benchmark. ISPRS Ann. Photogramm. Remote Sens. Spat. Inf. Sci. 2017, IV-1-W1, 91–98. [Google Scholar] [CrossRef] [Green Version]
- Varma, G.; Subramanian, A.; Namboodiri, A.; Chandraker, M.; Jawahar, C. IDD: A dataset for exploring problems of autonomous navigation in unconstrained environments. In Proceedings of the 2019 IEEE Winter Conference on Applications of Computer Vision (WACV), Waikoloa, HI, USA, 7–11 January 2019; pp. 1743–1751. [Google Scholar]
- Korč, F.; Förstner, W. eTRIMS Image Database for Interpreting Images of Man-Made Scenes; Tech. Rep. TR-IGG-P-2009-01t; University of Bonn: Bonn, Germany, 2009. [Google Scholar]
- Riemenschneider, H.; Bódis-Szomorú, A.; Weissenberg, J.; Van Gool, L. Learning where to classify in multi-view semantic segmentation. In Lecture Notes in Computer Science (including subseries Lecture Notes in Artificial Intelligence and Lecture Notes in Bioinformatics); Springer: Berlin/Heidelberg, Germany, 2014; Volume 8436. [Google Scholar] [CrossRef]
- Tyleček, R.; Šára, R. Spatial pattern templates for recognition of objects with regular structure. In Lecture Notes in Computer Science (including subseries Lecture Notes in Artificial Intelligence and Lecture Notes in Bioinformatics); Springer: Berlin/Heidelberg, Germany, 2013; Volume 8142, pp. 364–374. [Google Scholar]
- Yu, F.; Chen, H.; Wang, X.; Xian, W.; Chen, Y.; Liu, F.; Madhavan, V.; Darrell, T. Bdd100k: A diverse driving dataset for heterogeneous multitask learning. In Proceedings of the IEEE/CVF Conference on Computer Vision and Pattern Recognition, Seattle, WA, USA, 13–19 June 2020; pp. 2636–2645. [Google Scholar]


| Review Section | Questions and Example |
|---|---|
| Section 3: Applications | What are the applications that could benefit from more detailed 3D building model? For example, solar potential estimation, building information modelling and energy analysis. |
| Section 4: Platforms | What measurement technology is used? What strategy can deliver reliable and suitable data for façade opening extraction? For example, airborne, ground level, mobile and static platforms. Are there any emerging technologies? Handheld, mobile phones and volunteered geography information. |
| Section 5: Data types ∖representation | What are the advantages and disadvantages of data used for façade opening extraction? What are the challenges of existing methods? For example, what characteristics of range-based and image-based data should be considered when extracting façade openings. |
| Section 6: Scene interpretations | How is the data processed? For example, analysis of point cloud density for façade opening extraction. Machine learning capabilities for façade opening extraction. What are the benefits of data fusion? |
| Method | Advantages | Disadvantages | Examples |
|---|---|---|---|
| Model-based | Resilience to outliers and noise | Computationally expensive, time-consuming, high memory consumption, difficulties with reconstruction of objects for which there are no mathematical expressions | [90] |
| Region-growing | Good preservation of edges and boundaries of surfaces and artifacts | Sensitive to outliers and noise, over segmentation | [91,92,93] |
| Clustering-based | Easy to implement, no need for setting of seeds | Over and under segmentation, high computational costs, points on the edges may meet the requirements of more than one cluster | [94,95] |
| Method | Advantages | Disadvantages | Examples |
|---|---|---|---|
| Hole-based | The assumption that windows are an integral part of the façade reduces the search area | Depends on point cloud density, misclassification due to occlusion holes, points reflected from curtains may be similar to those reflected from wall causing difficulties in distinguishing façade openings, high-density point cloud require more data storage | [100,101,102,103,104,105,106,113,114] |
| Rule-symmetry-based | Successful with low resolution data, allows detection from partially missing data | Necessary user intervention to create rules, high reliability on symmetry and rules, difficulties with application for non-symmetrical façade types | [9,73,107,108,115] |
| Method | Advantages | Disadvantages | Examples |
|---|---|---|---|
| Bottom-up | Better performance compared to rule-based methods [131], less prior-knowledge necessary | Susceptible to changes in lighting, irregular shape of the output (e.d., edges are not straight lines), occlusion hinders precise segmentation, lack of diverse training datasets | [53,100,101,102,104,106,113,114,119,130,131,133,134,135] |
| Top-down | Higher prediction of façade element’s location, better structure of detected façade elements | Rely on strong prior knowledge, difficulties in applying rules for one architectural style to other, lack of flexibility when facade is changed | [124,125,126,132,136] |
| Multimodal Sensor | |||||||
|---|---|---|---|---|---|---|---|
| Platform | Position (GPS, IMU) | LiDAR | Cameras | Building | Openings | Objects | |
| A2D2 Geyer et al. [165] | t.m. | Yes | Yes | Yes | Yes | No | 3D, 2D |
| KITTI Geiger et al. [166] | t.m. | Yes | Yes | Yes | Yes | No | 3D, 2D |
| Apollo Space Huang et al. [167] | t.m. | Yes | Yes | Yes | Yes | No | 3D, 2D |
| Mapilliary Neuhold et al. [168] | t.m. | Yes | Yes | Yes | Yes | No | 3D, 2D |
| CityScape Cordts et al. [169] | t.m. | Yes | Yes | Yes | Yes | No | 3D, 2D |
| TUM-FACADE [158] | t.m. | No | Yes | No | Yes | Yes | 3D |
| Semantic3D [170] | t.s. | Yes | Yes | No | Yes | Yes | 3D |
| IDD: India Driving Dataset Varma et al. [171] | t.m. | Yes | Yes | Yes | Yes | No | 3D,2D |
| Single sensor | |||||||
| eTRIMS Korč and Förstner [172] | t.s. | No | No | Yes | Yes | Yes | 2D |
| RueMonge Riemenschneider et al. [173] | t.s. | No | No | Yes | Yes | Yes | 2D |
| CMP Tyleček and Šára [174] | t.s. | No | No | Yes | Yes | Yes | 2D |
| BDD100K Yu at al. [175] | t.m. | Yes | No | Yes | Yes | No | 2D |
Publisher’s Note: MDPI stays neutral with regard to jurisdictional claims in published maps and institutional affiliations. |
© 2022 by the authors. Licensee MDPI, Basel, Switzerland. This article is an open access article distributed under the terms and conditions of the Creative Commons Attribution (CC BY) license (https://creativecommons.org/licenses/by/4.0/).
Share and Cite
Klimkowska, A.; Cavazzi, S.; Leach, R.; Grebby, S. Detailed Three-Dimensional Building Façade Reconstruction: A Review on Applications, Data and Technologies. Remote Sens. 2022, 14, 2579. https://doi.org/10.3390/rs14112579
Klimkowska A, Cavazzi S, Leach R, Grebby S. Detailed Three-Dimensional Building Façade Reconstruction: A Review on Applications, Data and Technologies. Remote Sensing. 2022; 14(11):2579. https://doi.org/10.3390/rs14112579
Chicago/Turabian StyleKlimkowska, Anna, Stefano Cavazzi, Richard Leach, and Stephen Grebby. 2022. "Detailed Three-Dimensional Building Façade Reconstruction: A Review on Applications, Data and Technologies" Remote Sensing 14, no. 11: 2579. https://doi.org/10.3390/rs14112579