Article

Alpine Grassland Reviving Response to Seasonal Snow Cover on the Tibetan Plateau

State Key Laboratory of Grassland Agro-Ecosystems, Ministry of Agriculture, College of Pastoral Agriculture Science and Technology, Lanzhou University, Lanzhou 730020, China
*
Author to whom correspondence should be addressed.
Remote Sens. 2022, 14(10), 2499; https://doi.org/10.3390/rs14102499
Submission received: 15 April 2022 / Revised: 20 May 2022 / Accepted: 21 May 2022 / Published: 23 May 2022
(This article belongs to the Special Issue Remote Sensing for Mountain Vegetation and Snow Cover)

Abstract

:
Season snow cover plays an important role in vegetation growth in alpine regions. In this study, we analyzed the spatial and temporal variations in seasonal snow cover and the start of the growing season (SOS) of alpine grasslands and preliminarily studied the mechanism by which snow cover affects SOS changes by modifying the soil temperature (ST) and soil moisture (SM) in spring. The results showed that significant interannual trends in the SOS, snow end date (SED), snow cover days (SCD), ST, and SM existed over the Tibetan Plateau (TP) in China from 2000 to 2020. The SOS advanced by 2.0 d/10 a over the TP over this period. Moreover, the SOS showed advancing trends in the eastern and central parts of the TP and a delayed trend in the west. The SED and SCD exhibited an advancing trend and a decreasing trend in high-elevation areas, respectively, and the opposite trends in low-elevation areas. The ST showed a decreasing trend in low-elevation areas and an increasing trend in high-elevation areas. The SM tended to increase in most areas. The effects of the seasonal snow cover on the ST and SM indirectly influenced the SOS of alpine grasslands. The delayed SEDs and more SCD observed herein could provide increasingly wet soil conditions optimal for the advancement of the SOS, while less snow and shorter snow seasons could delay the SOS of alpine grasslands on the TP.

1. Introduction

Vegetation phenology refers to the annual recurrence of vegetation growth during the life cycle of vegetation; this pattern is influenced by changes in the seasonal climate conditions and other environmental factors [1,2]. As a macroscopic and integrated representation of seasonal vegetation turnover, vegetation phenology can characterize the combined effects of environmental changes on plant life processes over time and is a key parameter used to monitor the response mechanisms of biological processes to global climate change [3]. Vegetation phenology affects the seasonal changes in biogeochemical cycling and biophysical properties through factors such as the reflectance, surface roughness, canopy conductivity, moisture, energy, CO2, and biogenic volatile organic matter [4,5,6].
Currently, global warming is an unignorably environmental issue that will continue in the coming decades [7]. Since 1860, the global average temperature has reportedly increased by nearly 1.0 °C [8,9], and this trend is more pronounced in high-latitude and high-elevation areas. The Tibetan Plateau (TP) warmed by approximately 0.4 °C/10 a (°C/10 a means a temperature change over 10 years) from 1981 to 2011, almost twice the average rate of global warming [10]. Vegetation phenology is regarded as the most intuitive and sensitive integrated indicator of global climate change and is also an important observable indicator of the responses of ecosystems to climate change, which, in turn, determine the behavior of land surface carbon fluxes [11]. The sensitivity of vegetation phenology to climate change is more pronounced and observable in alpine regions than in low-elevation regions [12,13]. Dynamic variations in vegetation phenology affect the carbon balance, water flux, energy balance, and, thus, climate change at the regional and global levels [14,15,16]. Since the 1960s, based on both satellite-derived and ground-based observations, advancing trends in the start of the growing season (SOS) have been observed in Europe, North America, and Asia [17]. These advancing trends vary among different study areas, study periods, and plant species. For example, Zhou et al. [18] found that the SOS advanced by 4.6 and 5.3 d/10 a from 1982 to 1997 in Eurasia and North America, respectively. It was also revealed that the SOS advanced by 5.4 d/10 a in Europe from 1982 to 2001 [19] and by 6.6 d/10 a in North America from 1985 to 1999 [20]. Across Asia, the SOS advanced by 3.9 d/10 a from 1982 to 2000 in East Asia [21] and by 7.9 d/10 a from 1982 to 1999 in temperate China [17]. However, the SOS has exhibited a slow advance since the beginning of the 21st century. Jeong et al. [21] found that in the Northern Hemisphere, the SOS advanced by 3.1 d/10 a from 1982 to 1999 but by only 0.1 d/10 a from 2000 to 2008. Meanwhile, in China, the SOS advanced by 12.4 d/10 a from 1982 to 1999 but by only 0.2 d/10 a from 2000 to 2011 [22]. Overall, the SOS advanced weakly by 2.2 d/10 a in the region of the Northern Hemisphere above 40°N from 1982 to 2013 [13].
As an important component of Earth’s surface elements and the global climate system, snow cover is highly sensitive to global climate change. The extent, depth, and duration of seasonal snow cover profoundly affect climatological, hydrological, ecological, and anthropogenic processes by controlling the surface hydrothermal balance at regional and global scales [23]. In particular, snow cover critically affects permafrost degradation, the vegetation greening rate, spring carbon uptake, and vegetation growth dynamics in relatively cold regions where snow dominates [3]. Winter snow impacts the SOSs of grasslands and shrubs more severely than other vegetation types [24]. Changes in snow cover affect the SOS by influencing the soil moisture (SM), soil–air heat exchange, soil microbial activity, and soil organic matter transformation. In winter, the presence and extent of snow cover also prevent low temperatures and wind damage from affecting vegetation, thus ensuring the overwinter survival of vegetation [25]; in addition, the thermal insulation and moisture retention effects of snow cover can create optimal microbial living environments which benefit the soil organic matter convert to nutrients efficiently [26]. In spring, snowmelt prevents drought and is the main contributor to SM during the SOS period [27,28]. The accumulation of vegetation biomass depends on this initial water storage content [29]. It has been shown that in most areas on the TP, the increased number of snow-covered days (SCD) is the main factor contributing to the advancement of the SOS and the prolongation of the growing season; in addition, both the SCD and snow end date (SED) are significantly and positively correlated with the maximum normalized difference vegetation index (NDVImax) [30]. The snow cover extent has an important effect on vegetation photosynthesis during the growing season of alpine grasslands on the TP [31]. Studies have also quantitatively compared the relative effects of snow cover and climatic variables as drivers on the SOS. For example, Asam et al. [32] found that SCD had the greatest influence on the monthly mean NDVI in the Alps when climate variables were considered, followed by the mean temperature and solar radiation.
In summary, previous studies have revealed that snow cover plays an important role in vegetation growth and have found that snow cover can affect vegetation growth as well as the SOS in various snow-dominated regions. However, the response mechanism of vegetation growth to seasonal snow cover is still unclear. In fact, as snow cover affects the soil temperature (ST) and SM in spring, which then affect vegetation growth, the effect of snow cover on vegetation growth is actually indirect. In this paper, the spatial and temporal dynamics of seasonal snow cover and the SOS of alpine grasslands on the TP are first analyzed, and then the influences of snow cover on the springtime ST and SM are analyzed with the ultimate goal of revealing the response mechanism by which the seasonal snow cover affects the SOS of alpine grasslands on the TP.

2. Study Area and Data

2.1. Study Area

The TP is located in southwestern China and spans from 76°–104°E and from 25°–40°N [33], with a length of 2800 km from east to west and a width of approximately 300–1500 km from north to south, covering an overall area of approximately 2.6 × 10⁶ km2 [34]. Due to the large elevation gradient and complex topography on the TP, the plateau is rich in vegetation types and contains a wide range of plant species. The TP vegetation exhibits obvious horizontal and vertical zonal distribution patterns from southeast to northwest, varying from forests, scrublands, meadows, and grasslands to deserts [35]. Grasslands compose the main vegetation type on the TP and account for 62.2% of its total area (Figure 1b). The TP is rich in snow, and snowmelt plays an important role in regulating river runoff and in ensuring the water supply of western China; because of this, the TP is known as the “Asian Water Tower” [33,35]. The TP is one of the most sensitive ecosystems to global changes; because of its unique geographical features and low level of human interference, it is an ideal area for studying the response mechanisms of spatial and temporal alpine grassland phenology heterogeneities to seasonal snow cover changes [36,37].

2.2. Data

2.2.1. Vegetation Index Data

Moderate-resolution Imaging Spectroradiometer (MODIS) normalized difference vegetation index (NDVI) data were obtained from the MOD13Q1 V006 dataset released by the United States Geological Survey (USGS; https://lpdaac.usgs.gov/products/mod13q1v006/, accessed on 2 April 2021) at a temporal resolution of 16 d, a spatial resolution of 500 m, and a temporal range of 28 February 2000 to 31 December 2020. These data were preprocessed through stitching and reprojection steps and used to extract the SOS of alpine grasslands on the TP.

2.2.2. Snow Cover Data

The utilized MODIS daily cloud-free snow cover dataset was obtained from the National Cryosphere Desert Data Center (http://www.ncdc.ac.cn, accessed on 8 April 2021). This dataset was based on two MODIS reflectance products, MOD/MYD09GA, and a multi-index snow cover mapping algorithm was developed in consideration of different land cover types to improve the identification accuracy of snow-covered areas in forests and mountainous regions. Moreover, the hidden Markov random field (HMRF) algorithm and multisource data fusion method were used to remove clouds from the daily snow cover products. The reported overall accuracy of this dataset was above 93% [38], confirming that this dataset can be used in snow cover change analyses with high credibility.

2.2.3. Soil Temperature and Moisture Data

Daily soil temperature data were obtained from the National Tibetan Plateau Data Center (TPDC; http://data.tpdc.ac.cn/en, accessed on 17 October 2021) at a temporal resolution of twice daily, divided into daytime and nighttime data, and a spatial resolution of 1 km from 2000–2020; this dataset covered the spatial range from 72°E–104°E and from 20°N–45°N and contained values in units of 0.01 K. A novel surface temperature time decomposition model was used to produce the daily soil temperature products, with input data such as Aqua MODIS ST products, GLDAS, and auxiliary data. The dataset is spatially seamless with good image quality and accuracy. Using MODIS ST as a reference, the mean bias error and the standard deviation of this dataset are 0.08–0.16 K and 1.12–1.46 K, respectively [39].
Monthly SM data were also obtained from the TPDC at a monthly temporal resolution, a 0.05° spatial resolution, a spatial range of 72°E–142°E and 16°N–56°N, and a temporal range of July 2002 to December 2018 (these data were in m3/m3). The SM dataset is a fusion of products and composited the Microwave Scanning Radiometer-Earth Observing System (AMSR-E), the Advanced Microwave Scanning Radiometer 2 (AMSR2), and the Soil Moisture and Ocean Salinity (SMOS) mission soil moisture products. To overcome the deficiencies of the passive microwave SM products with low resolution, the dataset is constructed using a spatially weighted decomposition algorithm to generate the 0.05° spatial resolution product. The SM products were consistent with the in situ measurements (R > 0.78, RMSE < 0.05 m3/m3), confirming the good accuracy throughout the time series [40].
For this study, the units of the SM data were first converted to K; then, the STs were calculated by taking the average value between the daytime and nighttime data. Then, the springtime ST and SM values were calculated (from March to May of the Julian year) over the TP.

2.2.4. Auxiliary Data

The 3572 samples utilized herein were all collected from field sampling sites in TP grasslands from 2003 to 2019, of which 1338 samples were from Xia et al. [41]. The locations of these sampling sites on the TP are shown in Figure 1. The samples were used in this study to ensure the reliability of the correlation analysis results derived between snow cover and grassland phenology to avoid uncertainties caused by land cover type map misclassifications.

3. Methods

3.1. Start of Growing Season (SOS)

Although MOD13Q1 is already a time series product after the noise removal step and 16 d synthesis process; residual fluctuations and noise still exist in these data due to the presence of clouds and atmospheric, sensor, and surface reflectivity. Therefore, in this study, smooth NDVI variation curves were obtained using the Savitzky–Golay filtering algorithm (S–G) with a filter window size of 4 [42,43]. Then, the dynamic threshold method [44,45] with a threshold value of 0.2 was used to extract the SOS of alpine grasslands on the TP [46,47].

3.2. Snow Melting Period Extraction

The hydrological year spans from September 1 of a given year to August 31 of the following year; in this study, the analyzed time range is 2000 to 2020, covering a total of 20 snow seasons. Based on daily cloud-free snow cover data, the snow end date (SED) and snow-covered days (SCD) were calculated according to the algorithm proposed by [48]. The utilized formulas are as follows:
SED = FdSCDFd
SCD = i = 1 n S i  
where Fd is the fixed date of March 1, S C D F d denotes the SCD after March 1, n is the number of days, and   S i is 0 or 1 corresponding to a nonsnow covered area or a snow covered area, respectively.

3.3. Tendency and Impact Analyses

Currently, slope trend analysis is the most commonly used method for visually exploring the temporal and spatial trends of SOS, SED, SCD, ST, and SM. The relevant formula is as follows:
Slope = n i = 1 n ( i × y ) i = 1 n i i = 1 n y n i = 1 n i 2 ( i = 1 n i ) 2
where Slope is the trend of the variable; y is the SOS, SED, SCD, ST, or SM value in year i ; i is the annual variable varying from 1 to n, and n is the number of years.
To further determine the degree of interannual variation of each variable, F tests were performed on the slope variation trends to determine whether these trends were significant at the 95% confidence level. The corresponding formula is as follows:
F = ( n 2 ) i 1 n ( y ˆ i y ¯ ) 2 i 1 n ( y i y ˆ i ) 2
where i is the number of years, y i is the SOS, SED, SCD ST, or SM value in year i, y ˆ i is the fitted value, and y ¯ is the average SOS, SED, SCD, ST, or SM value.
Pearson correlation analyses are usually used to measure linear correlations between two variables. In this study, this method was used to analyze the correlations between snow cover changes and the ST and between snow cover changes and the SM as well as the relationship between the ST/SM and alpine grassland phenology on the TP. The formula is as follows:
r = i = 1 n ( x i x ¯ ) ( y i y ¯ ) i = 1 n ( x i x ¯ ) 2 i = 1 n ( y i y ¯ ) 2
where r is the correlation coefficient, x i is the SOS, SED, or SCD value in the corresponding year i, y i indicates the ST/SM/snow accumulation variable, x ¯ and y ¯ are the means of the corresponding variables in the corresponding year, and n is the number of years. The Pearson correlation coefficient varies from −1 ≤   r ≤ 1, and r values > 0 indicate positive correlations between variables, while r values < 0 indicate negative correlations between variables. The larger the absolute value of r is, the stronger the correlation is, while the closer to 0 the value is, the weaker the correlation is. An r value equal to 0 indicates that no linear correlation exists between the analyzed variables.

4. Results

4.1. Intra-Annual Variations in Snow Cover Extent (SCE), NDVI, ST, and SM

Figure 2 shows the intra-annual variations in NDVI, snow cover extent (SCE), ST, and SM on the TP from 2000 to 2020. The annual mean NDVI had a minimum value on February 18 and then rose rapidly after April, reaching a maximum value of 0.6 on July 27 in the alpine grasslands; then, it began to decline gradually. The lowest NDVI value appeared during the period corresponding to the maximum SCE in mid-February. With the gradual decrease in SCE, the NDVI started to increase. The NDVI reached a maximum in July at the peak grass-growing stage, when SCE was the smallest. The snow cover began to accumulate gradually in September. With increasing SCE, the NDVI began to decline rapidly, and the end of the growing season was recorded around mid-October.
The minimum ST of 266.7 K appeared on January 11 and then began to rise gradually; on March 9, the soil temperature rose above the freezing point, and on July 26, the maximum soil temperature reached 286.7 K. Then, the ST began to decline gradually, falling below freezing on November 14. The annual average SM in January was 0.05 m3/m3, after which it increased slowly. Then, the SM increased slowly, possibly due to the increased soil water content caused by melting snow. The SM increased rapidly in May, mainly supplemented by liquid precipitation and thawing permafrost, and the grasslands gradually turned green, thus enhancing the soil water holding capacity [49]. The SM reached a maximum value of 0.2 m3/m3 in July and then gradually decreased. After September, the SM decreased rapidly, likely due to the increased SCE. Then, the ST gradually dropped to the freezing point, and the SM declined sharply to the minimum value of 0.05 m3/m3 in December.
In summary, there was good consistency among the changes in snow cover, ST, and SM, as well as the intra-annual changes in alpine grassland. In general, as snow melted, the reduction in SCE promoted the absorption of solar radiation energy by the land surface, the ST started to rise, the soil thawed, and the SM started to increase, thus providing suitable hydrothermal conditions for grassland growth.

4.2. Spatiotemporal Dynamics and Tendencies

4.2.1. Snow Cover

Snow cover affects the SOS of alpine grasslands through the influences of snowmelt amount and timing variations. In this study, the SED and SCD were used to analyze the effects of snow cover on the SOS of alpine grasslands. Figure 3 shows that the pattern and trends of SED and SCD exhibited obvious spatial heterogeneity on the TP from 2000 to 2020. The annual SED ranged from March 1 to August 31, with an average SED of March 27. The SED showed a clear vertical zonal distribution and was gradually delayed as the elevation gradient rose. In addition, there was no obvious snowmelt date in high-mountain areas, such as the Karakoram, Kunlun, Himalayas, and Nyingchi Tanggula, as these areas have permanent snow cover. The SED was delayed by 1.2 d/10 a on average over 21 years on the TP. Almost 61.0% of the study regions showed trends of delayed SEDs, and significant delays accounted for 8.3% of these, most of which were distributed on the Pamir Plateau, in the Qilian Mountains, in the Bayankara Mountains, and in the Himalayas and Gangdis Mountains. The areas with advancing SED trends accounted for 38.8% of the region, mainly on the northwestern plateau in Ngari Prefecture, in the Arjinshan Mountains, Nyingchi Tanggula, and in the southern part of the Hengduan Mountains. Areas with significant SED advancement accounted for only 0.9% of the study region, and these locations were mainly in the Karakorum Mountains and in the southern part of the Hengduan Mountains.
Combined with the spatial distribution of elevation (Figure 1a), the SCD showed an increasing trend with increasing elevation on TP (Figure 3c). The average SCD on the TP from September to April in the hydrological year ranged from 0 to 242 d, with an average value of 54.8 d. The Karakorum, Kunlun, Qilian, Himalaya, and Hengduan Mountains were the areas with the highest SCDs, and some high-mountain areas were covered with snow all year round. Relatively small SCD values were distributed in the hinterlands and the northern Qaidam Basin due to the low water vapor inputs in these regions caused by high-mountain obstructions. SCD increased by 2.2 d/10 a from 2000 to 2020 on the TP. A total of 39.3% of the TP showed a decreasing SCD trend, with 1.38% decreasing significantly, mainly in the southern part of the Hengduan Mountains and the Karakorum Mountains. The SCD in 59.0% of the study area showed an increasing trend, of which 4.7% increased significantly. The regions with decreasing SCDs largely overlapped with the regions with advancing SEDs on the plateau, while areas with increasing SCDs largely overlapped with those with delayed SEDs. The results showed that snow cover changes on the TP exhibited spatial distribution patterns with two scenarios corresponding to increased or decreased snow cover, the spatial distributions of these patterns were basically stable, and the proportions of both were also the same. Overall, the SED in the central and southern parts of the plateau had been delayed over the past 20 years, while SCD has been increasing. In the other regions, the SED has advanced, while the SCD has been reduced.

4.2.2. Start of the Growing Season (SOS)

The spatial distribution characteristics of the SOS of alpine grasslands on the TP were consistent with the elevation and hydrothermal conditions described above and showed a gradual delayed trend from southeast to northwest (Figure 4). The annual average SOS ranged from the 89th day to the 192nd day, with an average value of the 127th day (early May) of the Julian year from 2000 to 2020. A total of 78.1% of the regions entered the greening period before June. The earliest SOS dates were observed in the eastern valley region, especially in Aba Prefecture of Sichuan Province, where the average SOS occurred on approximately April 10. The latest SOS dates were observed after June on the southwestern TP, especially along the northern Himalayas. The interannual SOS variation showed significant spatial differences on the TP over 21 years. In general, the early SOSs observed in the northeast were more extensive than those in the south, while delayed SOSs were found mainly in the relatively high-elevation areas of the southwestern region. Among the 65.4% of TP that exhibited advancing SOS trends, approximately 4.9% showed significant advances (p < 0.05), mainly in the Yellow River source area, with an average advance of 4.9 d/10 a; the maximum advancing rate reached 5.2 d/10 a (p < 0.05). Approximately 34.6% of the TP showed a delayed SOSs, with extremely small areas exhibiting significant delays. Overall, the average SOS over the TP advanced by 2.1 d/10 a from 2000 to 2020. Moreover, compared to the two different scenarios of SED and SCD, the regions with delayed SEDs and increased SCDs on TP, the SOS basically showed advanced trend. In contrast, SOS tended to delay in areas where the SEDs advanced and SCD decreased.

4.2.3. Soil Temperature and Moisture

The average springtime ST on the TP was approximately 275.1 K. Some extremely high mountainous areas in the Karakorum Mountains and the Nyingchi Tanggula Range had low ST values, while the Qaidam Basin and southern Tibetan areas had relatively high ST values (Figure 5a). The ST increased by 0.9 K/10 a on the TP from 2000 to 2020. The areas with increasing ST trends accounted for 60.9% of the whole plateau, of which the ST increased significantly in 0.6% (p < 0.05), mainly distributed in the northern Karakorum Mountains and the southern foothills of the Himalayas with increasing trends of >0.5 K/10 a. On the northern TP, in the Himalayas, the Gangdis Mountains, and the Yellow River source area, areas with decreasing ST trends accounted for 38.2% of the study area. However, only part of southeastern Tibet exhibited significant decreases, accounting for approximately 0.3%. Comparing the spatial and temporal changes in SED and SCD, regions with delayed SEDs and increased SCDs on the TP were found to have had lower STs (Figure 5b). In contrast, STs tended to increase in areas where the SEDs occurred earlier and the SCD decreased. This finding indicated that the amount of snow cover directly affected the ST. The ST was relatively low in areas with more and longer-lasting snow cover, and vice versa.
The annual average SM ranged from 0.04 to 0.19 m3/m3 on the TP from 2003 to 2018, with an average value of 0.07 m3/m3. The SM was relatively high around water bodies, such as the Qinghai Lake basin and the Yellow River source area, with an SM of approximately 0.17 m3/m3, and was also relatively high in the Three Rivers source region, with an average SM of approximately 0.09 m3/m3 (Figure 5c). The SM increased by 0.0115 (m3/m3)/10 a on the TP from 2003 to 2018 (p < 0.05). The SM tended to increase in 90.3% of the TP in spring, of which 58.6% of regions exhibited significant increases (p < 0.05). Areas with decreasing SM trends were mainly distributed around watersheds, in the Arjinshan, and in the Qaidam Basin, accounting for 8.4% of the study area (Figure 5d). Most areas with significantly increasing SM were located in regions with advancing SEDs and decreasing SCDs. This result indicated that SED advancement directly leads to regional SM increases. The SM increases were not significant in areas with increased SCD and delayed SEDs due to the lack of replenished SM over time. However, this finding may have also been caused by the thawing of permafrost caused by rising surface temperatures, which would further increase the SM content [49].

4.3. SOS Response to Snow Cover, Soil Moisture, and Temperature

Regions with increased SCD were associated with decreased ST and increased SM, and delayed SED was associated with decreased STs and increased SM, respectively. The SOS in these regions showed overall advancement. In contrast, in regions with reduced SCD and earlier SED, the ST increased and the SM increased significantly, while the SOS basically showed delayed tendencies in spatial. This result suggested that SCD and SED variations might lead to changes in regional ST and SM, thus inducing SOS alteration in alpine grasslands. The interaction of several effects need further validation.
Figure 6 shows that the Pearson correlation coefficients derived among the SOS, SED, SCD, ST, and SM were all highly significant (p < 0.001). These results indicated that the SED and SCD were both significantly negatively correlated with the ST, suggesting that fewer SCD and earlier SEDs contributed to the increased STs, while more SCD and later SEDs inhibited soil warming. The SED was negatively correlated with the SM, and SCD was positively correlated with the SM, respectively. This result indicated that the more SCD there were, the earlier the SED occurred, and the more snowmelt water replenished the soil in spring, thus increasing the SM. Negative correlations were found between SOS and ST and between SOS and SM, indicating that relatively high STs and SMs promoted SOS advancement, and vice versa.
In summary, more snow and the delay of melting time will inhibit the rise of ST but can provide enough SM to promote the alpine grassland to turn green in advance; the reduction of snow cover and the advance of melting will lead to the delay of SOS, because although less snow cover will promote the rise of soil temperature, the impact on SM is relatively complex, and the result of the impact is completely opposite. This process still needs to supplement the precipitation and temperature data in these areas for further verification. These findings again confirmed that the amount of snow and the melting timing were the main factors causing ST and SM changes and subsequently leading to changes in the SOS of alpine grasslands.

5. Discussion

The spatial distribution of snow cover showed vertical zonal distribution characteristics on the TP. More and longer-term snow cover was found in high-elevation mountainous areas where the SEDs advanced and the SCD decreased from 2000 to 2020. In low-elevation areas, the snow cover ranged from accumulation to complete melting throughout the course of a hydrological year, and alpine grasslands are widely distributed in these regions. Previous studies revealed that the increased SCD and delayed SEDs contributed to earlier SOSs, while the decreased SCD on the western TP promoted the delay of the SOS [50,51,52]. Those conclusions are consistent with the founding of this paper.
However, past studies mainly focused on the effects of snow on the SOS on the TP but did not reveal the mechanism by which snow affects other environmental factors, such as the ST or SM, thus indirectly influencing the SOS. It is well known that the presence of snow protects newborn seedlings in the spring when the vegetation conditions are suitable for sprouting and growth [53]. Snowmelt plays an important role in affecting the SM [54], and the bare ground exposed following snowmelt is warmed by the absorption of solar radiation [55]. Thus, the hydrothermal conditions during the SOS period are important factors affecting vegetation emergence and growth [56]. Thus, the purpose of this study, which was based on the premise that snow cover plays an important role in affecting the SOS of alpine grasslands, was to further reveal the effects that snow cover has on the SOS by influencing soil hydrothermal conditions.
In this study, we found that SCD reductions and advanced SEDs provided a more suitable soil hydrothermal environment for forage germination and growth. This was because the amount of snow cover affected the absorption of solar radiation energy at the land surface. In areas with relatively low snow cover and significant decreasing snow cover trends, the land surface could absorb more energy, thus prompting the ST to rise and, in turn, leading to advanced permafrost melting, increased SM, and, finally, an advanced SOS [49]. SOS trends may vary depending on the local plant community and the ecogeographic zone as the TP has complex topography, a large elevation gradient, and a wide range of plant species [57]. Yi et al. [58] found that the interaction mechanism between multiyear permafrost and alpine grassland changes varied greatly from region to region. In this variable climate system, the causes of SOS changes on the TP are complex [59]. Therefore, the generalizability of this effect of snow cover on the SOS by altering the ST and SM needs further study and verification in other regions on the TP.
We found that a single factor influencing an SOS change could also act in conjunction with other factors or by influencing other environmental factors. In this study, we found that snow affected the SOS by affecting the ST and SM conditions in spring. There are many other ways in which snow affects SOS through the ST and SM. For example, the effect of cold-season snow on the subsurface ST is one way by which snow affects SOS changes via the soil environment. Yu et al. [24] found that the winter and spring snow depths combined to affect vegetation growth by regulating the ST. In addition, the effect of snow cover through ST and SM changes on the SOS may also be influenced by climate warming. In other words, snow cover and climate factors interact to influence the SOS. Hoye et al. [60] found that the average temperature during the snowmelt period together with the average temperature during the period following snowmelt, but before the SOS, influenced the dynamics of the SOS in the Arctic. Furthermore, increased SMs resulting from snowmelt are accompanied by corresponding increases in evaporation, which in turn might cause precipitation to increase and the air temperature to decrease [61,62]. This persistent effect of snow cover on precipitation and air temperature conditions moderated through the soil may also affect the SOS.
In this study, we found that the snow cover influenced SOS changes by increasing the SM, and this process was complemented by snow melt and the thawing of permafrost. In addition, the occurrence of spring rain/snow events also critically impacts SM changes. Brandt et al. [63] found that rain–snow events penetrated the soil more quickly than snowmelt water because of the closer connections among spring rain, snow, and soil. In this study, the average SED in the sampled area was March 10. Most of the study area experienced snow season termination before April. Therefore, we speculate that the primary source of SM is snowmelt water, while the effect of overall spring precipitation may also contribute to the SM.

6. Conclusions

In this paper, the dynamics of vegetation revival, snow cover, SM, and ST in alpine grasslands in TP were examined from 2000 to 2020. By analyzing the effect of the seasonal snow cover on the soil hydrothermal conditions in spring, we clarified that there is a certain relationship between seasonal snow cover and SOS of alpine grassland, and the snow cover affects the SOS by affecting the soil temperature and moisture in spring. The main conclusions are summarized as follows:
(1)
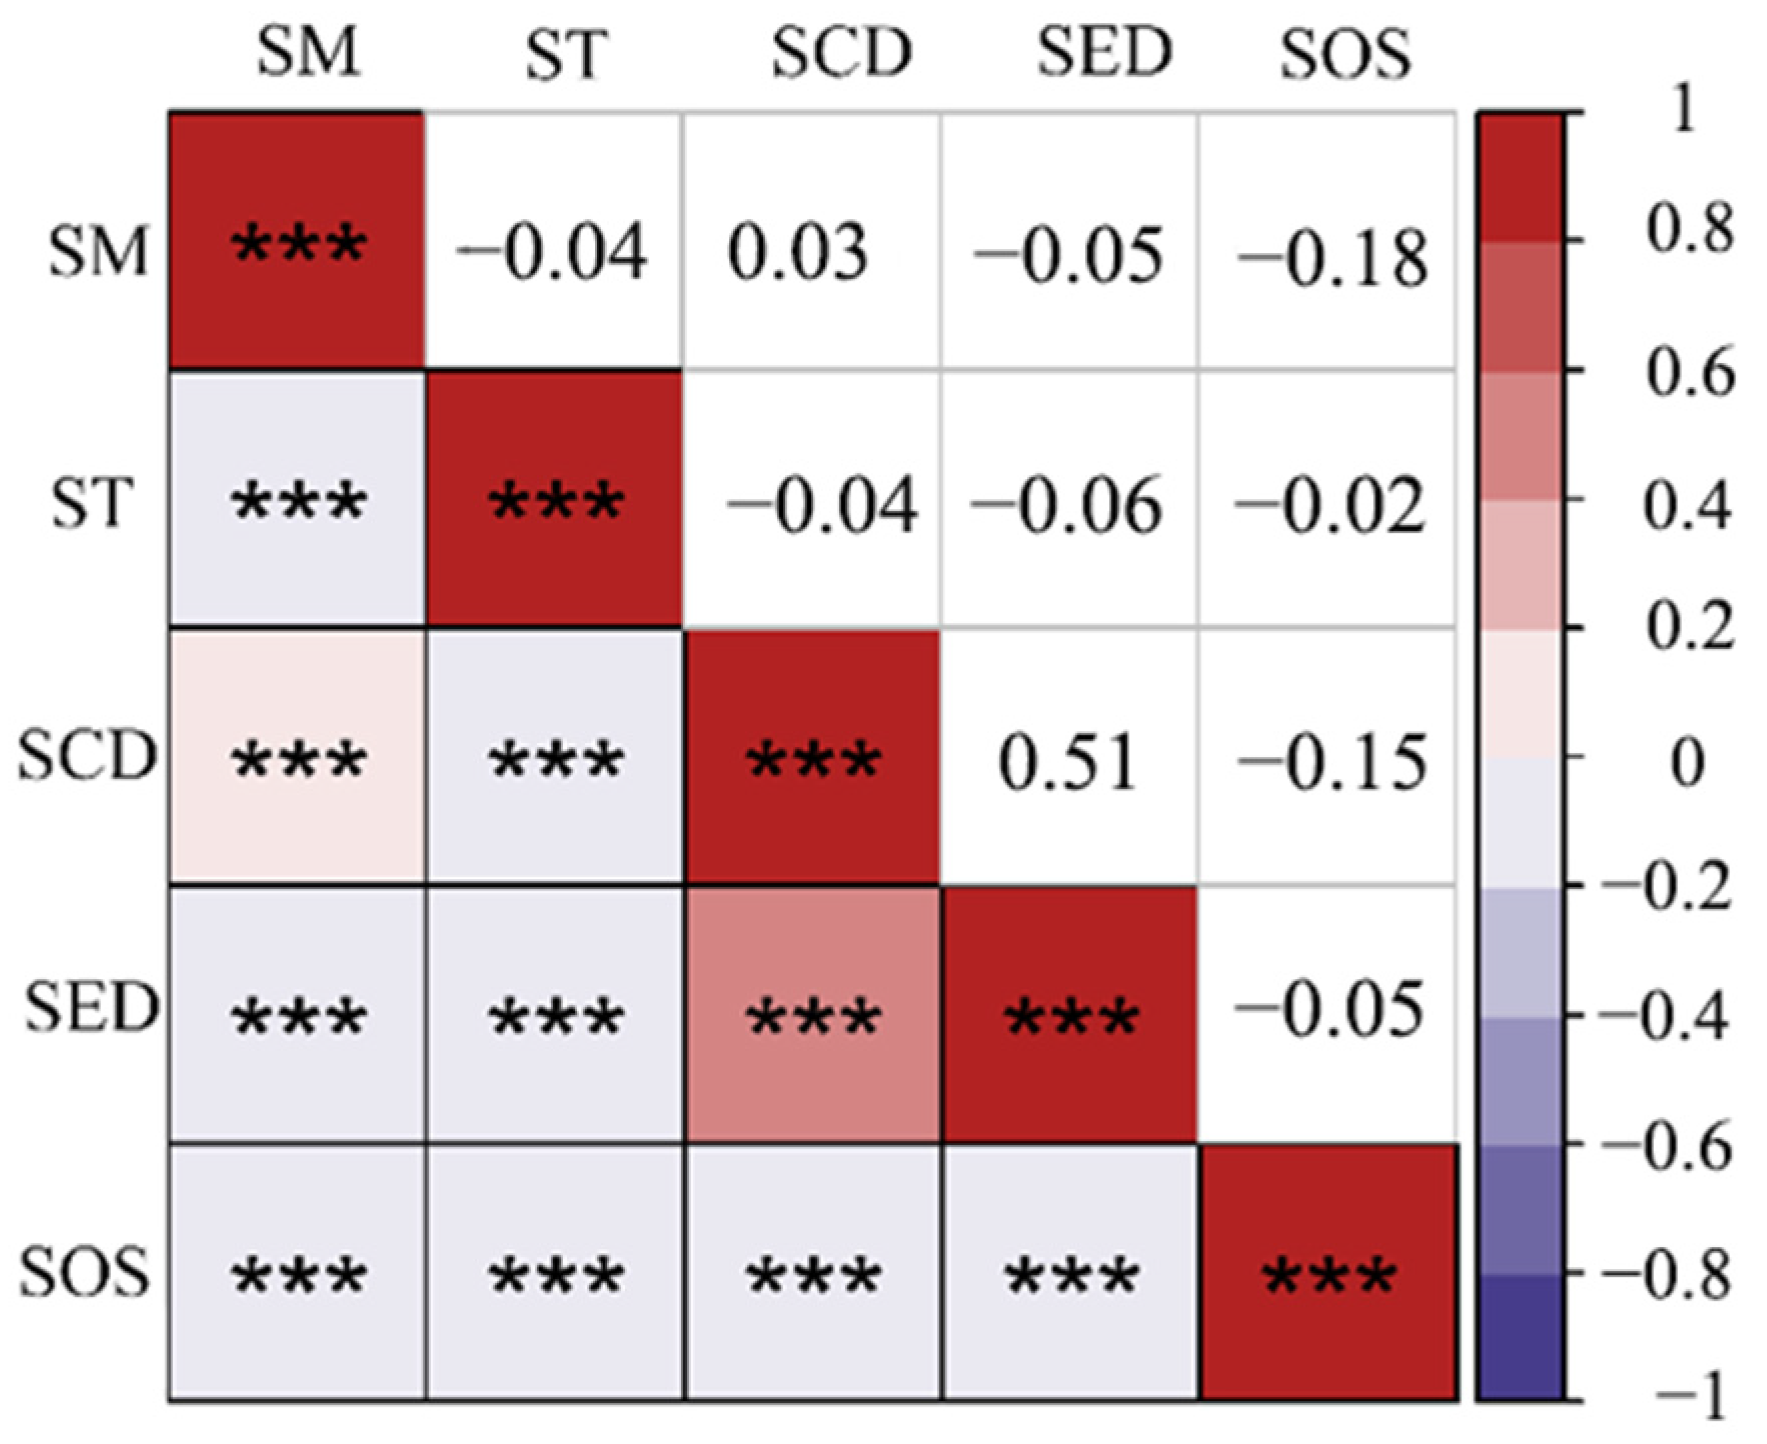
There was both a significant negative correlation between the SOS with ST and SM in TP (p < 0.001), indicating that alpine grassland would undergo revival and growth earlier in warmer and wetter soil environment in spring.
(2)
In TP, the SCD was significantly positively correlated with the SM, and significantly negatively correlated with the ST, suggesting that increased SCD can lead to spring soil temperature decrease and moisture increase in spring.
(3)
The SED was both significantly negatively correlated with the ST and SM. It indicated that the end of the snow season is earlier, and the spring soil would be warmer and wetter in TP.
(4)
Both the delayed SED and the increased SCD contributed to the advanced SOS, and the reduction of snow cover and the advance of melting will lead to the delay of SOS.
There is no doubt that the raised ST and increased SM in spring will lead to an earlier SOS. However, the spatial trends showed that the SM increased in the whole TP. It indicated that although the decreased SCD and delayed SED limited the increased SM, it is still replenished, probably by the permafrost thawing or liquid precipitation. In addition, the snow cover in TP is not continuous and melts very rapidly, which increases the complexity of analyzing the effect mechanism of how the changes of SOS of alpine grassland are affected by snow cover. In order to clarify the contribution of SED to the SOS of alpine grasslands, further analysis should be made in combination with spring precipitation and temperature changes in alpine grassland over the Tibetan Plateau.

Author Contributions

Y.M. implemented the data analysis and wrote the paper. X.H. conceived of the research, guided the implementation of the research, and revised and finalized the manuscript. Q.F. provided the data analysis. T.L. provided suggestions and revised the namuscript. All authors have read and agreed to the published version of the manuscript.

Funding

This research was funded by the Chinese Natural Science Foundation of China, grant number 41971293.

Data Availability Statement

The NDVI datasets are available at https://lpdaac.usgs.gov/products/mod13q1v006/ (accessed on 2 April 2021). The snow cover datasets are available at http://www.ncdc.ac.cn (accessed on 8 April 2021). The daily soil temperature and moisture datasets are available at http://data.tpdc.ac.cn (accessed on 17 October 2021).

Conflicts of Interest

The authors declare no conflict of interest.

References

  1. Zhu, J.X.; Hu, H.F.; Tao, S.L.; Chi, X.L.; Li, P.; Jiang, L.; Ji, C.J.; Zhu, J.L.; Tang, Z.Y.; Pan, Y.D.; et al. Carbon stocks and changes of dead organic matter in China’s forests. Nat. Commun. 2017, 8, 151. [Google Scholar] [CrossRef] [PubMed]
  2. Ren, S.L.; Peichl, M. Enhanced spatiotemporal heterogeneity and the climatic and biotic controls of autumn phenology in northern grasslands. Sci. Total Environ. 2021, 788, 147806. [Google Scholar] [CrossRef] [PubMed]
  3. Chen, X.N.; Yang, Y.P. Observed earlier start of the growing season from middle to high latitudes across the northern hemisphere snow. Environ. Res. Lett. 2020, 15, 034042. [Google Scholar] [CrossRef]
  4. Wu, C.Y.; Gonsamo, A.; Chen, J.M.; Kurz, W.A.; Price, D.T.; Lafleur, P.M.; Jassal, R.S.; Dragoni, D.; Bohrer, G.; Gough, C.M.; et al. Interannual and spatial impacts of phenological transitions, growing season length, and spring and autumn temperatures on carbon sequestration: A north America flux data synthesis. Glob. Planet. Chang. 2012, 92–93, 179–190. [Google Scholar] [CrossRef] [Green Version]
  5. Richardson, A.D.; Keenan, T.F.; Migliavacca, M.; Ryu, Y.; Sonnentag, O.; Toomey, M. Climate change, phenology, and phenological control of vegetation feedbacks to the climate system. Agric. For. Meteorol. 2013, 169, 156–173. [Google Scholar] [CrossRef]
  6. Li, X.X.; Fu, Y.S.H.; Chen, S.Z.; Xiao, J.F.; Yin, G.D.; Li, X.; Zhang, X.; Geng, X.J.; Wu, Z.F.; Zhou, X.C.; et al. Increasing importance of precipitation in spring phenology with decreasing latitudes in subtropical forest area in China. Agric. For. Meteorol. 2021, 304–305, 108427. [Google Scholar] [CrossRef]
  7. IPCC. Global Warming of 1.5 °C-IPCC Special Report-Summary for Policymakers; Cambridge University Press: Cambridge, UK, 2018. [Google Scholar]
  8. Parry, M.L.; Canziani, O.F.; Palutikof, J.P.; van der Linden, P.J.; Hanson, C.E. IPCC, 2007: Climate Change 2007: Impacts, Adaptation and Vulnerability; Contribution of Working Group II to the Fourth Assessment Report of the Intergovernmental Panel on Climate Change; Cambridge University Press: Cambridge, UK, 2007. [Google Scholar]
  9. Shen, M.G.; Tang, Y.H.; Chen, J.; Yang, W. Specification of thermal growing season in temperate China from 1960 to 2009. Clim. Chang. 2012, 114, 783–798. [Google Scholar] [CrossRef]
  10. Chen, X.Q.; An, S.; Inouye, D.W.; Schwartz, M.D. Temperature and snowfall trigger alpine vegetation green-up on the world’s roof. Glob. Chang. Biol. 2015, 21, 3635–3646. [Google Scholar] [CrossRef]
  11. Xie, J.; Jonas, T.; Rixen, C.; de Jong, R.; Garonna, I.; Notarnicola, C.; Asam, S.; Schaepman, M.E.; Kneubühler, M. Land surface phenology and greenness in alpine grasslands driven by seasonal snow and meteorological factors. Sci. Total Environ. 2020, 725, 138380. [Google Scholar] [CrossRef]
  12. Shen, M.G.; Zhang, G.x.; Cong, N.; Wang, S.P.; Kong, W.D.; Piao, S.L. Increasing altitudinal gradient of spring vegetation phenology during the last decade on the Qinghai–Tibetan Plateau. Agric. For. Meteorol. 2014, 189–190, 71–80. [Google Scholar] [CrossRef]
  13. Zhao, J.J.; Zhang, H.Y.; Zhang, Z.X.; Guo, X.Y.; Li, X.D.; Chen, C. Spatial and temporal changes in vegetation phenology at middle and high latitudes of the northern hemisphere over the past three decades. Remote Sens. 2015, 7, 10973–10995. [Google Scholar] [CrossRef] [Green Version]
  14. Stucky, B.J.; Guralnick, R.; Deck, J.; Denny, E.G.; Bolmgren, K.; Walls, R. The plant phenology ontology: A new informatics resource for large-scale integration of plant phenology data. Front. Plant Sci. 2018, 9, 517. [Google Scholar] [CrossRef] [PubMed] [Green Version]
  15. Zu, J.X.; Zhang, Y.J.; Huang, K.; Liu, Y.J.; Chen, N.; Cong, N. Biological and climate factors co-regulated spatial-temporal dynamics of vegetation autumn phenology on the Tibetan Plateau. Int. J. Appl. Earth OBS. 2018, 69, 198–205. [Google Scholar] [CrossRef]
  16. Zeng, L.L.; Wardlow, B.D.; Xiang, D.X.; Hu, S.; Li, D.R. A review of vegetation phenological metrics extraction using time-series, multispectral satellite data. Remote Sens. Environ. 2020, 237, 111511. [Google Scholar] [CrossRef]
  17. Piao, S.L.; Fang, J.Y.; Zhou, L.M.; Ciais, P.; Zhu, B. Variations in satellite-derived phenology in China’s temperate vegetation. Glob. Chang. Biol. 2006, 12, 672–685. [Google Scholar] [CrossRef]
  18. Zhou, L.M.; Tucker, C.J.; Kaufmann, R.K.; Slayback, D.; Shabanov, N.V.; Myneni, R.B. Variations in northern vegetation activity inferred from satellite data of vegetation index during 1981 to 1999. J. Geophys. Res. Atmos. 2001, 106, 20069–20083. [Google Scholar] [CrossRef]
  19. Stöckli, R.; Vidale, P.L. European plant phenology and climate as seen in a 20-year AVHRR land-surface parameter dataset. Int. J. Remote Sens. 2004, 25, 3303–3330. [Google Scholar] [CrossRef]
  20. De Beurs, K.M.; Henebry, G.M. Land surface phenology and temperature variation in the international geosphere–biosphere program high-latitude transects. Glob. Chang. Biol. 2005, 11, 779–790. [Google Scholar] [CrossRef]
  21. Jeong, S.; Ho, C.; Jeong, J. Increase in vegetation greenness and decrease in springtime warming over east Asia. Geophys. Res. Lett. 2009, 36, L02710. [Google Scholar] [CrossRef]
  22. Fu, Y.H.; Piao, S.; Op de Beeck, M.; Cong, N.; Zhao, H.; Zhang, Y.; Menzel, A.; Janssens, I.A. Recent spring phenology shifts in western Central Europe based on multiscale observations. Global Ecol. Biogeogr. 2014, 23, 1255–1263. [Google Scholar] [CrossRef]
  23. Thompson, J.A.; Lees, B.G. Applying object-based segmentation in the temporal domain to characterise snow seasonality. ISPRS J. Photogramm. Remote Sens. 2014, 97, 98–110. [Google Scholar] [CrossRef]
  24. Yu, Z.; Liu, S.R.; Wang, J.X.; Sun, P.S.; Liu, W.G.; Hartley, D.S. Effects of seasonal snow on the growing season of temperate vegetation in China. Glob. Chang. Biol. 2013, 19, 2182–2195. [Google Scholar] [CrossRef] [PubMed]
  25. Chen, W.N.; Wu, Y.; Wu, N.; Luo, P. Effect of snow-cover duration on plant species diversity of alpine meadows on the eastern Qinghai-Tibetan Plateau. J. Mt. Sci. 2008, 5, 327–339. [Google Scholar] [CrossRef] [Green Version]
  26. Chen, X.N.; Yang, Y.P.; Ma, Y.Z.; Li, H. Distribution and attribution of terrestrial snow cover phenology changes over the northern hemisphere during 2001-2020. Remote Sens. 2021, 13, 1843. [Google Scholar] [CrossRef]
  27. Xin, Q.C.; Broich, M.; Zhu, P.; Gong, P. Modeling grassland spring onset across the western United States using climate variables and MODIS-derived phenology metrics. Remote Sens. Environ. 2015, 161, 63–77. [Google Scholar] [CrossRef]
  28. Liu, Y.Z.; Li, G.Y.; Wu, X.W.; Niklas, K.J.; Yang, Z.L.; Sun, S.C. Linkage between species traits and plant phenology in an alpine meadow. Oecologia 2021, 195, 409–419. [Google Scholar] [CrossRef]
  29. Tomaszewska, M.A.; Nguyen, L.H.; Henebry, G.M. Land surface phenology in the highland pastures of montane Central Asia: Interactions with snow cover seasonality and terrain characteristics. Remote Sens. Environ. 2020, 240, 111675. [Google Scholar] [CrossRef]
  30. Wang, X.Y.; Wu, C.Y.; Peng, D.L.; Gonsamo, A.; Liu, Z.J. Snow cover phenology affects alpine vegetation growth dynamics on the Tibetan Plateau: Satellite observed evidence, impacts of different biomes, and climate drivers. Agric. For. Meteorol. 2018, 256, 61–74. [Google Scholar] [CrossRef]
  31. Qiu, B.; Li, W.; Wang, X.; Shang, L.; Song, C.; Guo, W.; Zhang, Y. Satellite-observed solar-induced chlorophyll fluorescence reveals higher sensitivity of alpine ecosystems to snow cover on the Tibetan Plateau. Agric. For. Meteorol. 2019, 271, 126–134. [Google Scholar] [CrossRef]
  32. Asam, S.; Callegari, M.; Matiu, M.; Fiore, G.; De Gregorio, L.; Jacob, A.; Menzel, A.; Zebisch, M.; Notarnicola, C. Relationship between spatiotemporal variations of climate, snow cover and plant phenology over the Alps-an earth observation-based analysis. Remote Sens. 2018, 10, 1757. [Google Scholar] [CrossRef] [Green Version]
  33. Xu, W.F.; Ma, H.Q.; Wu, D.H.; Yuan, W.P. Assessment of the daily cloud-free MODIS snow-cover product for monitoring the snow-cover phenology over the Qinghai-Tibetan Plateau. Remote Sens. 2017, 9, 585. [Google Scholar] [CrossRef] [Green Version]
  34. Zhang, Y.L.; Yuan, L.B.; Zhang, D. A discussion on the boundary and area of the Tibetan Plateau in China. Geogr. Res. 2002, 21, 1–8. (In Chinese) [Google Scholar]
  35. Wan, Y.F.; Gao, Q.Z.; Li, Y.; Qin, X.; Ganjurjav; Zhang, W.N.; Ma, X.; Liu, S. Change of snow cover and its impact on alpine vegetation in the source regions of large rivers on the Qinghai-Tibetan Plateau, China. Arct. Antarct. Alp. Res. 2014, 46, 632–644. [Google Scholar] [CrossRef] [Green Version]
  36. Wang, K.; Zhang, L.; Qiu, Y.B.; Ji, L.; Tian, F.; Wang, C.Z.; Wang, Z.Y. Snow effects on alpine vegetation in the Qinghai-Tibetan Plateau. Int. J. Digit. Earth. 2015, 8, 56–73. [Google Scholar] [CrossRef]
  37. Zhu, W.Q.; Jiang, N.; Chen, G.S.; Zhang, D.H.; Zheng, Z.T.; Fan, D.Q. Divergent shifts and responses of plant autumn phenology to climate change on the Qinghai-Tibetan Plateau. Agric. For. Meteorol. 2017, 239, 166–175. [Google Scholar] [CrossRef]
  38. Hao, X.H. A New MODIS Snow Cover Extent Product over CHINA (2000–2020); National Tibetan Plateau Data Center: Lanzhou, China, 2021. [Google Scholar]
  39. Zhang, X.D.; Zhou, J.; Tang, W.B.; Ding, L.R.; Ma, J.; Zhang, X. Daily 1-km All-Weather Land Surface Temperature Dataset for the Chinese Landmass and Its Surrounding Areas (TRIMS LST; 2000–2020); National Tibetan Plateau Data Center: Beijing, China, 2021. [Google Scholar] [CrossRef]
  40. Meng, X.; Mao, K.; Meng, F.; Shi, J.; Zeng, J.; Shen, X.; Cui, Y.; Jiang, L.; Guo, Z. A fine-resolution soil moisture dataset for China in 2002–2018. Earth Syst. Sci. Data 2021, 13, 3239–3261. [Google Scholar] [CrossRef]
  41. Xia, J.Z.; Ma, M.N.; Liang, T.G.; Wu, C.Y.; Yuan, W.P. Estimates of grassland biomass and turnover time on the Tibetan Plateau. Environ. Res Lett. 2017, 13, 014020. [Google Scholar] [CrossRef]
  42. Savitzky, A. Smoothing and differentiation of data by simplified least squares procedures. Anal. Chem. 1964, 36, 1627–1639. [Google Scholar] [CrossRef]
  43. Jönsson, P.; Eklundh, L. TIMESAT-a program for analyzing time-series of satellite sensor data. Comput. Geosci. 2004, 30, 833–845. [Google Scholar] [CrossRef] [Green Version]
  44. Lloyd, D. A phenological classification of terrestrial vegetation cover using short wave vegetation index imagery. Int. J. Remote Sens. 1990, 11, 2269–2279. [Google Scholar] [CrossRef]
  45. White, M.A.; Thornton, P.E.; Running, S.W. A continental phenology model for mon itoring vegetation responses to interannual climatic variability. Glob. Biogeochem. Cycle. 1997, 11, 217–234. [Google Scholar] [CrossRef]
  46. Wang, S.Y.; Wang, X.Y.; Chen, G.S.; Yang, Q.C.; Wang, B.; Ma, Y.X.; Shen, M. Complex responses of spring alpine vegetation phenology to snow cover dynamics over the Tibetan Plateau, China. Sci. Total Environ. 2017, 593, 449–461. [Google Scholar] [CrossRef] [PubMed]
  47. Cong, N.; Wang, T.; Nan, H.J.; Ma, Y.C.; Wang, X.H.; Myneni, R.B.; Piao, S.L. Changes in satellite-derived spring vegetation green-up date and its linkage to climate in China from 1982 to 2010: A multimethod analysis. Glob. Chang. Biol. 2013, 19, 881–891. [Google Scholar] [CrossRef] [PubMed]
  48. Wang, X.W.; Xie, H.J. New methods for studying the spatiotemporal variation of snow cover based on combination products of MODIS Terra and Aqua. J. Hydrol. 2009, 371, 192–200. [Google Scholar] [CrossRef]
  49. Yuan, L.; Zhao, L.; Li, R.; Hu, G.; Ma, L. Spatiotemporal characteristics of hydrothermal processes of the active layer on the central and northern Qinghai–Tibet plateau. Sci. Total Environ. 2020, 712, 136392. [Google Scholar] [CrossRef]
  50. Qi, Y.; Wang, H.W.; Ma, X.F.; Zhang, J.L.; Yang, R. Relationship between vegetation phenology and snow cover changes during 2001–2018 in the Qilian Mountains. Ecol. Indic. 2021, 133, 108351. [Google Scholar] [CrossRef]
  51. Wang, G.Y.; Baskin, C.C.; Baskin, J.M.; Yang, X.J.; Liu, G.F.; Ye, X.H.; Zhang, X.S.; Huang, Z.Y. Effects of climate warming and prolonged snow cover on phenology of the early life history stages of four alpine herbs on the southeastern Tibetan Plateau. Am. J. Bot. 2018, 105, 967–976. [Google Scholar] [CrossRef]
  52. Huang, K.; Zu, J.X.; Zhang, Y.J.; Cong, N.; Liu, Y.J.; Chen, N. Impacts of snow cover duration on vegetation spring phenology over the Tibetan Plateau. J. Plant Ecol. 2018, 12, 583–592. [Google Scholar] [CrossRef]
  53. Wipf, S.; Rixen, C.; Mulder, C.P.H. Advanced snowmelt causes shift towards positive neighbour interactions in a subarctic tundra community. Glob. Chang. Biol. 2006, 12, 1496–1506. [Google Scholar] [CrossRef]
  54. Thompson, K.L.; Zuckerberg, B.; Porter, W.P.; Pauli, J.N. The phenology of the subnivium. Environ. Res. Lett. 2018, 13, 064037. [Google Scholar] [CrossRef] [Green Version]
  55. Che, M.L.; Chen, B.Z.; Innes, J.L.; Wang, G.Y.; Dou, X.M.; Zhou, T.M.; Zhang, H.F.; Yan, J.W.; Xu, G.; Zhao, H.W. Spatial and temporal variations in the end date of the vegetation growing season throughout the Qinghai-Tibetan Plateau from 1982 to 2011. Agric. For. Meteorol. 2014, 189–190, 81–90. [Google Scholar] [CrossRef]
  56. Badhwar, G.D. Use of landsat-derived profile features for spring small-grains classification. Int. J. Remote Sens. 1984, 5, 783–797. [Google Scholar] [CrossRef]
  57. Xiong, T.; Zhang, H.Y.; Zhao, J.J.; Zhang, Z.X.; Guo, X.Y.; Zhu, Z.H.; Shan, Y. Diverse responses of vegetation dynamics to snow cover phenology over the boreal region. Forests. 2019, 10, 376. [Google Scholar] [CrossRef] [Green Version]
  58. Yi, S.H.; Zhou, Z.Y.; Ren, S.L.; Xu, M.; Qin, Y. Effects of permafrost degradation on alpine grassland in a semi-arid basin on the Qinghai–Tibetan Plateau. Environ. Res. Lett. 2011, 6, 045403. [Google Scholar] [CrossRef]
  59. Ge, Q.; Wang, H.; Rutishauser, T.; Dai, J. Phenological response to climate change in China: A meta-analysis. Glob. Chang. Biol. 2015, 21, 265–274. [Google Scholar] [CrossRef] [PubMed]
  60. Hoye, T.T.; Ellebjerg, S.M.; Philipp, M. The impact of climate on flowering in the high arctic-the case of dryas in a hybrid zone. Arct. Antarct. Alp. Res. 2007, 39, 412–421. [Google Scholar] [CrossRef]
  61. Jin, M.S.; Mullens, T.J. Land–biosphere–atmosphere interactions over the Tibetan Plateau from MODIS observations. Environ. Res. Lett. 2012, 7, 014003. [Google Scholar] [CrossRef]
  62. Yeh, T.C.; Wetherald, R.T.; Manabe, S. The effect of soil moisture on the short-term climate and hydrology change-a numerical experiment. Mon. Weather Rev. 1984, 112, 474–490. [Google Scholar] [CrossRef] [Green Version]
  63. Brandt, A.C.; Zhang, Q.; Lopez Caceres, M.L.; Murayama, H. Soil temperature and soil moisture dynamics in winter and spring under heavy snowfall conditions in North-Eastern Japan. Hydrol. Processes 2020, 34, 3235–3251. [Google Scholar] [CrossRef]
Figure 1. Distribution of elevation (a), vegetation types and sampling sites (b) on the Tibetan Plateau. The elevation information is retrieved from the Shuttle Radar Topography Mission digital elevation model (SRTM-DEM) (http://www.usgs.gov, accessed on 17 February 2022), and the land cover map retrieved from Institute of Botany, the Chinese Academy of Sciences (www.ibcas.ac.cn, accessed on 10 October 2021).
Remotesensing 14 02499 g001
Figure 2. Panels (ad) represent the average daily/monthly variations in normalized difference vegetation index, snow cover extent, soil temperature, and moisture from 2000 to 2020. The red lines represent the average values. The black lines show one standard deviation above and below the average values. The gray regions indicate the daily/monthly ranges.
Remotesensing 14 02499 g002
Figure 3. Spatial distributions of the mean values and slope-based trends of snow end date and snow-covered days on the TP from 2000 to 2020: (a) mean snow end date distribution, (b) areas with significant snow end date trends, (c) mean snow-covered days distribution, and (d) areas with significant snow-covered days trends; * denotes a significant change at p < 0.05.
Remotesensing 14 02499 g003
Figure 4. Spatial distributions of the mean values of the Julian year and slope-based trends of the start of the growing season on the Tibetan Plateau from 2000 to 2020: (a) mean the start of the growing season distribution and (b) areas with significant trends; * denotes a significant change at p < 0.05.
Remotesensing 14 02499 g004
Figure 5. Spatial distribution of the mean values and slope-based trends of the springtime soil temperature (2000–2020) and moisture (2003–2018) on the Tibetan Plateau: (a) mean soil temperature distribution, (b) areas with significant soil temperature trends, (c) mean soil moisture distribution, and (d) areas with significant soil moisture trends; * denotes a significant change at p < 0.05.
Remotesensing 14 02499 g005
Figure 6. Pearson correlation analysis results obtained for the start of the growing season, snow end date, snow-covered days, soil temperature, and moisture. *** denote an extremely significant correlation (p < 0.001).
Remotesensing 14 02499 g006
Publisher’s Note: MDPI stays neutral with regard to jurisdictional claims in published maps and institutional affiliations.

