Article

A Method of Soil Moisture Content Estimation at Various Soil Organic Matter Conditions Based on Soil Reflectance

1
School of Forestry, Northeast Forestry University, Harbin 150040, China
2
Key Laboratory of Sustainable Forest Ecosystem Management-Ministry of Education, Northeast Forestry University, Harbin 150040, China
3
China Railway Design Corporation, Tianjin 300251, China
*
Author to whom correspondence should be addressed.
Remote Sens. 2022, 14(10), 2411; https://doi.org/10.3390/rs14102411
Submission received: 6 April 2022 / Revised: 14 May 2022 / Accepted: 16 May 2022 / Published: 17 May 2022
(This article belongs to the Special Issue Satellite Soil Moisture Estimation, Assessment, and Applications)

Abstract

:
Soil moisture is one of the most important components of all the soil properties affecting the global hydrologic cycle. Optical remote sensing technology is one of the main parts of soil moisture estimation. In this study, we promote a soil moisture-estimating method with applications regarding various soil organic matters. The results indicate that the soil organic matter had a significant spectral feature at wavelengths larger than 900 nm. The existence of soil organic matter would lead to darker soil, and this feature was similar to the soil moisture. Meanwhile, the effect of the soil organic matter on its reflectance overlaps with the effect of soil moisture on its reflected spectrum. This can lead to the underestimation of the soil moisture content, with an MRE of 21.87%. To reduce this effect, the absorption of the soil organic matter was considered based on the Lambert–Beer law. Then, we established an SMCg-estimating model based on the radiative transform theory while considering the effect of the soil organic matter. The results showed that the effect of the soil organic matter can be effectively reduced and the accuracy of the soil moisture estimation was increased, while MRE decreased from 21.87% to 6.53%.

Graphical Abstract

1. Introduction

Soil moisture plays a significant role in the fields of climate science, agriculture, soil science, and hydrologic cycle science, among others [1,2]. As a key factor, soil moisture affects the rainfall-runoff process in land–atmosphere interactions and regulates the net ecosystem exchange [3]. Soil moisture also contributes to the primary production of global vegetation and the inter-annual carbon cycle. Research has shown that soil moisture affects the global annual photosynthesis total, decreasing it by 15% [4]. In dryland regions, soil moisture affects evapotranspiration and atmospheric moisture fluxes, determines the rate of vegetation growth, and affects agriculture production [5]. Therefore, it is important to monitor soil moisture in the terrestrial water cycle and ecosystem, especially to obtain spatial and temporal soil moisture data.
The conventional measuring methods of soil moisture content include the thermo-gravimetric method, time domain reflectometry (TDR) [6], heat flux soil moisture sensors [7], and micro electro mechanical system (MEMS) [8]. These methods always require high amounts of labor, time, and money. To acquire more high quality soil moisture observations, scientists applied many more methods, such as the international soil moisture network (ISMN) [9]. Most of them can only monitor specific locations and provide temporally continuous observational data. However, soil moisture has significantly spatial heterogeneity, even for a few meters, but these methods are inadequate for representing the spatial distribution of soil moisture at a large scale. In order to obtain spatially averaged large-scale soil moisture data, remote sensing technology with spatial resolutions of tens of meters to tens of kilometers is applied.
Remote sensing technology provides an extreme advantage for the monitoring and estimating large-scale near-surface soil properties, especially for soil moisture. Remote sensing technology for soil moisture estimation has been applied since 1970s [10]. Optical, thermal, and microwave remote sensing techniques were considered promising methods for spatially explicit measurements of soil moisture [11,12,13]. In optical remote sensing, the bands with wavelengths ranging from 350 nm to 2500 nm were used to estimate the soil moisture [14]. In thermal infrared remote sensing, the bands with wavelengths ranging from 3500 to 14,000 nm were used for soil moisture estimation. Thermal infrared remote sensing retrieved the soil moisture by land surface temperature (LST) determined via evapotranspiration [15]. Microwave remote sensing can exploit the vast disparity of the dielectric permittivity of the water, air and solids present. The dielectric properties of the soil phases would change with the soil texture, soil moisture and soil salinity. Small changes in the soil moisture content would affect the emissivity and backscattering of microwaves at the soil surface [16]. By analyzing the change of the complex permittivity of the soil, soil moisture information can be extracted from microwave remote sensing. Low-frequency microwave data, such as P-band, L-band, C-band, and X-band data, have commonly been used to retrieve soil moisture [14]. At the same time, the microwave remote sensing provided here continues to provide the availability of large-scale data products, such as SMOS (soil moisture and ocean salinity) and SMAP (soil moisture active passive) [17]. Passive and active microwave remote sensing were the most effective techniques for soil moisture monitoring at the global scale [14]. However, the emission of the natural object was weak at the frequencies in which the soil moisture was sensitive; the microwave remote sensing commonly had a coarse spatial resolution in order to detect the weak emission [18].
Optical remote sensing is one of the most commonly used soil moisture monitoring methods; this was proposed to estimate the soil moisture using broadband or narrowband optical remote sensors [19]. The soil reflectance spectrum is an important node for soil moisture retrieval at both the small and large scales. To establish the relationship between soil moisture content and reflectance, numerous studies of soil moisture estimation methods by remote sensing were conducted. In the optical methods, the statistical method and physical method were simultaneously developed.
In statistical methods, the relationship between soil moisture content and spectral reflectance was extensively studied in previous research [20,21]. The spectral index is one of the most frequently used methods in soil moisture inversion. The normalized difference vegetation index (NDVI) is the prominent index that links weekly or monthly SSM (surface soil moisture) and soil reflectance. Chen et al. experienced an advantage of NDVI in predicting SMC in Australia with a confidence interval of more than 0.99, but the NDVI lagged behind soil moisture content by one month, which severely constrained its development [22,23]. In addition, the normalized difference soil moisture index (NSMI) was established to investigate the empirical relationship between soil reflectance and SMC; reflectance values at 1800 and 2119 nm were combined to predict SMC with an R² of 0.61 [24]. Subsequently, the samples of larger area soil moisture estimation using NSMI were verified with an R² of 0.819, but the applicability of this method is limited by its lack of range regarding different soil types [25]. The perpendicular drought index (PDI) and modified perpendicular drought index (MDPI) proposed by Ghulam also presented a potential application for the prediction of SMC, considering both soil moisture and vegetation growth. However, they were constrained by an existing fixed soil line related to the soil type [26,27]. To conclude, the spectral index methods derived from specific spectral bands have inevitably limited conditions.
In addition, statistical methods are closely related to machine learning [28,29,30], which is also an overwhelming area of interest in this field. Morellos used the support vector machine and cubist model to predict soil moisture content, and the R² values were 0.76 and 0.88, respectively [31]. Sajjad Ahmad used support vector machine, artificial neutral network model (ANN), and multivariate linear regression model (MLR) to predict soil moisture content and found that the method of the SVM performed better than ANN and MLR models for the prediction of soil moisture content with RMSE less than 2% [32]. Among these studies, the relationship between soil properties and its reflectance was calculated by a black box model; then, a statistical estimation method depended measured dataset was established.
In general, statistical methods can often achieve a high measurement accuracy for particular conditions and research areas. However, the shortcomings of these methods are lower robustness and lacking physical explanation of radiation transmission. These methods do not explain the physical and chemical processing of light passing though the soil surface and play special roles regarding the biological properties of soil in the soil reflectance spectral and their effects on the light transmission. At the same time, these methods with weak robustness cannot be applied to a large region which shows significant spatial heterogeneity of the soil composition [33].
Compared with statistical methods, physical methods of soil moisture estimation are mainly based on radiative transfer theory [34,35,36]. Radiative transfer models of soil were published and improved the soil moisture estimation. Based on the Kubelka–Munk two-flux radiative transfer theory, Kubelka and Munk developed a Kubelka–Munk model to analyze the relationship between the reflectance and the parameter calculated from a light absorption and a light scattering coefficient [37]. Sadeghi improved the Kubelka–Munk two-flux radiative transfer model to estimate SMC while considering the effects of the absorption by soil water and soil particles and the scattering caused by the soil particles. This research found the optimal bands to predict SMC with high applicability have an RMSE of 0.036 [38].
The Hapke model, which is a soil bi-directional reflectance model, is widely used to estimate soil moisture [39]. Based on the Hapke model, Yang developed the SWAP-Hapke model, which considers the bidirectional reflectance distribution function of soil moisture, and is used to estimate the soil moisture with an RMSE of soil moisture estimation of 0.813. The results demonstrated that the mode has good accuracy precision [40]. Bablet et al. developed a multilayer radiative transfer (MARMIT) model of soil reflectance simulation. In his study, a multiple scatter in the soil layer was considered and the simulated results were consistent with measured reflectance and its RMSE was only 5% [34]. Subsequently, an improved version of the MARMIT model called MARMIT-2 was developed. The diffuse light in the water layer and the mixing of spectral reflectance were considered into the model. This model showed better simulated results for higher moisture content with a higher accuracy [41].
Some research focused on the influence of the soil properties on its reflectance using statistical or physical methods. A large amount of previous research shows that soil properties such as soil organic matter, soil texture, soil type, and soil salinity would affect the process of light absorption, scattering, and reflectance, as well as having an effect on soil reflectance at different wavelengths [42]. For example, the absorption peak of soil moisture is normal at around 1400 nm and 1900 nm [43]. However, research showed that the clay minerals have an effect on the soil reflectance around 1400 nm and 2200 nm [44]. Organic matters with various function groups have a significant effect on the wavelengths around 1100 nm, 1600 nm, 1700 nm, and 1900 nm [42]. Without doubt, the spectral confusion of those absorption features of the soil components affect the accuracy of the soil moisture estimation using optical remote sensing.
Soil organic matter (SOM) is one of the main components of soil, as well as one of the contributors of the soil reflectance spectra. The main effects of soil organic matter on spectra reflectance are caused by the vibration overtones of certain functional groups, such as C-H, O-H, C=O, N-H, which correspond to the bands of 1400 nm, 1700 nm, 1860 nm, 2150 nm, 2300 nm and 2240 nm [45]. However, with the overlapping of various bands, the featured bands of the specific soils are determined by the contents of different functional groups and organic matters. The results varied from study to study. Boško Miloš proposed that the wavelengths of 435 nm, 500 nm, 1050 nm, 1420 nm, 1425 nm, 1875 nm, 1910 nm, 1915 nm, 1925 nm, 1960 nm, 2170 nm, 2200 nm, 2260 nm, 2315 nm, and 2380 nm all contribute to the prediction of SOM [46]. Islam mentioned that the whole spectral range (VIS-NIR) was better for the prediction of SOM [47], because soil organic matter decreases the soil reflectance in the all VIS-NIR bands, especially for soil organic matter contents of more than 2% [47,48]. As a main contributor to the soil spectrum, the effect of the organic matter on soil reflectance cannot be ignored. Therefore, it is important to consider the influence of soil organic matter on the inversion of the estimation of other soil properties, especially for the soil moisture content.
In this study, a soil moisture estimation method, which considered the effect of the soil organic matter, was demonstrated. To achieve these goals, soil samples were collected, and soil properties and their reflectance data were measured. Then, an improved method of soil moisture estimation was developed by using these experimental data. The aims of this study were to (1) analyze the effects of organic matter on the soil reflectance spectrum; (2) establish an estimation model for soil moisture which considers the organic matter effect on the soil reflectance; (3) evaluate the accuracy of the improved model. This study can provide a reference for soil moisture estimation at various soil organic matter conditions.

2. Materials and Methods

2.1. Study Area

The study target area of this paper is Songnen Plain, which is located in the middle of Song Liao Basin in the northeast of China (Figure 1). This region features a temperate monsoon climate, with an annual precipitation of 500–600 mm. Songnen Plain is an important grain production area of China, producing soybean, wheat, and corn. At the same time, Songnen Plain is one of the three famous big black soil regions in the world [49]. With abundant soil organic matter, rather high active accumulated temperature, and fine hydrothermal conditions, soil moisture and soil organic matter naturally play vital roles in maintaining crop yields. Therefore, it is of great value to study the combined effects of the interaction between soil water and organic matter on the spectral reflectance and accurately estimate the soil moisture content.

2.2. Field Measurement

The soil samples used in this research were collected from Anda City in the east of Songnen Plain. A total of twenty soil samples were collected at a depth of 10 cm in April 2015, and the GPS coordinate of each sampling point was recorded. Each soil sample was divided into two subgroups. The first group was used to measure the reflectance of wet soil samples. Then, these samples were treated by natural air dying in a laboratory to measure the reflectance of air-dried soil samples, soil moisture content, and organic matter content. The soil samples of the second group were treated by air, crushing and screening; then, samples were gathered together to obtain the gradient moisture content of soil samples. The water is titrated into air-dry soil samples by leaching. Finally, sixteen sample data sets of moisture content gradients were obtained.
The soil moisture content used in this paper is the mass percentage of water in the soil. Specifically, the thermos–gravimetric technique (oven-drying) was employed for measuring the soil moisture content in this paper [50]. Owing to its extensive application, the thermos–gravimetric technique is regarded as the standard reference for soil moisture content measurement.
The first step was to weigh the original soil samples; the mass of soil samples ( M s ) was derived. The next step was to put soil samples into the oven, drying at 105 °C for 24 h, and subsequently, the mass of dried soil samples ( M d ) was recorded [51], and the formula of gravimetric moisture content (SMCg) of the soil was expressed as following:
S M C g = M s M d M s × 100 % = M w M s × 100 %
M s is the mass of wet soil sample; M d is the mass of dried soil sample; M w is the mass of soil water; S M C g is the soil gravimetric moisture content.
The content of soil organic matter is determined using the vitriol acid-potassium dichromate wet oxidation method; the details regarding this can be found in the study of Li [52].
The statistical information of the field samples can be found in Table 1. The mean soil moisture was 25.88%. The minimum and maximum soil moisture were 17.53% and 55.21%, respectively. The mean, minimum, and maximum the soil organic matter were 38.438 g/kg, 17.946 g/kg, and 81.211 g/kg, respectively. The soil type was Haplic Chernozems. The soil texture included sandy clay loam (3 samples), sandy loam soil (1 sample), loamy clay (8 samples), clay soil (4 samples), and loam soil (2 samples).
The soil samples were measured using a portable spectrometer SVC HR-1024i (Spectra Vista Co., New York, NY, USA) and the reflectance from 350 nm to 2500 nm was obtained for each soil sample. Laboratory spectra were measured in dark conditions using a halogen lamp (Lowel Light Pro, JCV 14.5 V-50 WC). A 25° field of view fiber was used to measure spectral measurements. In addition, each sample was measured 10 times and averaged to minimize the instrument noise and effects of the environmental conditions. A calibration was performed before and after the measurement of each sample by using a white panel [53].

2.3. Method

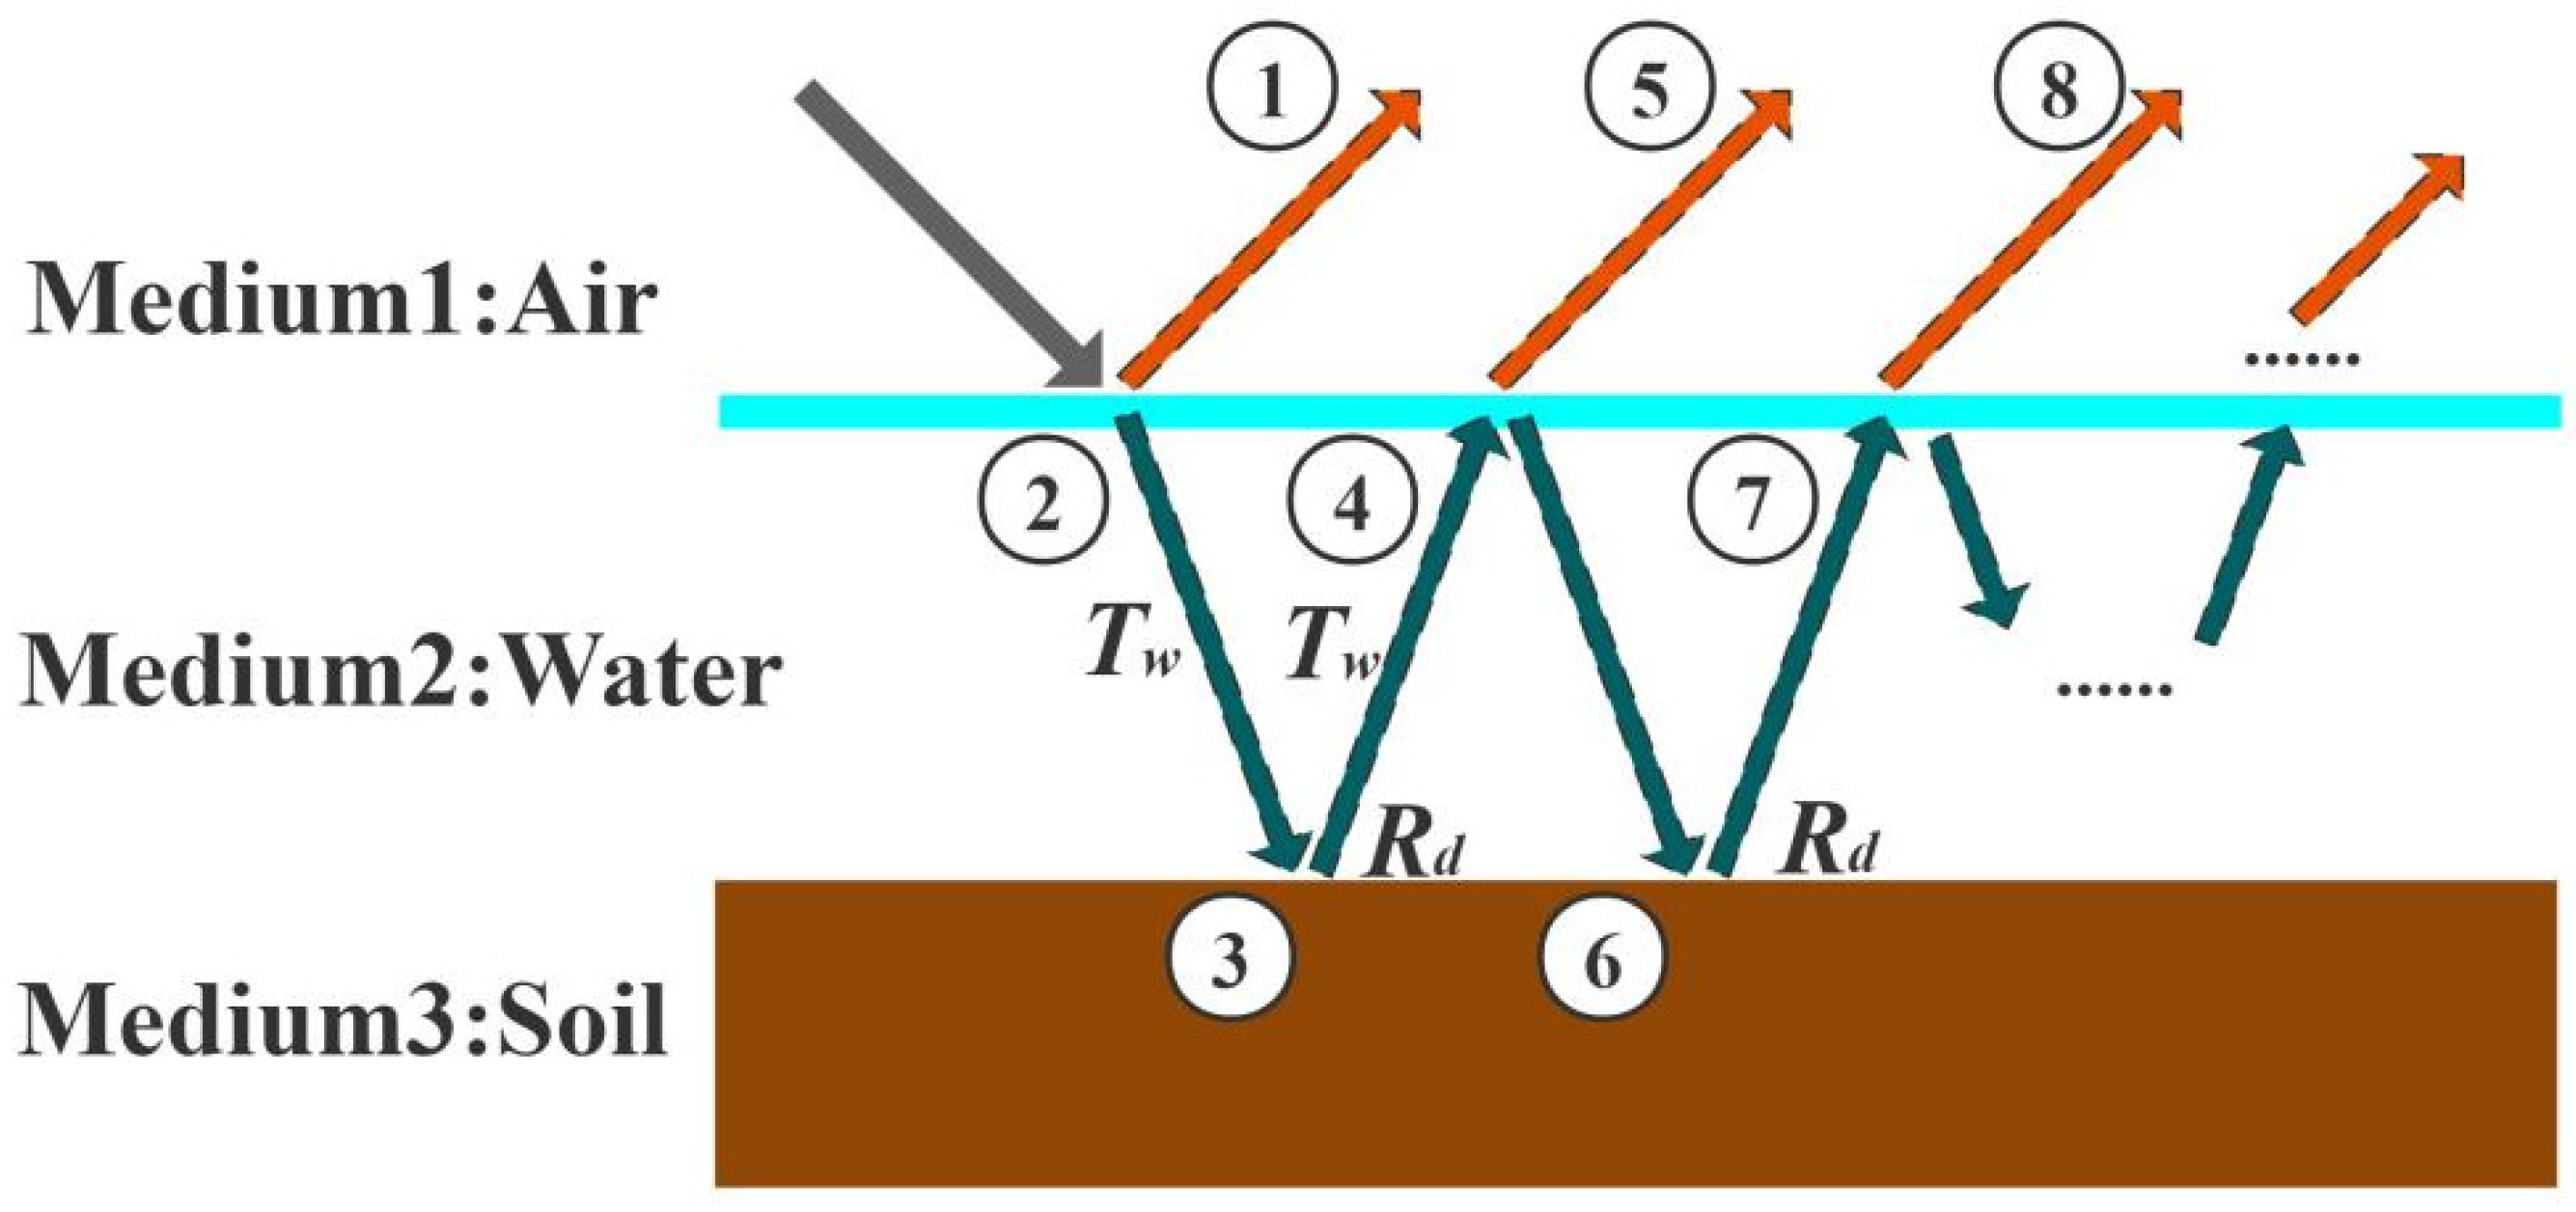
2.3.1. Soil Reflectance Simulation Based on Radiative Transfer Theory

The radiative transfer model is proved to be an effective method to simulate soil reflectance spectral. In this study, a simplified approach to reality was applied. Wet soil was considered as a dry soil covered with a thin layer of water based on a previous study [54]. The thickness of the water layer was L (cm). Light was reflected and transmitted when it passed thought the water layer and soil layer. A fraction of the light was reflected with a reflectance of r12 at the air–water interface. The other part of light was transmitted from the air layer to the water layer with a transmissivity of t12. Then, the light was diffusely scattered through internal multiple reflections between the water–air interface and water–soil interface. The reflectance of water–soil and water–air was Rd and r12. These multiple reflections increased the absorption probability of the water layer. In addition, the reflectance of the soil was the sum of the fraction of the multiple reflected light thought out of the water–air interface. The procedure of the scatting and transmitting of light can be found in Figure 2.
The mathematical process was shown as following:
①: r 12 , which represented the directly reflectance at the air–water interface.
: t 12 , which represented the transmissivity when the light passed through the air-water interface.
:   t 12 T w , which represented the energy of the light reached the water–soil interface at the first time. In addition, Tw was the transmittance when the light passed though the water layer.
:   t 12 T W 2 R d , which represented the energy reached to the water–air interface. Rd was the reflectance of the water–soil interface.
:   t 12 T W 2 R d t 21 , which represented the fraction of the reflected energy passed though the water–air interfaces at the first time, where the t21 was the transmissivity when the light passed though the water–air interface and t 21 = 1 n 2 t 12 , when n = n1/n2, n1 and n2 was the refractivity of the air and water, respectively [55].
:   t 12 T W 3 R d r 21 , which represented the energy reached to the water–soil interface at the second time, where r12 was the reflectance of the water–air interface, which can be calculated by integrating the reflectivity over the entire hemisphere based the method of the Stern.
:   t 12 T W 4 R d 2 r 21 , which represented the energy reached to the water-air interface at the second time.
  : t 12 T W 4 R d 2 r 21 t 21 , which represented the fraction of the reflected energy passed though the water–air interface at the second time.
Based on multiple layer radiative transfer model in Figure 2, the soil reflectance R m o d can be written as following:
R m o d = + + + = r 12 + t 12 T w 2 R d t 21 + t 12 T w 4 R d 2 t 21 r 21 + = r 12 + t 12 T w 2 R d t 21 ( 1 + T w 2 R d r 21 + )
In addition, the expression in brackets was a geometric series of T w 2 R d r 21 , so R m o d can be expressed as:
R m o d = r 12 + t 12 T w 2 R d t 21 1 r 21 R d T w 2
T w was the transmittance in water layer which affected by the absorption of pure water. In addition, Tw can be calculated by the Lambert–Beer law.
T W = e ε ( λ ) × L
where ε ( λ ) was the absorption coefficient of pure water and L was the thickness of water layer which was a variable correlated to the soil moisture content. Using the cost function to minimize the distance between simulated reflectance and measured reflectance, we can obtain L, which was the effective water layer thickness of soil samples.
χ 2 ( L ) = λ 1 λ 2 ( R m e a s ( λ ) R m o d ( λ , L ) ) 2 n u m λ
R m e a s ( λ ) was the measured reflectance; R m o d ( λ , L ) was the simulated reflectance. λ 1 and λ 2 was the lower and upper bounds of the wavelength range; n u m λ was the number of bands.
Each measured reflectance R m e a s ( λ ) matched a unique soil sample and had only one soil moisture content. To obtain the relationship between SMCg and L, the statistics method was applied, and the relationship between SMCg and L can be represented as the following:
S M C g = f ( L )
SMCg was the soil moisture content; L was the thickness of the water layer. When we obtained the soil moisture content and its reflectance dataset, the thickness of the water layer can be calculated by Equation (5); then, the function of f ( L ) between SMCg and L also can be established. Finally, the SMCg can be estimated based on this function of f ( L ).

2.3.2. Modified Soil Moisture Content Estimating Model with Considering SOM

In addition to soil moisture content, soil organic matter, soil salt content, and soil type will also affect the soil reflectance spectrum. Stevens et al. found that soil reflectance increases after removing the soil organic matter of samples [56]. Chen found that soil reflectance has a significant negative correlation with soil organic matter [57]. Although soil organic matters existed in soil in various forms, soil organic matter was assumed to be an absorption element which affected soil reflectance spectrum. In this paper, we assumed that a part of the soil organic matter can be dissolved into water and increase the absorption of the water layer.
According to the Lambert–Beer law, the light absorption of the solute was related to the concentration of analyte, and Formula (4) can be written as
T W = e ε ( λ ) × L × c  
Generally, c is the concentration of the soil organic matter dissolved in the water. However, the accurate measurement of this variable was difficult, even to the point of being unrealistic. Therefore, we assumed that the dissolved soil organic matter was the logarithm’s function related to soil organic matter. Eventually, the transmittance of organic matter solution changed into following:
T W S = e ε ( λ ) × L × l o g S O M  
We defined μ ( λ ) as a specific absorption of soil organic matter:
μ ( λ ) = ε ( λ ) × l o g S O M  
Then, the TWS was affected by the absorption of water layer, including the dissolved soil organic matter.
T W S = e μ ( λ ) L  
For every soil, the absorption characteristics change with the variation of soil organic matter and soil moisture. Finally, the simulated reflectance R m o d can be written as
R m o d s = r 12 + t 12 t 21 R d e 2 μ ( λ ) L 1 r 21 R d e 2 μ ( λ ) L
Finally, Equation (11) is a soil reflectance simulating model which considers soil organic matter. Once soil organic matter and spectral data are obtained, soil moisture can be estimated using this modified model under various organic matter conditions.

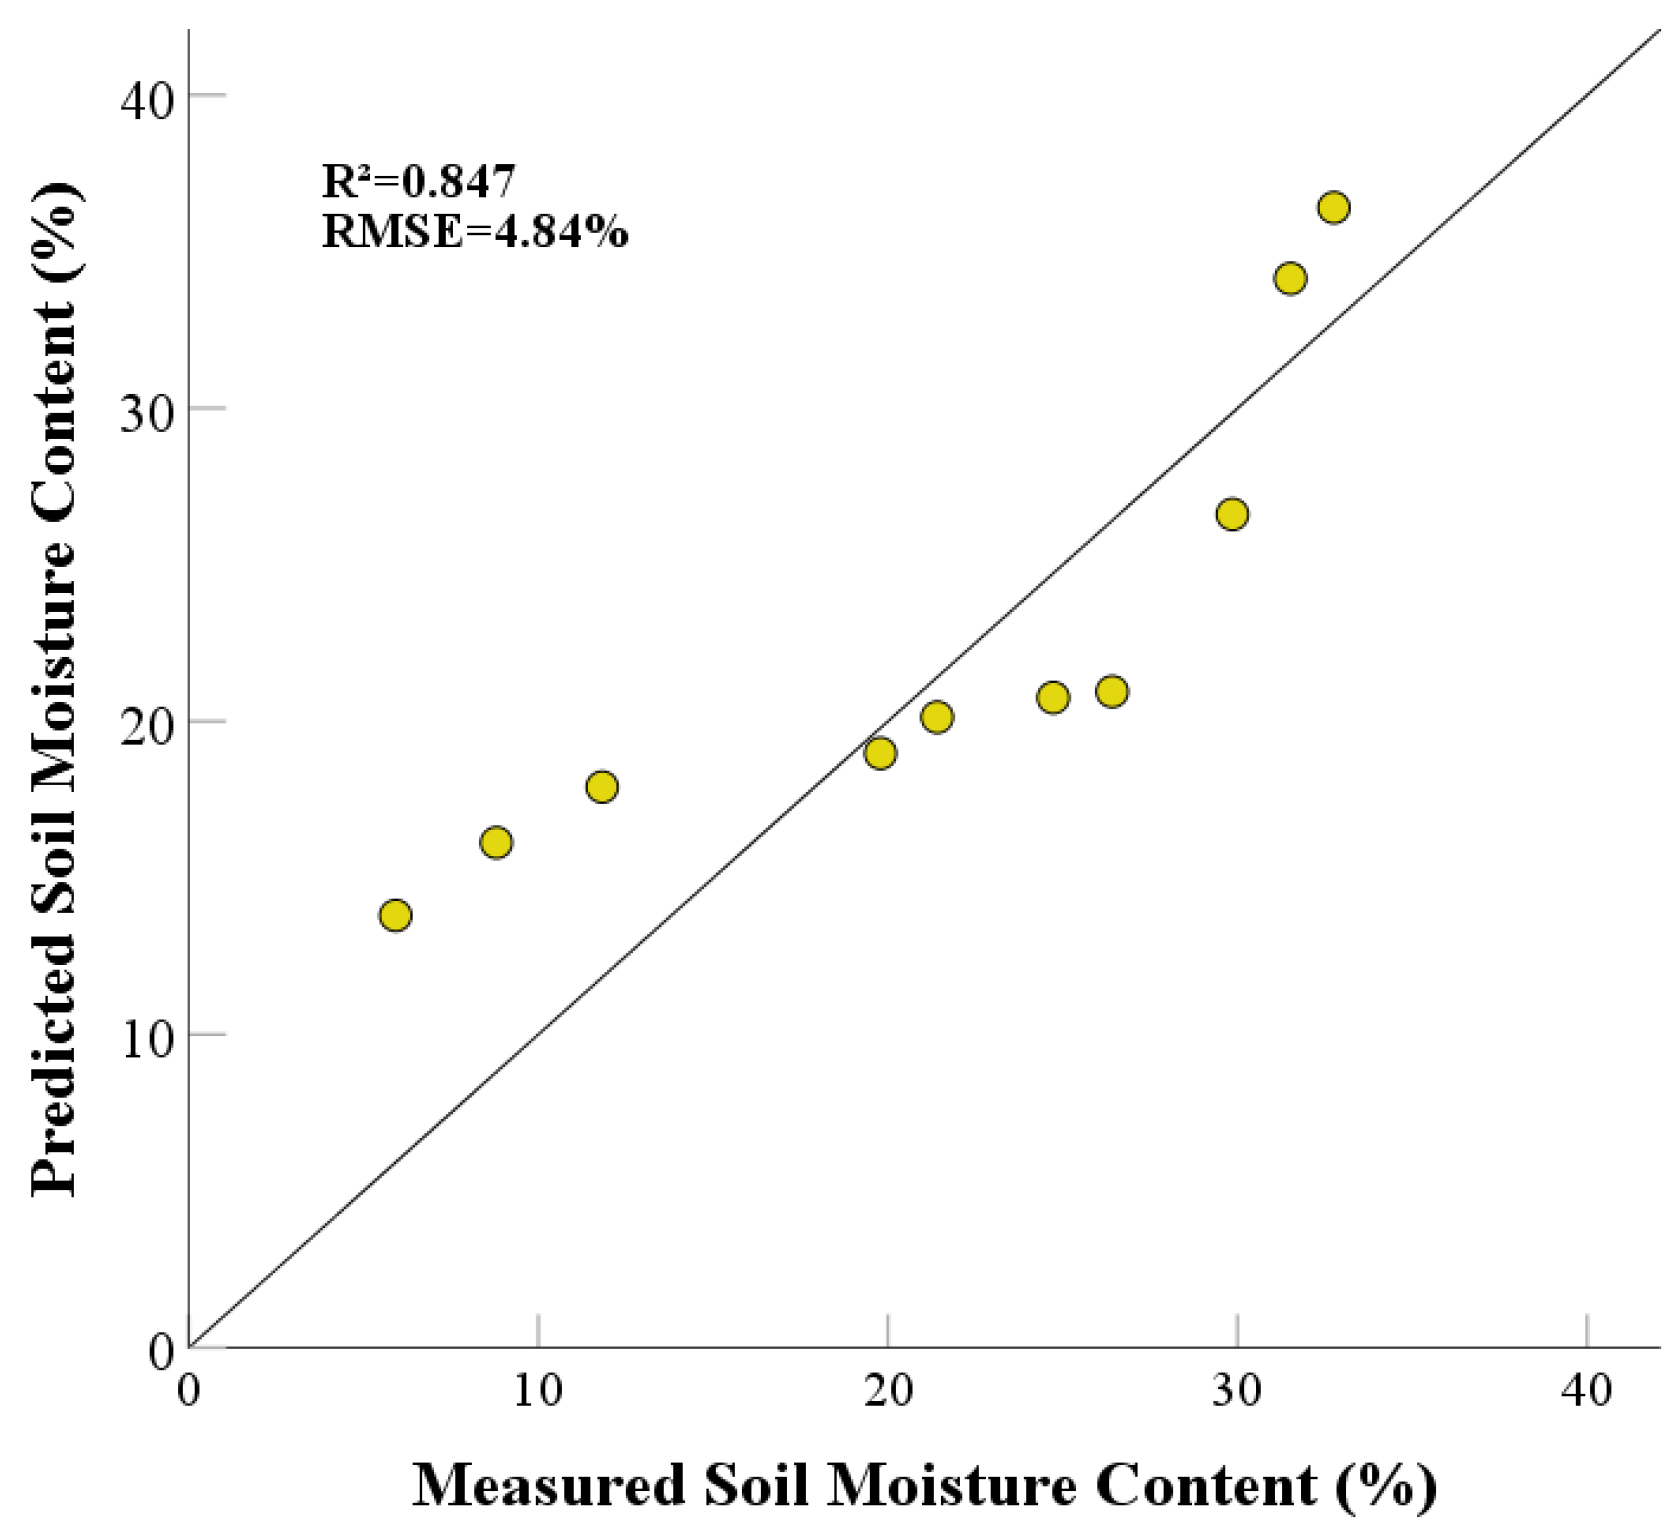
2.4. Accuracy Verification

To quantify the accuracy of our model, we chose the correlation coefficient (R²), root–mean–square error (RMSE), and mean relative error (MRE) as the evaluation criteria, and the calculating equations were used as in the following:
R 2 = 1 i = 1 n ( y i y i ) 2 i = 1 n ( y i y ¯ ) 2  
M R E = 1 n i = 1 n | y i y i | y i × 100 %
R M S E = 1 n i = 1 n ( y i y i ) 2
where y i , y i , and y ¯ were the measured value, the predicted value, and the average of the measured value, respectively. In addition, n was the number of the samples.

3. Results

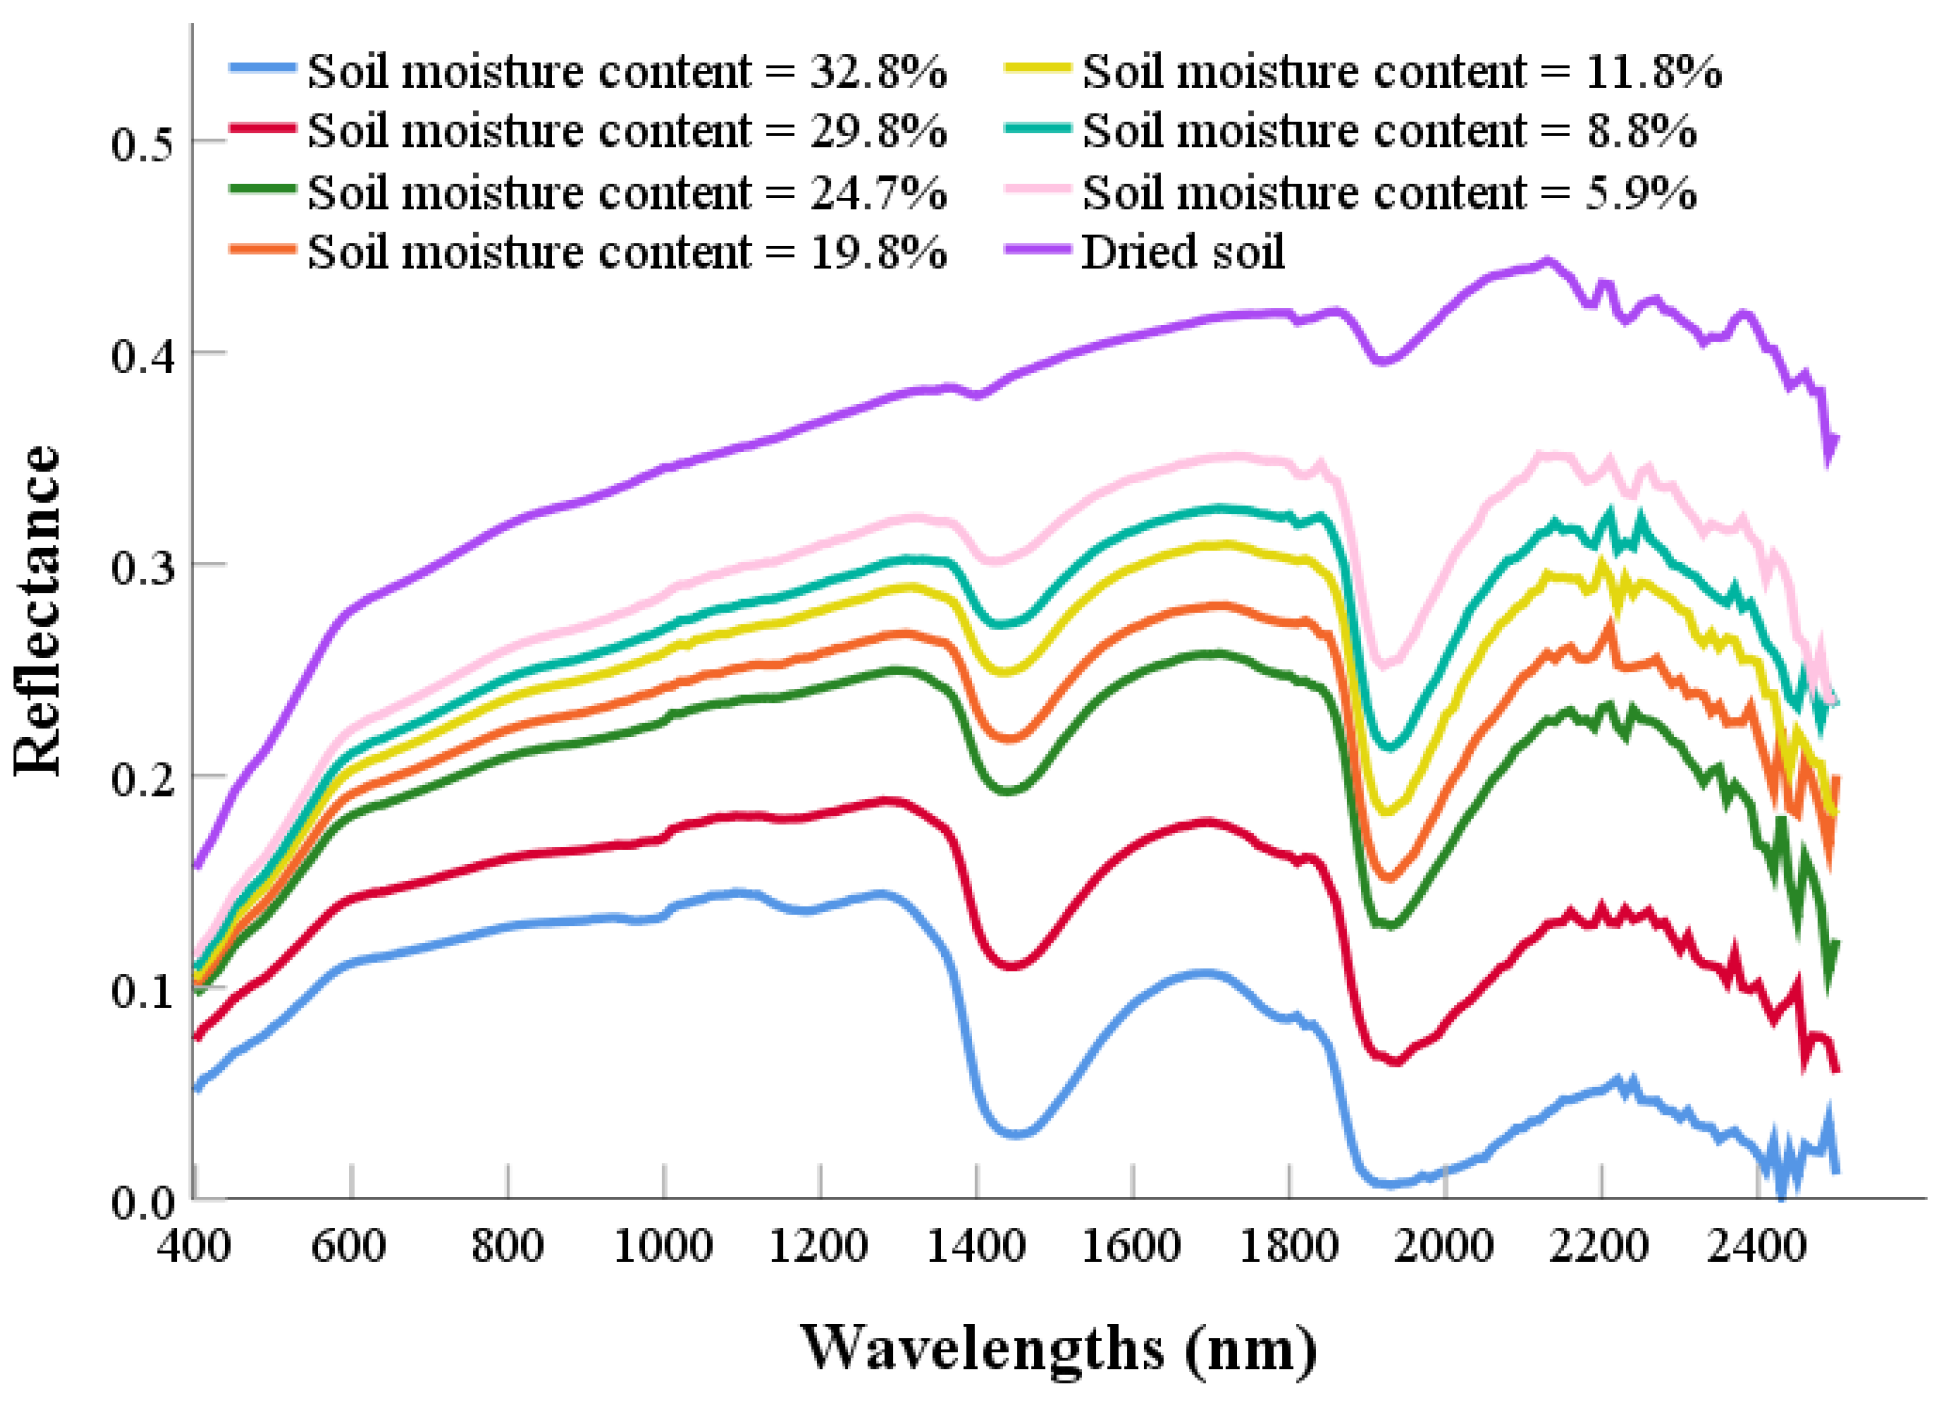
3.1. Effect of Soil Moisture on Its Spectra

To analyze the interference of soil moisture on soil spectra, artificial gradient moisture content soil samples were selected for spectral measurement. Their moisture content range was from 0.47% to 32.8%; these samples represented the water situations from extreme drought to saturation. In addition, the effect of the soil moisture on the spectrum was presented (Figure 2). The results showed that soil reflectance basically declines with the increase in soil moisture content in the VIS-NIR band (400–2500 nm). The soil moisture spectra had two absorption peaks at around 1400 nm and 1900 nm [58,59,60]. With the increase in the soil moisture, the intensity of absorption particularly increased in these two bands [61]. R.A. Viscarra Rossel mentioned that this phenomenon is caused by fundamental absorption by OH groups in water molecules [44]. With the increase in the soil moisture content, the number of OH groups increased and, thereby, the absorption quantity increased. In the end, the absorption peaks became deepened, as shown in Figure 3.
At the beginning of the field of soil moisture spectra research, Idso proposed that there was a linear relationship between soil reflectance and soil moisture content [62]. However, Liu Weidong proposed that the linear relationship was poorly fitted for higher moisture levels, and this view of the linear relationship was eventually overturned [63].

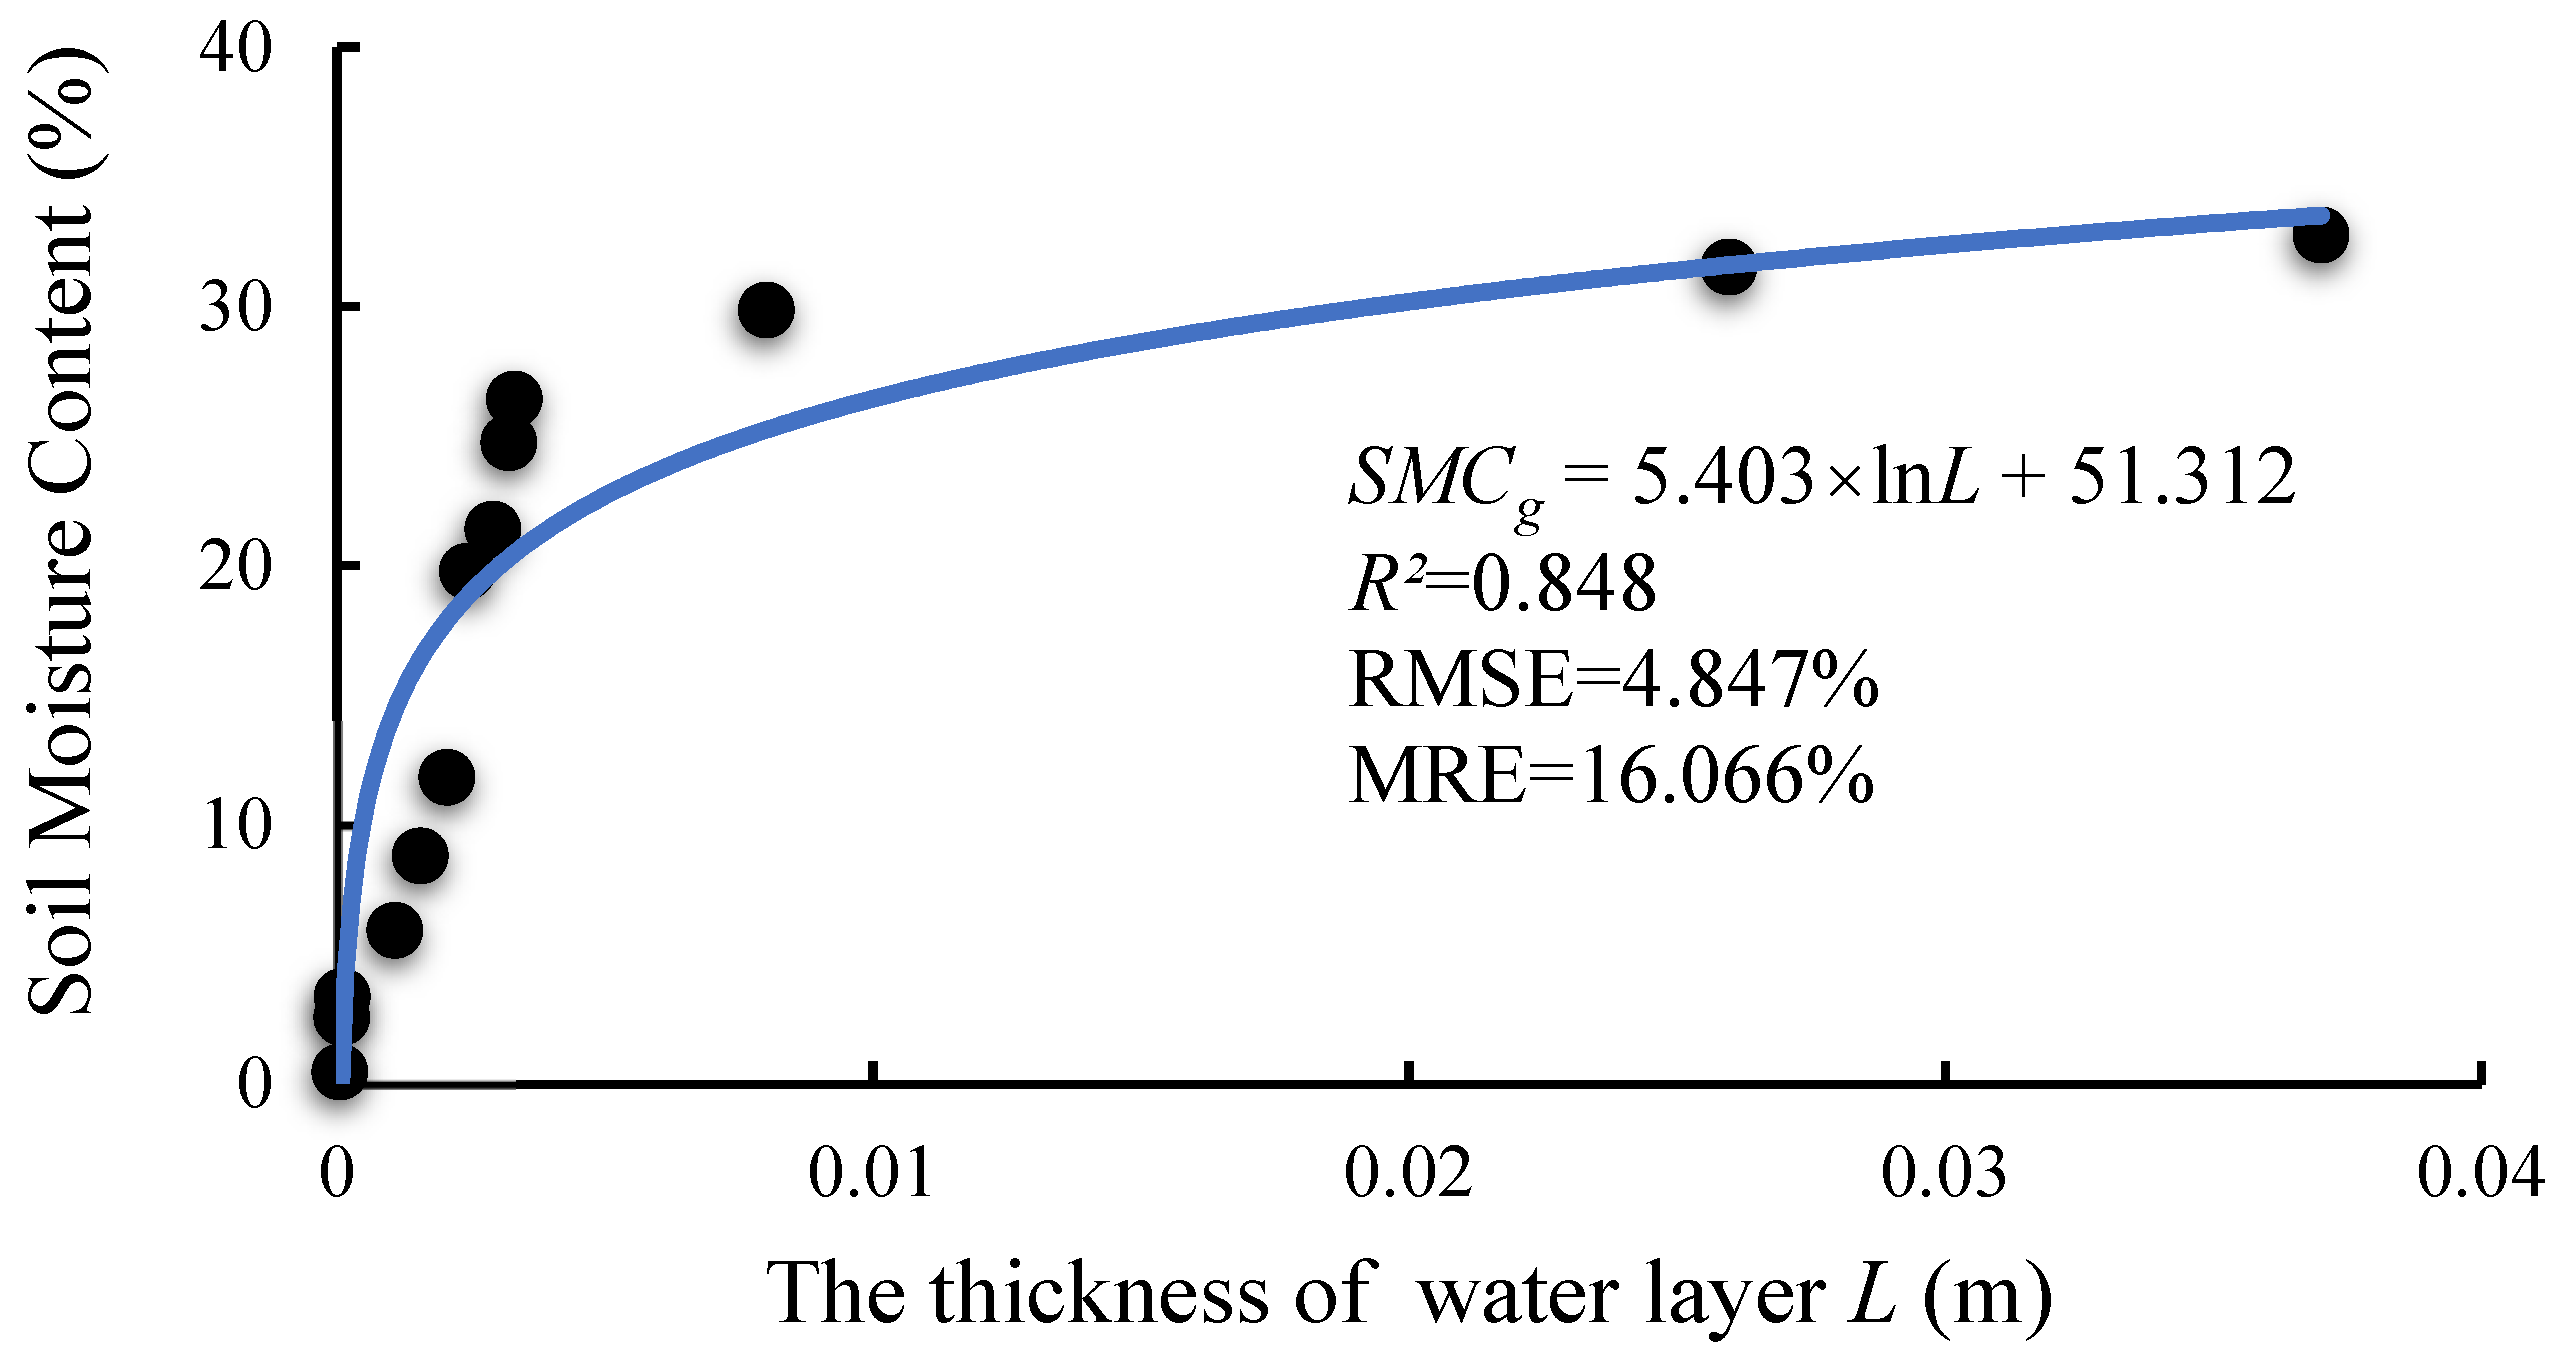
3.2. Modeling of the Soil Moisture Estimation

Our goal was to predict soil moisture content using the soil reflectance spectra. However, the L, which was the thickness of the effective water layer, was an imaginary variable and cannot be measured in the real world. Therefore, we used the manufactured gradient moisture content dataset to simulate reflectance; then, the thickness of the effective water layer was calculated by using Formula (5). The scattering plot between the SMCg and L is shown in Figure 4. The thickness of the water layer firstly increased with the soil moisture content at a rapid speed, and then, the growth rate gradually fell as the soil moisture became closer to saturation.
The statistical relationship between SMCg and L was established through regression analysis. We found that the logarithm function was best fitted. The formula can be written as followed:
S M C g = 51.312 + 5.403 × ln L
where L is the thickness of water layer and SMCg is the soil moisture content. In this experiment, 51.312 and 5.403 were the specific parameters determined by soil properties. Then, we used the correlation coefficient R², RMSE, and MRE to evaluate the accuracy of the model. In addition, the R², RMSE, and MRE were 0.848, 4.847%, and 16.066%, respectively. The scatter plot and the fitting curve are shown in the Figure 4.
To verify the accuracy, the R² and RMSE between the predicted SMCg and measured SMCg are shown in Figure 5. The R² and RMSE of this method were 0.847 and 4.847%, respectively. This method proved to be effective in predicting the gradient soil moisture content without the interference of other soil properties.

3.3. Effects of Soil Organic Matter on Its Spectrum

The radiative transfer model was a good choice for simulating the soil spectrum under varying conditions. To verify the accuracy of the multilayer radiative transfer established above, the reflectance of sixteen samples was simulated and the correlation coefficient between the measured and predicted reflectance was calculated. The results are shown in the Table 2. Compared with the simulated and measured reflectance, most of the correlation coefficients range from 0.8 to 1.0. Then, the average of the RMSE and MRE between the simulated and measured reflectance was calculated. The average, maximum, and minimum values of the RMSE were 0.0563%, 0.0839%, and 0.0268%, respectively. The average, maximum, and minimum values of the MRE were 38.774%, 72.758%, and 9.514%, respectively. The results indicate that this model can be used to explain light transmission in soil moisture.
To specify the effects of soil organic matter on the spectra, we used the real soil moisture content to calculate the corresponding water layer thickness based on the method mentioned above. Then, soil reflectance corresponding to the soil moisture content was simulated using the multilayer radiative transform theory shown above. The simulated soil reflectance was considered as a spectrum of soil with the influence of soil moisture only. The comparation between the measured and simulated reflectance with the same soil moisture can show the effects of soil organic matter on the reflected spectra.
Five selected soil samples and their simulated reflectance values with the same soil moisture were presented in the Figure 6. The Rmodn represented the simulated reflectance of the nth sample and Rn represented the measured reflectance of the nth. The difference between the measured and simulated reflectance was significant. Compared with the simulated reflectance, the measured reflectance was notably smaller than the simulated results in the full bands. In addition, the simulated absorption peaks at 1400 nm and 1900 nm were notably shallower than the measured ones. Apart from the simulated error, the difference mainly came from the difference in soil properties. The biggest difference between the two soil properties was whether they contained organic matter, and the main question was whether this affected their place on the soil reflection spectrum. The answer to this was yes. The soil organic matter made the soil reflectance dark. This result is consistent with the previous study. Moslem Ladoni mentioned that the higher the content of organic matter that exists in the soil, the darker the soil appears. In addition, the soil organic matter decreases overall reflectance and thereby improves the difficulty of measuring other soil properties [64].
The soil reflectance spectra showed two absorption peaks at around 1400 nm and 1900 nm, as the characteristic bands of soil moisture, corresponding to the characteristic bands of soil moisture. However, compared with the manufactured gradient soil moisture content presented in Figure 3, Figure 6 shows soils with generally consistent moisture content and different organic matters showed a complex spectral trend. Their spectral performance on the full bands varies with the content of soil organic matter.
Meanwhile, another five soil samples with similar soil moisture and various soil organic matters were selected, and the reflectance was plotted in Figure 7. Soil samples with different organic matter contents showed absorption characteristics in divergent bands. Figure 7 shows that the effect of SOM was smaller at wavelengths lower that 900 nm, compared with wavelengths higher than 900 nm. In addition, this effect caused by SOM varied band-by-bands. However, this effect was not noted at around 1900 nm. The results also show that 1930 nm was a spectral feature of soil organic matter; the soil reflectance tended to decrease with the increase in soil organic content. The main reason for this is that it corresponds to the effects of the C=O functional group in carboxylic acid [44]. Figure 7 also indicates that the SOM affected the soil reflectance and led to the decreasing trend found in the soil spectrum, in which the soil moisture gradient was disturbed.
Owing to the disturbance of organic matter, the predicted value of soil moisture content is, thus, not as accurate as before. To conclude, both SOM and SMCg have a negative effect on soil reflectance; the higher contents of soil moisture and soil organic matter are both related to the lower reflectance, showing a synergistic effect. Their cooperation possibly leads to a higher predicted soil moisture content. Therefore, a generalized measurement of soil moisture considering the influence of soil organic matter can result in an inferior measurement accuracy.

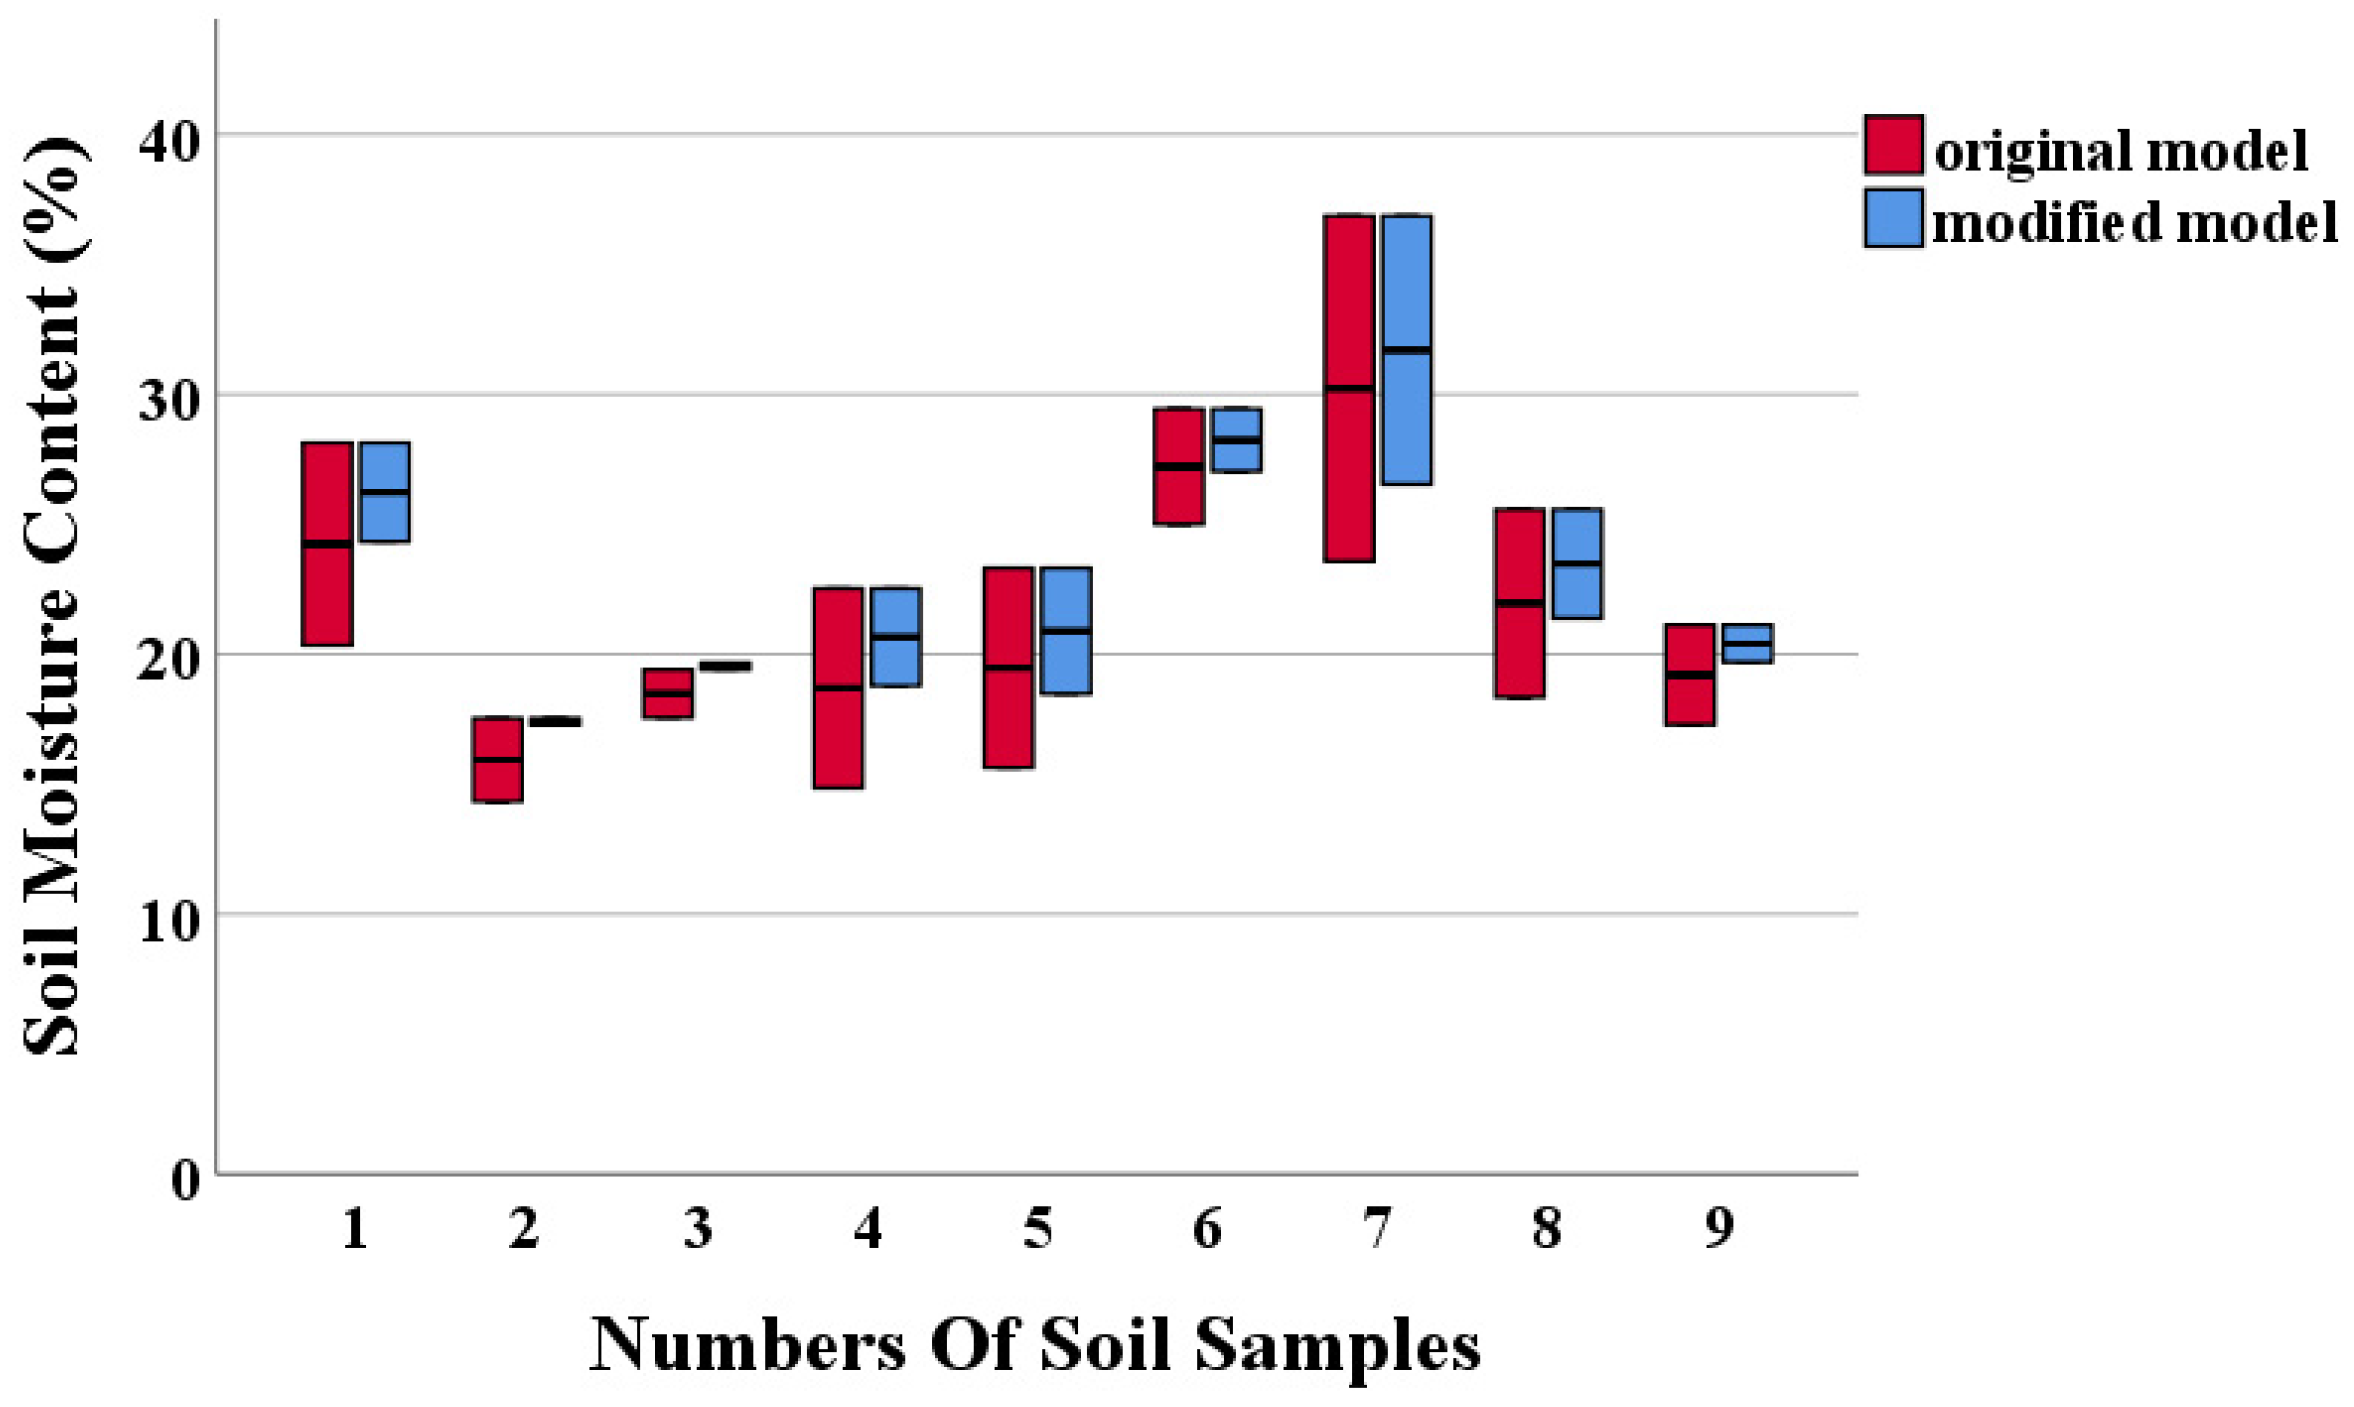
3.4. A modified Model for SMCg Prediction

During field investigation, it is impossible that the experimental conditions are as satisfactory as those in the laboratory. As a main component of the soil, soil organic matter definitely varied in different regions, and various soil organic matters affect the soil reflectance at varying degrees, and this effect reduces the accuracy of the soil moisture estimation based on the soil reflectance [53,65,66].
Our method focused on the attenuation process of light in the water layer, which refers to the absorption ability of soil organic matter. The absorption coefficient had a linear relationship with the concentration of the specific solution based on the Lambert–Beer law. Limited by reality, the absorption coefficient of soil organic matter cannot be measured accurately due to the uncertainty of the composition of the soil organic matter. For convenience, the content of the soil organic matter was used to replace the soil organic matter dissolved in water. In addition, the logarithm of SOM was applied to replace the dissolved SOM, which contributes to a novel absorption coefficient of soil by using the Formula (9). The absorption coefficient represents the absorption capacity of soil moisture while considering the effect of the soil organic matter. Higher organic matter content meant a stronger ability of light absorption. Thus, the effects of soil organic matter on the radiative transfer model were successfully taken into consideration during the soil moisture content estimation.
A better fitting result can be obtained between the measured reflectance and the modelling reflectance after the calibration step of the absorption coefficient. A new logarithmic equation was established between SMCg, L, and SOM,
S M C g = 59.359 + 6.778 × ln ( L × log ( S O M ) )
where L was the thickness of water layer, SMCg was the soil moisture content, and SOM was the content of the soil organic matter. In addition, 6.778 and 59.359 were the specific parameters fitted by the different soil properties. The determination coefficient was 0.767. The RMSE and MRE were 1.62% and 6.53%, respectively (Figure 8). The modification of the absorption coefficient, the thicker water layer, and the new curve refitting processes were added to the traditional approach. Thus, SMCg under various soil organic contents can be predicted.
To validate the accuracy of the modified model, several evaluation indexes ( R 2 ,   R M S E ,   R M E ) were employed to compare the performances of two models. In addition, the comparation results are shown in Table 3.
When the soil moisture content was estimated using the model established in Section 3.2, the R² between the estimated and measured result was only 0.607, and RMSE and MRE were 5.61% and 21.87% (Figure 9a). In addition, the estimated results showed an underestimation of the soil moisture content. The reason for this may be that the organic matter existing in the soil disturbed the sensitivity of the soil reflectance spectrum in its moisture content. Compared with the results from the measurements which did not consider the soil organic matter, a multi-factor model performed better. The R² was 0.767, while the RMSE and MRE were 1.62% and 6.53% (Figure 9b), respectively. The estimated results were closer to the measured data, and the MRE was reduced by 2.35 times.
The box plot was also assigned to present the accuracy of the modified model (Figure 10). The length of the blue column was the distance between the measured SMCg and the predicted SMCg using the original model, and the red column was that of the modified model. The shorter column meant the lower error between the measured SMCg and predicted SMCg. We randomly choose eight soil samples in our experiment. In addition, the results showed the precision of all samples was improved. With shorter red columns, the modified model can guarantee a better accuracy for the predicted SMCg under various organic matter soils.

4. Discussion

4.1. The Effects of Soil Reflectance Spectra

Soil moisture is an important factor affecting the hydrologic cycle in land–atmosphere interactions and regulates the net ecosystem exchange [1,2]. Soil moisture also contributes to global vegetation primary production and the inter-annual carbon cycle [4]. At the same time, soil moisture affects evapotranspiration and atmospheric moisture fluxes, determines vegetation growth, and affects the agriculture production [5].
Therefore, it is important to monitor soil moisture in the terrestrial water cycle and ecosystem, especially to obtain spatial and temporal soil moisture data.
With the development of hyperspectral remote sensing technology, the soil moisture content prediction using VIS-NIR (400–2500 nm) remote sensing had already received extensive attention for its fast speed and convenience. While studying the contribution of soil moisture to spectra, it is the common view that the soil reflectance basically decreases with the increase in soil moisture content in the VIS-NIR band (400–2500 nm), and there are two major absorption peaks around 1400 nm and 1900 nm caused by the strong absorption of OH groups existing in water [64]. In addition, these results were consistent with our research, as shown in Figure 3. The absorption peak of the soil moisture spectrum made it possible to measure SMCg through optical remote sensing [67,68].
Although previous research reached an agreement on the performance of soil moisture spectra, the spectral features of soil organic matter were rather complex to determine. Opinions were widely divided regarding the feature bands of soil organic matter. Qinghu Jiang mentioned that the prominent absorption peaks of organic matter are presented at around 1420 nm, 1950 nm, and 2200 nm [69]. Lee attributed 2243 nm, 2246 nm, 2483 nm, and 2486 nm to the featured bands of soil organic carbon [70]. R.A. Viscarra Rossel, in his review, postulated that different kinds of organic matter showed various absorption peaks for their different overtones and combinations in the VIS-NIR bands [44]. Specific soil reflectance turned out to be related to the specific organic components at specific wavelengths for their various functional groups [71]. In this paper, a spectral feature of soil organic matter at the wavelength of the 1930 nm and the absorption depth changed with the variety in the content of the soil organic matter. This spectral feature corresponded to the effects of the C=O functional group in carboxylic acid [44]. We also found that soil reflectance tends to decrease as soil organic content increases when SMCg is at the same level. The absorption effect of the C=O functional groups in 1930 nm band is thus concluded.
Generally, the higher content of organic matter in soils led to a darker surface with a lower reflection and stronger absorption of the light [72]. Al-Abbas noticed that soil reflectance had a significant negative relationship with soil organic matter [73]. Similarly, Figure 6 in our article showed that the simulated reflectance without the interfere of soil organic matter was rather higher than the measured reflectance, which demonstrated that the existence of soil organic matter caused a decrease in reflectance in the VIS-NIR (400–2500 nm) bands. This result was consistent with the conclusion of Alexandre’s research [74]. Various functional groups in organic matter caused multitude absorption features of the spectra, leading to the overall decline of soil reflectance. In addition, it could thus be a better choice that all bands are used to calculate the effects of soil organic matter on spectra.
Although the effects of soil organic matter on soil were not as strong as that of the soil moisture spectra, the existing soil organic matter partly masked the performance of soil moisture spectra. In addition, this phenomenon leads to an irregular disturbance on the soil spectrum and it increases the difficulty of the soil moisture retrieval using the surface reflectance spectrum. Thereby, an inaccurate predicted value of SMCg is shown in Figure 9a. Compared with the gradient moisture data, the correlation coefficient R² dropped from 0.847 to 0.607, and RMSE raised from 4.84% to 5.61%. This shows that various soil properties, such as soil type, soil salt content, and soil organic matter, led to the disturbance of the soil reflectance spectrum and the SMCg prediction. Therefore, it was important to propose a method of SMCg estimation which considers the existence of other soil properties.

4.2. A general Model to Predict SMCg

In previous research, Somers introduced an exponential model to predict SMCg, and he found that soil organic matter had the strongest relationship with the absorption coefficient of water among various soil properties. The accuracy of the prediction model improved immensely with R² from 0.59 to 0.82 when a calibration of the specific absorption coefficient related to SOM was executed [75].
In this study, we verified this assumption and further developed a multilayer radiative transform model based on this assumption. This was a radiative transfer method based on the absorption of light energy passing though the water layer in soil, which was also one of the most commonly used methods. An apparent default for this method was that there was an intermediate variable L linking soil moisture and reflectance. The thickness of water layer L was fitted by using spectral data, and a math step to build the relationship between L and SMCg was processed. Then, the SMCg was estimated by using the model established between L and SMCg. It could be more convenient if we directly obtained the SMCg from spectra data. Muller suggested that an attenuation factor a s ( λ ) could be used replace the standard absorption coefficient. Thus, L could be replaced by SMCg and this SMCg can be predicted by using the exponent model [76]. This idea showed an improvement in the SMCg-estimating model which can be referred to in future studies.
In addition, we modified the absorption coefficient soil according to their organic matter content and a new absorption coefficient based on the Lambert–Beer law was used. Therefore, an SMCg prediction model considering soil organic matter was derived. The SMCg prediction results were satisfactory, with a high accuracy based on modified model. The method performed well with the coefficient of R² determination, arriving 0.767. Using RMSE and MRE as the evaluation criterions, their values were 1.62% and 6.53%, respectively. The accuracy of the model significantly improved, in contrast with the traditional approach. However, compared with the gradient SMCg data, the accuracy of the model still needed to be improved. Nevertheless, this modified model showed the advantage that the SOM was considered as an interfering factor and the impact of the SOM can be mitigated during the SMCg estimation. However, it was noteworthy that these soil moisture estimation methods using spectral reflectance were widely used on bare soils [18,77]. In addition, the relationship between soil reflectance and soil moisture was commonly data-dependent and easily affected by vegetation covers, soil texture, surface roughness, and soil physical components [78]. To overcome these limitations, the normalized form of transforming of two or more spectral reflections was developed for soil moisture mapping. The normalized difference vegetation index (NDVI) was used to infer the soil moisture condition. In addition, some indices were developed for soil drought monitoring and had an ability to infer soil moisture conditions. Ghulam et al. developed a modified perpendicular drought index (MPDI) to monitor soil moisture using fractional vegetation cover for the removal of vegetation information and Tao, et al. modified this model [27,79]. This is similar to using a red and NIR spectral feature space to investigate the soil moisture over vegetation areas [18].
In sum, the prime objective of this paper was to build a general model for predicting soil moisture content based on the multilayer radiative transfer model. The results showed that the multilayer radiative transfer model is an effective and convenient method for describing the light transmission process in soil, making it easy to describe the impact of soil properties on the reflected soil spectrum. In this search, we applied this radiative transfer method to develop an SMCg-estimating model which considers the effect of soil organic matter on its reflectance. In addition, the results indicated that the effect of the soil organic matter cannot be ignored, as the SMCg estimation was performed at various contents of the soil organic matter. A modified model of soil moisture estimation was proposed, and the accuracy of the soil moisture estimated was acceptable. Compared with the statistical model, the parameter-fitting process can be omitted, which is considered the shortcoming for most models [34,38]. In addition, this research can provide a reference for SMCg estimation with various soil properties using VIS-NIR remote sensing.

5. Conclusions

In this work, a multilayer radiative transform model is proposed to estimate the soil moisture content while considering a variety of soil organic matters. Then, laboratory data were used to validate the accuracy of the modified model; the conclusions followed.
(1) Water in the soil showed a significant spectral feature, especially for 1400 nm and 1900 nm. In addition, the soil surface is darker as the soil moisture increases. Most previous studies indicated that these spectral features can be used to estimate soil moisture with a good accuracy.
(2) The existence of soil organic matter shows up as being darked regarding the soil reflectance. This feature was similar to the soil moisture. However, the influence of the soil organic matter on soil reflectance overlaps with the effect of soil moisture on its reflected spectrum. This can lead to the underestimation of the soil moisture content. Therefore, the effect of the soil organic matter reduces the accuracy of soil moisture estimation and increases the error rate and uncertainty of the estimation results.
(3) The multilayer radiative transform model provides an effective method for predicting SMCg with strong interpretability and transferability. In this research, we promoted a modified SMCg-estimating model which was developed by radiative transform theory while considering the effect of the soil organic matter. The accuracy of the soil moisture estimation was increased, with MRE decreasing from 21.87% to 6.53%.

Author Contributions

X.Y. conceived and designed the experiments; T.L. and T.M. performed the experiments and analyzed the data; T.L., T.M., G.Z. and C.S. collected the materials; X.Y. and T.L. wrote the paper; X.Y. and G.L. reviewed and edited the paper. All authors have read and agreed to the published version of the manuscript.

Funding

This research was funded by the National Natural Science Foundation of China, grant number 31971580, 31870621; the Fundamental Research Funds for the Central Universities of China, grant number 2572019BA10, 2572021BA08, 2572019CP12; the China Postdoctoral Science Foundation, grant number 2019M661239. National Undergraduate Training Programs for Innovations, grant number 202110225089.

Data Availability Statement

Not applicable.

Conflicts of Interest

The authors declare no conflict of interest.

References

  1. McColl, K.A.; Alemohammad, S.H.; Akbar, R.; Konings, A.G.; Yueh, S.; Entekhabi, D. The global distribution and dynamics of surface soil moisture. Nat. Geosci. 2017, 10, 100–104. [Google Scholar] [CrossRef]
  2. Dorigo, W.; Wagner, W.; Albergel, C.; Albrecht, F.; Balsamo, G.; Brocca, L.; Chung, D.; Ertl, M.; Forkel, M.; Gruber, A.; et al. ESA CCI Soil Moisture for improved Earth system understanding: State-of-the art and future directions. Remote Sens. Environ. 2017, 203, 185–215. [Google Scholar] [CrossRef]
  3. Ochsner, T.E.; Cosh, M.H.; Cuenca, R.H.; Dorigo, W.A.; Draper, C.S.; Hagimoto, Y.; Kerr, Y.H.; Larson, K.M.; Njoku, E.G.; Small, E.E.; et al. State of the Art in Large-Scale Soil Moisture Monitoring. Soil Sci. Soc. Am. J. 2013, 77, 1888–1919. [Google Scholar] [CrossRef] [Green Version]
  4. Stocker, B.D.; Zscheischler, J.; Keenan, T.F.; Prentice, I.C.; Seneviratne, S.I.; Penuelas, J. Drought impacts on terrestrial primary production underestimated by satellite monitoring. Nat. Geosci. 2019, 12, 264. [Google Scholar] [CrossRef]
  5. Zhou, S.; Williams, A.P.; Lintner, B.R.; Berg, A.M.; Zhang, Y.; Keenan, T.F.; Cook, B.I.; Hagemann, S.; Seneviratne, S.I.; Gentine, P. Soil moisture-atmosphere feedbacks mitigate declining water availability in drylands. Nat. Clim. Chang. 2021, 11, 38–44. [Google Scholar] [CrossRef]
  6. Gnatowski, T.; Szatyłowicz, J.; Pawluśkiewicz, B.; Oleszczuk, R.; Janicka, M.; Papierowska, E.; Szejba, D. Field calibration of TDR to assess the soil moisture of drained peatland surface layers. Water 2018, 10, 1842. [Google Scholar] [CrossRef] [Green Version]
  7. Noborio, K.; McInnes, K.J.; Heilman, J.L. Measurements of soil water content, heat capacity, and thermal conductivity with a single TDR probe. Soil Sci. 1996, 161, 22–28. [Google Scholar] [CrossRef]
  8. Jackson, T.; Mansfield, K.; Saafi, M.; Colman, T.; Romine, P. Measuring soil temperature and moisture using wireless MEMS sensors. Measurement 2008, 41, 381–390. [Google Scholar] [CrossRef]
  9. Dorigo, W.A.; Wagner, W.; Hohensinn, R.; Hahn, S.; Paulik, C.; Xaver, A.; Gruber, A.; Drusch, M.; Mecklenburg, S.; van Oevelen, P.; et al. The International Soil Moisture Network: A data hosting facility for global in situ soil moisture measurements. Hydrol. Earth Syst. Sci. 2011, 15, 1675–1698. [Google Scholar] [CrossRef] [Green Version]
  10. Mulder, V.L.; de Bruin, S.; Schaepman, M.E.; Mayr, T.R. The use of remote sensing in soil and terrain mapping—A review. Geoderma 2011, 162, 1–19. [Google Scholar] [CrossRef]
  11. Li, W.; Liu, C.; Yang, Y.; Awais, M.; Ying, P.; Ru, W.; Cheema, M. A UAV-aided prediction system of soil moisture content relying on thermal infrared remote sensing. Int. J. Environ. Sci. Technol. 2022, 1–14. [Google Scholar] [CrossRef]
  12. Yang, X.; Yu, Y.; Li, M. Estimating soil moisture content using laboratory spectral data. J. For. Res. 2019, 30, 1073–1080. [Google Scholar] [CrossRef]
  13. Dong, J.; Crow, W.T.; Tobin, K.J.; Cosh, M.H.; Bosch, D.D.; Starks, P.J.; Seyfried, M.; Collins, C.H. Comparison of microwave remote sensing and land surface modeling for surface soil moisture climatology estimation. Remote Sens. Environ. 2020, 242, 111756. [Google Scholar] [CrossRef]
  14. Babaeian, E.; Sadeghi, M.; Jones, S.B.; Montzka, C.; Vereecken, H.; Tuller, M. Ground, Proximal, and Satellite Remote Sensing of Soil Moisture. Rev. Geophys. 2019, 57, 530–616. [Google Scholar] [CrossRef] [Green Version]
  15. Gerhards, M.; Schlerf, M.; Mallick, K.; Udelhoven, T. Challenges and Future Perspectives of Multi-/Hyperspectral Thermal Infrared Remote Sensing for Crop Water-Stress Detection: A Review. Remote Sens. 2019, 11, 1240. [Google Scholar] [CrossRef] [Green Version]
  16. Huang, S.; Ding, J.; Zou, J.; Liu, B.; Zhang, J.; Chen, W. Soil moisture retrival based on sentinel-1 imagery under sparse vegetation coverage. Sensors 2019, 19, 589. [Google Scholar] [CrossRef] [Green Version]
  17. Zhao, T.; Shi, J.; Lv, L.; Xu, H.; Chen, D.; Cui, Q.; Jackson, T.J.; Yan, G.; Jia, L.; Chen, L.; et al. Soil moisture experiment in the Luan River supporting new satellite mission opportunities. Remote Sens. Environ. 2020, 240, 111680. [Google Scholar] [CrossRef]
  18. Li, Z.-L.; Leng, P.; Zhou, C.; Chen, K.-S.; Zhou, F.-C.; Shang, G.-F. Soil moisture retrieval from remote sensing measurements: Current knowledge and directions for the future. Earth-Sci. Rev. 2021, 218, 103673. [Google Scholar] [CrossRef]
  19. Zhang, D.J.; Zhou, G.Q. Estimation of Soil Moisture from Optical and Thermal Remote Sensing: A Review. Sensors 2016, 16, 1308. [Google Scholar] [CrossRef] [Green Version]
  20. Fabre, S.; Briottet, X.; Lesaignoux, A. Estimation of Soil Moisture Content from the Spectral Reflectance of Bare Soils in the 0.4–2.5 µm Domain. Sensors 2015, 15, 3262–3281. [Google Scholar] [CrossRef]
  21. Oltra-Carrio, R.; Baup, F.; Fabre, S.; Fieuzal, R.; Briottet, X. Improvement of Soil Moisture Retrieval from Hyperspectral VNIR-SWIR Data Using Clay Content Information: From Laboratory to Field Experiments. Remote Sens. 2015, 7, 3184–3205. [Google Scholar] [CrossRef] [Green Version]
  22. Chen, T.; de Jeu, R.A.M.; Liu, Y.Y.; van der Werf, G.R.; Dolman, A.J. Using satellite based soil moisture to quantify the water driven variability in NDVI: A case study over mainland Australia. Remote Sens. Environ. 2014, 140, 330–338. [Google Scholar] [CrossRef]
  23. Petropoulos, G.P.; Ireland, G.; Barrett, B. Surface soil moisture retrievals from remote sensing: Current status, products & future trends. Phys. Chem. Earth Parts A/B/C 2015, 83, 36–56. [Google Scholar] [CrossRef]
  24. Haubrock, S.N.; Chabrillat, S.; Lemmnitz, C.; Kaufmann, H. Surface soil moisture quantification models from reflectance data under field conditions. Int. J. Remote Sens. 2008, 29, 3–29. [Google Scholar] [CrossRef]
  25. Haubrock, S.N.; Chabrillat, S.; Kuhnert, M.; Hostert, P.; Kaufmann, H. Surface soil moisture quantification and validation based on hyperspectral data and field measurements. J. Appl. Remote Sens. 2008, 2, 023552. [Google Scholar] [CrossRef] [Green Version]
  26. Ghulam, A.; Qin, Q.M.; Zhan, Z.M. Designing of the perpendicular drought index. Environ. Geol. 2007, 52, 1045–1052. [Google Scholar] [CrossRef]
  27. Ghulam, A.; Qin, Q.M.; Teyip, T.; Li, Z.L. Modified perpendicular drought index (MPDI): A real-time drought monitoring method. ISPRS J. Photogramm. Remote Sens. 2007, 62, 150–164. [Google Scholar] [CrossRef]
  28. Tsai, Y.Z.; Hsu, K.S.; Wu, H.Y.; Lin, S.I.; Yu, H.L.; Huang, K.T.; Hu, M.C.; Hsu, S.Y. Application of Random Forest and ICON Models Combined with Weather Forecasts to Predict Soil Temperature and Water Content in a Greenhouse. Water 2020, 12, 1176. [Google Scholar] [CrossRef] [Green Version]
  29. de Oliveira, V.A.; Rodrigues, A.F.; Morais, M.A.V.; Terra, M.; Guo, L.; de Mello, C.R. Spatiotemporal modelling of soil moisture in an Atlantic forest through machine learning algorithms. Eur. J. Soil Sci. 2021, 72, 1969–1987. [Google Scholar] [CrossRef]
  30. Sanuade, O.A.; Hassan, A.M.; Akanji, A.O.; Olaojo, A.A.; Oladunjoye, M.A.; Abdulraheem, A. New empirical equation to estimate the soil moisture content based on thermal properties using machine learning techniques. Arab. J. Geosci. 2020, 13, 377. [Google Scholar] [CrossRef]
  31. Morellos, A.; Pantazi, X.E.; Moshou, D.; Alexandridis, T.; Whetton, R.; Tziotzios, G.; Wiebensohn, J.; Bill, R.; Mouazen, A.M. Machine learning based prediction of soil total nitrogen, organic carbon and moisture content by using VIS-NIR spectroscopy. Biosyst. Eng. 2016, 152, 104–116. [Google Scholar] [CrossRef] [Green Version]
  32. Ahmad, S.; Kalra, A.; Stephen, H. Estimating soil moisture using remote sensing data: A machine learning approach. Adv. Water Resour. 2010, 33, 69–80. [Google Scholar] [CrossRef]
  33. Liu, H.J.; Zhang, Y.Z.; Zhang, X.L.; Zhang, B.; Song, K.S.; Wang, Z.M.; Tang, N. Quantitative Analysis of Moisture Effect on Black Soil Reflectance. Pedosphere 2009, 19, 532–540. [Google Scholar] [CrossRef]
  34. Bablet, A.; Vu, P.V.H.; Jacquemoud, S.; Viallefont-Robinet, F.; Fabre, S.; Briottet, X.; Sadeghi, M.; Whiting, M.L.; Baret, F.; Tian, J. MARMIT: A multilayer radiative transfer model of soil reflectance to estimate surface soil moisture content in the solar domain (400–2500 nm). Remote Sens. Environ. 2018, 217, 1–17. [Google Scholar] [CrossRef] [Green Version]
  35. Philpot, W. Spectral reflectance of wetted soils. Proc. ASD IEEE GRS 2010, 2, 1–12. [Google Scholar] [CrossRef]
  36. Bach, H.; Mauser, W. Modelling and model verification of the spectral reflectance of soils under varying moisture conditions. In Proceedings of the IEEE International Geoscience and Remote Sensing Symposium-1994, Pasadena, CA, USA, 8–12 August 1994; pp. 2354–2356. [Google Scholar]
  37. Ou, D.; Tan, K.; Wang, X.; Wu, Z.; Li, J.; Ding, J. Modified soil scattering coefficients for organic matter inversion based on Kubelka-Munk theory. Geoderma 2022, 418, 115845. [Google Scholar] [CrossRef]
  38. Sadeghi, M.; Jones, S.B.; Philpot, W.D. A linear physically-based model for remote sensing of soil moisture using short wave infrared bands. Remote Sens. Environ. 2015, 164, 66–76. [Google Scholar] [CrossRef]
  39. Hapke, B. Bidirectional reflectance spectroscopy: 1. Theory. J. Geophys. Res. Solid Earth 1981, 86, 3039–3054. [Google Scholar] [CrossRef]
  40. Yang, G.J.; Zhao, C.J.; Huang, W.J.; Wang, J.H. Extension of the Hapke bidirectional reflectance model to retrieve soil water content. Hydrol. Earth Syst. Sci. 2011, 15, 2317–2326. [Google Scholar] [CrossRef] [Green Version]
  41. Dupiau, A.; Jacquemoud, S.; Briottet, X.; Fabre, S.; Viallefont-Robinet, F.; Philpot, W.; Di Biagio, C.; Hébert, M.; Formenti, P. MARMIT-2: An improved version of the MARMIT model to predict soil reflectance as a function of surface water content in the solar domain. Remote Sens. Environ. 2022, 272, 112951. [Google Scholar] [CrossRef]
  42. Soriano-Disla, J.M.; Janik, L.J.; Rossel, R.A.V.; Macdonald, L.M.; McLaughlin, M.J. The Performance of Visible, Near-, and Mid-Infrared Reflectance Spectroscopy for Prediction of Soil Physical, Chemical, and Biological Properties. Appl. Spectrosc. Rev. 2014, 49, 139–186. [Google Scholar] [CrossRef]
  43. Ben-Dor, E.; Banin, A. Near-Infrared Analysis as a Rapid Method to imultaneously Evaluate Several Soil Properties. Soil Sci. Soc. Am. J. 1995, 59, 364–372. [Google Scholar] [CrossRef]
  44. Rossel, R.A.V.; Behrens, T. Using data mining to model and interpret soil diffuse reflectance spectra. Geoderma 2010, 158, 46–54. [Google Scholar] [CrossRef]
  45. Sithole, N.J.; Ncama, K.; Magwaza, L.S. Robust Vis-NIRS models for rapid assessment of soil organic carbon and nitrogen in Feralsols Haplic soils from different tillage management practices. Comput. Electron. Agric. 2018, 153, 295–301. [Google Scholar] [CrossRef]
  46. Miloš, B.; Bensa, A. Prediction of soil organic carbon using VIS-NIR spectroscopy: Application to Red Mediterranean soils from Croatia. Eurasian J. Soil Sci. 2017, 6, 365–373. [Google Scholar] [CrossRef]
  47. Islam, K.; Singh, B.; McBratney, A. Simultaneous estimation of several soil properties by ultra-violet, visible, and near-infrared reflectance spectroscopy. Aust. J. Soil Res. 2003, 41, 1101–1114. [Google Scholar] [CrossRef]
  48. Henderson, T.L.; Baumgardner, M.F.; Franzmeier, D.P.; Stott, D.E.; Coster, D.C. High Dimensional Reflectance Analysis of Soil Organic Matter. Soil Sci. Soc. Am. J. 1992, 56, 865–872. [Google Scholar] [CrossRef]
  49. Bian, J.; Nie, S.; Wang, R.; Wan, H.; Liu, C. Hydrochemical characteristics and quality assessment of groundwater for irrigation use in central and eastern Songnen Plain, Northeast China. Environ. Monit. Assess. 2018, 190, 382. [Google Scholar] [CrossRef]
  50. Robinson, D.A.; Campbell, C.S.; Hopmans, J.W.; Hornbuckle, B.K.; Jones, S.B.; Knight, R.; Ogden, F.; Selker, J.; Wendroth, O. Soil Moisture Measurement for Ecological and Hydrological Watershed-Scale Observatories: A Review. Vadose Zone J. 2008, 7, 358–389. [Google Scholar] [CrossRef] [Green Version]
  51. Su, S.L.; Singh, D.N.; Baghini, M.S. A critical review of soil moisture measurement. Measurement 2014, 54, 92–105. [Google Scholar] [CrossRef]
  52. Li, J.; Wen, Y.; Li, X.; Li, Y.; Yang, X.; Lin, Z.; Song, Z.; Cooper, J.M.; Zhao, B. Soil labile organic carbon fractions and soil organic carbon stocks as affected by long-term organic and mineral fertilization regimes in the North China Plain. Soil Tillage Res. 2018, 175, 281–290. [Google Scholar] [CrossRef] [Green Version]
  53. Yang, X.; Yu, Y. Estimating Soil Salinity Under Various Moisture Conditions: An Experimental Study. IEEE Trans. Geosci. Remote Sens. 2017, 55, 2525–2533. [Google Scholar] [CrossRef]
  54. Tuller, M.; Or, D.; Dudley, L.M. Adsorption and capillary condensation in porous media: Liquid retention and interfacial configurations in angular pores. Water Resour. Res. 1999, 35, 1949–1964. [Google Scholar] [CrossRef]
  55. Stern, F. Transmission of Isotropic Radiation Across an Interface between Two Dielectrics. Appl. Opt. 1964, 3, 111–113. [Google Scholar] [CrossRef]
  56. Stevens, A.; Nocita, M.; Tóth, G.; Montanarella, L.; van Wesemael, B. Prediction of soil organic carbon at the European scale by visible and near infrared reflectance spectroscopy. PLoS ONE 2013, 8, e66409. [Google Scholar] [CrossRef] [PubMed]
  57. Chen, Y.; Wang, J.; Liu, G.; Yang, Y.; Liu, Z.; Deng, H. Hyperspectral estimation model of forest soil organic matter in northwest Yunnan Province, China. Forests 2019, 10, 217. [Google Scholar] [CrossRef] [Green Version]
  58. Rodionov, A.; Pätzold, S.; Welp, G.; Pallares, R.C.; Damerow, L.; Amelung, W. Sensing of soil organic carbon using visible and near-infrared spectroscopy at variable moisture and surface roughness. Soil Sci. Soc. Am. J. 2014, 78, 949–957. [Google Scholar] [CrossRef]
  59. Rienzi, E.A.; Mijatovic, B.; Mueller, T.G.; Matocha, C.J.; Sikora, F.J.; Castrignanò, A. Prediction of soil organic carbon under varying moisture levels using reflectance spectroscopy. Soil Sci. Soc. Am. J. 2014, 78, 958–967. [Google Scholar] [CrossRef]
  60. Minasny, B.; McBratney, A.B.; Bellon-Maurel, V.; Roger, J.M.; Gobrecht, A.; Ferrand, L.; Joalland, S. Removing the effect of soil moisture from NIR diffuse reflectance spectra for the prediction of soil organic carbon. Geoderma 2011, 167–168, 118–124. [Google Scholar] [CrossRef] [Green Version]
  61. Roudier, P.; Hedley, C.B.; Lobsey, C.R.; Viscarra Rossel, R.A.; Leroux, C. Evaluation of two methods to eliminate the effect of water from soil vis–NIR spectra for predictions of organic carbon. Geoderma 2017, 296, 98–107. [Google Scholar] [CrossRef]
  62. Idso, S.B.; Jackson, R.D.; Reginato, R.J.; Kimball, B.A.; Nakayama, F.S. The Dependence of Bare Soil Albedo on Soil Water Content. J. Appl. Meteorol. Climatol. 1975, 14, 109–113. [Google Scholar] [CrossRef] [Green Version]
  63. Liu, W.; Baret, F.; Gu, X.; Tone, Q.; Zheng, L.; Zhang, B. Relating soil surface moisture to reflectance. Remote Sens. Environ. 2001, 81, 238–246. [Google Scholar] [CrossRef]
  64. Ladoni, M.; Bahrami, H.A.; Alavipanah, S.K.; Norouzi, A.A. Estimating soil organic carbon from soil reflectance: A review. Precis. Agric. 2010, 11, 82–99. [Google Scholar] [CrossRef]
  65. Ben-Dor, E.; Chabrillat, S.; Demattê, J.A.M. Characterization of Soil Properties Using Reflectance Spectroscopy; CRC Press: Boca Raton, FL, USA, 2011; pp. 513–558. [Google Scholar]
  66. Stenberg, B.; Viscarra Rossel, R.A.; Mouazen, A.M.; Wetterlind, J. Chapter Five—Visible and Near Infrared Spectroscopy in Soil Science. In Advances in Agronomy; Sparks, D.L., Ed.; Academic Press: Cambridge, MA, USA, 2010; Volume 107, pp. 163–215. [Google Scholar]
  67. Chakhar, A.; Hernandez-Lopez, D.; Ballesteros, R.; Moreno, M.A. Improvement of the Soil Moisture Retrieval Procedure Based on the Integration of UAV Photogrammetry and Satellite Remote Sensing Information. Remote Sens. 2021, 13, 4968. [Google Scholar] [CrossRef]
  68. Wang, J.; Wang, W.K.; Hu, Y.H.; Tian, S.N.; Liu, D.W. Soil Moisture and Salinity Inversion Based on New Remote Sensing Index and Neural Network at a Salina-Alkaline Wetland. Water 2021, 13, 2762. [Google Scholar] [CrossRef]
  69. Jiang, Q.H.; Chen, Y.Y.; Guo, L.; Fei, T.; Qi, K. Estimating Soil Organic Carbon of Cropland Soil at Different Levels of Soil Moisture Using VIS-NIR Spectroscopy. Remote Sens. 2016, 8, 755. [Google Scholar] [CrossRef] [Green Version]
  70. Lee, K.S.; Lee, D.H.; Sudduth, K.A.; Chung, S.O.; Kitchen, N.R.; Drummond, S.T. Wavelength identification and diffuse reflectance estimation for surface and profile soil properties. Trans. ASABE 2009, 52, 683–695. [Google Scholar] [CrossRef]
  71. Ben-Dor, E.; Inbar, Y.; Chen, Y. The Reflectance Spectra of Organic Matter in the Visible Near-Infrared and Short Wave Infrared Region (400–2500 nm) during a Controlled Decomposition Process. Remote Sens. Environ. 1997, 61, 1–15. [Google Scholar] [CrossRef]
  72. Knadel, M.; Deng, F.; Alinejadian, A.; de Jonge, L.W.; Moldrup, P.; Greve, M.H. The Effects of Moisture Conditions-From Wet to Hyper dry-On Visible Near-Infrared Spectra of Danish Reference Soils. Soil Sci. Soc. Am. J. 2014, 78, 422–433. [Google Scholar] [CrossRef]
  73. Luce, M.S.; Ziadi, N.; Zebarth, B.J.; Grant, C.A.; Tremblay, G.F.; Gregorich, E.G. Rapid determination of soil organic matter quality indicators using visible near infrared reflectance spectroscopy. Geoderma 2014, 232, 449–458. [Google Scholar] [CrossRef]
  74. Alexandre, J.; Dematte, M.; Garcia, G.J. Alteration of Soil Properties through a Weathering Sequence as Evaluated by Spectral Reflectance. Soil Sci. Soc. Am. J. 1999, 63, 327–342. [Google Scholar] [CrossRef]
  75. Somers, B.; Gysels, V.; Verstraeten, W.W.; Delalieux, S.; Coppin, P. Modelling moisture-induced soil reflectance changes in cultivated sandy soils: A case study in citrus orchards. Eur. J. Soil Sci. 2010, 61, 1091–1105. [Google Scholar] [CrossRef]
  76. Etienne Muller, H.D. Modeling soil moisture-reflectance. Remote Sens. Environ. 2001, 76, 173–180. [Google Scholar] [CrossRef] [Green Version]
  77. Ambrosone, M.; Matese, A.; Di Gennaro, S.F.; Gioli, B.; Tudoroiu, M.; Genesio, L.; Miglietta, F.; Baronti, S.; Maienza, A.; Ungaro, F.; et al. Retrieving soil moisture in rainfed and irrigated fields using Sentinel-2 observations and a modified OPTRAM approach. Int. J. Appl. Earth Obs. Geoinf. 2020, 89, 102113. [Google Scholar] [CrossRef]
  78. Zhao, W.; Li, Z.-L. Sensitivity study of soil moisture on the temporal evolution of surface temperature over bare surfaces. Int. J. Remote Sens. 2013, 34, 3314–3331. [Google Scholar] [CrossRef]
  79. Tao, L.; Ryu, D.; Western, A.; Boyd, D. A New Drought Index for Soil Moisture Monitoring Based on MPDI-NDVI Trapezoid Space Using MODIS Data. Remote Sens. 2021, 13, 122. [Google Scholar] [CrossRef]
Figure 1. The location of the research area and the field plots.
Remotesensing 14 02411 g001
Figure 2. The transmission of light in the simplified soil model.
Remotesensing 14 02411 g002
Figure 3. The soil reflectance of gradient moisture content.
Remotesensing 14 02411 g003
Figure 4. The relationship between SMCg and L.
Remotesensing 14 02411 g004
Figure 5. The scatting plot between the measured and predicted soil moisture content.
Remotesensing 14 02411 g005
Figure 6. The modeling reflectance and measured reflectance.
Remotesensing 14 02411 g006
Figure 7. The soil reflectance of different samples.
Remotesensing 14 02411 g007
Figure 8. The scattering plot between SMCg and L with the various SOM.
Remotesensing 14 02411 g008
Figure 9. The scattering plot between the estimated and measured SMCg: (a) the scattering plot between the measured and predicted SMCg using the original model; (b) the scattering plot between the measured and predicted SMCg using the modified model.
Remotesensing 14 02411 g009
Figure 10. The box plot represented the distance between measured and predicted SMCg using two models.
Remotesensing 14 02411 g010
Table 1. Descriptive statistics of soil properties.
Statistical VariableSMCg (%)Organic Matter (g/kg)Soil Particle Size Distribution
Sand (%)Slit (%)Clay (%)
Minimum17.5317.94639.0314.9710.12
Maximum55.2181.21159.1435.9034.65
Mean25.8838.43851.9528.9419.11
Table 2. The correlation coefficient of the measured and simulated reflectance.
R²0.9–1.00.8–0.90.7–0.80.5–0.7
Amount31021
Table 3. The comparation of the original and modified model.
ModelR²RMSE (%)MRE (%)
Original model0.6075.6121.87
Modified model0.7671.626.53
Publisher’s Note: MDPI stays neutral with regard to jurisdictional claims in published maps and institutional affiliations.

