Communication

Temperature Mediates the Dynamic of MODIS NPP in Alpine Grassland on the Tibetan Plateau, 2001–2019

1
State Key Laboratory of Resources and Environmental Information System, Institute of Geographic Sciences and Natural Resources Research, Chinese Academy of Sciences, Beijing 100101, China
2
College of Resources and Environment, University of Chinese Academy of Sciences, Beijing 100049, China
3
Department of Epidemiology and Statistics, School of Public Health, China Medical University, Shenyang 110122, China
4
Chinese PLA Center for Disease Control and Prevention, Beijing 100071, China
*
Author to whom correspondence should be addressed.
These authors contributed equally to this work.
Remote Sens. 2022, 14(10), 2401; https://doi.org/10.3390/rs14102401
Submission received: 19 March 2022 / Revised: 15 May 2022 / Accepted: 15 May 2022 / Published: 17 May 2022
(This article belongs to the Special Issue Remote Sensing for Mountain Ecosystems)

Abstract

:
Although alpine grassland net primary productivity (NPP) plays an important role in balancing the carbon cycle and is extremely vulnerable to climate factors, on the Tibetan Plateau, the generalized effect of climate factors on the NPP in areas with humid and arid conditions is still unknown. Hence, we determined the effects of precipitation and temperature on the MODIS NPP in alpine grassland areas from 2001 to 2019 according to information from humid and arid climatic regions. On a spatial scale, we found that temperature generated a larger effect on the NPP than precipitation did in humid regions, but as a primary factor, precipitation had an impact on the NPP in arid regions. These results suggest that temperature and precipitation are the primary limiting factors for plant growth in humid and arid regions. We also found that temperature produced a greater effect on the NPP in humid regions than in arid regions, but no significant differences were observed in the effects of precipitation on the NPP in humid and arid regions. In a time series (2001–2019), the effects of precipitation and temperature on the NPP presented fluctuating decrease (R2 = 0.28, p < 0.05) and increase (R2 = 0.24, p < 0.05) trends in arid regions. However, the effect of the climate on the NPP remained stable in humid regions. In both humid and arid regions, the dynamics of the NPP from 2001 to 2019 were mediated by an increase in temperature. Specifically, 35.9% and 2.57% of the dynamic NPP in humid regions and 45.1 and 7.53% of the dynamic NPP in arid regions were explained by variations in the temperature and precipitation, respectively. Our findings highlighted that grassland areas in humid regions can adapt to dynamic climates, but plants in arid regions are sensitive to changes in the climate. These findings can increase our understanding of climate and ecological responses and provide a framework for adapting management practices.

Graphical Abstract

1. Introduction

The net primary productivity (NPP) refers to the amount of biomass that green vegetation accumulates from the fixation of carbon in the atmosphere through photosynthesis per unit area and per unit time [1]. It is an essential constituent part of the global and regional terrestrial ecosystem carbon cycle and is a key element in demonstrating ecosystem stability [2]. The NPP not only directly reflects the production capacity of vegetation in the natural environment and represents the quality of the terrestrial ecosystem [3], but is also an important factor for judging whether an ecosystem is a carbon source/sink and the regional ecological support capacity [4,5]. The NPP plays an important role in determining the carbon flux in an ecosystem and in the regulation of the global climate [6]. Additionally, climate change (e.g., drought or increases in temperature) has been proven to be the most critical driver in generating the dynamic of the NPP in alpine ecosystems [3,7,8]. In other words, The NPP can be used to characterize the response of alpine grassland areas to global changes [9] because alpine grassland productivity is sensitive to climate dynamics [10]. Temperature increases can lead to range contraction or expansion, reduced biodiversity, and even extinction in the plant community for those species that are unable to adjust to warming in the alpine region [3,11]. Therefore, climate factors can shape the structure and function (NPP) of alpine grassland ecosystems [3,12].
Many studies have demonstrated that the NPP in ecosystems is vulnerable to climate [13]. Exploring the response characteristics of the grassland NPP to climate factors over a long time series is of great significance to reveal the mechanism of grassland growth [14]. Recently, the spatial and temporal patterns of the NPP and climate control have received considerable attention on regional [15], national [16], and global scales [8]. Specifically, in China, previous studies found that the plants in most climatic zones are improved [16,17] at an average rate of 15.2 Tg C yr−1 [16]. Additionally, the spatiotemporal gradient of the NPP in humid regions is negatively driven by low temperatures and potential drought [16]. However, high temperatures and the droughts that are associated with them were the dominant negative climatic driver of NPP in relatively arid regions [8,16]. Despite this knowledge, on the Tibetan Plateau (TP), the generalized effects of climate on the NPP in relatively humid and arid conditions are still unknown.
The TP is an important ecological functional area in China and is one of the most sensitive regions to climatic change [18]. The climate characteristics of the TP are closely associated with Westerlies (northern area of the TP), Indian monsoons (southern area of the TP), and East Asian monsoons (southeastern area of the TP) [19]. As a result, there is an obvious rainfall gradient zone from the southeast to the northwest, with the corresponding annual precipitation ranging from ~1500 mm to 28 mm [20]. The east-to-west precipitation gradient on the TP makes it an ideal region to explore the response of the NPP to the climate gradient in arid and humid areas. Moreover, the annual temperature on the TP has increased dramatically over the past 50 years, at a rate twice that of the world average [21]. Particularly, the drastic changes in precipitation usually occur in humid regions, leading to much moister conditions, while the clear warming that mostly occurs in arid regions will result in severe droughts [19]. Precipitation and temperature conditions are important for photosynthesis and carbon fixation in plants. Consequently, the anticipated warmer and wetter climate can easily alter alpine ecosystem functions, which might generate divergent effects on the dynamics of the NPP in humid and arid regions [3,22].
Previous studies have demonstrated that the NPP (1982–2009) in the TP exhibits differential variations in natural zones [22]. Specifically, on the TP, the NPP presents an increasing trend in most natural zones, except for in the western part of the TP (Ngari montane desert steppe and desert zones) [22]. Moreover, on the TP, the effects of temperature and precipitation on the NPP were different from 2001 to 2008 [4]. Thus, the increase in temperature generated a significant (R2 = 0.83, p < 0.05) positive effect on plant NPP. However, the dynamics of precipitation produced a significantly (R2 = 0.37, p < 0.05) negative effect on plant NPP. Generally, although many studies have been conducted to characterize, map, and compare the NPP of plants in terms of the time scale (several years to 20 years) [4,23,24] and spatial scale [25,26] in recent years, fewer studies have been carried out in climatic zones on the TP to explore the changes in NPP that are triggered by the climate gradient.
Therefore, long time series (2001–2019) data of the grassland MODIS NPP as well as climate data were used to analyze the dynamic effects of the climate on the NPP in the TP. Our main purpose was to explore the temporal and spatial variations in NPP and its driving mechanism. More specifically, we aim to answer the following questions: (1) How does the effect between the NPP and climate vary spatially? (2) Which climate factors (temperature or precipitation) mediate the dynamics of the NPP in humid and arid regions?

2. Materials and Methods
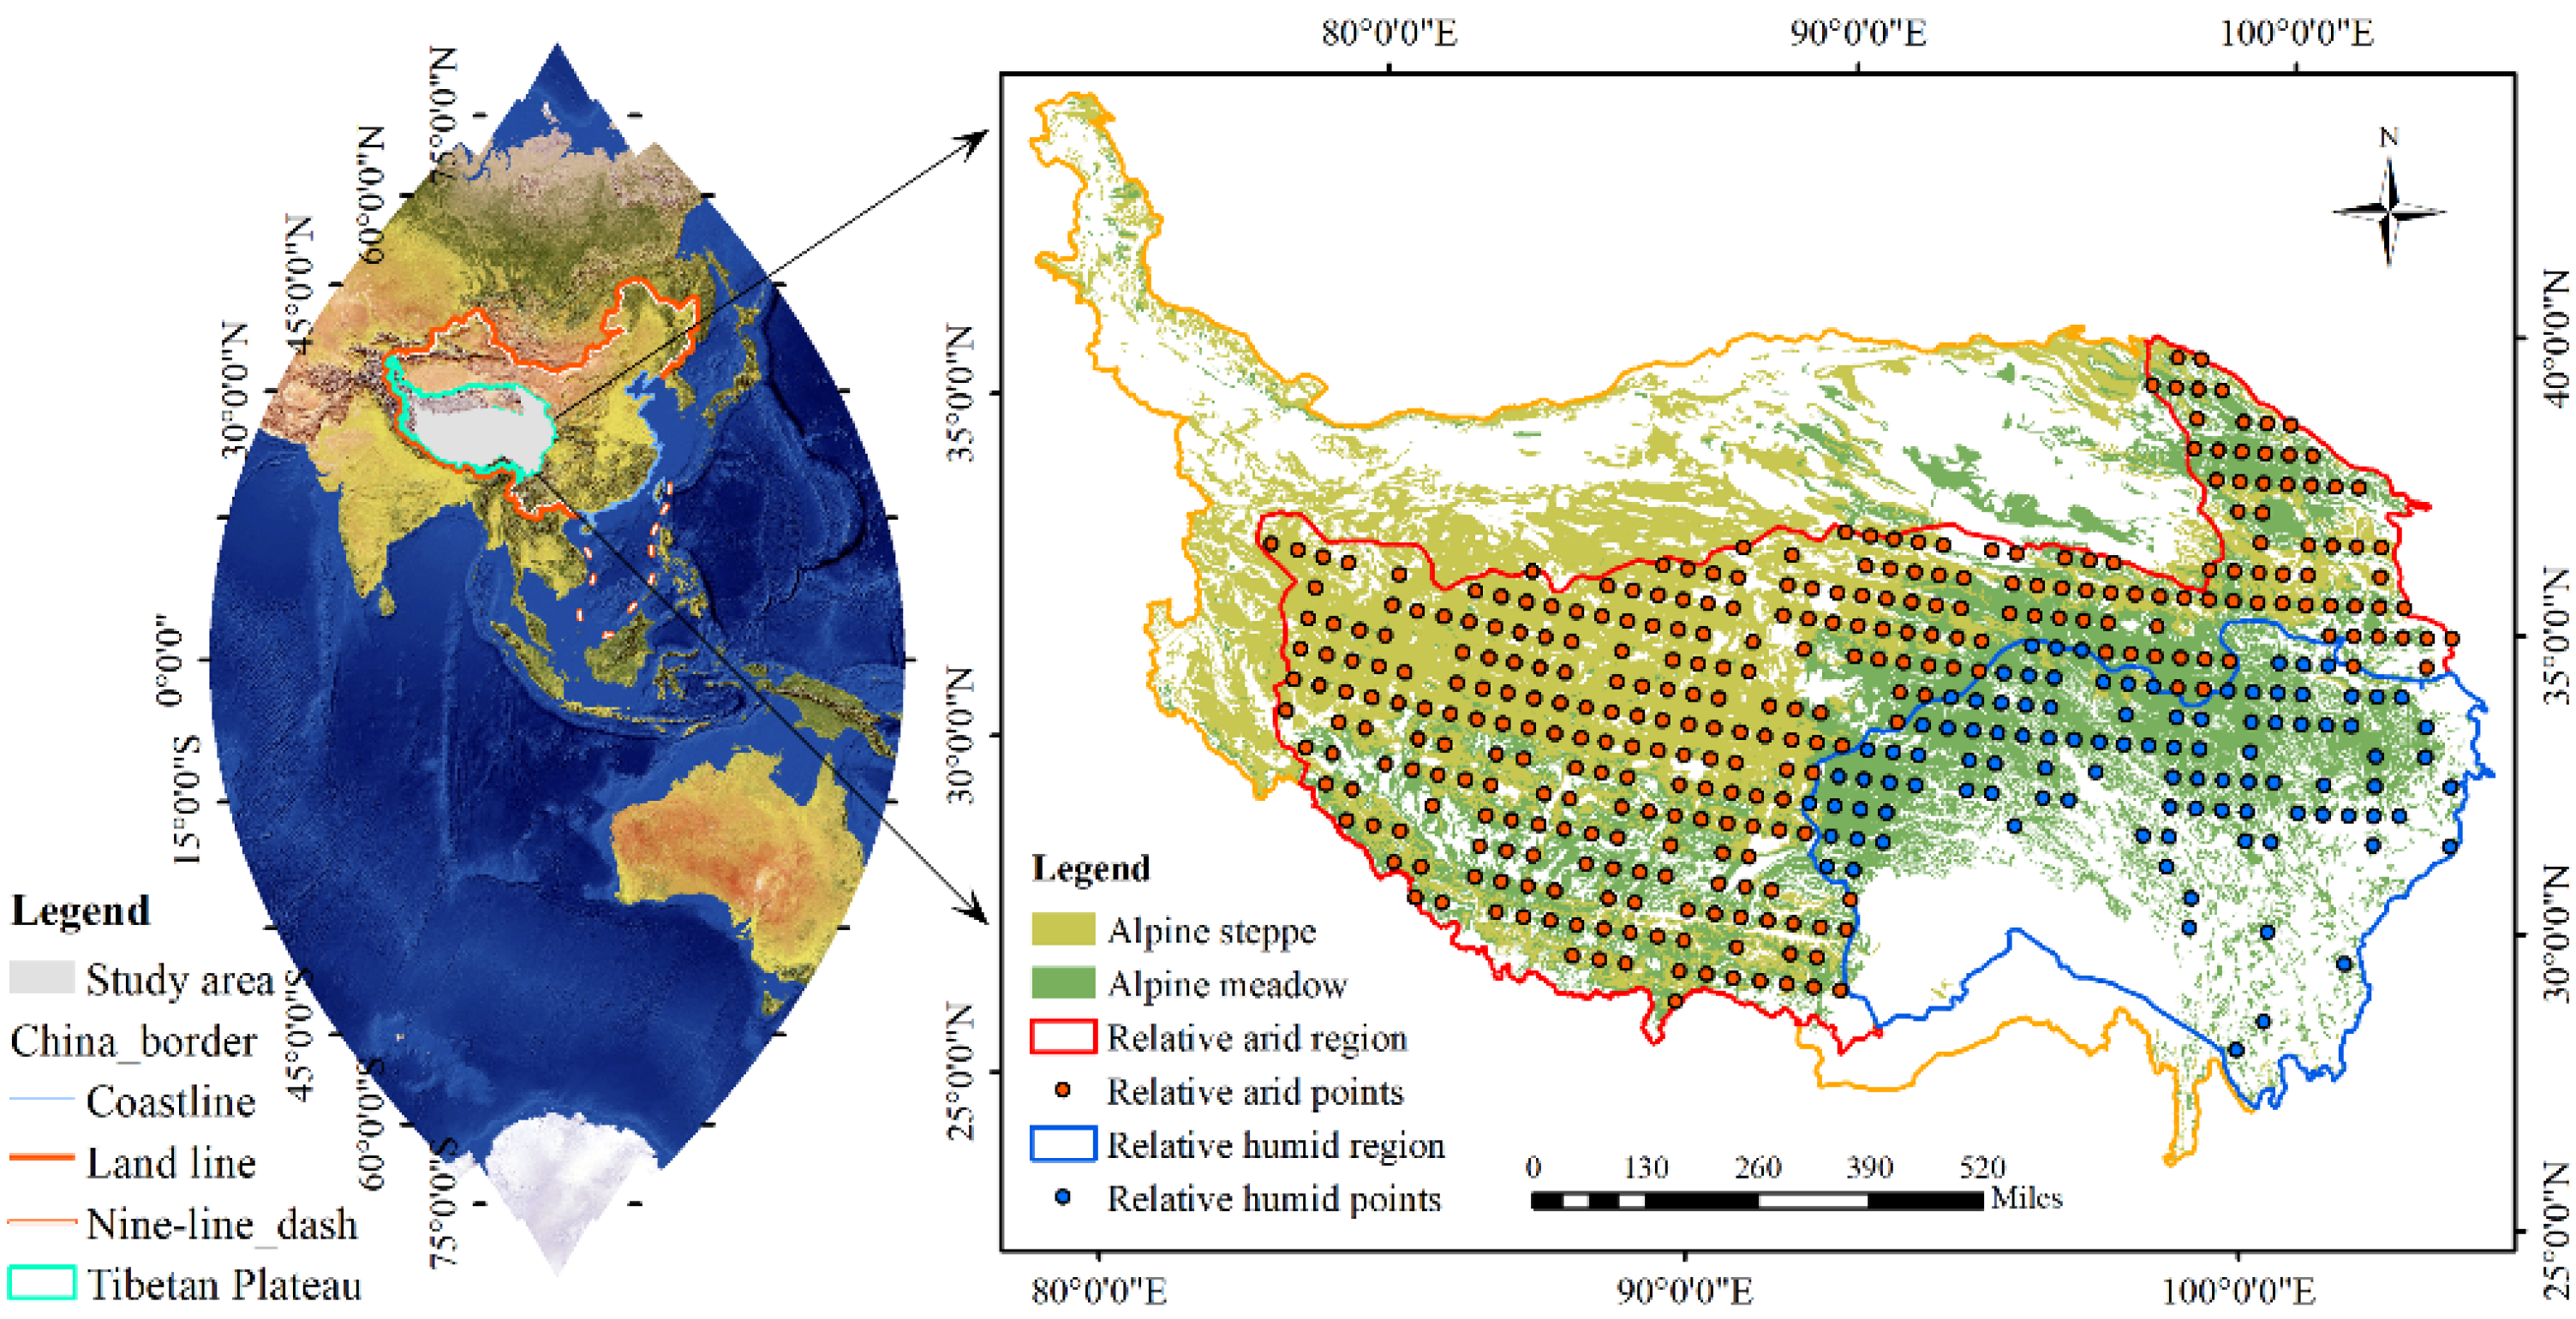
2.1. Study Area

The TP, which has a high altitude (average value ~4000 m) and an area of about 2.5 million km2, is located in southwestern China (Figure 1). About 64.0% of the area of the TP is covered by alpine grasslands, including alpine meadows, alpine steppes, and alpine desert steppes. The spatial distribution of alpine grasslands on the TP is closely related to the climatic gradients. The precipitation characteristics on the TP are driven by northern westerlies, southern Indian monsoons, and East Asian monsoons. The temperature dynamics are closely associated with altitude. Generally, the climate on the TP can be divided as being in relatively arid and relatively humid zones according to the China Ecological Geographical Divisions [27] (Figure 1). Then, we divided the grassland into two types according to their climate and could thus determine the plants in relatively humid regions and plants in relatively arid regions, respectively. Additionally, we extracted the NPP, temperature, and precipitation values from 2001 to 2019 using the fishnet technique, then we further analyzed the relationships between the climate (temperature and precipitation) and NPP using simple linear regression for each year (Appendix A Figure A1).

2.2. NPP Data

The longest time series (2001–2019) NPP dataset was collected from EARTHDATA (https://search.earthdata.nasa.gov/search, accessed on 18 March 2022). Terra Moderate Resolution Imaging Spectroradiometer (MODIS) MOD17A3HGF Version 6 provides information about the annual NPP at a 500 m (m) pixel resolution. The annual NPP is derived from the sum of all of the 8-day Net Photosynthesis products (MOD17A2H) from a given year. The PSN value is the difference between the Gross Primary Productivity and the Maintenance Respiration. The MOD17A3HGF is generated at the end of each year, when the entire yearly 8-day MOD15A2H data are (https://doi.org/10.5067/modis/mod15a2h.006, accessed on 18 March 2022) available. Hence, the gap-filled MOD17A3HGF is the improved MOD17, which has cleaned the poor-quality inputs from 8-day Leaf Area Index and Fraction of Photosynthetically Active Radiation (LAI/FPAR) based on the Quality Control label for every pixel. If a LAI/FPAR pixel did not meet the quality screening criteria, its value was determined through linear interpolation. Notably, the NPP resolution was resampled to be 1 km in our study.

2.3. Climate Database

Climate data (2001–2019) were obtained from the Meteorology Information Centre of the Chinese National Bureau of Meteorology (http://data.cma.cn/, accessed on 18 March 2022). The daily temperature and precipitation data were used to calculate the annual mean temperature (AMT) and annual mean precipitation (AMP). ANUSPLIN possesses a series of FORTRAN programs that use fitted thin plate smoothing splines to generate continuous climatic surfaces according to the elevation and climate data. Moreover, Anusplin 4.2 (Centre for Resource and Environmental Studies, Australian National University, Canberra) was utilized to interpolate the climatic raster database using a spatial resolution of 1 km.

2.4. Analysis Method

The technical route of this study was presented in Figure 2. In detail, firstly, we calculated the spatial change rates of the climate and NPP using ArcGIS 10.2 (ESRI, Inc., Redlands, CA, USA) with the least-squares method, as follows:
β = n X Y X Y n X 2 ( X ) 2
where n is the number of years from 2001 to 2019, X is the year, and Y is the NPP.
Next, across the TP, fishnet points were established with ArcGIS 10.2 software. To obtain the humid points and arid points, the fishnet points were further clipped by the boundaries of the humid and arid regions. Meanwhile, the annual values of the temperature, precipitation, and the NPP in these fishnet points were extracted from the climate and NPP raster points, respectively. Then, a linear regression analysis of the climate and NPP was used to reflect the effect (R2) of the climate on the NPP. The effect of the climate on the NPP can be defined as follows:
R 2 = i = 1 n y i 2 i = 1 n ( y i Y i ) 2 i = 1 n y i 2
where yi is the actual NPP value, and Yi is the fitted NPP value.
Meanwhile, based on the standard deviation (SD) and the mean (MN) value of the climate effect (R2) on the NPP, the coefficient of variation (CV) was calculated between the adjacent years from 2001 to 2019 as follows:
C V = S D M N
Finally, with the “vegan” package in R software (R Core Development Team, R Foundation for Statistical Computing, Vienna, Austria), variation partitioning analysis was employed for the quantitative analysis of the contributions of the AMT and AMP to the variations in the NPP in arid and humid regions. Notably, the abbreviations used frequently in our study was showed in Table 1.

3. Results

3.1. Spatial and Temporal Dynamics of the Climate and NPP in Arid and Humid Regions

The NPP decreased from the southeast (19257 gC m−2 yr−1) to the northwest (0 gC m−2 yr−1) (Figure 3a). The NPP in humid regions was 2096.7 (gC m−2 yr−1, Figure 4a), which was higher than the NPP (975.1 gC m−2 yr−1) in arid regions (Figure 4d). The NPP presented an increasing trend from 2001 to 2019 in most areas of the humid regions (Figure 3d), but a non-significant change in the NPP was observed from 2001 to 2019 (Figure 4a). The NPP in the eastern areas of arid regions showed an obvious increase (Figure 3d), and the NPP increased significantly from 2001 to 2019 (R2 = 0.48, p < 0.005, Figure 4d).
The AMP decreased from the southeast (1495.1 mm) to the northwest (28.2 mm) (Figure 3b). Similar to the spatial distribution of the NPP, the AMP in humid regions (632.8 mm, Figure 4b) was higher than the AMP in arid regions (346.5 mm, Figure 4e). Additionally, an increasing precipitation trend was observed in humid regions with alpine meadows (Figure 3e). Although the precipitation in arid regions also showed an increasing trend, the increase in precipitation was lower than that in humid regions. Both the precipitation in humid and arid regions showed a non-significant change from 2001 to 2019 (Figure 4b,e).
The AMT ranged from −23.6 °C to 24.1 °C (Figure 3c). Additionally, the temperature was higher in the valleys of the southeastern areas. In the spatial data, the temperature in both the humid regions and arid regions mainly showed an obvious increasing trend (Figure 3f). On the time scale, significant increases in the temperature in humid regions (R2 = 0.46, p < 0.005, Figure 4c) and arid regions (R2 = 0.25, p < 0.05, Figure 4f) were found.

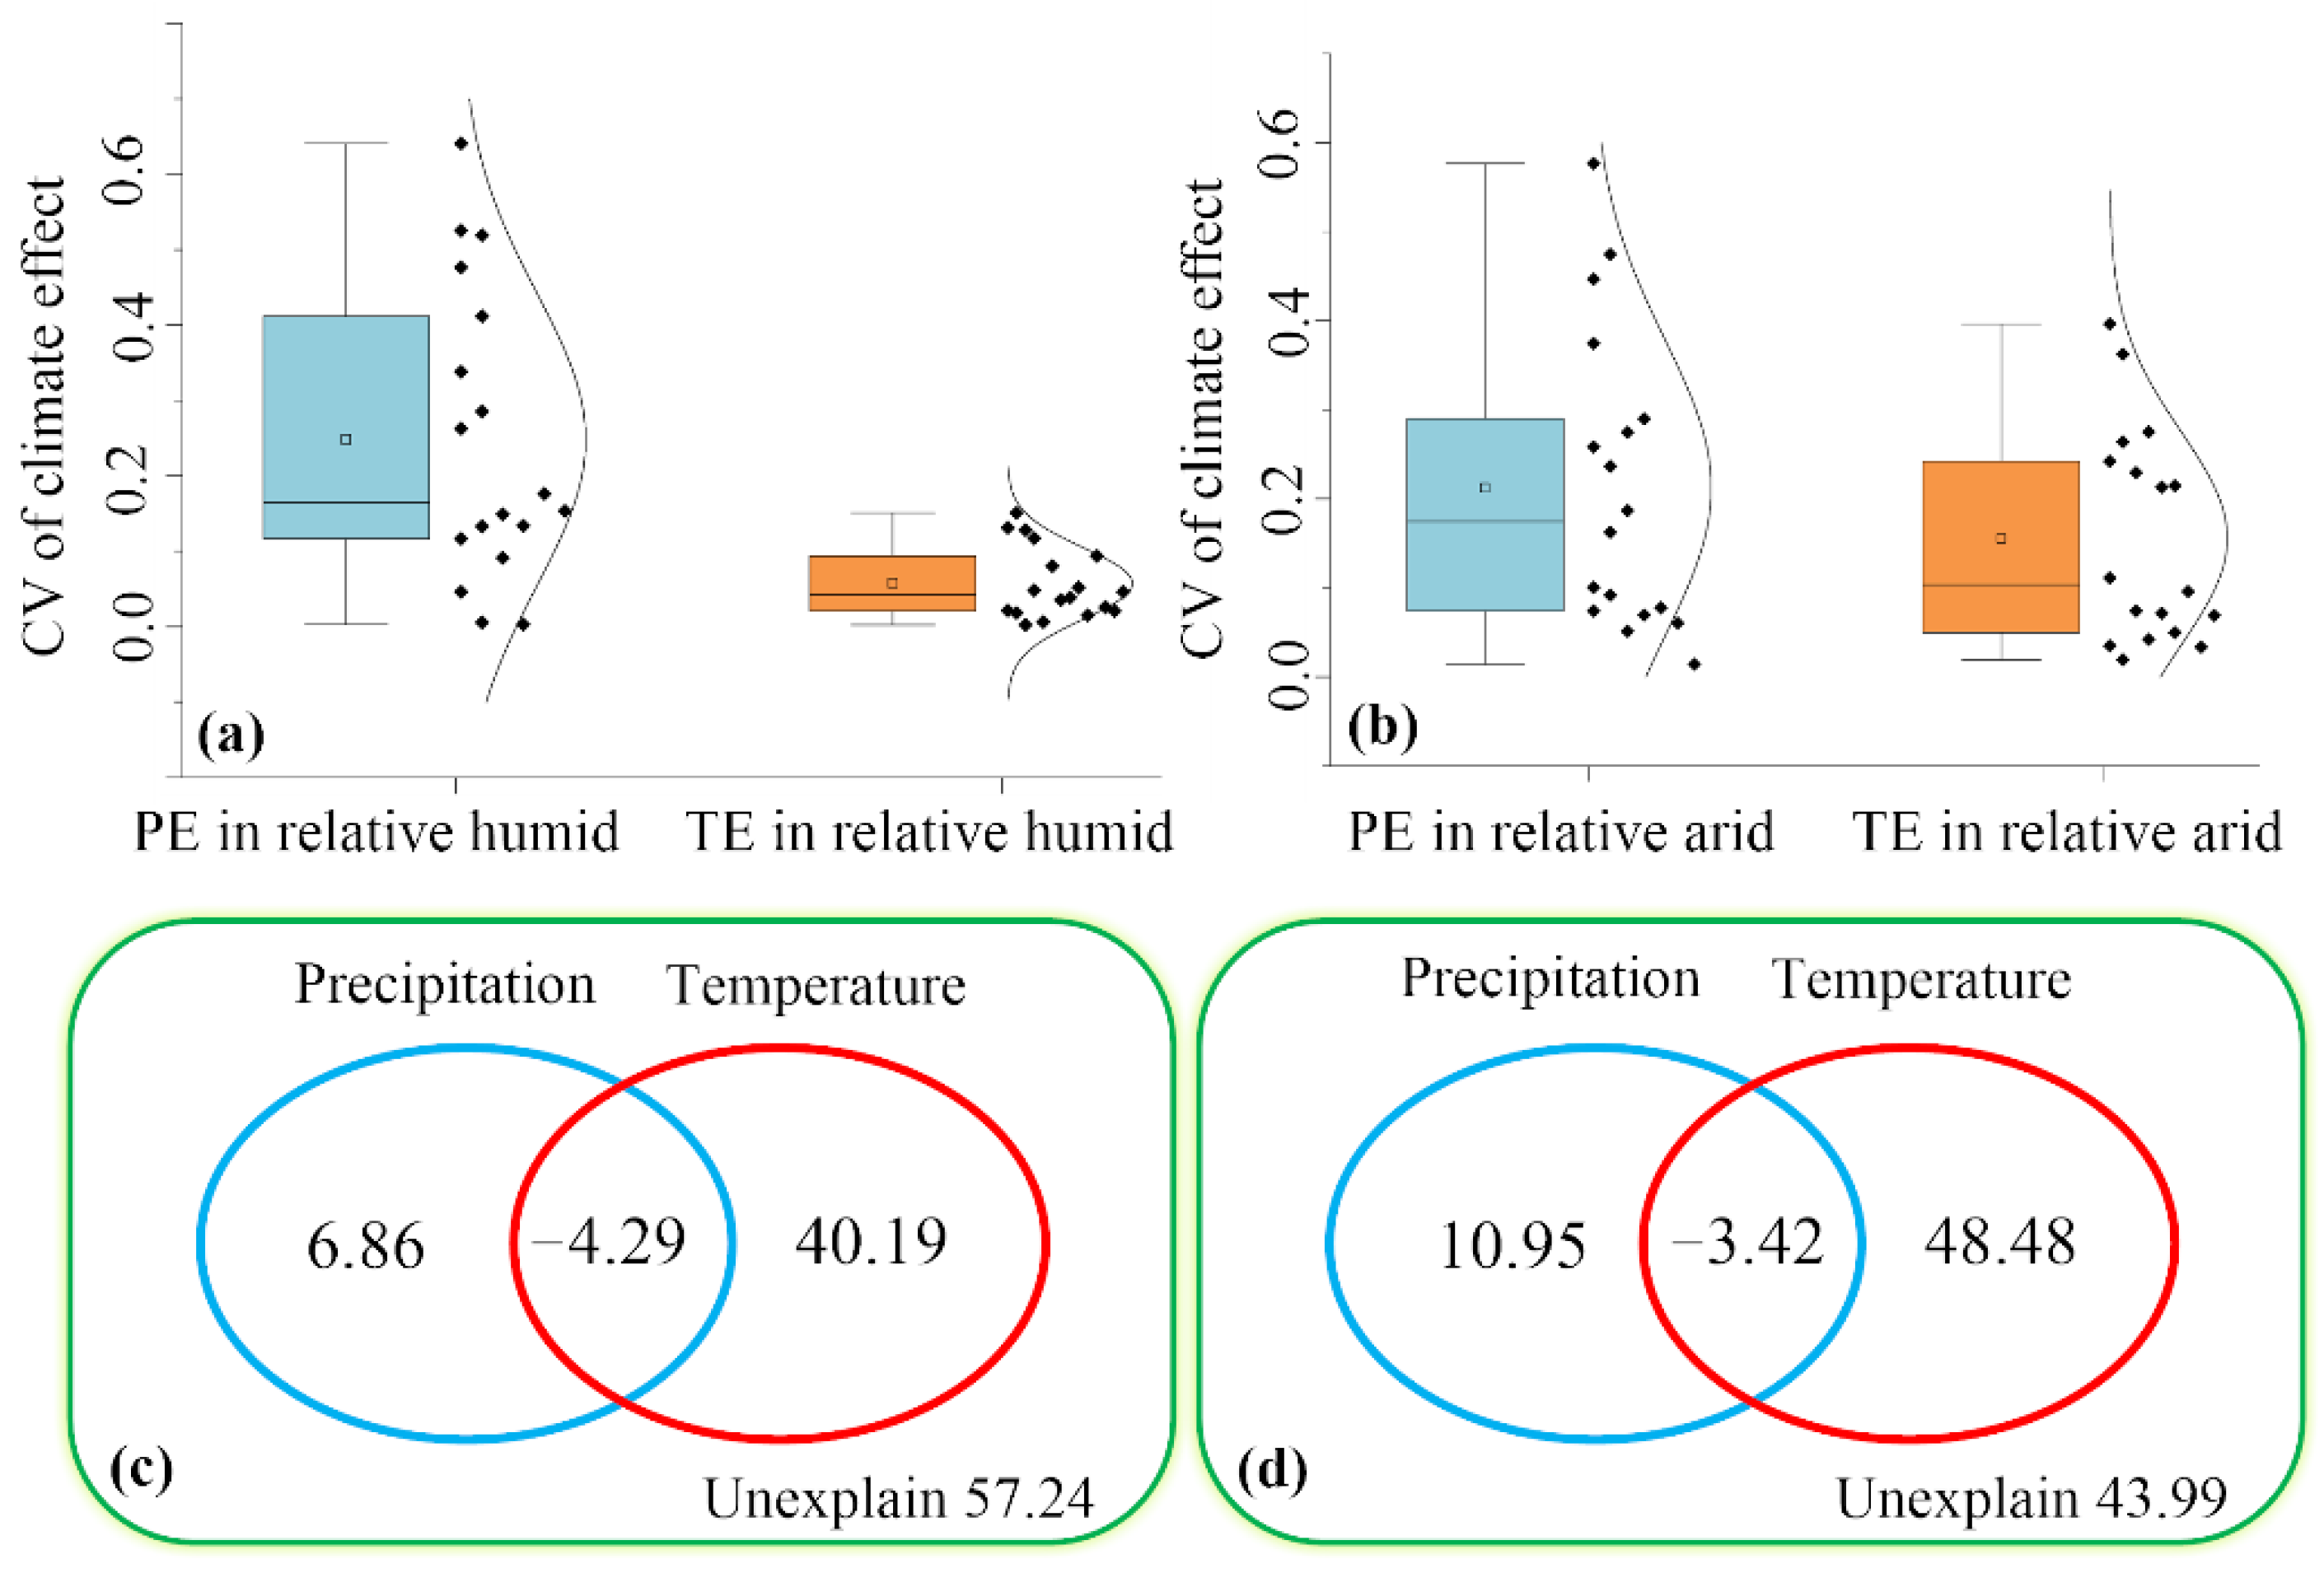
3.2. Dynamic Effects of Climate on NPP in Arid and Humid Regions

In humid regions, the effect of the temperature on NPP (R2 = 0.47) was significantly (p < 0.05) higher than the effect of precipitation on the NPP (R2 = 0.21, Figure 5a). In contrast, the effect of temperature on the NPP (R2 = 0.15) was significantly (p < 0.05) lower than the effect of precipitation on the NPP (R2 = 0.24) in arid regions (Figure 5b). Moreover, there was no significant difference in the effect of precipitation on the NPP between humid and arid regions (Figure 5c). However, the effect of temperature on the NPP was significantly (p < 0.05) higher in humid regions than in arid regions (Figure 5d).
From 2001 to 2019, in humid regions, both the effects of the AMT and AMP on the NPP showed no significant change (Figure 6a,b). However, in arid regions, the effect of the AMP on the NPP presented a significant decrease trend (R2 = 0.28, p < 0.05, Figure 6c). Additionally, the effect of the AMT on the NPP significantly increased (R2 = 0.24, p < 0.05, Figure 6d).

3.3. Dominant Factors for the Dynamic of NPP in Arid and Humid Regions

From 2001 to 2019, in humid regions, the variation coefficient of the effect of the AMP on the NPP was 0.25, which was larger than the variation coefficient of the effect of the AMT on the NPP (0.06, Figure 7a). These results indicate that the grasslands in humid regions were better able to adapt to the variations in temperature but were sensitive to the dynamics of precipitation. However, in arid regions, both the effects of the AMP and AMT on the NPP demonstrated high levels of variation from 2001 to 2019 (Figure 7b). It can be concluded that the NPP in arid regions was sensitive to the dynamics of precipitation and temperature. Thus, the ecosystem stability in arid regions was lower than that in humid regions.
In humid regions, variation partitioning analysis demonstrated that 35.90% and 2.57% of the dynamics of the NPP from 2001 to 2019 were accounted by the AMT and AMP (Figure 7c), respectively. In arid regions, 45.06% and 7.53% of the variation in the NPP from 2001 to 2019 was explained by the AMT and AMP (Figure 7d), respectively.

4. Discussion

4.1. Relationships between Climate and NPP in Arid and Humid Regions

In humid regions, temperature (R2 = 0.47) generates a larger effect on the NPP than precipitation (R2 = 0.21, Figure 5a), suggesting that temperature is the main limiting factor of plant growth. The southeastern regions of the TP are affected by the warm and wet airflow of East Asian monsoons and Indian monsoons [19,28]. As a result, precipitation (632.8 mm in humid regions, Figure 4b) is abundant in the southeastern parts of the TP [20]. Due to this, precipitation is not the main limiting climate factor that restricts plant growth [29]. However, the lower annual temperature (−1.4 °C, Figure 4c) in humid regions should also be considered a critical determinant that restricts plant growth, as low temperatures affect plant physiology, resulting in growth limitations [30]. Previous studies have also demonstrated that the NPP in the humid region of Hongyuan County (AMP = 747 mm) increased significantly in response to climatic warming [31], but improved precipitation levels did not have a significant effect on the NPP [32]. Moreover, increasing temperatures usually result in longer growing seasons and enhance the ability of plant photosynthesis [33], thus promoting plant growth [28,34,35]. Consequently, the significant increase in temperature from 2001 to 2019 in the humid regions would have had a positive effect on enhancing the carbon sequestration capacity and improving the ecosystem NPP.
In arid regions, even though precipitation generates a larger (R2 = 0.24) effect on the NPP than temperature (R2 = 0.15, Figure 5b), their effect values are not much different. This suggests that a common low temperature (−2.2 °C, Figure 4f) and precipitation (346.5 mm, Figure 4e) in arid regions play an important role in limiting plant growth. Insufficient precipitation in an arid environment cannot meet the ecological water requirements for plants [36,37]. Lower temperatures mean shorter growing seasons and less productivity [38]. Therefore, low temperatures and less rainfall jointly limit plant growth in arid areas. Previous studies have also shown that low precipitation together with cold conditions lead to counter impacts on plant growth in the arid regions of the TP [39]. The alpine grassland areas in arid regions are a drought-induced biological community and struggle for survival in cold and drought conditions [40] because low temperature and water stress may generate less permanent physiological shocks to plants and thus inhibit growth [41].

4.2. Temperature Mediates the Dynamic of NPP in Arid and Humid Regions

In both humid and arid regions, temperature changes mediated the increase in the NPP from 2001 to 2019 (Figure 7). In both the humid (Figure 4b) and arid regions (Figure 4e), no significant changes were observed in the precipitation from 2001 to 2019, but the temperature increased significantly (Figure 4c,f). Similarly, temperature mediated the dynamic of MODIS NPP in global [42]. The increasing temperature stimulated photosynthetic enzyme activity due to the cold winter environment and ignited vegetation growth through its impacts on nutrient availability and uptake [43]. Temperature is a key limiting factor for alpine vegetation growth [44]. Therefore, the significantly increased temperature mediated the change in the NPP. In detail, in humid regions, increasing temperatures tended to improve the plant NPP because the temperature is the main limiting factor for plant growth rather than precipitation [3,45]. In arid regions, increased precipitation combined with increased temperatures stimulated ecosystem production because both cold temperatures and low precipitation are the main limiting factors for alpine grassland growth [39]. This is in contrast to several previous studies on the NPP and climate that demonstrate how increasing the temperature would exacerbate plant water stress and decrease production in grassland ecosystems [46]. However, in our study, increasing the temperature and level of precipitation had a positive effect on plant NPP (Figure 7d), suggesting that the indirect negative effect of temperature on plants via soil moisture is weaker than the direct positive effect of temperature on plants.
Interestingly, why are the alpine grassland areas in humid regions adaptable to a dynamic climate (Figure 4a), but the plants in arid regions are sensitive to the changes in the climate (Figure 4d)? Globally, previous studies have also found that droughts induced by high temperatures have the most prominent impact on shrublands and woody savannas in the arid regions of southern Europe, Australia, southwestern North America, northern China, and southern Africa [8]. In other words, the responses of plants to extreme climate change in humid regions are slower than it is in arid regions [8,47]. Here, we propose the following explanations: the climate in the west of TP is cold and prone to drought, and plants usually respond to these stressful conditions with tolerant strategies [20], especially in the nitrogen-deficient arid regions on the TP [48,49,50]. The survival strategies of plants are more important than NPP stability for plants when their habitats with low soil water and nutrient availability [51,52,53]. In other words, the stability of the NPP of the species in arid areas is relatively weak [54]. Consequently, climate fluctuations can easily lead to changes in their NPP (Figure 8). Previous studies also demonstrated that drought contributed ~74% to the change of MODIS NPP in the arid areas of China [55]. In contrast, the NPP in humid regions shows a non-significant dynamic. This is because in humid regions with high species diversity, grassland communities have strong resistance stability and high complementarity efficiency among species [56,57,58], so even though the climate has changed, the effect of the climate on the NPP remains relatively stable (Figure 8). Plants are more limited by soil resources than by precipitation in humid regions [29]. To avoid the dehydration that might be caused by drought, plants always store water in leaves in humid regions with high levels of soil moisture. As a result, the plants in humid regions can adapt to dynamic climates. Future research should focus more on arid regions with lower species diversity and NPP stability that are susceptible to climate warming.

5. Conclusions

In conclusion, by linking the MODIS NPP and climate data in humid and arid regions on the TP, our findings clarify how climate mediates the dynamics of the NPP at both the spatial and temporal scales. Specifically, our analysis demonstrated that temperature and precipitation determine the NPP distribution in humid regions and arid regions, respectively. However, the NPP dynamics from 2001 to 2019 are mediated by changes in temperature. Our findings not only highlight that plant NPP is more sensitive to changes in temperature than changes in precipitation but also highlight that the plants in arid regions are more sensitive to changes in the climate than the plants in humid regions. Generally, the coordinated changes in the temperature and precipitation, as well as ecosystem stability regulate the NPP of alpine grassland areas in different climate regions.
Our results reveal the mechanism of NPP in response to climate factors in different climatic zones, which is valuable for ecological assessments and adaptive ecosystem management of climate change in the future. Meanwhile, our research emphasizes that scientists should be encouraged to conduct long-term monitoring of key ecological elements (NPP) in alpine grassland ecosystems and should focus on the analysis of ecosystem structure and function with more remote sensing data, clarifying the key driving threshold and mechanism of alpine grassland ecosystem stability to climate change. These works can provide an early warning for alpine grassland to deal with climate change and provide theoretical support for the construction of ecological civilization on the TP.

Author Contributions

Conceptualization, L.J.; methodology, J.C., Y.W., and T.Z.; software, J.C., Y.W. and T.Z.; validation, L.J. and Q.Q.; formal analysis, J.C. and T.Z.; investigation, J.C. and Y.W.; resources, L.J. and Q.Q.; data curation, J.C. and Y.W.; writing—original draft preparation, J.C., Y.W., and T.Z.; writing—review and editing, J.C. and Y.W.; visualization, L.J. and Q.Q.; supervision, L.J. and Q.Q.; project administration, L.J. and Q.Q.; funding acquisition, L.J. All authors have read and agreed to the published version of the manuscript.

Funding

This research was funded by “The Third Xinjiang Scientific Expedition”, grant number “2021xjkk0303”.

Data Availability Statement

Correspondence and requests for materials should be addressed to L.J.

Acknowledgments

The authors thank Chongchong Ye for the constructive comments on our study.

Conflicts of Interest

The authors declare no conflict of interest.

Appendix A

Figure A1. The values of NPP, temperature, and precipitation were extracted by fishnet from 2001 to 2019, then the relationships between climate and NPP were further analyzed by simple linear regression for every year. For example, in 2001, the extract points in arid and humid regions (A); and the spatial patterns of precipitation (B), NPP (C), and temperature (D); the relationships between precipitation and NPP, between temperature and NPP in the arid region (E,F) and in the humid region (G,H).
Remotesensing 14 02401 g0a1

References

  1. Huang, M.; Piao, S.; Janssens, I.A.; Zhu, Z.; Wang, T.; Wu, D.; Ciais, P.; Myneni, R.B.; Peaucelle, M.; Peng, S.; et al. Velocity of change in vegetation productivity over northern high latitudes. Nat. Ecol. Evol. 2017, 1, 1649–1654. [Google Scholar] [CrossRef] [PubMed]
  2. Guo, D.; Song, X.; Hu, R.; Cai, S.; Zhu, X.; Hao, Y. Grassland type-dependent spatiotemporal characteristics of productivity in Inner Mongolia and its response to climate factors. Sci. Total Environ. 2021, 775, 145644. [Google Scholar] [CrossRef]
  3. Liu, H.; Mi, Z.; Lin, L.; Wang, Y.; Zhang, Z.; Zhang, F.; Wang, H.; Liu, L.; Zhu, B.; Cao, G.; et al. Shifting plant species composition in response to climate change stabilizes grassland primary production. Proc. Natl. Acad. Sci. USA 2018, 115, 4051–4056. [Google Scholar] [CrossRef] [PubMed] [Green Version]
  4. Gao, Y.; Zhou, X.; Wang, Q.; Wang, C.; Zhan, Z.; Chen, L.; Yan, J.; Qu, R. Vegetation net primary productivity and its response to climate change during 2001–2008 in the Tibetan Plateau. Sci. Total Environ. 2013, 444, 356–362. [Google Scholar] [CrossRef]
  5. Piao, S.; Fang, J.; Ciais, P.; Peylin, P.; Huang, Y.; Sitch, S.; Wang, T. The carbon balance of terrestrial ecosystems in China. Nature 2009, 458, 1009–1013. [Google Scholar] [CrossRef]
  6. Piao, S.; Ciais, P.; Friedlingstein, P.; Peylin, P.; Reichstein, M.; Luyssaert, S.; Margolis, H.; Fang, J.; Barr, A.; Chen, A.; et al. Net carbon dioxide losses of northern ecosystems in response to autumn warming. Nature 2008, 451, 49–52. [Google Scholar] [CrossRef]
  7. Sistla, S.A.; Moore, J.C.; Simpson, R.T.; Gough, L.; Shaver, G.R.; Schimel, J.P. Long-term warming restructures Arctic tundra without changing net soil carbon storage. Nature 2013, 497, 615–618. [Google Scholar] [CrossRef]
  8. Liu, Y.; Zhou, R.; Wen, Z.; Khalifa, M.; Zheng, C.; Ren, H.; Zhang, Z.; Wang, Z. Assessing the impacts of drought on net primary productivity of global land biomes in different climate zones. Ecol. Indic. 2021, 130, 108146. [Google Scholar] [CrossRef]
  9. Ito, A.; Oikawa, T. A simulation model of the carbon cycle in land ecosystems (Sim-CYCLE): A description based on dry-matter production theory and plot-scale validation. Ecol. Model. 2002, 151, 143–176. [Google Scholar] [CrossRef]
  10. Piao, S.; Wang, X.; Park, T.; Chen, C.; Lian, X.; He, Y.; Bjerke, J.W.; Chen, A.; Ciais, P.; Tømmervik, H.; et al. Characteristics, drivers and feedbacks of global greening. Nat. Rev. Earth Environ. 2020, 1, 14–27. [Google Scholar] [CrossRef]
  11. Cuo, L.; Zhang, Y.; Zhou, B.J.C.D. Decadal change and inter-annual variability of net primary productivity on the Tibetan Plateau. Clim. Dyn. 2021, 56, 1837–1857. [Google Scholar] [CrossRef]
  12. Wang, S.; Duan, J.; Xu, G.; Wang, Y.; Zhang, Z.; Rui, Y.; Luo, C.; Xu, B.; Zhu, X.; Chang, X.; et al. Effects of warming and grazing on soil N availability, species composition, and ANPP in an alpine meadow. Ecology 2012, 93, 2365–2376. [Google Scholar] [CrossRef]
  13. Li, C.; Zhu, T.; Zhou, M.; Yin, H.; Wang, Y.; Sun, H.; Cao, H.; Han, H. Temporal and spatial change of Net Primary Productivity of vegetation and its determinants in Hexi Corridor. Acta Ecol. Sin. 2021, 41, 1931–1943. [Google Scholar]
  14. Du, J.; Shu, J.; Zhang, L.; Guo, Y. Responses of vegetation to climate change in the headwaters of China′s Yellow River Basin based on zoning of dry and wet climate. Acta Phytoecol. Sin. 2011, 35, 1192–1201. [Google Scholar]
  15. Zhou, K.; Du, J.; Shen, X.; Pu, G.; Zhang, D.; Dang, X. Spatial and Temporal Variability of Vegetation Net Primary Productivity in Qiangtang National Nature Reserve under Climate Change. Chin. J. Agrometeorol. 2021, 42, 627–641. [Google Scholar]
  16. Li, H.; Wu, Y.; Liu, S.; Xiao, J. Regional contributions to interannual variability of net primary production and climatic attributions. Agric. For. Meteorol. 2021, 303, 108384. [Google Scholar] [CrossRef]
  17. Yao, Y.; Wang, X.; Li, Y.; Wang, T.; Shen, M.; Du, M.; He, H.; Li, Y.; Luo, W.; Ma, M.; et al. Spatiotemporal pattern of gross primary productivity and its covariation with climate in China over the last thirty years. Glob. Chang. Biol. 2018, 24, 184–196. [Google Scholar] [CrossRef]
  18. Li, J.; Chen, H.; Zhang, C. Impacts of climate change on key soil ecosystem services and interactions in Central Asia. Ecol. Indic. 2020, 116, 106490. [Google Scholar] [CrossRef]
  19. Sun, J.; Zhou, T.; Liu, M.; Chen, Y.; Shang, H.; Zhu, L.; Shedayi, A.A.; Yu, H.; Cheng, G.; Liu, G.; et al. Linkages of the dynamics of glaciers and lakes with the climate elements over the Tibetan Plateau. Earth-Sci. Rev. 2018, 185, 308–324. [Google Scholar] [CrossRef]
  20. Zhou, T.-C.; Sun, J.; Liu, M.; Shi, P.-L.; Zhang, X.-B.; Sun, W.; Yang, G.; Tsunekawa, A. Coupling between plant nitrogen and phosphorus along water and heat gradients in alpine grassland. Sci. Total Environ. 2020, 701, 134660. [Google Scholar] [CrossRef]
  21. Hansen, J.; Ruedy, R.; Sato, M.; Lo, K. Global surface temperature change. Rev. Geophys. 2010, 48, RG4004. [Google Scholar] [CrossRef] [Green Version]
  22. Zhang, Y.; Qi, W.; Zhou, C.; Ding, M.; Liu, L.; Gao, J.; Bai, W.; Wang, Z.; Zheng, D. Spatial and temporal variability in the net primary production of alpine grassland on the Tibetan Plateau since 1982. J. Geogr. Sci. 2014, 24, 269–287. [Google Scholar] [CrossRef]
  23. Piao, S.; Fang, J.; He, J. Variations in Vegetation Net Primary Production in the Qinghai-Xizang Plateau, China, from 1982 to 1999. Clim. Chang. 2006, 74, 253–267. [Google Scholar] [CrossRef]
  24. Ye, C.; Sun, J.; Liu, M.; Xiong, J.; Zong, N.; Hu, J.; Huang, Y.; Duan, X.; Tsunekawa, A. Concurrent and Lagged Effects of Extreme Drought Induce Net Reduction in Vegetation Carbon Uptake on Tibetan Plateau. Remote Sens. 2020, 12, 2347. [Google Scholar] [CrossRef]
  25. Guo, D.; Song, X.; Hu, R.; Zhu, X.; Jiang, Y.; Cai, S.; Zhang, Y.; Cui, X. Large-Scale Analysis of the Spatiotemporal Changes of Net Ecosystem Production in Hindu Kush Himalayan Region. Remote Sens. 2021, 13, 1180. [Google Scholar] [CrossRef]
  26. Lai, C.; Li, J.; Wang, Z.; Wu, X.; Zeng, Z.; Chen, X.; Lian, Y.; Yu, H.; Wang, P.; Bai, X. Drought-Induced Reduction in Net Primary Productivity across Mainland China from 1982 to 2015. Remote Sens. 2018, 10, 1433. [Google Scholar] [CrossRef] [Green Version]
  27. Wang, Z.; Wu, J.; Niu, B.; He, Y.; Zu, J.; Li, M.; Zhang, X. Vegetation Expansion on the Tibetan Plateau and Its Relationship with Climate Change. Remote Sens. 2020, 12, 4150. [Google Scholar] [CrossRef]
  28. Guo, B.; Zang, W.; Yang, F.; Han, B.; Chen, S.; Liu, Y.; Yang, X.; He, T.; Chen, X.; Liu, C.; et al. Spatial and temporal change patterns of net primary productivity and its response to climate change in the Qinghai-Tibet Plateau of China from 2000 to 2015. J. Arid Land 2019, 12, 1–17. [Google Scholar] [CrossRef] [Green Version]
  29. Zhou, T.; Liu, M.; Sun, J.; Li, Y.; Shi, P.; Tsunekawa, A.; Zhou, H.; Yi, S.; Xue, X. The patterns and mechanisms of precipitation use efficiency in alpine grasslands on the Tibetan Plateau. Agric. Ecosyst. Environ. 2020, 292, 106833. [Google Scholar] [CrossRef]
  30. Körner, C.; Paulsen, J. A world-wide study of high altitude treeline temperatures. J. Biogeogr. 2004, 31, 713–732. [Google Scholar] [CrossRef]
  31. Quan, Q.; Zhang, F.; Jiang, L.; Chen, H.Y.H.; Wang, J.; Ma, F.; Song, B.; Niu, S. High-level rather than low-level warming destabilizes plant community biomass production. J. Ecol. 2021, 109, 1607–1617. [Google Scholar] [CrossRef]
  32. Zhang, F.; Quan, Q.; Song, B.; Sun, J.; Chen, Y.; Zhou, Q.; Niu, S. Net primary productivity and its partitioning in response to precipitation gradient in an alpine meadow. Sci. Rep. 2017, 7, 15193. [Google Scholar] [CrossRef] [PubMed]
  33. Piao, S.; Friedlingstein, P.; Ciais, P.; Viovy, N.; Demarty, J. Growing season extension and its impact on terrestrial carbon cycle in the Northern Hemisphere over the past 2 decades. Glob. Biogeochem. Cycles 2007, 21. [Google Scholar] [CrossRef]
  34. Zhou, Y.; Yue, D.; Li, C.; Mu, X.; Guo, J. Identifying the spatial drivers of net primary productivity: A case study in the Bailong River Basin, China. Glob. Ecol. Conserv. 2021, 28, e01685. [Google Scholar] [CrossRef]
  35. Liu, F.; Xu, C.-Y.; Yang, X.; Ye, X. Controls of Climate and Land-Use Change on Terrestrial Net Primary Productivity Variation in a Subtropical Humid Basin. Remote Sens. 2020, 12, 3525. [Google Scholar] [CrossRef]
  36. Teng, M.; Zeng, L.; Hu, W.; Wang, P.; Yan, Z.; He, W.; Zhang, Y.; Huang, Z.; Xiao, W. The impacts of climate changes and human activities on net primary productivity vary across an ecotone zone in Northwest China. Sci Total Environ. 2020, 714, 136691. [Google Scholar] [CrossRef]
  37. Zhao, M.; Running, S. Drought-Induced Reduction in Global Terrestrial Net Primary Production from 2000 Through 2009. Science 2010, 329, 940–943. [Google Scholar] [CrossRef] [Green Version]
  38. Sun, J.; Zhou, T.; Du, W.; Wei, Y. Precipitation mediates the temporal dynamics of net primary productivity and precipitation use efficiency in China’s northern and southern forests. Ann. For. Sci. 2019, 76, 92. [Google Scholar] [CrossRef]
  39. Sun, J.; Zhou, T.-C.; Liu, M.; Chen, Y.-C.; Liu, G.-H.; Xu, M.; Shi, P.-L.; Peng, F.; Tsunekawa, A.; Liu, Y.; et al. Water and heat availability are drivers of the aboveground plant carbon accumulation rate in alpine grasslands on the Tibetan Plateau. Glob. Ecol. Biogeogr. 2020, 29, 50–64. [Google Scholar] [CrossRef] [Green Version]
  40. Zhou, T.; Hou, G.; Sun, J.; Zong, N.; Shi, P. Degradation shifts plant communities from S- to R-strategy in an alpine meadow, Tibetan Plateau. Sci. Total Environ. 2021, 800, 149572. [Google Scholar] [CrossRef]
  41. Wang, T.; Ren, H.B.; Ma, K.P. Climatic signals in tree ring of Picea schrenkiana along an altitudinal gradient in the central Tianshan Mountains, northwestern China. Trees-Struct. Funct. 2005, 19, 736–742. [Google Scholar] [CrossRef]
  42. Wang, Z.; Wang, H.; Wang, T.; Wang, L.; Huang, X.; Zheng, K.; Liu, X. Effects of Environmental Factors on the Changes in MODIS NPP along DEM in Global Terrestrial Ecosystems over the Last Two Decades. Remote Sens. 2022, 14, 713. [Google Scholar] [CrossRef]
  43. Zheng, Z.; Zhu, W.; Zhang, Y. Seasonally and spatially varied controls of climatic factors on net primary productivity in alpine grasslands on the Tibetan Plateau. Glob. Ecol. Conserv. 2019, 21, e00814. [Google Scholar] [CrossRef]
  44. Ge, W.; Deng, L.; Wang, F.; Han, J. Quantifying the contributions of human activities and climate change to vegetation net primary productivity dynamics in China from 2001 to 2016. Sci Total Environ. 2021, 773, 145648. [Google Scholar] [CrossRef] [PubMed]
  45. Quan, Q.; Tian, D.; Luo, Y.; Zhang, F.; Crowther, T.W.; Zhu, K.; Chen, H.Y.H.; Zhou, Q.; Niu, S. Water scaling of ecosystem carbon cycle feedback to climate warming. Sci. Adv. 2019, 5, eaav1131. [Google Scholar] [CrossRef] [Green Version]
  46. Klein, J.A.; Harte, J.; Zhao, X.-Q. Experimental warming, not grazing, decreases rangeland quality on the tibetan plateau. Ecol. Appl. 2007, 17, 541–557. [Google Scholar] [CrossRef]
  47. Craine, J.M.; Ocheltree, T.W.; Nippert, J.B.; Towne, E.G.; Skibbe, A.M.; Kembel, S.W.; Fargione, J.E. Global diversity of drought tolerance and grassland climate-change resilience. Nat. Clim. Chang. 2013, 3, 63–67. [Google Scholar] [CrossRef]
  48. Reich, P.B.; Oleksyn, J. Global patterns of plant leaf N and P in relation to temperature and latitude. Proc. Natl. Acad. Sci. USA 2004, 101, 11001–11006. [Google Scholar] [CrossRef] [Green Version]
  49. Wang, Y.P.; Law, R.M.; Pak, B. A global model of carbon, nitrogen and phosphorus cycles for the terrestrial biosphere. Biogeosciences 2010, 7, 9891–9944. [Google Scholar] [CrossRef] [Green Version]
  50. Du, E.; Terrer, C.; Pellegrini, A.F.A.; Ahlstrom, A.; Van Lissa, C.J.; Zhao, X.; Xia, N.; Wu, X.; Jackson, R.B.J.N.G. Global patterns of terrestrial nitrogen and phosphorus limitation. Nat. Geosci. 2020, 13, 221–226. [Google Scholar] [CrossRef]
  51. Grime, J.P. Evidence for the existence of three primary strategies in plants and its relevance to ecological and evolutionary theory. Am. Nat. 1977, 111, 1169–1194. [Google Scholar] [CrossRef]
  52. Pierce, S.; Negreiros, D.; Cerabolini, B.E.L.; Kattge, J.; Díaz, S.; Kleyer, M.; Shipley, B.; Wright, S.J.; Soudzilovskaia, N.A.; Onipchenko, V.G.; et al. A global method for calculating plant CSR ecological strategies applied across biomes world-wide. Funct. Ecol. 2017, 31, 444–457. [Google Scholar] [CrossRef]
  53. Pierce, S.; Luzzaro, A.; Caccianiga, M.; Ceriani, R.M.; Cerabolini, B. Disturbance is the principal alpha-scale filter determining niche differentiation, coexistence and biodiversity in an alpine community. J. Ecol. 2007, 95, 698–706. [Google Scholar] [CrossRef]
  54. Hallett, L.M.; Hsu, J.S.; Cleland, E.E.; Collins, S.L.; Dickson, T.L.; Farrer, E.C.; Gherardi, L.A.; Gross, K.L.; Hobbs, R.J.; Turnbull, L.; et al. Biotic mechanisms of community stability shift along a precipitation gradient. Ecology 2014, 95, 1693–1700. [Google Scholar] [CrossRef] [PubMed] [Green Version]
  55. Peng, D.; Wu, C.; Zhang, B.; Huete, A.; Zhang, X.; Sun, R.; Lei, L.; Huang, W.; Liu, L.; Liu, X.; et al. The Influences of Drought and Land-Cover Conversion on Inter-Annual Variation of NPP in the Three-North Shelterbelt Program Zone of China Based on MODIS Data. PLoS ONE 2016, 11, e0158173. [Google Scholar] [CrossRef]
  56. Chen, L.; Jiang, L.; Jing, X.; Wang, J.; Shi, Y.; Chu, H.; He, J.-S. Above- and belowground biodiversity jointly drive ecosystem stability in natural alpine grasslands on the Tibetan Plateau. Glob. Ecol. Biogeogr. 2021, 30, 1418–1429. [Google Scholar] [CrossRef]
  57. Bai, Y.; Han, X.; Wu, J.; Chen, Z.; Li, L.J.N. Ecosystem stability and compensatory effects in the Inner Mongolia grassland. Nature 2004, 431, 181–184. [Google Scholar] [CrossRef]
  58. Liang, J.; Zhou, M.; Tobin, P.C.; Mcguire, A.D.; Reich, P.B. Biodiversity influences plant productivity through niche–efficiency. Proc. Natl. Acad. Sci. USA 2015, 112, 5738–5743. [Google Scholar] [CrossRef] [Green Version]
Figure 1. The climatic zones in our study.
Remotesensing 14 02401 g001
Figure 2. The technical route of this study.
Remotesensing 14 02401 g002
Figure 3. The average value of the NPP (a), precipitation (Pre, (b)), and temperature (Tem, (c)) from 2001 to 2019 in space and the change rate in the NPP (d), precipitation (e), and temperature (f) from 2001 to 2019 in space.
Remotesensing 14 02401 g003
Figure 4. The dynamics of the NPP (a), precipitation (b), and temperature (c) in relatively humid regions and the dynamics of the NPP (d), precipitation (e), and temperature (f) in relatively arid regions from 2001 to 2019.
Remotesensing 14 02401 g004
Figure 5. The effects of precipitation on the NPP and temperature on the NPP in relatively humid regions (a) as well as in relatively arid regions (b); the effects of precipitation on the NPP in relatively humid and arid regions (c); the effects of temperature on the NPP in relatively humid and arid regions (d) from 2001 to 2019. Note: CCPN and CCTN represent the correlation between precipitation and NPP, and the correlation between temperature and NPP, respectively.
Remotesensing 14 02401 g005
Figure 6. The effects of precipitation (a) and temperature (b) on the NPP in relatively humid regions from 2001 to 2019, and the effects of precipitation (c) and temperature (d) on the NPP in relatively arid regions from 2001 to 2019.
Remotesensing 14 02401 g006
Figure 7. The inter-annual variable coefficients of the effects of precipitation on the NPP and temperature on the NPP in relatively humid regions (a) as well as in relatively arid regions (b); the contribution rates of precipitation and temperature on the NPP in relatively humid regions (c) as well as in relatively arid regions (d), respectively.
Remotesensing 14 02401 g007
Figure 8. Summary of the conceptual model of NPP in response to the climate changes during 2001–2019.
Remotesensing 14 02401 g008
Table 1. The abbreviations used frequently in our study.
Full NameAbbreviationUnits
Net primary productivityNPPgC m−2 yr−1
Moderate-resolution Imaging Spectror adiometerMODIS
Tibetan PlateauTP
Annual mean precipitationAMPmm
Annual mean temperatureAMT°C
Publisher’s Note: MDPI stays neutral with regard to jurisdictional claims in published maps and institutional affiliations.

