Article

The Impact of Central Heating on the Urban Thermal Environment Based on Multi-Temporal Remote Sensing Images

1
Aerospace Information Research Institute, Chinese Academy of Sciences, Beijing 100094, China
2
University of Chinese Academy of Sciences, Beijing 100049, China
3
School of Remote Sensing and Information Engineering, North China Institute of Aerospace Engineering, Langfang 065000, China
4
School of Environmental Science and Engineering, Southern University of Science and Technology, Shenzhen 518055, China
5
School of Resources and Environmental Engineering, Ludong University, Yantai 264025, China
*
Author to whom correspondence should be addressed.
Remote Sens. 2022, 14(10), 2327; https://doi.org/10.3390/rs14102327
Submission received: 26 March 2022 / Revised: 8 May 2022 / Accepted: 9 May 2022 / Published: 11 May 2022

Abstract

:
Research on the impact of anthropogenic heat discharge in a thermal environment is significant in climate change research. Central heating is more common in the winter in Northeast China as an anthropogenic heat. This study investigates the impact of central heating on the thermal environment in Shenyang, Changchun, and Harbin based on multi-temporal land surface temperature retrieval from remote sensing. An equivalent heat island index method was proposed to overcome the problem of the method based on a single-phase image, which cannot evaluate all the central heating season changes. The method improves the comprehensiveness of a thermal environment evaluation by considering the long-term heat accumulation. The results indicated a significant increase in equivalent heat island areas at night with 22.1%, 17.3%, and 19.5% over Shenyang, Changchun, and Harbin. The increase was significantly positively correlated with the central heating supply (with an R-value of 0.89 for Shenyang, 0.93 for Changchun, and 0.86 for Harbin; p < 0.05). The impact of central heating has a more significant effect than the air temperature. The results provide a reference for future studies of urban thermal environment changes.

Graphical Abstract

1. Introduction

The urban thermal environment affects the water vapor cycle, atmospheric diffusion, human health, etc. [1,2,3]. Therefore, scholars have long been devoted to studying the factors that lead to such changes in the urban thermal environment [4,5]. The Intergovernmental Panel on Climate Change (IPCC) found that human-induced temperatures were about one degree higher than the pre-industrial levels by 2017 [6]. The impact of anthropogenic heat on the urban thermal environment cannot be ignored [7]. Northeast China is the coldest region in China, with long and cold winters [8]. Large-scale central heating facilities have been built to deliver heat to the city in order to help residents cope with the severe cold of winter [9]. With urbanization, the central heating supplies in some cities have increased significantly [10]. As a type of anthropogenic heat, central heating produces a large amount of heat, and a study pointed out that central heating may be the main reason for increasing the winter temperatures in urban areas [11]. Understanding this impacts on the urban thermal environment is significant for predicting urban climate changes [12].
Recently, many studies have investigated the impact of anthropogenic heat on the thermal environment [13,14,15,16], which has been carried out on specific types of anthropogenic heat, such as air conditioning waste heat [17,18] and industrial heat [19,20]. Some studies have analyzed the correlation between anthropogenic heat and thermal environment changes [21,22]. For example, Liao et al. [23] examined the relationship between energy consumption and the annual variations of heat islands and found that the anthropogenic heat released from energy consumption impacted nighttime heat islands. However, this consumption-based approach analyzed multiple kinds of anthropogenic heat impacts together, and the specific impacts of central heating were unclear. At the same time, the study of the long-term cumulative impact of central heating on the thermal environment is still lacking. Other studies used a numerical model to simulate regional implications and analyzed the impact of anthropogenic heat [24,25]. For central heating, Huang et al. [26] studied the impact of central heating based on the WRF (weather research and forecasting model) and found that central heating caused a sudden temperature increase (7 °C) at night. However, this study assumed that heat is released simultaneously, simplifying the actual situation and exaggerating the impact.
In summary, there have been relatively few studies on central heating. For the statistical correlation method, the cumulative effect of central heating has not been considered, and for the numerical model simulation, the lack of detailed land surface parameters limited the model’s performance [27,28]. Since central heating usually lasts for several months, the air temperature changes significantly [29]. The impact of long-term central heating needs to be studied with more reliable data. Remote sensing can provide long-term spatially continuous observation of the land surface temperature [30]. It has been an effective method widely used in analyzing the annual changes in the thermal environment over recent years [31].
To evaluate long-term changes based on remote sensing, some studies have investigated the yearly changes in the winter or summer by using one image each year and comparing the annual differences [32,33]. However, studies have shown that changing the ambient temperature can lead to changes in the urban heat intensity over time, and the same city can experience different urban heat island intensities at different times [34]. The results calculated based on one moment cannot represent the whole central heating season and are inadequate to assess the long-term cumulative effects [35]. Some studies have estimated the monthly, seasonal, and annual average land surface temperature changes [36,37,38,39,40,41]. For example, based on the seasonal average land surface temperature, Du et al. [42] found that the total energy consumption at night can explain urban heat islands to a greater degree. However, the mean temperature method weakens the understanding of the intensity of the high urban heat islands [43,44]. There is a lack of methods that can quantify the cumulative heat effects based on remote sensing for the long-term evaluation of a thermal environment.
This study aims to propose a method to evaluate long-term heat accumulation based on multi-temporal remote sensing images and analyze the impact of central heating on the spatial–temporal variations of the thermal environment in three central heating study areas.

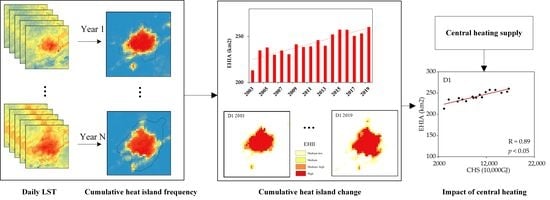
2. Materials and Methods

2.1. Study Sites

The study areas are located in the capital cities (Shenyang, Changchun, and Harbin) of the three northeastern provinces of China, as shown in Figure 1. The three study areas are core cities in the northeast economic zone where people gather.
Study area 1 (D1) is located between 123.10°E and 123.63°E, 41.61°N and 42.00°N, covering the core urban area of Shenyang. The annual average air temperature is 9.4 °C, the maximum average air temperature in the summer is 23.6 °C, and the minimum average temperature in the winter is −7.3 °C [45]. The relative humidity is 60–75% in the summer [46]. Shenyang’s use of central heating is usually from 1 November to 31 March of the following year. Study area 2 (D2) is located between 125.00°E and 125.47°E, 43.71°N and 44.10°N. Changchun’s annual average air temperature is 4.8 °C, the average air temperature is 22 °C in the summer, the average air temperature is around −14 °C in the winter, and the average relative humidity is 70% in the summer [47]. The central heating period in Changchun is between 20 October and 10 April of the following year. Study area 3 (D3) is located between 45.51°N and 45.86°N, 126.48°E and 126.88°E. The annual average air temperature is 5.6 °C, the maximum monthly average air temperature in the summer is 23.6 °C, and the minimum monthly average temperature is −15.8 °C [48]. The relative humidity is 45~75% in the summer [49]. The central heating period in Harbin starts from 20 October to 20 April of the following year. In this article, the periods in which central heating is used in the three cities are referred to as the study areas’ central heating seasons.

2.2. Data and Data Preprocessing

This study utilized national statistics to calculate the central heating supply (CHS). Daily land surface temperature (LST) data was used to extract the characteristics of the cities’ changes in the thermal environment. Air temperature (T2) data was used to analyze the cities’ climates. Impervious surface (ISA) data was used to analyze the transitions in the city area.
National statistics on urban central heating were collected from the Statistical Yearbook of the Ministry of Housing and Urban-Rural Development of China (http://www.mohurd.gov.cn/gongkai/fdzdgknr/sjfb/tjxx/index.html) (accessed on 2 February 2016). In recent years, officials have regularly published the data on urban central heating in statistical yearbooks collected from the statistics reported by each city’s central heating management department. The study added the central heating of steam and hot water to the total urban central heating supply. The CHS of the three cities has shown a significant upward trend from 2003 to 2019, as shown in Table 1. Harbin has the highest CHS.
The land surface temperature data was obtained from TRIMS LST (Thermal and Reanalysis Integrating Moderate-resolution Spatial-seamless LST) (http://poles.tpdc.ac.cn/zh-hans/) (accessed on 16 July 2021), which is a reconstructed high-quality all-weather LST dataset that merges the reanalysis data [50]. The dataset provides the spatiotemporally continuous LST and has a high consistency with Aqua MODIS LST products [51,52]. The dataset provided daily LST from 2000 to 2020 and is suitable for analyzing long-term temperature changes. Actual measurements verified the data at weather stations in Northeast China, and the RMSE was 1.52–3.71 K [53]. The data were divided into daytime and nighttime twice a day, with a spatial resolution of 1 km. Studies have pointed out that the urban thermal environment during the day is greatly affected by solar radiation. Therefore, the impacts of central heating were studied based on nighttime data. All nighttime images of the central heating seasons from 2003 to 2019 were used, including 2572 images for D1, 2946 images for D2, and 3116 images for D3, due to the different lengths of the central heating seasons in the study areas. All images were coordinate system-converted and cropped in python using ArcPy and ArcGIS.
In the previous studies, a NCEP-NCAR reanalysis was often used to represent large-scale climate changes due to being insensitive to the local effects of urbanization [54,55,56]. The air temperature data used to reflect the climate changes of the central heating seasons were selected from the daily 2-m temperature (T2) of the NCEP-NCAR reanalysis data (https://psl.noaa.gov/data/gridded/data.ncep.reanalysis.html) (accessed on 20 October 2014) [57]. The air temperature time series from 2003 to 2019 was constructed using the mean air temperature of the central heating season for the three study areas.
The impervious surface area (ISA) data were obtained from annual maps of the global artificial impervious area (GAIA) between 1985 and 2018 (http://data.ess.tsinghua.edu.cn/gaia.html) (accessed on 19 November 2019). The data had a spatial resolution of 30 m, the overall mean accuracy was higher than 90% [58], and the data have been widely used in urban research [59,60]. The impervious surface data were cropped according to the study areas.

2.3. Methods

The research process of this paper consists of three parts, including index construction, relationship analysis, and method comparisons, which are shown in Figure 2.
An equivalent heat island index (EHI) was constructed based on the daily LST time series in the index construction part. The changes in the entire central heating season were analyzed based on the EHI. Based on the EHI, the equivalent heat island area (EHIA) and equivalent heat island intensity (EHII) of the central heating season were calculated to evaluate the spatial–temporal characteristics of the thermal environment. The detailed construction method is in Section 2.3.1.
In the relationship analysis part, a Pearson correlation analysis between the EHIA, EHII, and the CHS data time series was performed to analyze the relationship between urban heat islands and central heating. Then, the relative contribution of the central heating supply and air temperature to the thermal environment change was compared with the method in Section 2.3.2.
The comparison with the single-phase method and the mean method was carried out in the method comparison part. The detailed comparison method is introduced in Section 2.3.3.

2.3.1. Equivalent Heat Island Index Construction Method

In order to comprehensively evaluate the heat island in the annual central heating period, an equivalent heat island index (EHI) was constructed. Based on the EHI, the equivalent heat island area (EHIA) and the equivalent heat island intensity (EHII) were calculated, respectively. The EHIA was used to analyze the annual variations in the urban heat island area during the central heating season. The change in different EHIIs was used to analyze the spatial variations of the thermal environment. The details of this method are as follows.
The equivalent heat island index was constructed for a long-term comprehensive evaluation of the thermal environment. The steps for the specific index construction were as follows. First, the mean and standard deviation of the daily LST images were calculated using Equations (1) and (2).
E ( L S T ) d a t e = x = 1 i y = 1 j L S T d a t e ( x , y ) i j
S T D ( L S T ) d a t e = 1 i j x = 1 i y = 1 j | L S T d a t e ( x , y ) E ( L S T ) d a t e | 2
where L S T d a t e ( x , y ) is the LST of the pixel at positions (x, y) in the image on the date, i*j is the total number of pixels in the corresponding image, E ( L S T ) d a t e is the mean of L S T d a t e , and S T D ( L S T ) d a t e is the standard deviation.
The thermal classification method of the mean standard deviation in the existing research [61] was used to calculate the urban heat island classification threshold in Table 2.
The sum of the mean value and the standard deviation of each image was used as the threshold value ( T H d a t e ) for the corresponding image, as shown in Equation (3).
T H d a t e = E ( L S T ) d a t e + S T D ( L S T ) d a t e
For each image, the urban heat island and non-urban heat island were divided according to the T H d a t e . The pixels whose pixel values were greater than or equal to the T H d a t e were assigned a value of 1, and the pixels that did not meet the conditions were assigned a value of 0. The daily heat island image ( I m a g e d a t e ) was calculated according to Equation (4).
I m a g e d a t e ( x , y ) = { 1 , i f   L S T d a t e ( x , y ) T H d a t e 0 , i f   L S T d a t e ( x , y ) < T H d a t e
The I m a g e d a t e ( x , y ) of each day during the central heating season was added, and then, the result was divided by the number of days added to calculate the cumulative heat island frequency, as shown in Equation (5).
EHI ( x , y ) = d a t e = 1 N I m a g e d a t e ( x , y ) N
where N is the total number of days in the central heating season, and the cumulative heat island frequency is referred to as the equivalent heat island index (EHI) in this article.
To calculate the area of the equivalent heat island, the EHI of each pixel was multiplied by the area of the pixel, and the results of all the pixels were added to get the equivalent heat island area ( EHIA ) of the central heating season in Equation (6).
EHIA = x = 1 i y = 1 j EHI ( x , y ) A r e a p i x e l
where A r e a p i x e l is the area of the pixel, EHI is the equivalent heat island index, and EHIA is the equivalent heat island area.
To compare the difference in the EHI, the EHI was classified using the density slicing classification methods [20,62], as shown in Table 3, and the result of the classification is referred to as the equivalent heat island intensity (EHII).
The EHIA of each central heating season was calculated according to Equation (6), and the time series from 2003 to 2019 was constructed. The area percentage change with different equivalent heat island intensities was calculated, and the time series of the area with different EHII from 2003 to 2019 was obtained. Since this study is based on remote sensing images at night, the results mentioned in this paper refer to the results at night.

2.3.2. Relative Contribution Analysis Method

The thermal environment of urban areas is also affected by air temperature changes [22]. The relative contributions of central heating and the air temperature were analyzed based on the LMG method. The Lindeman–Merenda–Gold (LMG) method can evaluate the relative importance of the relevant factors using multiple regression [63]. The LMG method decomposes R2 into non-negative contributions that automatically add up to the total R2 [64] and is widely used in existing research [65,66]. The time series of EHIA was used as the dependent variable, and the time series of the average air temperature and CHS were employed as independent variables for the LMG analysis.

2.3.3. Method Comparison

In comparison with the single-phase image method, the daily heat island area was calculated firstly to analyze the changes in the thermal environment. Then, the time series was constructed based on the daily heat island area during the central heating season, and the variation trend of the daily heat island area was extracted based on the widely used seasonal and trend decomposition using locally weighted regression (STL) method [67,68,69]. The changing trend of the analysis based on daily images was compared with the results obtained by the method proposed in the paper.
In comparison with the mean method, since the area of the urban heat island cannot be measured, considering the correlation between the urban heat island and impervious surface [70,71,72], the proposed method was compared with the mean method in terms of their correlation with the ISA time series. The mean land surface temperature of the central heating season was calculated, and the hot urban heat island area was calculated based on the mean LST image according to the mean standard deviation threshold method [61]. In this paper, the extracted result was referred to as the average heat island area (AHI). The AHI time series for each study site was constructed from 2003 to 2019. To construct the ISA time series, a fishnet was created considering the resolution of the LST data [73], and the proportion of the ISA in each grid cell of the fishnet was calculated. Then, based on the impervious surface area of the pixel, the impervious surface area of the entire study area for each year was calculated. Since there was no data for 2019, data from 2018 were used instead. Each study site’s impervious surface area time series was constructed from 2003 to 2019.

3. Results

3.1. Spatial–Temporal Characteristics of Thermal Environment

3.1.1. Change of the Equivalent Heat Island Index

The change in the mean air temperature (T2) during the central heating season for each study area is shown in Figure 3. The average air temperature of D1 was the highest, and the air temperature of D3 was the lowest. The results of years with similar air temperatures were selected for comparison: 2004 and 2017 for D1, 2007 and 2019 for D2, and 2006 and 2016 for D3.
The changes in the daily land surface temperature are observed in Figure 4. It can be seen that the LST of the urban areas was higher than the suburbs. The polygon of the urban extent was extracted from Google Earth images and the datasets of global annual urban extents [74]. There are apparent urban heat islands at night, and the urban heat island area in the hot region increased by 9.1% for D1, 19.6% for D2, and 47.7% for D3, according to the mean standard deviation method [61]. Since the urban heat island area has expanded, it is inferred that human activities induce change.
The EHI images calculated based on the daily LST image of the whole central heating season are shown in Figure 5. The images show the frequency of the occurrence of heat islands in different regions throughout the central heating season. The areas with a high frequency of heat islands are mainly in cities and suburbs, and there are apparent differences between outer towns and cities. The EHIA and EHII were used for specific change analyses.

3.1.2. Change of Equivalent Heat Island Area and Intensity

It is noticed that, compared with 2006, a large area with an increased EHI appeared in the upper left of D3 in 2016, as shown in Figure 5. Observing the winter using Landsat (Figure 6) showed that this area includes the river that passes through the city and the new city on the other side of the river. Studies have pointed out that, due to the differences in heat capacity, the land surface temperature of the water at night will be higher than that of bare soil and vegetation [75]. Since the area of the river in 2016 was more significant than in 2006, the thermal area at the corresponding location was more effective. In D1, it was found that the river running through the city showed a city-like heat island phenomenon. Since a large river area at night in the winter presents a heat island phenomenon similar to that of suburban areas, this affected the analysis of the urban heat island area. Therefore, it was necessary to mask the river area before calculating the EHIA.
The equivalent heat island area changes in the three study areas are shown in Figure 7. Unlike the slight increase in the air temperature, the changes in the EHIA showed a significant upward trend (2.15 km2 year−1 for D1, 2.60 km2 year−1 for D2, and 1.63 km2 year−1 for D3; p < 0.001) based on the least squares linear regression method [76]. From 2003 to 2019, the EHIA of D1 increased by 22.1%, D2 increased by 17.3%, and D3 increased by 19.5%.
The variations in the equivalent heat island intensity are shown in Figure 8, Figure 9 and Figure 10. For the three study areas, the urban core area is in a high EHII. It is observed that the high EHII in the D1 area expands to the south, and the high EHII in the D2 area expands to the east. The existing research on D1 and D2 has shown that the urban center of the D1 area has moved southward, and the urban center of gravity of the D2 area has moved eastward [77]. The newly added equivalent heat island area in the northern part of the D3 area has reflected the impact of the new area built by the city. Therefore, the observed phenomenon based on the equivalent heat island intensity is consistent with the changes in the city.

3.2. Relationship between Urban Heat Island and Central Heating

3.2.1. Correlation Analysis between EHIA and CHS

The EHIA and regional air temperature time series correlation analysis showed no significant correlation. Combined with the phenomenon of night heat island area expansion, the Pearson correlation results between the regional thermal environment and central heating are shown in Figure 11. In the three study areas, the time series changes of the EHIA were all positively correlated with the central heating supply. For D1, the correlation coefficient was 0.89; in D2, it was 0.93; and in D3, it was 0.86. This illustrated that the equivalent heat island area increased with the increase in the central heat supply. In the nighttime, central heating affected the urban heat island for the study areas.

3.2.2. Correlation Analysis between EHII and CHS

The percentage changes of the different equivalent heat island intensities area are shown in Figure 12. The area with a high EHII increased more than other intensities for D1. For D2 and D3, all the EHII apparently increased. The correlation between different EHII and the central heating supply is shown in Table 4. For D2 and D3, central heating significantly affected the medium-high, medium, and medium-low changes in the EHII. The cities in these two study areas are expanding outward, and the addition of central heating in buildings is making more areas show more heat islands. For the D1 area, the areas with a high EHII are most affected by central heating. The city in the D1 area entered a high-speed area in 2004 and has stayed there ever since. During the changing stage, large areas of dilapidated houses were demolished in the city to make way for new construction. At the same time, about half of the developed infrastructure and population was still concentrated in the core area, resulting in a high population density in the city center [78,79]. The construction of the new building in the old area made the heating capacity of the high EHII area more extensive and the central heating effect more significant.

3.2.3. Relative Contribution of Central Heating

Urban thermal environments are simultaneously affected by changes in central heating and natural air temperatures. The results of the relative contributions of central heating and air temperature are shown in Table 5. The central heating supply was vital in all three study areas, with a 98% contribution rate. The relative impact of changes in the air temperature was less than 3%. Central heating has a more significant impact on urban heat islands at night than the air temperature.

3.3. Thermal Environment Analysis Using Existing Methods

3.3.1. Analysis Based on the Daily LST

The daily urban heat island area time series of the three study areas are shown in Figure 13. The areas of urban heat islands vary daily, and it is not appropriate to represent the annual central heating season with the heat island area of a single day. By performing seasonal trend decompositions, it can be found that there is no significant periodicity between years and that the urban heat island areas of the three study areas all showed an upward trend.

3.3.2. Analysis Based on Mean LST

To use the average results for the evaluation of long-term changes, the spatial distribution of the mean LST in the study areas is drawn in Figure 14. The whole central heating season shows the urban heat island phenomenon at night. Still, the urban heat island boundary is not as apparent as the EHI, as shown in Figure 5. The EHI images provided more information than the mean LST.
The correlations results between changes in the EHIA, AHI, and ISA are shown in Figure 15. In the three study areas, the time series changes of the EHIA are all positively correlated with the ISA. For D1, the correlation coefficient is 0.87; in D2, it is 0.97; and in D3, it is 0.87. The time series changes of the AHI are positively correlated with the ISA. For D1, the correlation coefficient is 0.78; in D2, it is 0.96; and in D3, it is 0.86. It illustrated that the EHIA and AHI have consistency with the ISA.

4. Discussion

4.1. Comparison with Existing Methods

In this paper, a method to evaluate the thermal accumulation based on long-term LST was proposed for the first time. Compared with the existing studies, it increases the consideration of the accumulation effect and realizes an evaluation of the process of dynamic change. The method introduced in this study is compared with those of existing studies as follows.
As mentioned in the Introduction, existing studies have used single-phase [32,33] or average results for long-term evaluations [36,37,38,39,40,41]. To use single-phase data, Bijay et al. [80] selected one remote sensing image each year for analysis to compare 2000 and 2020, ignoring the fact that these images were acquired on different months. Through the analysis of annual single-phase image changes, as described in Section 3.3.1, it was found that there are variations in the daily heat island area during the central heating season. For the comparison of interannual thermal environment changes based on single-phase images, the results vary depending on the chosen date each year for comparison. The traditional analysis based on a single phase representing the whole year is not suitable for analyzing the comprehensive impact of the central heating season. In contrast, the equivalent heat island index proposed in this study is based on comprehensive statistics of the daily heat island of the central heating season, and the evaluation is more reliable.
The mean method ignored the low-frequency areas with heat islands, and regional areas with heat islands more than half the time in the central heating season were classified as heat islands. In the above case, the heat island obtained by the mean method will bias the understanding of the actual situation in different parts of the city. The correlations between changes in the EHIA, AHI, and ISA show that the equivalent heat island area has better consistency with the changes of the urban impervious surface than the average heat island area in Figure 15. From the comprehensive evaluation of the long-term heat island area, the equivalent heat island method considering the frequency in time dimension is more suitable. The average method inadequately assesses the cumulative effects.

4.2. Implications for Future Studies

This study analyzed the impact of central heating on urban heat islands in actual scenarios based on data from remote sensing. This study quantitatively evaluated the impact of central heating using remote sensing images. Many regions demand central heating in the winter and are continuously increasing [10]. The impact of new central heating areas on the thermal environment needs to be evaluated during planning, and the research results can provide a reference for planning decisions. The equivalent heat island index method constructed in this paper can be applied to the comprehensive evaluation of the long-term thermal environment in different scenarios and regions, providing a new method for studying heat islands.
On the other hand, previous studies have found that urban high temperatures are slightly lower based on model simulations [81] and that the introduction of anthropogenic heat can effectively improve the simulation results of a thermal environment [82]. Thus, the evaluation of the impact of central heating is conducive to more accurate urban thermal environment simulations.

4.3. Limitation and Uncertainty

While the results enrich the knowledge of the impact of central heating on urban thermal environments, the limitations and uncertainty should be highlighted.
The process of constructing the EHI was based on images from all days of the study period in order to achieve a comprehensive evaluation. In practical applications, the use of this method may be limited by the data. For example, the influence of clouds can lead to missing data and the inability to obtain a complete time series. At present, the analysis is based on data filled by multisource and multi-type data fusion.
In order to analyze the long-time cumulative impact based on daily images of the central heating season, the spatial resolution of the data was compromised while ensuring the temporal resolution. In this case, there was uncertainty about the representation of the spatial details. Further analyses can be carried out if the time series data on land surface temperatures are available with high spatial and temporal resolution in the future.

5. Conclusions

An EHI method was developed in this study to evaluate the heat accumulation effect. The construction of the EHI took into account the dynamic process of thermal environment changes. The constructed index was used to quantify the yearly changes in heat islands and to better and more comprehensively estimate the heat islands for the entire central heating season. To the best of our knowledge, this is the first time that a LST time series has been used for the long-term evaluation of cumulative effects and then to quantify the impact of central heating. The proposed method can be applied to the study of other regions and support more urban thermal research. The major conclusions are summarized as follows:
(1)
The urban core area has a high intensity of equivalent heat islands for the three study areas. During the central heating season, the nighttime urban heat island area increased from 2003 to 2019. Compared with 2013, Shenyang’s equivalent heat island area increased by 22.1%, Changchun increased by 17.3%, and Harbin increased by 19.5%.
(2)
This increasing trend of the equivalent heat island area and the equivalent heat island intensity was highly positively correlated with the central heating supply (R is 0.89 for Shenyang, 0.93 for Changchun, and 0.86 for Harbin; p < 0.05). Additionally, the impact of central heating is more significant than that of the air temperature.

Author Contributions

Conceptualization, X.C. and Y.Z. (Yulin Zhan); Data curation, X.C.; Formal analysis, Y.Z. (Yazhou Zhang); Methodology, X.C. and Y.Z. (Yulin Zhan); Project administration, X.G.; Software, X.C.; Supervision, X.G.; Validation, X.C., F.M., and D.W.; Visualization, X.C. and Q.L.; Writing—original draft, X.C.; and Writing—review and editing, F.M. and S.S. All authors have read and agreed to the published version of the manuscript.

Funding

This research was funded by the National Key R&D Program of China, grant numbers 2019YFE0127300 and 2020YFE0200700, the Major Special Project—the China High-Resolution Earth Observation System, grant number 30-Y30F06-9003-20/22, and the National Natural Science Foundation of China, grant number 42005104.

Acknowledgments

The dataset was provided by the National Tibetan Plateau Data Center (http://data.tpdc.ac.cn) (accessed on 16 July 2021).

Conflicts of Interest

The authors declare no conflict of interest.

References

  1. Bahi, H.; Mastouri, H.; Radoine, H. Review of methods for retrieving urban heat islands. Mater. Today Proc. 2020, 27, 3004–3009. [Google Scholar] [CrossRef]
  2. Cai, D.; Fraedrich, K.; Guan, Y.; Guo, S.; Zhang, C. Urbanization and the thermal environment of Chinese and US-American cities. Sci. Total Environ. 2017, 589, 200–211. [Google Scholar] [CrossRef] [PubMed] [Green Version]
  3. Laschewski, G.; Jendritzky, G. Effects of the thermal environment on human health: An investigation of. Clim. Res. 2002, 21, 91–103. [Google Scholar] [CrossRef] [Green Version]
  4. Chen, F.; Yang, X.; Zhu, W. WRF simulations of urban heat island under hot-weather synoptic conditions: The case study of Hangzhou City, China. Atmos. Res. 2014, 138, 364–377. [Google Scholar] [CrossRef]
  5. Li, H.; Zhou, Y.; Wang, X.; Zhou, X.; Zhang, H.; Sodoudi, S. Quantifying urban heat island intensity and its physical mechanism using WRF/UCM. Sci. Total Environ. 2019, 650, 3110–3119. [Google Scholar] [CrossRef] [PubMed]
  6. Allen, M.R.; Dube, O.P.; Solecki, W.; Aragón-Durand, F.; Cramer, W.; Humphreys, S.; Kainuma, M.; Kala, J.; Mahowald, N.; Mulugetta, Y.; et al. An IPCC Special Report on the Impacts of Global Warming of 1.5 °C above Pre-Industrial Levels and Related Global Greenhouse Gas Emission Pathways, in the Context of Strengthening the Global Response to the Threat of Climate Change, Sustainable Development. Available online: https://www.ipcc.ch/sr15/ (accessed on 8 October 2018).
  7. Yang, B.; Yang, X.; Leung, L.R.; Zhong, S.; Qian, Y.; Zhao, C.; Chen, F.; Zhang, Y.; Qi, J. Modeling the Impacts of Urbanization on Summer Thermal Comfort: The Role of Urban Land Use and Anthropogenic Heat. J. Geophys. Res. Atmos. 2019, 124, 6681–6697. [Google Scholar] [CrossRef]
  8. Shen, X.; Liu, B.; Zhou, D. Spatiotemporal changes in the length and heating degree days of the heating period in Northeast China. Meteorol. Appl. 2017, 141, 135–141. [Google Scholar] [CrossRef] [Green Version]
  9. Agency, I.E. District Energy Systems in China. Available online: https://www.iea.org/reports/district-energy-systems-in-china (accessed on 23 January 2018).
  10. Shen, X.; Liu, B. Changes in the timing, length and heating degree days of the heating season in central heating zone of China. Sci. Rep. 2016, 6, 33384. [Google Scholar] [CrossRef]
  11. Ju, L.; Junxia, D.; Howard, L. Progress in Urban Meteorological Experiments in Beijing. Adv. Meteorol. Sci. Technol. 2014, 1, 38–47. (In Chinese) [Google Scholar]
  12. Li, J.; Sun, R.; Liu, T.; Xie, W.; Chen, L. Prediction models of urban heat island based on landscape patterns and anthropogenic heat dynamics. Landsc. Ecol. 2021, 36, 1801–1815. [Google Scholar] [CrossRef]
  13. Kimura, F.; Takahashi, S. The effects of land-use and anthropogenic heating on the surface temperature in the Tokyo Metropolitan area: A numerical experiment. Atmos. Environ. Part B Urban Atmos. 1991, 25, 155–164. [Google Scholar] [CrossRef]
  14. Ichinose, T.; Shimodozono, K.; Hanaki, K. Impact of anthropogenic heat on urban climate in Tokyo. Atmos. Environ. 1999, 33, 3897–3909. [Google Scholar] [CrossRef]
  15. Bohnenstengel, S.I.; Hamilton, I.; Davies, M.; Belcher, S.E. Impact of anthropogenic heat emissions on London’s temperatures. Q. J. R. Meteorol. Soc. 2014, 140, 687–698. [Google Scholar] [CrossRef]
  16. Firozjaei, M.K.; Weng, Q.; Zhao, C.; Kiavarz, M.; Lu, L.; Alavipanah, S.K. Surface anthropogenic heat islands in six megacities: An assessment based on a triple-source surface energy balance model. Remote Sens. Environ. 2020, 242, 111751. [Google Scholar] [CrossRef]
  17. Munck, C.; Pigeon, G.; Masson, V.; Meunier, F.; Bousquet, P.; Tréméac, B.; Merchat, M.; Poeuf, P.; Marchadier, C. How much can air conditioning increase air temperatures for a city like Paris, France? Int. J. Climatol. 2013, 33, 210–227. [Google Scholar] [CrossRef]
  18. Ohashi, Y.; Genchi, Y.; Kondo, H.; Kikegawa, Y.; Hirano, Y. Influence of Air-Conditioning Waste Heat on Air Temperature in Tokyo during Summer: Numerical Experiments Using an Urban Canopy Model Coupled with a Building Energy Model. J. Appl. Meteorol. Climatol. 2007, 46, 66–81. [Google Scholar] [CrossRef]
  19. Meng, Q.; Hu, D.; Zhang, Y.; Chen, X.; Zhang, L.; Wang, Z. Do industrial parks generate intra-heat island effects in cities? New evidence, quantitative methods, and contributing factors from a spatiotemporal analysis of top steel plants in China. Environ. Pollut. 2022, 292, 118383. [Google Scholar] [CrossRef]
  20. Zhang, L.; Meng, Q.; Sun, Z.; Sun, Y. Spatial and temporal analysis of the mitigating effects of industrial relocation on the surface urban heat island over china. ISPRS Int. J. Geo-Inf. 2017, 6, 121. [Google Scholar] [CrossRef] [Green Version]
  21. He, C.; Zhou, L.; Yao, Y.; Ma, W.; Kinney, P.L. Estimating spatial effects of anthropogenic heat emissions upon the urban thermal environment in an urban agglomeration area in East China. Sustain. Cities Soc. 2020, 57, 102046. [Google Scholar] [CrossRef]
  22. Jin, K.; Wang, F.; Wang, S. Assessing the spatiotemporal variation in anthropogenic heat and its impact on the surface thermal environment over global land areas. Sustain. Cities Soc. 2020, 63, 102488. [Google Scholar] [CrossRef]
  23. Liao, W.; Liu, X.; Wang, D.; Sheng, Y. The impact of energy consumption on the surface urban heat island in China’s 32 major cities. Remote Sens. 2017, 9, 250. [Google Scholar] [CrossRef] [Green Version]
  24. Doan, V.Q.; Kusaka, H.; Nguyen, T.M. Roles of past, present, and future land use and anthropogenic heat release changes on urban heat island effects in Hanoi, Vietnam: Numerical experiments with a regional climate model. Sustain. Cities Soc. 2019, 47, 101479. [Google Scholar] [CrossRef]
  25. Feng, J.M.; Wang, Y.L.; Ma, Z.G.; Liu, Y.H. Simulating the regional impacts of urbanization and anthropogenic heat release on climate across China. J. Clim. 2012, 25, 7187–7203. [Google Scholar] [CrossRef]
  26. Bei, H.; Guangheng, N. Local climate impact of central heating in the winter based on the WRF-LUCY model. J. Tsinghua Univ. (Sci. Technol.) 2020, 60, 162–170. (In Chinese) [Google Scholar] [CrossRef]
  27. Yan, D.; Liu, T.; Dong, W.; Liao, X.; Luo, S.; Wu, K.; Zhu, X.; Zheng, Z.; Wen, X. Integrating remote sensing data with WRF model for improved 2-m temperature and humidity simulations in China. Dyn. Atmos. Ocean. 2020, 89, 101127. [Google Scholar] [CrossRef]
  28. Roșu, I.A.; Ferrarese, S.; Radinschi, I.; Ciocan, V.; Cazacu, M.M. Evaluation of different WRF parametrizations over the region of Iași with remote sensing techniques. Atmosphere 2019, 10, 559. [Google Scholar] [CrossRef] [Green Version]
  29. Cheng, J.; Ouyang, Y.; Zhang, J. Study On Temporal And Spatial Variation Of Winter Temperature In Northeast China. Sci. Technol. Inf. 2017, 3, 106–112. (In Chinese) [Google Scholar] [CrossRef]
  30. Williamson, S.N.; Hik, D.S.; Gamon, J.A.; Kavanaugh, J.L.; Flowers, G.E. Estimating temperature fields from MODIS land surface temperature and air temperature observations in a sub-arctic alpine environment. Remote Sens. 2014, 6, 946–963. [Google Scholar] [CrossRef] [Green Version]
  31. Zhou, D.; Zhao, S.; Liu, S.; Zhang, L.; Zhu, C. Surface urban heat island in China’s 32 major cities: Spatial patterns and drivers. Remote Sens. Environ. 2014, 152, 51–61. [Google Scholar] [CrossRef]
  32. Zhang, X.; Estoque, R.C.; Murayama, Y.; Ranagalage, M. Capturing urban heat island formation in a subtropical city of China based on Landsat images: Implications for sustainable urban development. Environ. Monit. Assess. 2021, 193, 130. [Google Scholar] [CrossRef]
  33. Chen, T.; Sun, A.; Niu, R. Effect of land cover fractions on changes in surface urban heat islands using landsat time-series images. Int. J. Environ. Res. Public Health 2019, 16, 971. [Google Scholar] [CrossRef] [PubMed] [Green Version]
  34. Lin, F.Y.; Huang, K.T.; Lin, T.P.; Hwang, R.L. Generating hourly local weather data with high spatially resolution and the applications in bioclimatic performance. Sci. Total Environ. 2019, 653, 1262–1271. [Google Scholar] [CrossRef] [PubMed]
  35. Oh, J.W.; Ngarambe, J.; Duhirwe, P.N.; Yun, G.Y.; Santamouris, M. Using deep-learning to forecast the magnitude and characteristics of urban heat island in Seoul Korea. Sci. Rep. 2020, 10, 3359. [Google Scholar] [CrossRef] [PubMed]
  36. Saher, R.; Stephen, H.; Ahmad, S. Effect of land use change on summertime surface temperature, albedo, and evapotranspiration in Las Vegas Valley. Urban Clim. 2021, 39, 100966. [Google Scholar] [CrossRef]
  37. Trlica, A.; Hutyra, L.R.; Schaaf, C.L.; Erb, A.; Wang, J.A. Albedo, Land Cover, and Daytime Surface Temperature Variation Across an Urbanized Landscape. Earth’s Futur. 2017, 5, 1084–1101. [Google Scholar] [CrossRef] [Green Version]
  38. Schwarz, N.; Lautenbach, S.; Seppelt, R. Exploring indicators for quantifying surface urban heat islands of European cities with MODIS land surface temperatures. Remote Sens. Environ. 2011, 115, 3175–3186. [Google Scholar] [CrossRef]
  39. Aminipouri, M.; Knudby, A. Spatio-temporal analysis of surface urban heat island (SUHI) using MODIS land surface temperature (LST) for summer 2003–2012, A case study of the Netherlands. In Proceedings of the International Geoscience and Remote Sensing Symposium (IGARSS), Quebec City, QC, Canada, 13–18 July 2014; pp. 3192–3193. [Google Scholar] [CrossRef]
  40. Liu, X.; Zhou, Y.; Yue, W.; Li, X.; Liu, Y.; Lu, D. Spatiotemporal patterns of summer urban heat island in Beijing, China using an improved land surface temperature. J. Clean. Prod. 2020, 257, 120529. [Google Scholar] [CrossRef]
  41. Meng, C.; Dou, Y. Quantifying the anthropogenic footprint in Eastern China. Sci. Rep. 2016, 6, 24337. [Google Scholar] [CrossRef] [Green Version]
  42. Du, H.; Wang, D.; Wang, Y.; Zhao, X.; Qin, F.; Jiang, H.; Cai, Y. Influences of land cover types, meteorological conditions, anthropogenic heat and urban area on surface urban heat island in the Yangtze River Delta Urban Agglomeration. Sci. Total Environ. 2016, 571, 461–470. [Google Scholar] [CrossRef]
  43. Morris, C.J.G.; Simmonds, I. Associations between varying magnitudes of the urban heat island and the synoptic climatology in Melbourne, Australia. Int. J. Climatol. 2000, 20, 1931–1954. [Google Scholar] [CrossRef]
  44. Ji, C.P.; Liu, W.D.; Xuan, C.Y. Impact of urban growth on the heat island in Beijing. Acta Geophys. Sin. 2006, 49, 69–77. [Google Scholar]
  45. City life of Shenyang. Available online: http://www.shenyang.gov.cn/wssy/cssh/ (accessed on 1 January 2022).
  46. Li, G.; She, C.; Wu, N.; Li, Z.; Wang, L. The Solution and Simulation of the Condensation Problem of the Capillary Network System in the Children’s Hospital of Shenyang in Summer. Procedia Eng. 2015, 121, 1215–1221. [Google Scholar] [CrossRef] [Green Version]
  47. Ma, Y.; Zhao, Y.; Zhou, J.; Jiang, Y.; Yang, S.; Yu, Z. The relationship between diurnal temperature range and COPD hospital admissions in Changchun, China. Environ. Sci. Pollut. Res. 2018, 25, 17942–17949. [Google Scholar] [CrossRef] [PubMed]
  48. Government, HM Urban Overview. Available online: http://www.harbin.gov.cn/col/col23/index.html (accessed on 1 January 2022).
  49. Yue, X. Study on Characterisistics of Ozone Pollution and Emission Reduction Strategies in Harbin. Master’s Thesis, Harbin Institute of Technology, Harbin, China, 2019. (In Chinese). [Google Scholar]
  50. Zhang, X.; Zhou, J.; Liang, S.; Wang, D. A practical reanalysis data and thermal infrared remote sensing data merging (RTM) method for reconstruction of a 1-km all-weather land surface temperature. Remote Sens. Environ. 2021, 260, 112437. [Google Scholar] [CrossRef]
  51. Zhou, J.; Zhang, X.; Zhan, W.; Göttsche, F.M.; Liu, S.; Olesen, F.S.; Hu, W.; Dai, F. A Thermal Sampling Depth Correction Method for Land Surface Temperature Estimation From Satellite Passive Microwave Observation Over Barren Land. IEEE Trans. Geosci. Remote Sens. 2017, 55, 4743–4756. [Google Scholar] [CrossRef]
  52. Zhang, X.; Zhou, J.; Göttsche, F.M.; Zhan, W.; Liu, S.; Cao, R. Correction to: A method based on temporal component decomposition for estimating 1-km all-weather land surface temperature by merging satellite thermal infrared and passive microwave observations. IEEE Trans. Geosci. Remote Sens. 2019, 57, 4670–4691. [Google Scholar] [CrossRef]
  53. Zhang, X.; Zhou, J.; Tang, W.; Ding, L.; Ma, J.; Zhang, X. Daily 1-km all-weather land surface temperature dataset for the Chinese landmass and its surrounding areas (TRIMS LST; 2000–2020). Natl. Tibet. Plateau Data Cent. 2021. Available online: http://poles.tpdc.ac.cn/zh-hans/ (accessed on 1 January 2022).
  54. Wang, J.; Yan, Z.; Jones, P.D.; Xia, J. On “observation minus reanalysis” method: A view from multidecadal variability. J. Geophys. Res. Atmos. 2013, 118, 7450–7458. [Google Scholar] [CrossRef] [Green Version]
  55. Wang, J.; Yan, Z.; Feng, J. Exaggerated Effect of Urbanization in the Diurnal Temperature Range Via “Observation minus Reanalysis” and the Physical Causes. J. Geophys. Res. Atmos. 2018, 123, 7223–7237. [Google Scholar] [CrossRef]
  56. Shen, X.; Liu, B.; Li, G.; Yu, P.; Zhou, D. Impacts of grassland types and vegetation cover changes on surface air temperature in the regions of temperate grassland of China. Theor. Appl. Climatol. 2016, 126, 141–150. [Google Scholar] [CrossRef]
  57. Kalnay, E.; Kanamitsu, M.; Kistler, R.; Collins, W.; Deaven, D.; Gandin, L.; Iredell, M.; Saha, S.; White, G.; Woollen, J.; et al. The NCEP/NCAR 40-Year Reanalysis Project. Bull. Am. Meteorol. Soc. 1995, 77, 437–471. [Google Scholar] [CrossRef] [Green Version]
  58. Gong, P.; Li, X.; Wang, J.; Bai, Y.; Chen, B.; Hu, T.; Liu, X.; Xu, B.; Yang, J.; Zhang, W.; et al. Annual maps of global artificial impervious area (GAIA) between 1985 and 2018. Remote Sens. Environ. 2020, 236, 111510. [Google Scholar] [CrossRef]
  59. Yang, C.; Zhao, S. Urban vertical profiles of three most urbanized Chinese cities and the spatial coupling with horizontal urban expansion. Land Use Policy 2022, 113, 105919. [Google Scholar] [CrossRef]
  60. Zhang, Y.; Yin, P.; Li, X.; Niu, Q.; Wang, Y.; Cao, W.; Huang, J.; Chen, H.; Yao, X.; Yu, L.; et al. The divergent response of vegetation phenology to urbanization: A case study of Beijing city, China. Sci. Total Environ. 2022, 803, 150079. [Google Scholar] [CrossRef]
  61. Quan, J.; Chen, Y.; Zhan, W.; Wang, J.; Voogt, J.; Wang, M. Multi-temporal trajectory of the urban heat island centroid in Beijing, China based on a Gaussian volume model. Remote Sens. Environ. 2014, 149, 33–46. [Google Scholar] [CrossRef]
  62. Han, X.U.; Ben, C. Remote sensing of the urban heat island and its changes in Xiamen City of SE Remote sensing of the urban heat island and its changes in Xiamen City of SE China. J. Environ. Sci. 2004, 16, 276–281. [Google Scholar]
  63. Ding, Y.; Gong, X.; Xing, Z.; Cai, H.; Zhou, Z.; Zhang, D.; Sun, P.; Shi, H. Attribution of meteorological, hydrological and agricultural drought propagation in different climatic regions of China. Agric. Water Manag. 2021, 255, 106996. [Google Scholar] [CrossRef]
  64. Grömping, U. Relative importance for linear regression in R: The package relaimpo. J. Stat. Softw. 2006, 17, 1–27. [Google Scholar] [CrossRef] [Green Version]
  65. Nguyen, X.C.; Chang, S.W.; Nguyen, T.L.; Ngo, H.H.; Kumar, G.; Banu, J.R.; Vu, M.C.; Le, H.S.; Nguyen, D.D. A hybrid constructed wetland for organic-material and nutrient removal from sewage: Process performance and multi-kinetic models. J. Environ. Manag. 2018, 222, 378–384. [Google Scholar] [CrossRef]
  66. Shao, J.; Zhou, X.; Luo, Y.; Zhang, G.; Yan, W.; Li, J.; Li, B.; Dan, L.; Fisher, J.B.; Gao, Z.; et al. Uncertainty analysis of terrestrial net primary productivity and net biome productivity in China during 1901–2005. J. Geophys. Res. Biogeosci. 2016, 121, 1372–1393. [Google Scholar] [CrossRef]
  67. Li, L.; Qian, J.; Ou, C.Q.; Zhou, Y.X.; Guo, C.; Guo, Y. Spatial and temporal analysis of Air Pollution Index and its timescale-dependent relationship with meteorological factors in Guangzhou, China, 2001–2011. Environ. Pollut. 2014, 190, 75–81. [Google Scholar] [CrossRef] [PubMed]
  68. Sónia, C.; Clara, C.; Samantha, L.; Priscila, C.G.; John, I.; Alice, N. MERIS Phytoplankton Time Series Products from the SW Iberian Peninsula (Sagres) Using Seasonal-Trend Decomposition Based on Loess. Remote Sens. 2016, 8, 449. [Google Scholar] [CrossRef] [Green Version]
  69. Liu, D.; Guo, S.; Zou, M.; Chen, C.; Wu, L. A dengue fever predicting model based on Baidu search index data and climate data in South China. PLoS ONE 2019, 14, e0226841. [Google Scholar] [CrossRef] [PubMed] [Green Version]
  70. Yuan, F.; Bauer, M.E. Comparison of impervious surface area and normalized difference vegetation index as indicators of surface urban heat island effects in Landsat imagery. Remote Sens. Environ. 2007, 106, 375–386. [Google Scholar] [CrossRef]
  71. Simwanda, M.; Ranagalage, M.; Estoque, R.C.; Murayama, Y. Spatial analysis of surface urban heat Islands in four rapidly growing african cities. Remote Sens. 2019, 11, 1645. [Google Scholar] [CrossRef] [Green Version]
  72. Morabito, M.; Crisci, A.; Guerri, G.; Messeri, A.; Congedo, L.; Munafò, M. Surface urban heat islands in Italian metropolitan cities: Tree cover and impervious surface influences. Sci. Total Environ. 2021, 751, 142334. [Google Scholar] [CrossRef]
  73. Yao, N.; Huang, C.; Yang, J.; van den Bosch, C.C.K.; Ma, L.; Jia, Z. Combined effects of impervious surface change and large-scale afforestation on the surface urban heat island intensity of beijing, china based on remote sensing analysis. Remote Sens. 2020, 12, 3906. [Google Scholar] [CrossRef]
  74. Zhao, M.; Cheng, C.; Zhou, Y.; Li, X.; Shen, S.; Song, C. A global dataset of annual urban extents (1992–2020) from harmonized nighttime lights. Earth Syst. Sci. Data 2022, 14, 517–534. [Google Scholar] [CrossRef]
  75. Kant, Y.; Bharath, B.D.; Mallick, J.; Atzberger, C.; Kerle, N. Satellite-based analysis of the role of land use/land cover and vegetation density on surface temperature regime of Delhi, india. J. Indian Soc. Remote Sens. 2009, 37, 201–214. [Google Scholar] [CrossRef]
  76. Piao, S.; Wang, X.; Ciais, P.; Zhu, B.; Wang, T.; Liu, J. Changes in satellite-derived vegetation growth trend in temperate and boreal Eurasia from 1982 to 2006. Glob. Chang. Biol. 2011, 17, 3228–3239. [Google Scholar] [CrossRef]
  77. Yin, C. Research on Boundary Extraction and Spatio-temporal Evolution of Urban Built-up Area-A Case Study of Central and Eastern China. Master’s Thesis, Shandong Jianzhu University, Jinan, China, 2021. (In Chinese). [Google Scholar]
  78. Sun, H. Study on the evolution of urban residential space structure and its driving forces in Shenyang. Master’s Thesis, Liaoning Normal University, Dalian, China, 2019. (In Chinese). [Google Scholar]
  79. Zhao, Z.Q.; He, B.J.; Li, L.G.; Wang, H.B.; Darko, A. Profile and concentric zonal analysis of relationships between land use/land cover and land surface temperature: Case study of Shenyang, China. Energy Build. 2017, 155, 282–295. [Google Scholar] [CrossRef]
  80. Halder, B.; Bandyopadhyay, J.; Banik, P. Monitoring the effect of urban development on urban heat island based on remote sensing and geo-spatial approach in Kolkata and adjacent areas, India. Sustain. Cities Soc. 2021, 74, 103186. [Google Scholar] [CrossRef]
  81. Vogel, J.; Afshari, A. Comparison of urban heat island intensity estimation methods using urbanized WRF in Berlin, Germany. Atmosphere 2020, 11, 1338. [Google Scholar] [CrossRef]
  82. Yu, L.; Pan, Y.; Xiao, Z.; Wang, Z.; Mai, J. Case studies of impacts of anthropogenic heat emissions on heat wave events in Guangzhou. China Environ. Sci. 2020, 40, 3721–3730. (In Chinese) [Google Scholar] [CrossRef]
Figure 1. The locations of the study areas, and true color images in November. (a) Image of study area 1 (D1); (b) Image of study area 2 (D2); (c) Image of study area 3 (D3).
Remotesensing 14 02327 g001
Figure 2. Research process.
Remotesensing 14 02327 g002
Figure 3. The air temperature (T2) changes during the central heating seasons.
Remotesensing 14 02327 g003
Figure 4. Changes in the spatial distribution of the daily land surface temperature at night.
Remotesensing 14 02327 g004
Figure 5. The spatial distribution of the equivalent heat island index (EHI) in the three study areas.
Remotesensing 14 02327 g005
Figure 6. Change in the river area in D3 on the Landsat image. (a) Landsat image in 2006; (b) Landsat image in 2016.
Remotesensing 14 02327 g006
Figure 7. Equivalent heat island area (EHIA) from 2003 to 2019.
Remotesensing 14 02327 g007
Figure 8. Equivalent heat island intensity (EHII) changes from 2003 to 2019 in D1.
Remotesensing 14 02327 g008
Figure 9. Equivalent heat island intensity (EHII) changes from 2003 to 2019 in D2.
Remotesensing 14 02327 g009
Figure 10. Equivalent heat island intensity (EHII) changes from 2003 to 2019 in D3.
Remotesensing 14 02327 g010
Figure 11. Scatter plot of the central heating supply (CHS) and equivalent heat island area (EHIA).
Remotesensing 14 02327 g011
Figure 12. The percentage of different equivalent heat island intensities (EHII) in terms of the area.
Remotesensing 14 02327 g012
Figure 13. Time series decomposition of the daily urban heat island area during the central heating season.
Remotesensing 14 02327 g013aRemotesensing 14 02327 g013b
Figure 14. The spatial distribution of the mean land surface temperature (mean LST).
Remotesensing 14 02327 g014
Figure 15. Correlation between the heat island area and impervious surface area (ISA). (a) Equivalent heat island area (EHIA) and ISA, and (b) average heat island area (AHI) and ISA.
Remotesensing 14 02327 g015
Table 1. Central heating supplies (CHS) in three cities.
YearShenyang
(10,000 GJ)
Changchun
(10,000 GJ)
Harbin
(10,000 GJ)
2003322249875075
2004419351575580
2005630463056509
2006604657337221
2007706051067808
2008781259518429
20099146696410,488
2010934375719941
20119900709310,551
201210,6546704.212,461
201311,1088083.0513,833.5
201411,8778253.7515,175.5
201512,7129289.8515,674.5
201613,905.059164.2315,830.71
201715,17410,22016,906
201816,369.23971817,916
201916,680.2610,18518,466.23
Table 2. Thermal classification based on the mean (E) and standard deviation (STD).
CategoryDivision
Hot T ( x , y ) E + STD
Medium-hot E + STD > T ( x , y ) E + 0.5 STD
Warm E + 0.5 STD > T ( x , y ) E 0.5 STD
Medium-cold E 0.5 STD > T ( x , y ) E STD
Cold T ( x , y ) < E STD
Table 3. The equivalent heat island intensity (EHII) classification method based on the EHI.
EHIIDivision
High F ( x , y ) 0.8
Medium-high 0.8 > F ( x , y ) 0.6
Medium 0.6 > F ( x , y ) 0.4
Medium-low 0.4 > F ( x , y ) 0.2
Table 4. Correlation between the equivalent heat island intensity (EHII) and central heating supply. (* indicates the value that fails the P check).
Medium-LowMediumMedium-HighHigh
D1***0.84
D20.490.730.70*
D30.810.620.76*
Table 5. The relative contribution of the central heating supply (CHS) and air temperature (T2) in changing equivalent heat island areas.
CHST2
D198.2%1.8%
D298.3%1.7%
D397.9%2.1%
Publisher’s Note: MDPI stays neutral with regard to jurisdictional claims in published maps and institutional affiliations.

