
On-Board Crowd Counting and Density Estimation Using Low Altitude Unmanned Aerial Vehicles—Looking beyond Beating the Benchmark


Abstract
:1. Introduction
2. Related Work
3. Materials and Methods
3.1. Context and Methodology
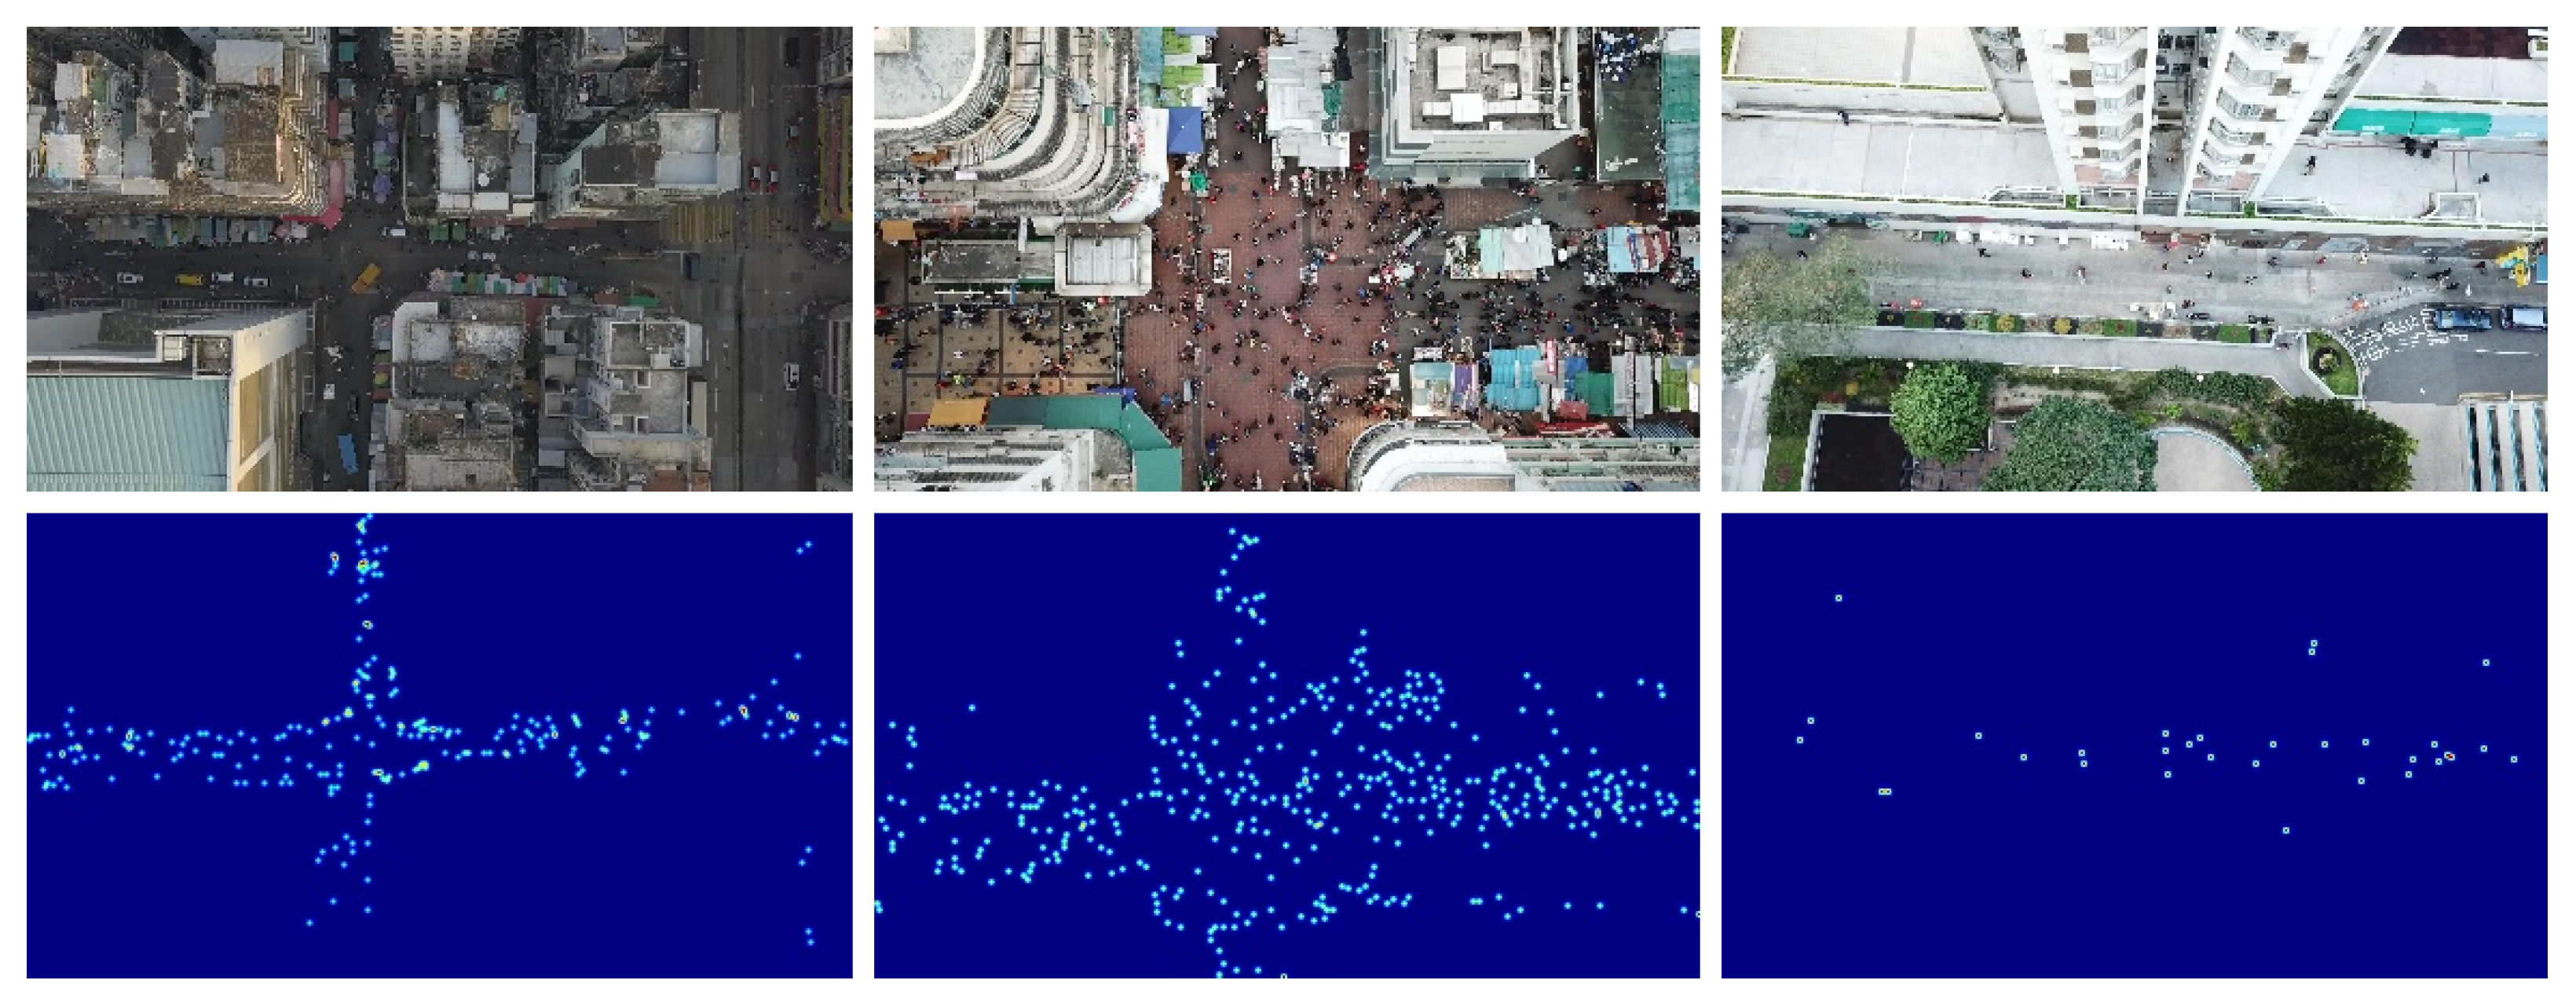
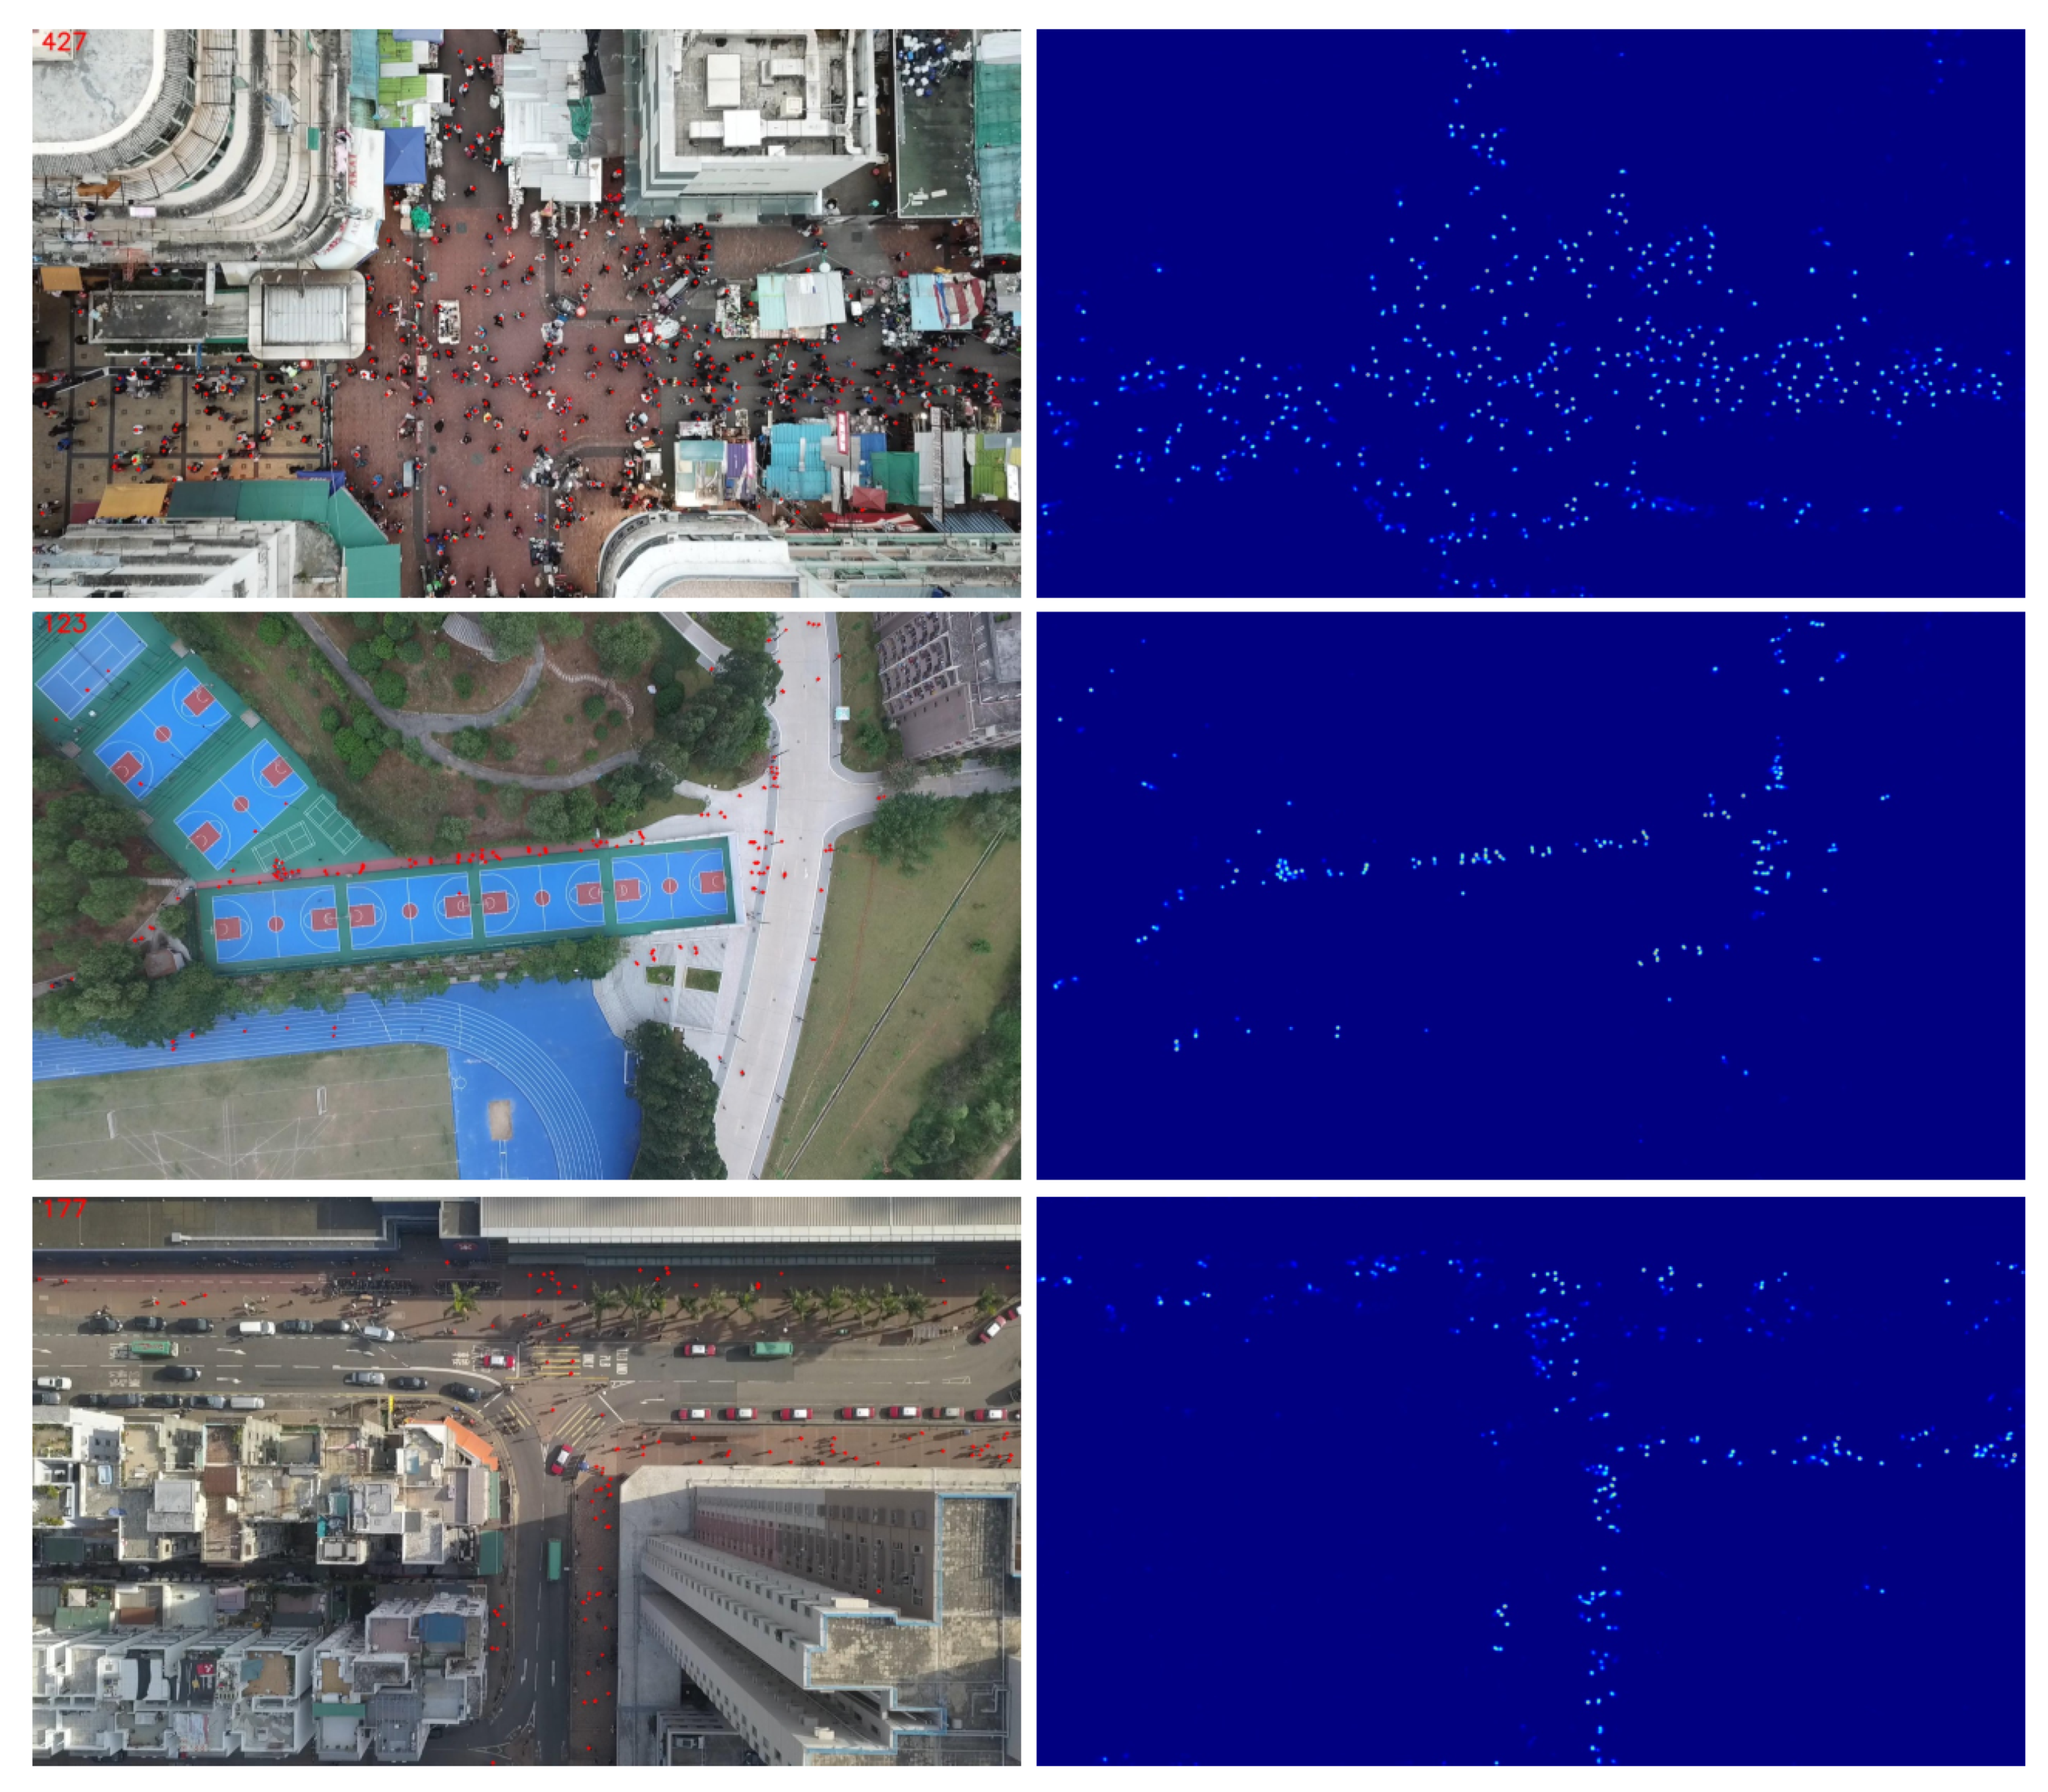
3.2. Dataset
3.3. Our Approach
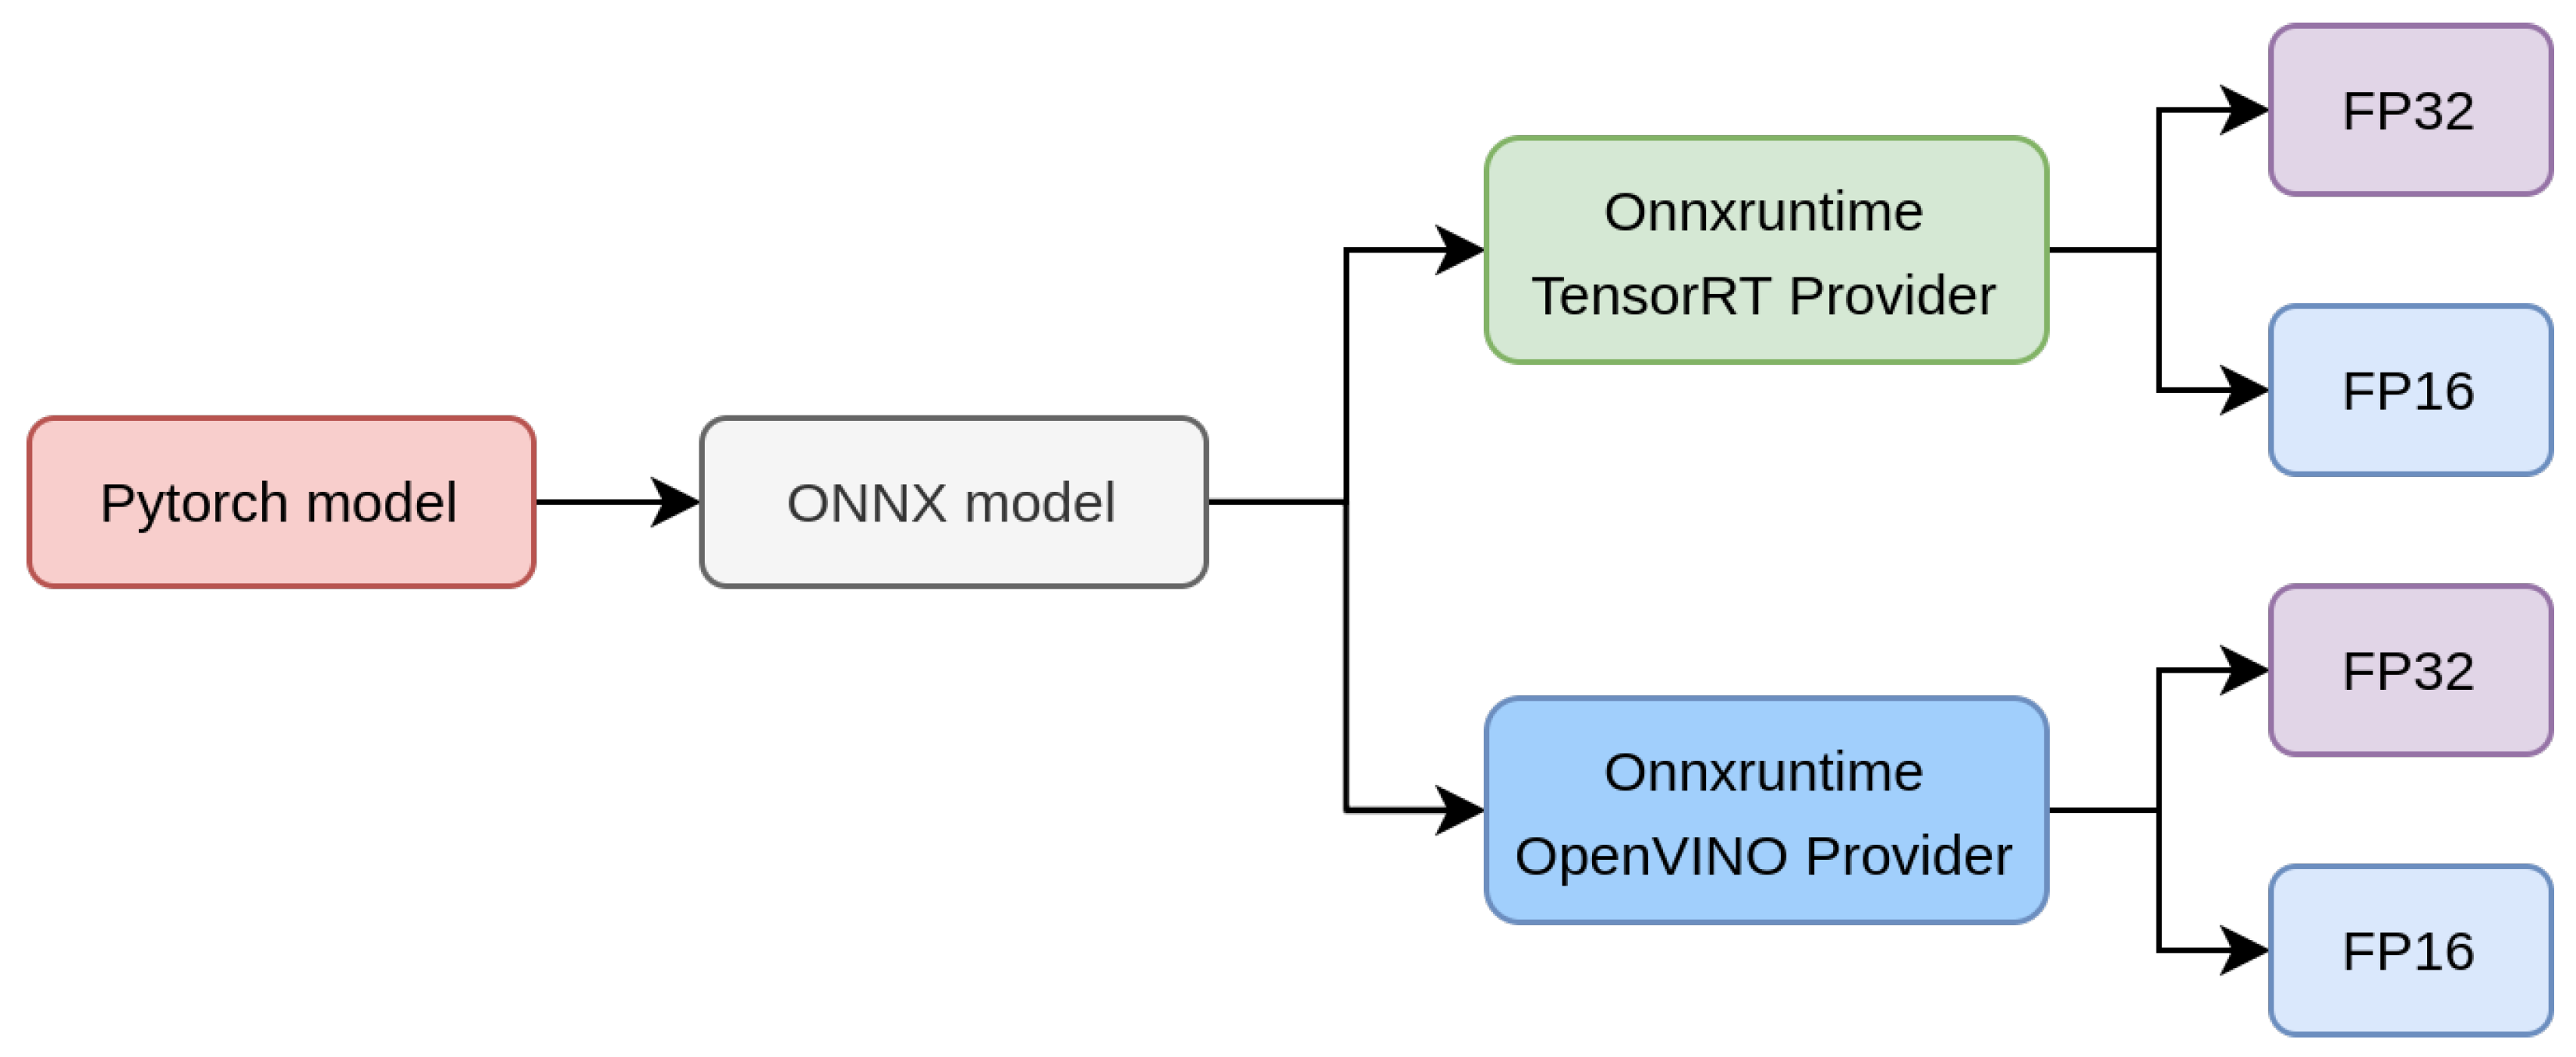
3.3.1. Evaluation Hardware
3.3.2. Models
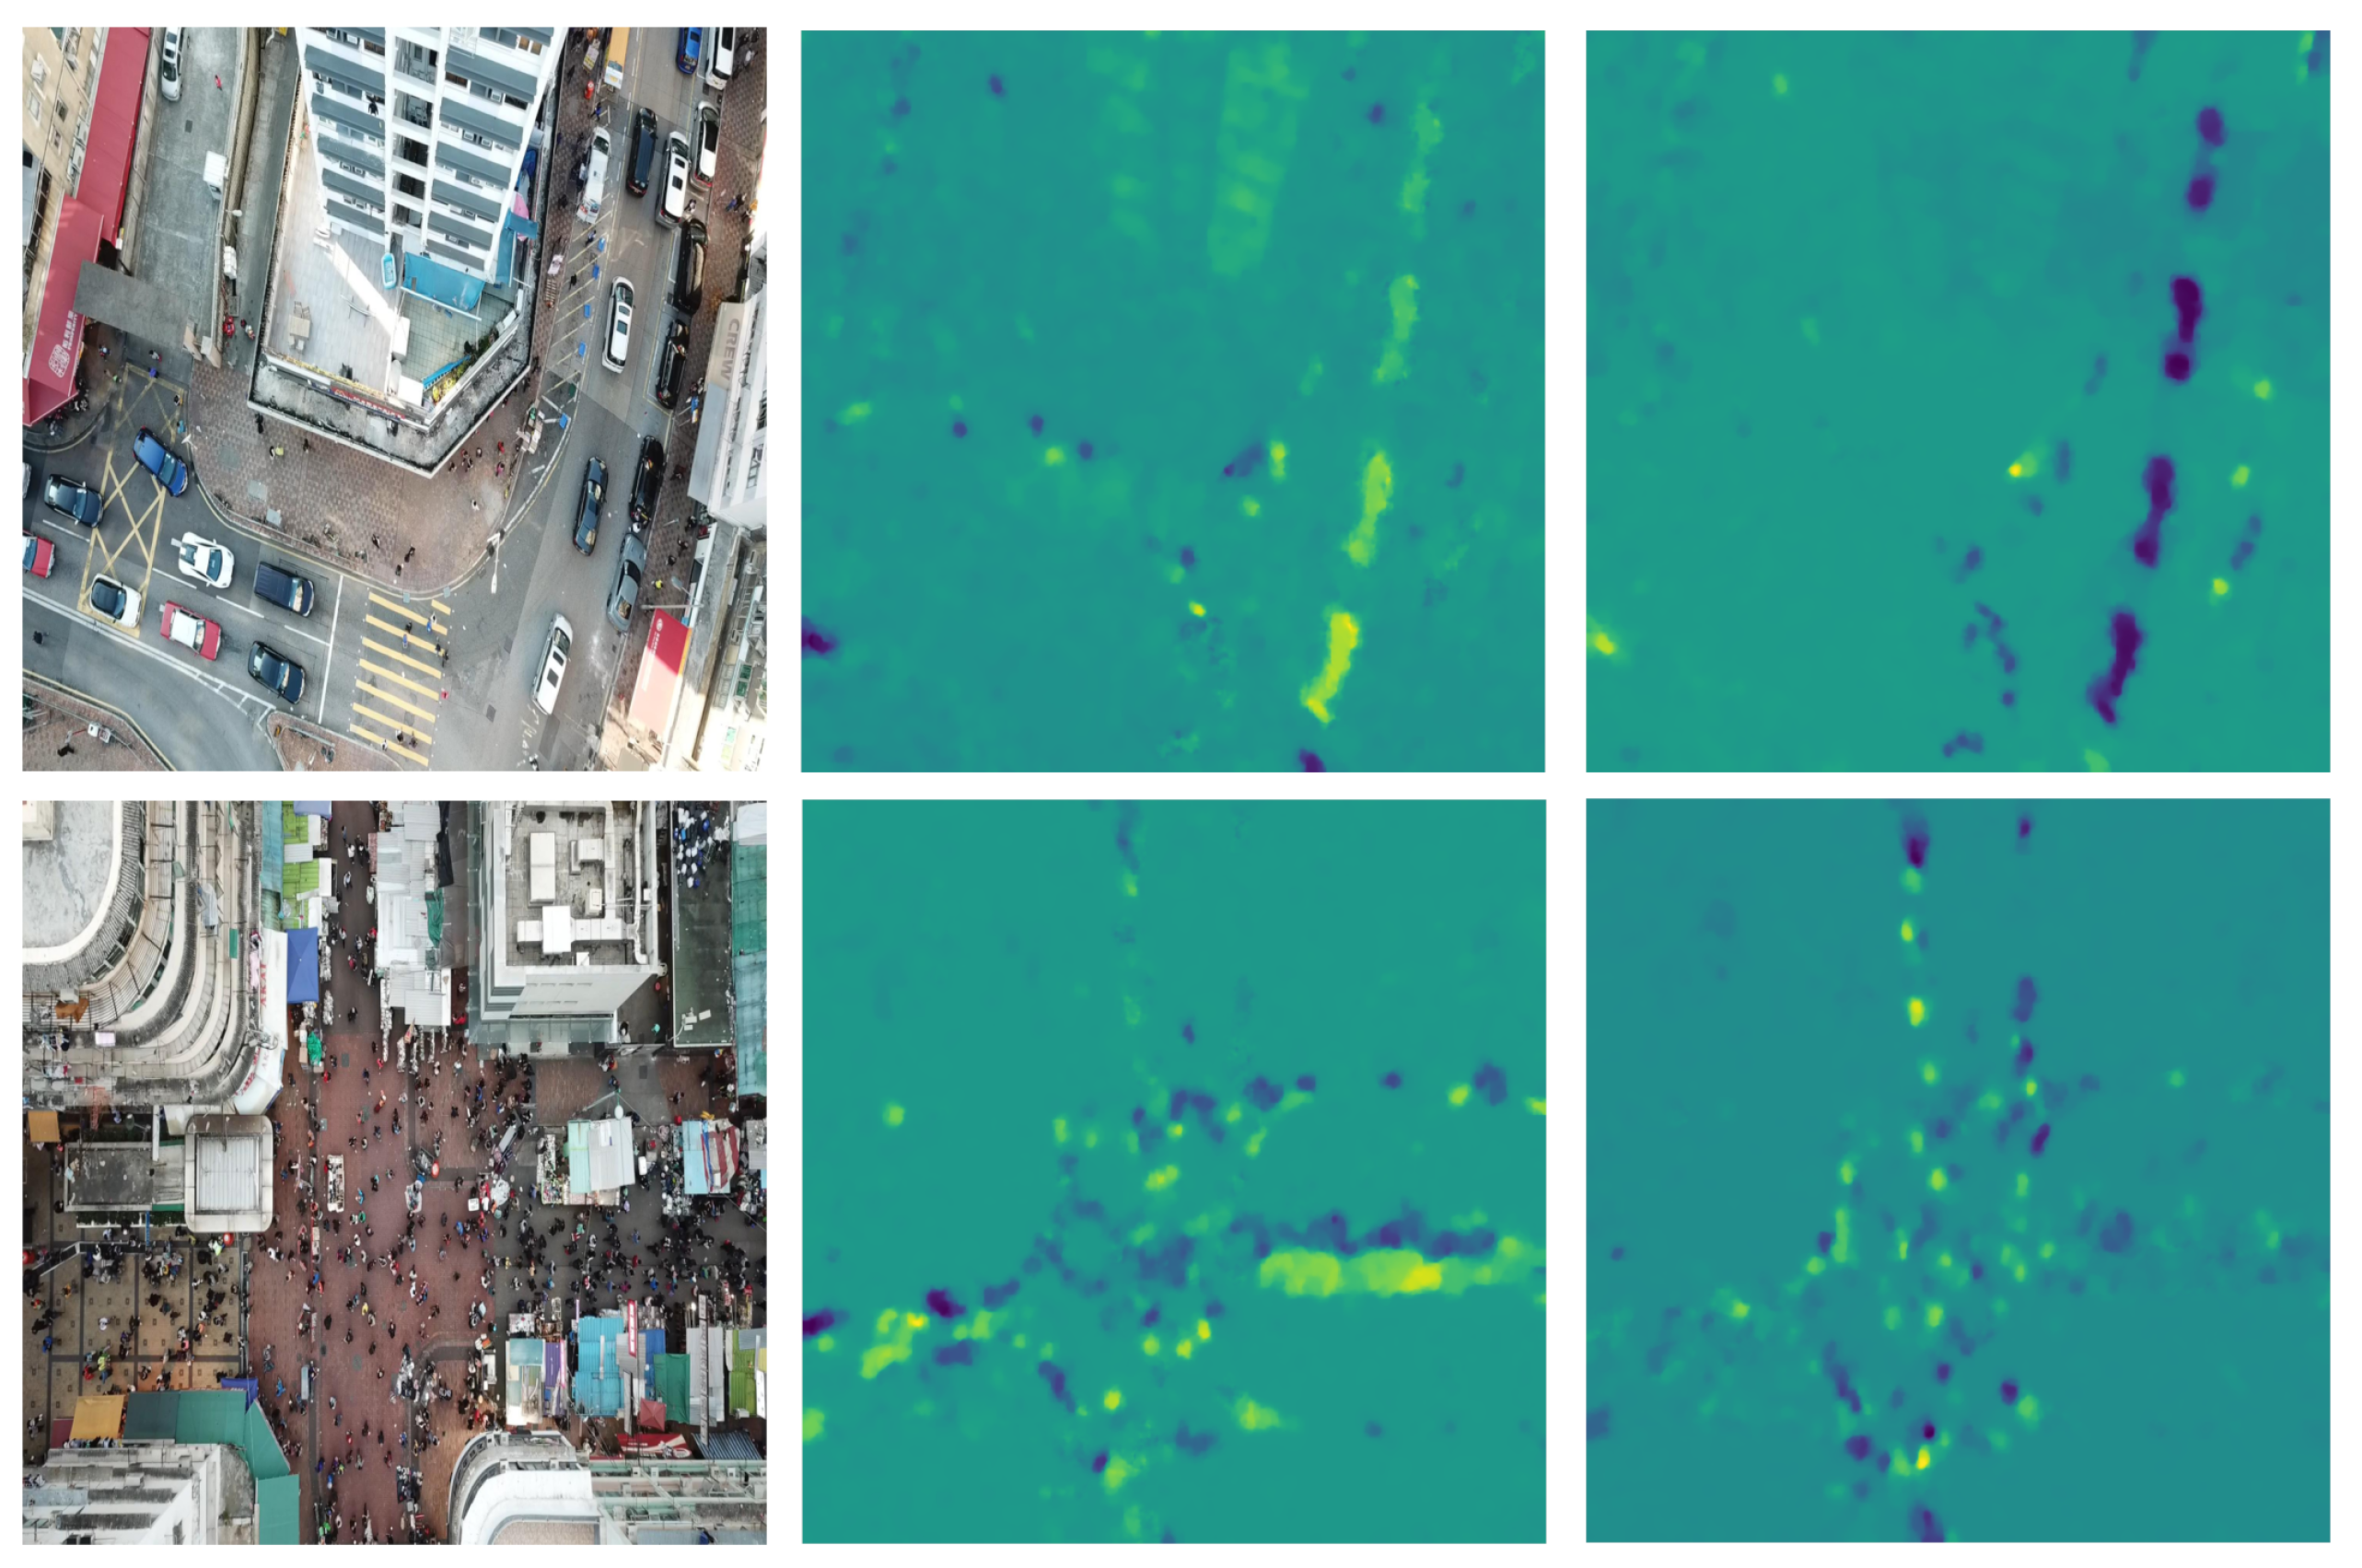
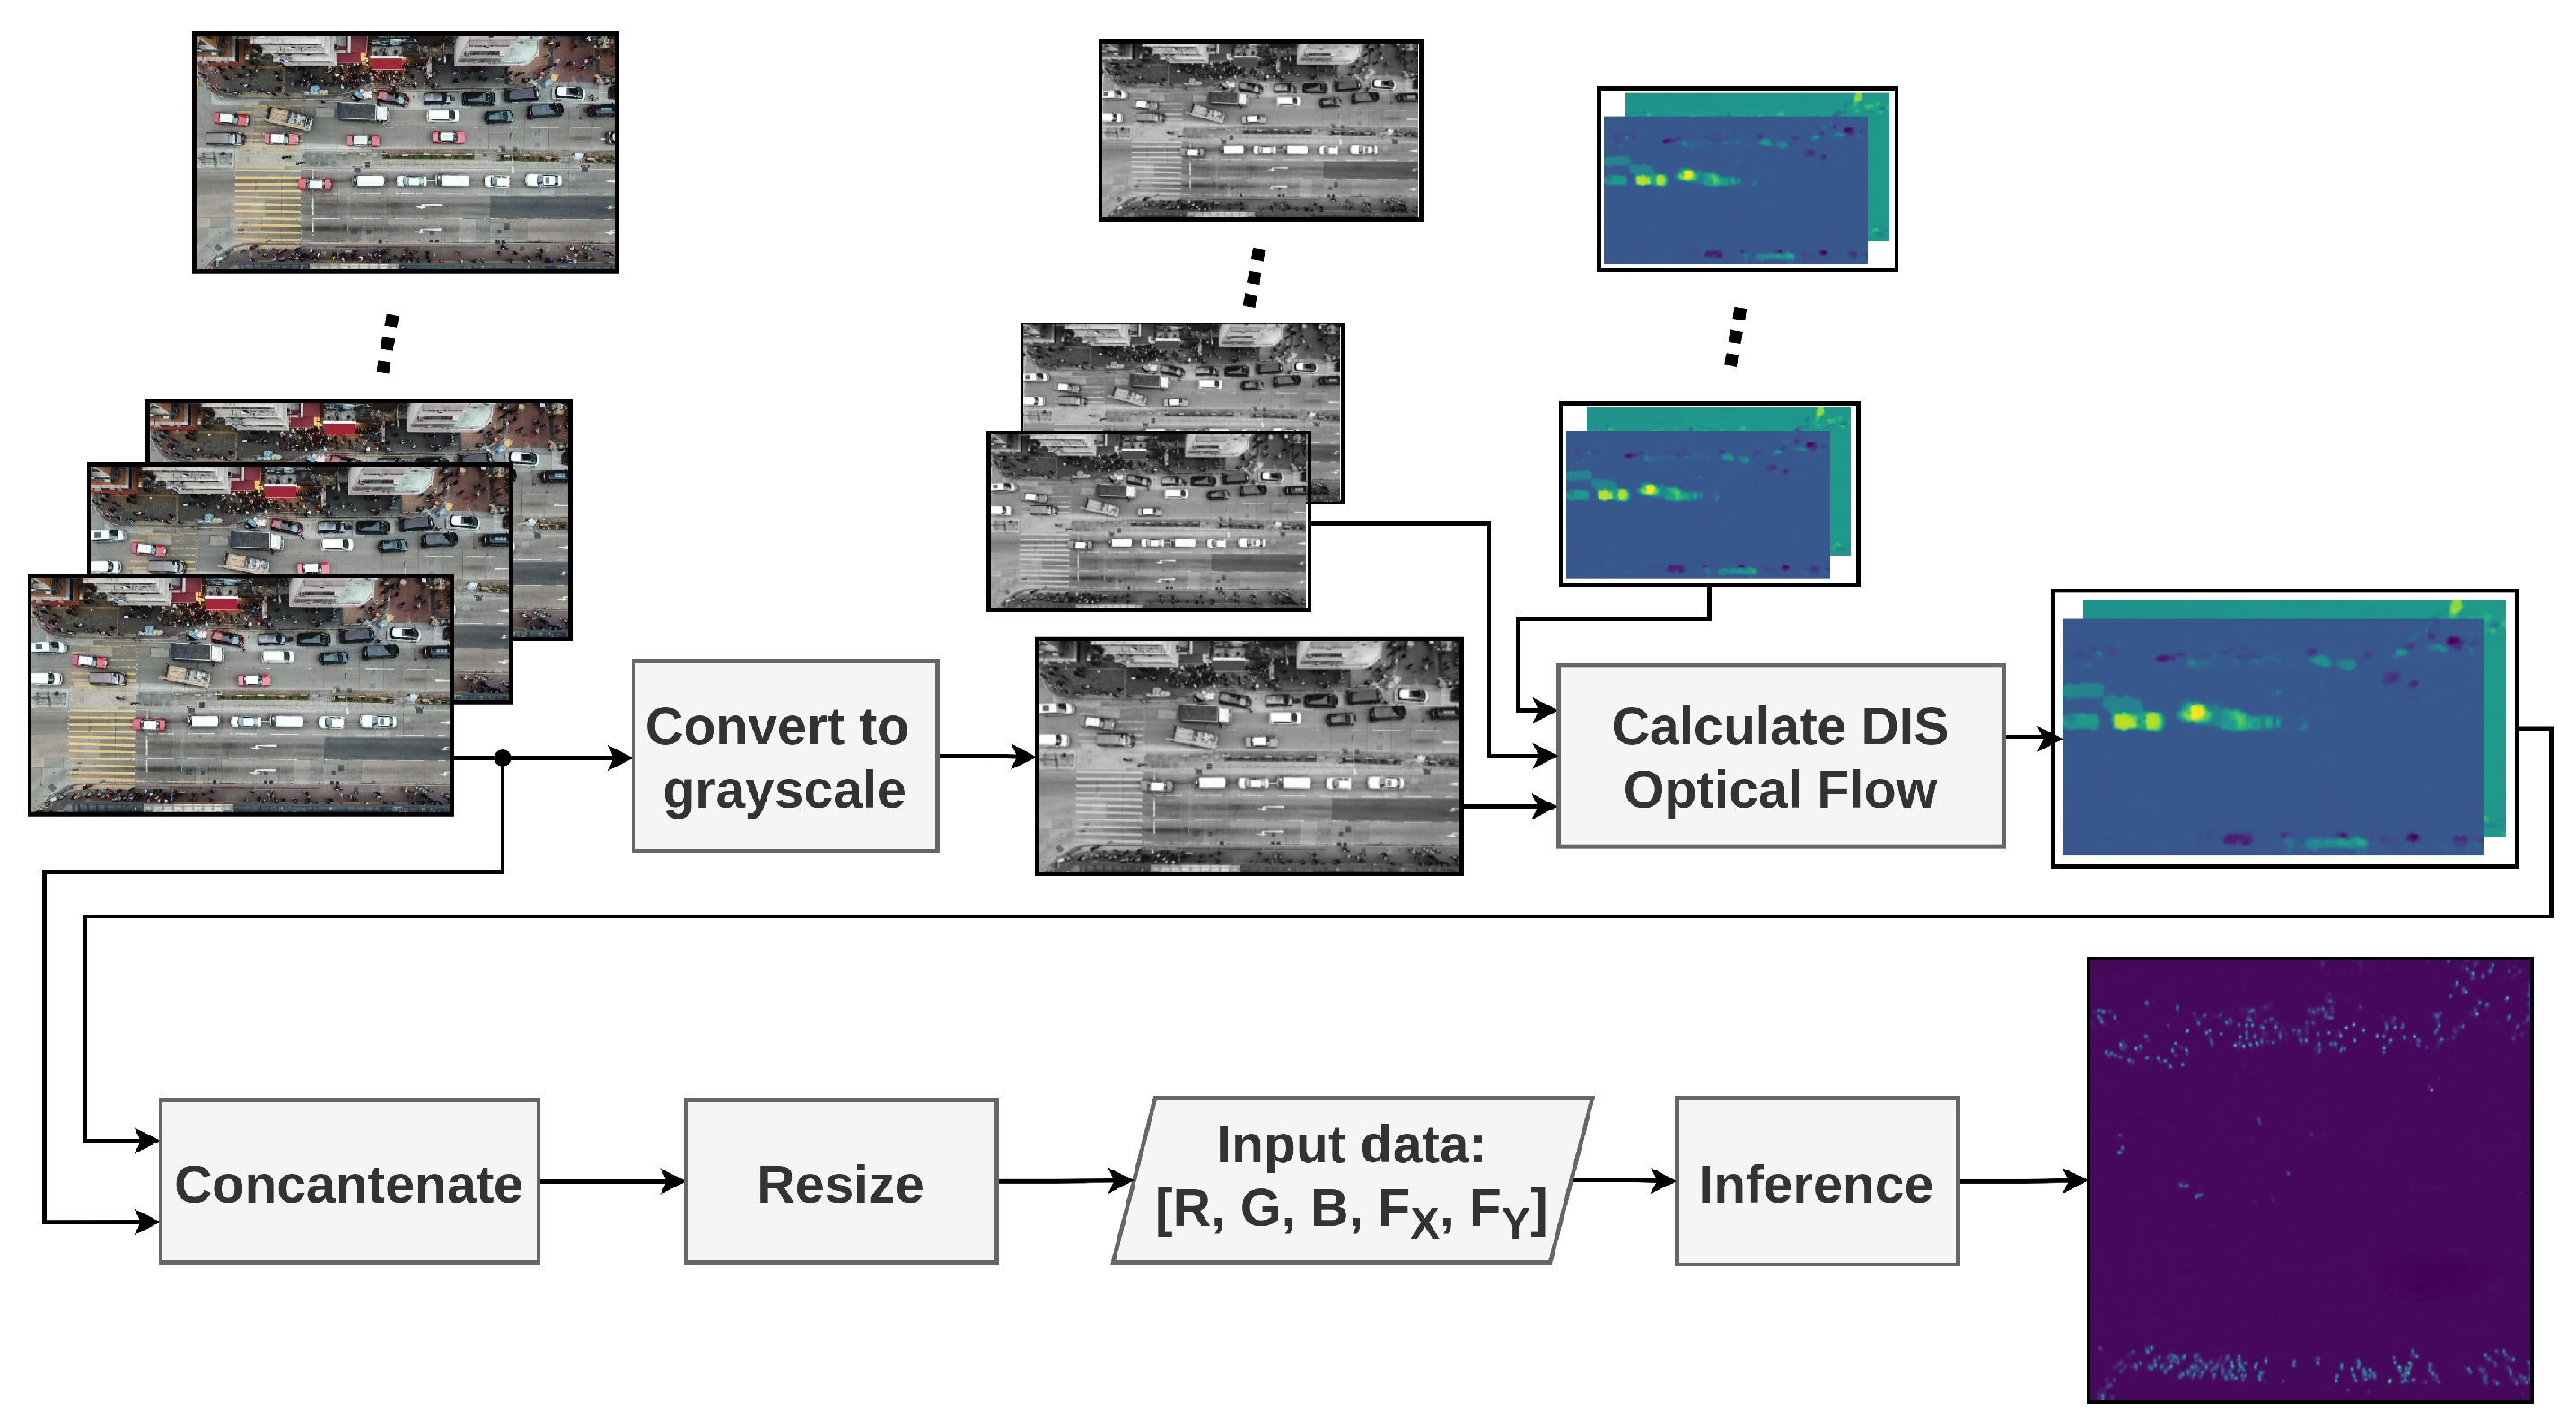
3.3.3. Optical Flow
3.3.4. Data Augmentation
3.4. System Architecture
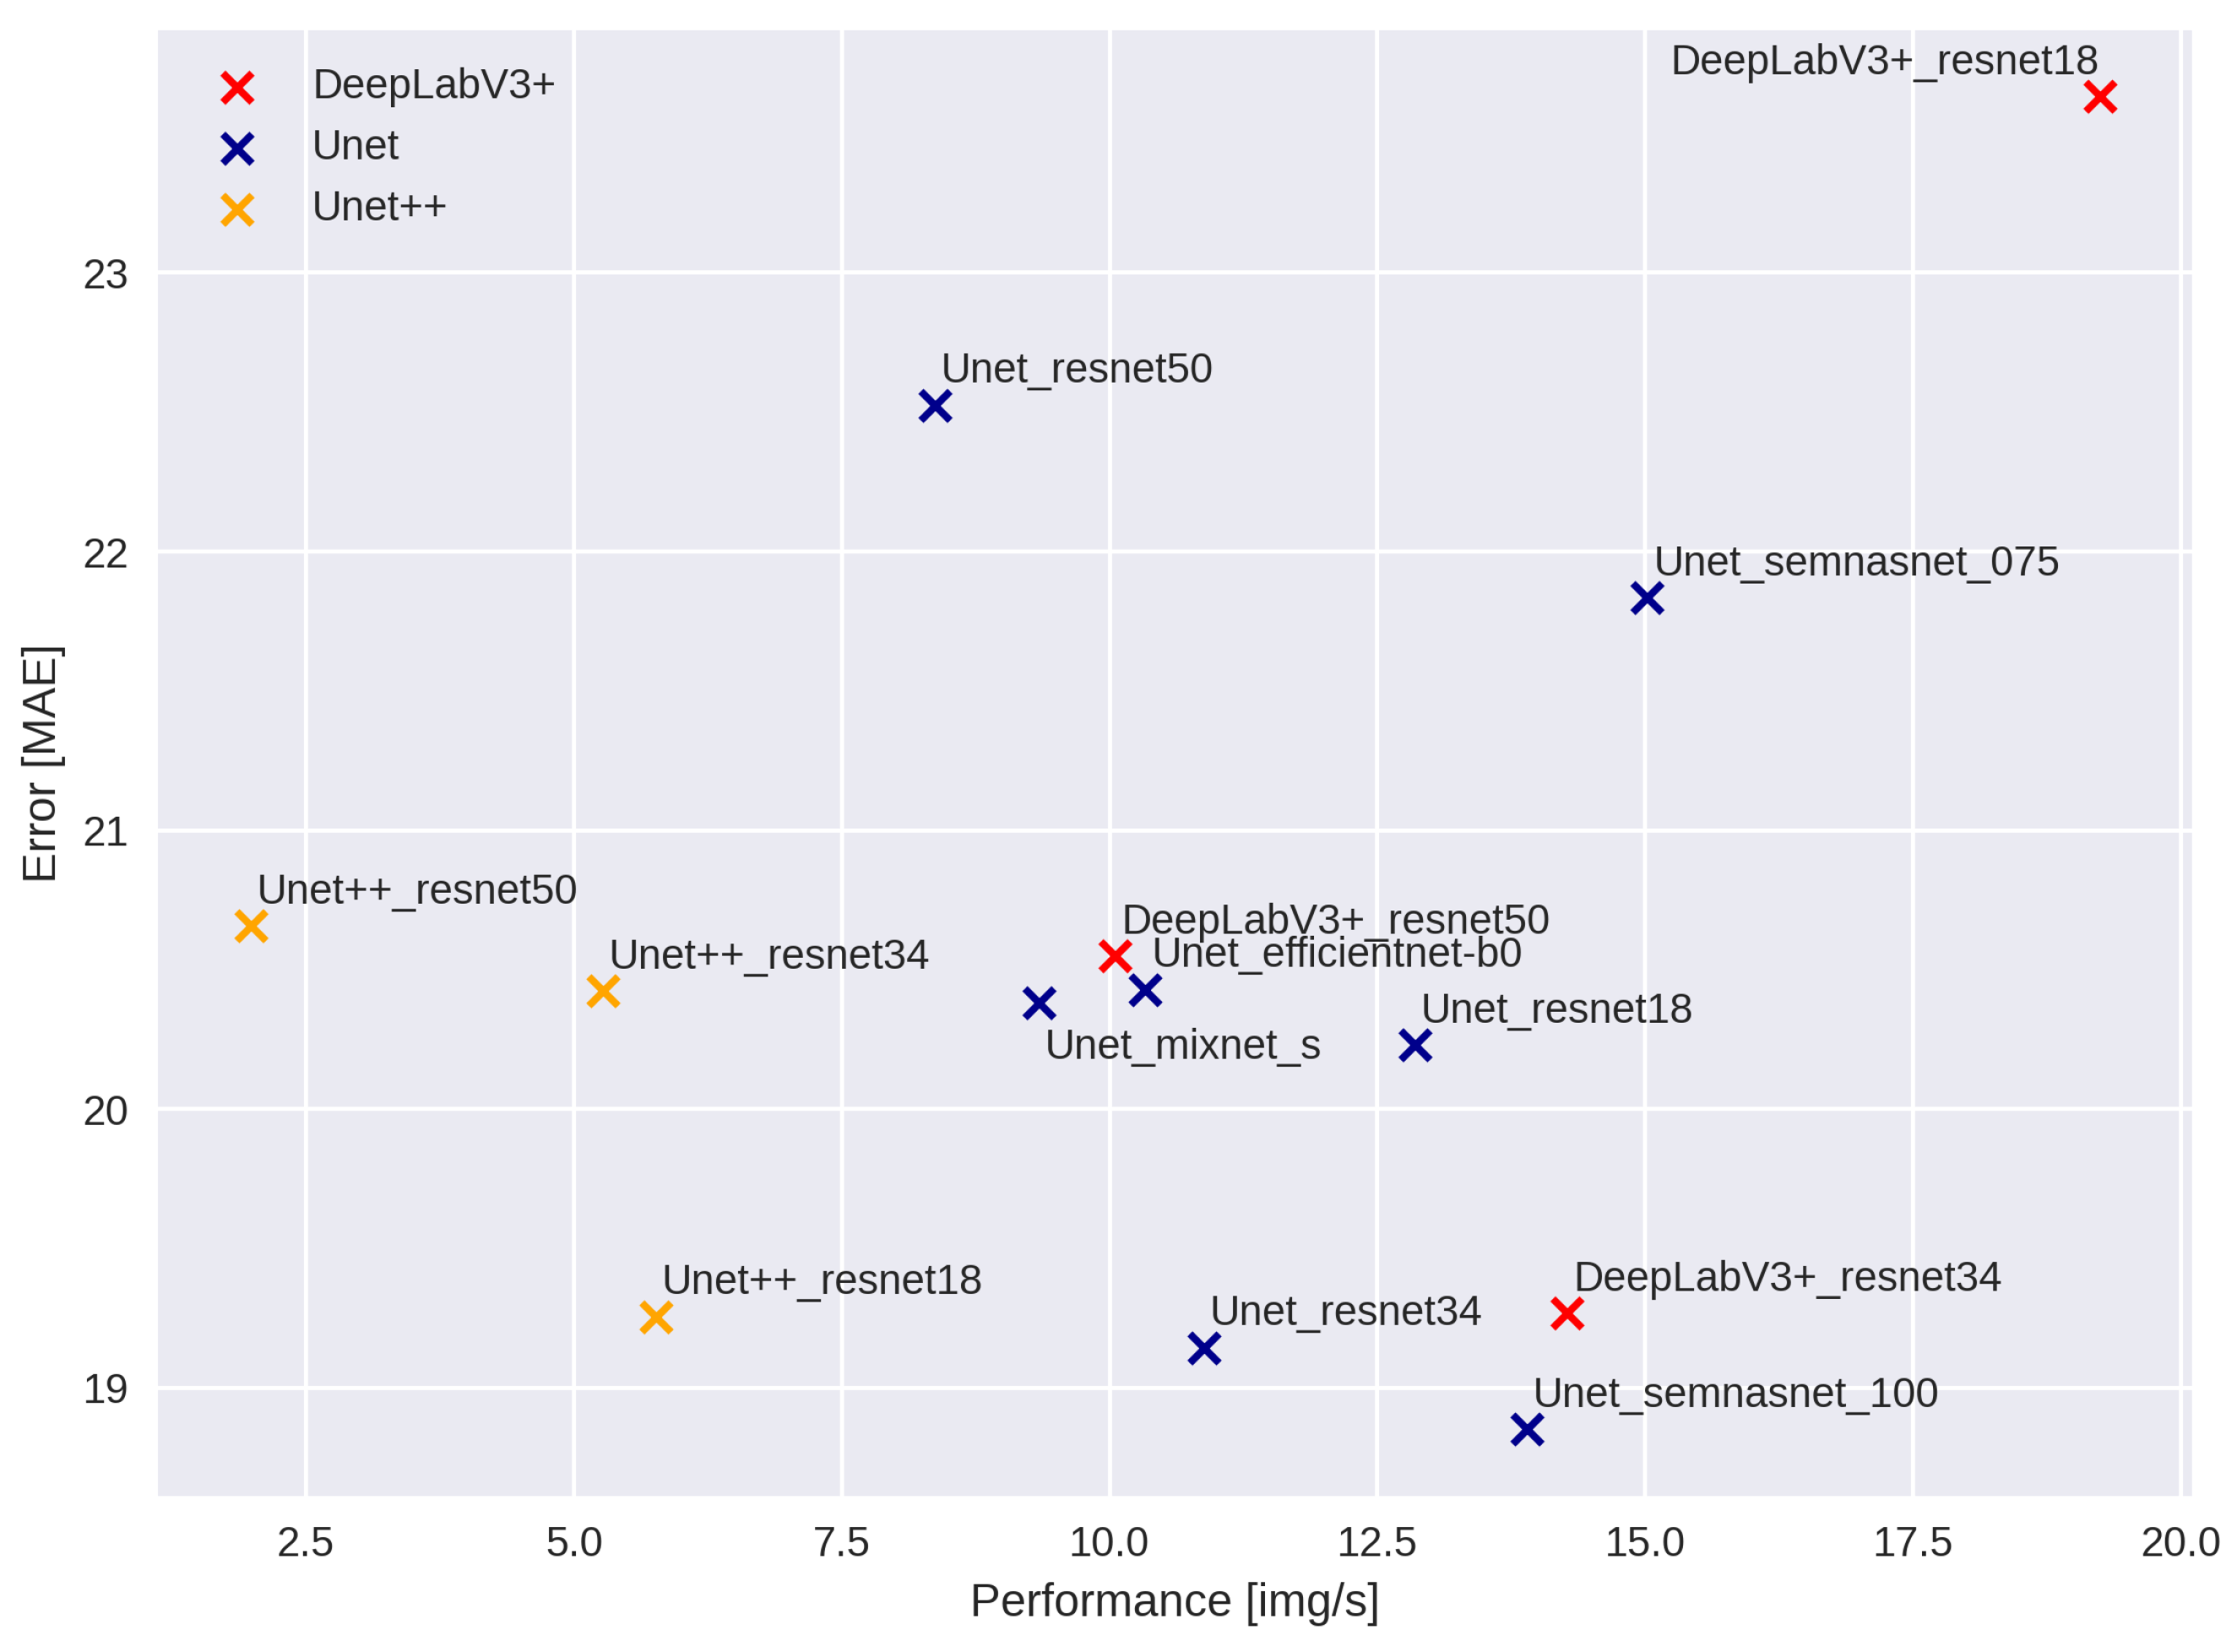
4. Experiments
5. Discussion
6. Conclusions
Author Contributions
Funding
Conflicts of Interest
References
- Sindagi, V.A.; Patel, V.M. A survey of recent advances in cnn-based single image crowd counting and density estimation. Pattern Recognit. Lett. 2018, 107, 3–16. [Google Scholar] [CrossRef] [Green Version]
- Gao, G.; Gao, J.; Liu, Q.; Wang, Q.; Wang, Y. Cnn-based density estimation and crowd counting: A survey. arXiv 2020, arXiv:2003.12783. [Google Scholar]
- Ilyas, N.; Shahzad, A.; Kim, K. Convolutional-neural network-based image crowd counting: Review, categorization, analysis, and performance evaluation. Sensors 2020, 20, 43. [Google Scholar] [CrossRef] [PubMed] [Green Version]
- Perko, R.; Klopschitz, M.; Almer, A.; Roth, P.M. Critical Aspects of Person Counting and Density Estimation. J. Imaging 2021, 7, 21. [Google Scholar] [CrossRef]
- Li, B.; Huang, H.; Zhang, A.; Liu, P.; Liu, C. Approaches on crowd counting and density estimation: A review. Pattern Anal. Appl. 2021, 24, 853–874. [Google Scholar] [CrossRef]
- Shao, J.; Kang, K.; Change Loy, C.; Wang, X. Deeply learned attributes for crowded scene understanding. In Proceedings of the 2015 IEEE Conference on Computer Vision and Pattern Recognition, Boston, MA, USA, 7–12 June 2015; pp. 4657–4666. [Google Scholar]
- Yi, S.; Li, H.; Wang, X. Understanding pedestrian behaviors from stationary crowd groups. In Proceedings of the 2015 IEEE Conference on Computer Vision and Pattern Recognition, Boston, MA, USA, 7–12 June 2015; pp. 3488–3496. [Google Scholar]
- Marsden, M.; McGuinness, K.; Little, S.; O’Connor, N.E. Resnetcrowd: A residual deep learning architecture for crowd counting, violent behaviour detection and crowd density level classification. In Proceedings of the 2017 14th IEEE International Conference on Advanced Video and Signal Based Surveillance (AVSS), Lecce, Italy, 29 August–1 September 2017; IEEE: Piscataway, NJ, USA, 2017; pp. 1–7. [Google Scholar]
- McPhail, C.; McCarthy, J. Who counts and how: Estimating the size of protests. Contexts 2004, 3, 12–18. [Google Scholar] [CrossRef]
- Jiao, L.; Zhao, J. A survey on the new generation of deep learning in image processing. IEEE Access 2019, 7, 172231–172263. [Google Scholar] [CrossRef]
- Thompson, N.C.; Greenewald, K.; Lee, K.; Manso, G.F. The computational limits of deep learning. arXiv 2020, arXiv:2007.05558. [Google Scholar]
- Li, M.; Zhang, Z.; Huang, K.; Tan, T. Estimating the number of people in crowded scenes by mid based foreground segmentation and head-shoulder detection. In Proceedings of the 2008 19th International Conference on Pattern Recognition, Tampa, FL, USA, 8–11 December 2008; IEEE: Piscataway, NJ, USA, 2008; pp. 1–4. [Google Scholar]
- Sim, C.H.; Rajmadhan, E.; Ranganath, S. Using color bin images for crowd detections. In Proceedings of the 2008 15th IEEE International Conference on Image Processing, San Diego, CA, USA, 12–15 October 2008; IEEE: Piscataway, NJ, USA, 2008; pp. 1468–1471. [Google Scholar]
- Subburaman, V.B.; Descamps, A.; Carincotte, C. Counting people in the crowd using a generic head detector. In Proceedings of the 2012 IEEE Ninth International Conference on Advanced Video and Signal-Based Surveillance, Beijing, China, 18–21 September 2012; IEEE: Piscataway, NJ, USA, 2012; pp. 470–475. [Google Scholar]
- Topkaya, I.S.; Erdogan, H.; Porikli, F. Counting people by clustering person detector outputs. In Proceedings of the 2014 11th IEEE International Conference on Advanced Video and Signal Based Surveillance (AVSS), Seoul, Korea, 26–29 August 2014; IEEE: Piscataway, NJ, USA, 2014; pp. 313–318. [Google Scholar]
- Bochkovskiy, A.; Wang, C.Y.; Liao, H.Y.M. YOLOv4: Optimal Speed and Accuracy of Object Detection. arXiv 2020, arXiv:2004.10934. [Google Scholar]
- Tan, M.; Pang, R.; Le, Q.V. Efficientdet: Scalable and efficient object detection. In Proceedings of the IEEE/CVF Conference on Computer Vision and Pattern Recognition, 2020, Seattle, WA, USA, 14–19 June 2020; pp. 10781–10790. [Google Scholar]
- Carion, N.; Massa, F.; Synnaeve, G.; Usunier, N.; Kirillov, A.; Zagoruyko, S. End-to-end object detection with transformers. In Proceedings of the European Conference on Computer Vision, Glasgow, UK, 23–28 August 2020; Springer: Berlin/Heidelberg, Germany, 2020; pp. 213–229. [Google Scholar]
- Chan, A.B.; Vasconcelos, N. Counting people with low-level features and Bayesian regression. IEEE Trans. Image Process. 2011, 21, 2160–2177. [Google Scholar] [CrossRef] [Green Version]
- Chen, K.; Loy, C.C.; Gong, S.; Xiang, T. Feature mining for localised crowd counting. In Proceedings of the British Machine Vision Conference, 2012, Surrey, UK, 3–7 September 2012; Volume 1, p. 3. [Google Scholar]
- Lempitsky, V.; Zisserman, A. Learning to count objects in images. Adv. Neural Inf. Process. Syst. 2010, 23, 1324–1332. [Google Scholar]
- Pham, V.Q.; Kozakaya, T.; Yamaguchi, O.; Okada, R. Count forest: Co-voting uncertain number of targets using random forest for crowd density estimation. In Proceedings of the IEEE International Conference on Computer Vision (ICCV), Montreal, BC, Canada, 11–17 October 2021; pp. 3253–3261. [Google Scholar]
- Khan, A.; Sohail, A.; Zahoora, U.; Qureshi, A.S. A survey of the recent architectures of deep convolutional neural networks. Artif. Intell. Rev. 2020, 53, 5455–5516. [Google Scholar] [CrossRef] [Green Version]
- Peng, X.; Zhang, X.; Li, Y.; Liu, B. Research on image feature extraction and retrieval algorithms based on convolutional neural network. J. Vis. Commun. Image Represent. 2020, 69, 102705. [Google Scholar] [CrossRef]
- Fu, M.; Xu, P.; Li, X.; Liu, Q.; Ye, M.; Zhu, C. Fast crowd density estimation with convolutional neural networks. Eng. Appl. Artif. Intell. 2015, 43, 81–88. [Google Scholar] [CrossRef]
- Wang, C.; Zhang, H.; Yang, L.; Liu, S.; Cao, X. Deep people counting in extremely dense crowds. In Proceedings of the 23rd ACM International Conference on Multimedia, Brisbane, Australia, 26–30 October 2015; pp. 1299–1302. [Google Scholar]
- Zhang, Y.; Zhou, D.; Chen, S.; Gao, S.; Ma, Y. Single-image crowd counting via multi-column convolutional neural network. In Proceedings of the IEEE Conference on Computer Vision and Pattern Recognition, Las Vegas, NV, USA, 27–30 June 2016; pp. 589–597. [Google Scholar]
- Boominathan, L.; Kruthiventi, S.S.; Babu, R.V. Crowdnet: A deep convolutional network for dense crowd counting. In Proceedings of the 24th ACM International Conference on Multimedia, Las Vegas, NV, USA, 27–30 June 2016; pp. 640–644. [Google Scholar]
- Onoro-Rubio, D.; López-Sastre, R.J. Towards perspective-free object counting with deep learning. In Proceedings of the European Conference on Computer Vision, Amsterdam, The Netherlands, 11–14 October 2016; Springer: Berlin/Heidelberg, Germany, 2016; pp. 615–629. [Google Scholar]
- Babu Sam, D.; Surya, S.; Venkatesh Babu, R. Switching convolutional neural network for crowd counting. In Proceedings of the IEEE Conference on Computer Vision and Pattern Recognition, Honolulu, HI, USA, 21–26 July 2017; pp. 5744–5752. [Google Scholar]
- Zhang, A.; Shen, J.; Xiao, Z.; Zhu, F.; Zhen, X.; Cao, X.; Shao, L. Relational attention network for crowd counting. In Proceedings of the IEEE/CVF International Conference on Computer Vision, Seoul, Korea, 27–28 October 2019; pp. 6788–6797. [Google Scholar]
- Li, Y.; Zhang, X.; Chen, D. Csrnet: Dilated convolutional neural networks for understanding the highly congested scenes. In Proceedings of the IEEE Conference on Computer Vision and Pattern Recognition, Salt Lake City, UT, USA, 18–22 June 2018; pp. 1091–1100. [Google Scholar]
- Liu, N.; Long, Y.; Zou, C.; Niu, Q.; Pan, L.; Wu, H. Adcrowdnet: An attention-injective deformable convolutional network for crowd understanding. In Proceedings of the IEEE/CVF International Conference on Computer Vision, Seoul, Korea, 27–28 October 2019; pp. 3225–3234. [Google Scholar]
- Ronneberger, O.; Fischer, P.; Brox, T. U-net: Convolutional networks for biomedical image segmentation. In Proceedings of the International Conference on Medical Image Computing and Computer-Assisted Intervention, Munich, Germany, 5–9 October 2015; Springer: Berlin/Heidelberg, Germany, 2015; pp. 234–241. [Google Scholar]
- Valloli, V.K.; Mehta, K. W-Net: Reinforced u-net for density map estimation. arXiv 2019, arXiv:1903.11249. [Google Scholar]
- Gao, J.; Gong, M.; Li, X. Congested Crowd Instance Localization with Dilated Convolutional Swin Transformer. arXiv 2021, arXiv:2108.00584. [Google Scholar]
- Tian, Y.; Chu, X.; Wang, H. CCTrans: Simplifying and Improving Crowd Counting with Transformer. arXiv 2021, arXiv:2109.14483. [Google Scholar]
- Hsieh, M.R.; Lin, Y.L.; Hsu, W.H. Drone-based object counting by spatially regularized regional proposal network. In Proceedings of the IEEE International Conference on Computer Vision, 2017, Venice, Italy, 22–29 October 2017; pp. 4145–4153. [Google Scholar]
- Wen, L.; Du, D.; Zhu, P.; Hu, Q.; Wang, Q.; Bo, L.; Lyu, S. Drone-based joint density map estimation, localization and tracking with space-time multi-scale attention network. arXiv 2019, arXiv:1912.01811. [Google Scholar]
- Du, D.; Wen, L.; Zhu, P.; Fan, H.; Hu, Q.; Ling, H.; Shah, M.; Pan, J.; Al-Ali, A.; Mohamed, A.; et al. Visdrone-cc2020: The vision meets drone crowd counting challenge results. In Proceedings of the European Conference on Computer Vision, Glasgow, UK, 23–28 August 2020; Springer: Berlin/Heidelberg, Germany, 2020; pp. 675–691. [Google Scholar]
- Wen, L.; Du, D.; Zhu, P.; Hu, Q.; Wang, Q.; Bo, L.; Lyu, S. Detection, Tracking, and Counting Meets Drones in Crowds: A Benchmark. In Proceedings of the IEEE/CVF Conference on Computer Vision and Pattern Recognition (CVPR), Online, 19–25 June 2021; pp. 7812–7821. [Google Scholar]
- Tian, Y.; Duan, C.; Zhang, R.; Wei, Z.; Wang, H. Lightweight Dual-Task Networks For Crowd Counting In Aerial Images. In Proceedings of the ICASSP 2021—2021 IEEE International Conference on Acoustics, Speech and Signal Processing (ICASSP), Toronto, ON, Canada, 6–11 June 2021; IEEE: Piscataway, NJ, USA, 2021; pp. 1975–1979. [Google Scholar]
- Zhao, Z.; Han, T.; Gao, J.; Wang, Q.; Li, X. A flow base bi-path network for cross-scene video crowd understanding in aerial view. In Proceedings of the European Conference on Computer Vision, Glasgow, UK, 23–28 August 2020; Springer: Berlin/Heidelberg, Germany, 2020; pp. 574–587. [Google Scholar]
- Verhelst, M.; Moons, B. Embedded deep neural network processing: Algorithmic and processor techniques bring deep learning to IoT and edge devices. IEEE-Solid-State Circuits Mag. 2017, 9, 55–65. [Google Scholar] [CrossRef]
- Liang, T.; Glossner, J.; Wang, L.; Shi, S.; Zhang, X. Pruning and quantization for deep neural network acceleration: A survey. Neurocomputing 2021, 461, 370–403. [Google Scholar] [CrossRef]
- Jiang, Y.; Han, S.; Bai, Y. Building and Infrastructure Defect Detection and Visualization Using Drone and Deep Learning Technologies. J. Perform. Constr. Facil. 2021, 35, 04021092. [Google Scholar] [CrossRef]
- Franklin, D.; Hariharapura, S.S.; Todd, S. Bringing Cloud-Native Agility to Edge AI Devices with the NVIDIA Jetson Xavier NX Developer Kit. 2020. Available online: https://developer.nvidia.com/blog/bringing-cloud-native-agility-to-edge-ai-with-jetson-xavier-nx/ (accessed on 11 August 2021).
- Gorbachev, Y.; Fedorov, M.; Slavutin, I.; Tugarev, A.; Fatekhov, M.; Tarkan, Y. OpenVINO deep learning workbench: Comprehensive analysis and tuning of neural networks inference. In Proceedings of the 2019 IEEE/CVF International Conference on Computer Vision Workshop (ICCVW), Seoul, Korea, 27–28 October 2019. [Google Scholar]
- Libutti, L.A.; Igual, F.D.; Pinuel, L.; De Giusti, L.; Naiouf, M. Benchmarking performance and power of USB accelerators for inference with MLPerf. In Proceedings of the 2nd Workshop on Accelerated Machine Learning (AccML), Valencia, Spain, 31 May 2020. [Google Scholar]
- Zhou, Z.; Siddiquee, M.M.R.; Tajbakhsh, N.; Liang, J. UNet++: A Nested U-Net Architecture for Medical Image Segmentation. arXiv 2018, arXiv:1807.10165. [Google Scholar]
- Chen, L.; Zhu, Y.; Papandreou, G.; Schroff, F.; Adam, H. Encoder-Decoder with Atrous Separable Convolution for Semantic Image Segmentation. arXiv 2018, arXiv:1802.02611. [Google Scholar]
- He, K.; Zhang, X.; Ren, S.; Sun, J. Deep Residual Learning for Image Recognition. arXiv 2015, arXiv:1512.03385. [Google Scholar]
- Tan, M.; Le, Q.V. EfficientNet: Rethinking Model Scaling for Convolutional Neural Networks. arXiv 2019, arXiv:1905.11946. [Google Scholar]
- Tan, M.; Chen, B.; Pang, R.; Vasudevan, V.; Le, Q.V. MnasNet: Platform-Aware Neural Architecture Search for Mobile. arXiv 2018, arXiv:1807.11626. [Google Scholar]
- Tan, M.; Le, Q.V. MixConv: Mixed Depthwise Convolutional Kernels. arXiv 2019, arXiv:1907.09595. [Google Scholar]
- Yakubovskiy, P. Segmentation Models Pytorch. 2020. Available online: https://github.com/qubvel/segmentation_models.pytorch (accessed on 13 March 2022).
- Kroeger, T.; Timofte, R.; Dai, D.; Van Gool, L. Fast optical flow using dense inverse search. In Proceedings of the European Conference on Computer Vision, Amsterdam, The Netherlands, 11–14 October 2016; Springer: Berlin/Heidelberg, Germany, 2016; pp. 471–488. [Google Scholar]
- Hur, J.; Roth, S. Optical flow estimation in the deep learning age. In Modelling Human Motion; Springer: Berlin/Heidelberg, Germany, 2020; pp. 119–140. [Google Scholar]
- Buslaev, A.V.; Parinov, A.; Khvedchenya, E.; Iglovikov, V.I.; Kalinin, A.A. Albumentations: Fast and flexible image augmentations. arXiv 2018, arXiv:1809.06839. [Google Scholar]
- Shorten, C.; Khoshgoftaar, T.M. A survey on Image Data Augmentation for Deep Learning. J. Big Data 2019, 6, 60. [Google Scholar] [CrossRef]
- Bai, J.; Lu, F.; Zhang, K. ONNX: Open Neural Network Exchange. 2019. Available online: https://github.com/onnx/onnx (accessed on 13 March 2022).
- Developers, O.R. ONNX Runtime. Version: 1.10.0. 2021. Available online: https://onnxruntime.ai/ (accessed on 13 March 2022).
- Wang, Q.; Gao, J.; Lin, W.; Li, X. NWPU-Crowd: A Large-Scale Benchmark for Crowd Counting. arXiv 2020, arXiv:2001.03360. [Google Scholar] [CrossRef]
- Iqbal, S. A Study on UAV Operating System Security and Future Research Challenges. In Proceedings of the 2021 IEEE 11th Annual Computing and Communication Workshop and Conference (CCWC), Online, 27–30 January 2021; pp. 759–765. [Google Scholar] [CrossRef]


| Flow Mode | NVIDIA Jetson Xavier NX | Raspberry Pi 4 | ||
|---|---|---|---|---|
| Average Time (s) | Performance (img/s) | Aver. Time [s] | Performance (img/s) | |
| Medium | 0.130 ± 0.009 | 7.747 ± 0.426 | 0.405 ± 0.002 | 2.471 ± 0.013 |
| Fast | 0.034 ± 0.008 | 30.814 ± 4.346 | 0.091 ± 0.001 | 10.968 ± 0.118 |
| Ultrafast | 0.011 ± 0.001 | 93.011 ± 7.286 | 0.028 ± 0.001 | 35.326 ± 0.325 |
| Model | Encoder | Input Resolution | |||
|---|---|---|---|---|---|
| 480 × 288 | 640 × 384 | 960 × 540 | 1280 × 736 | ||
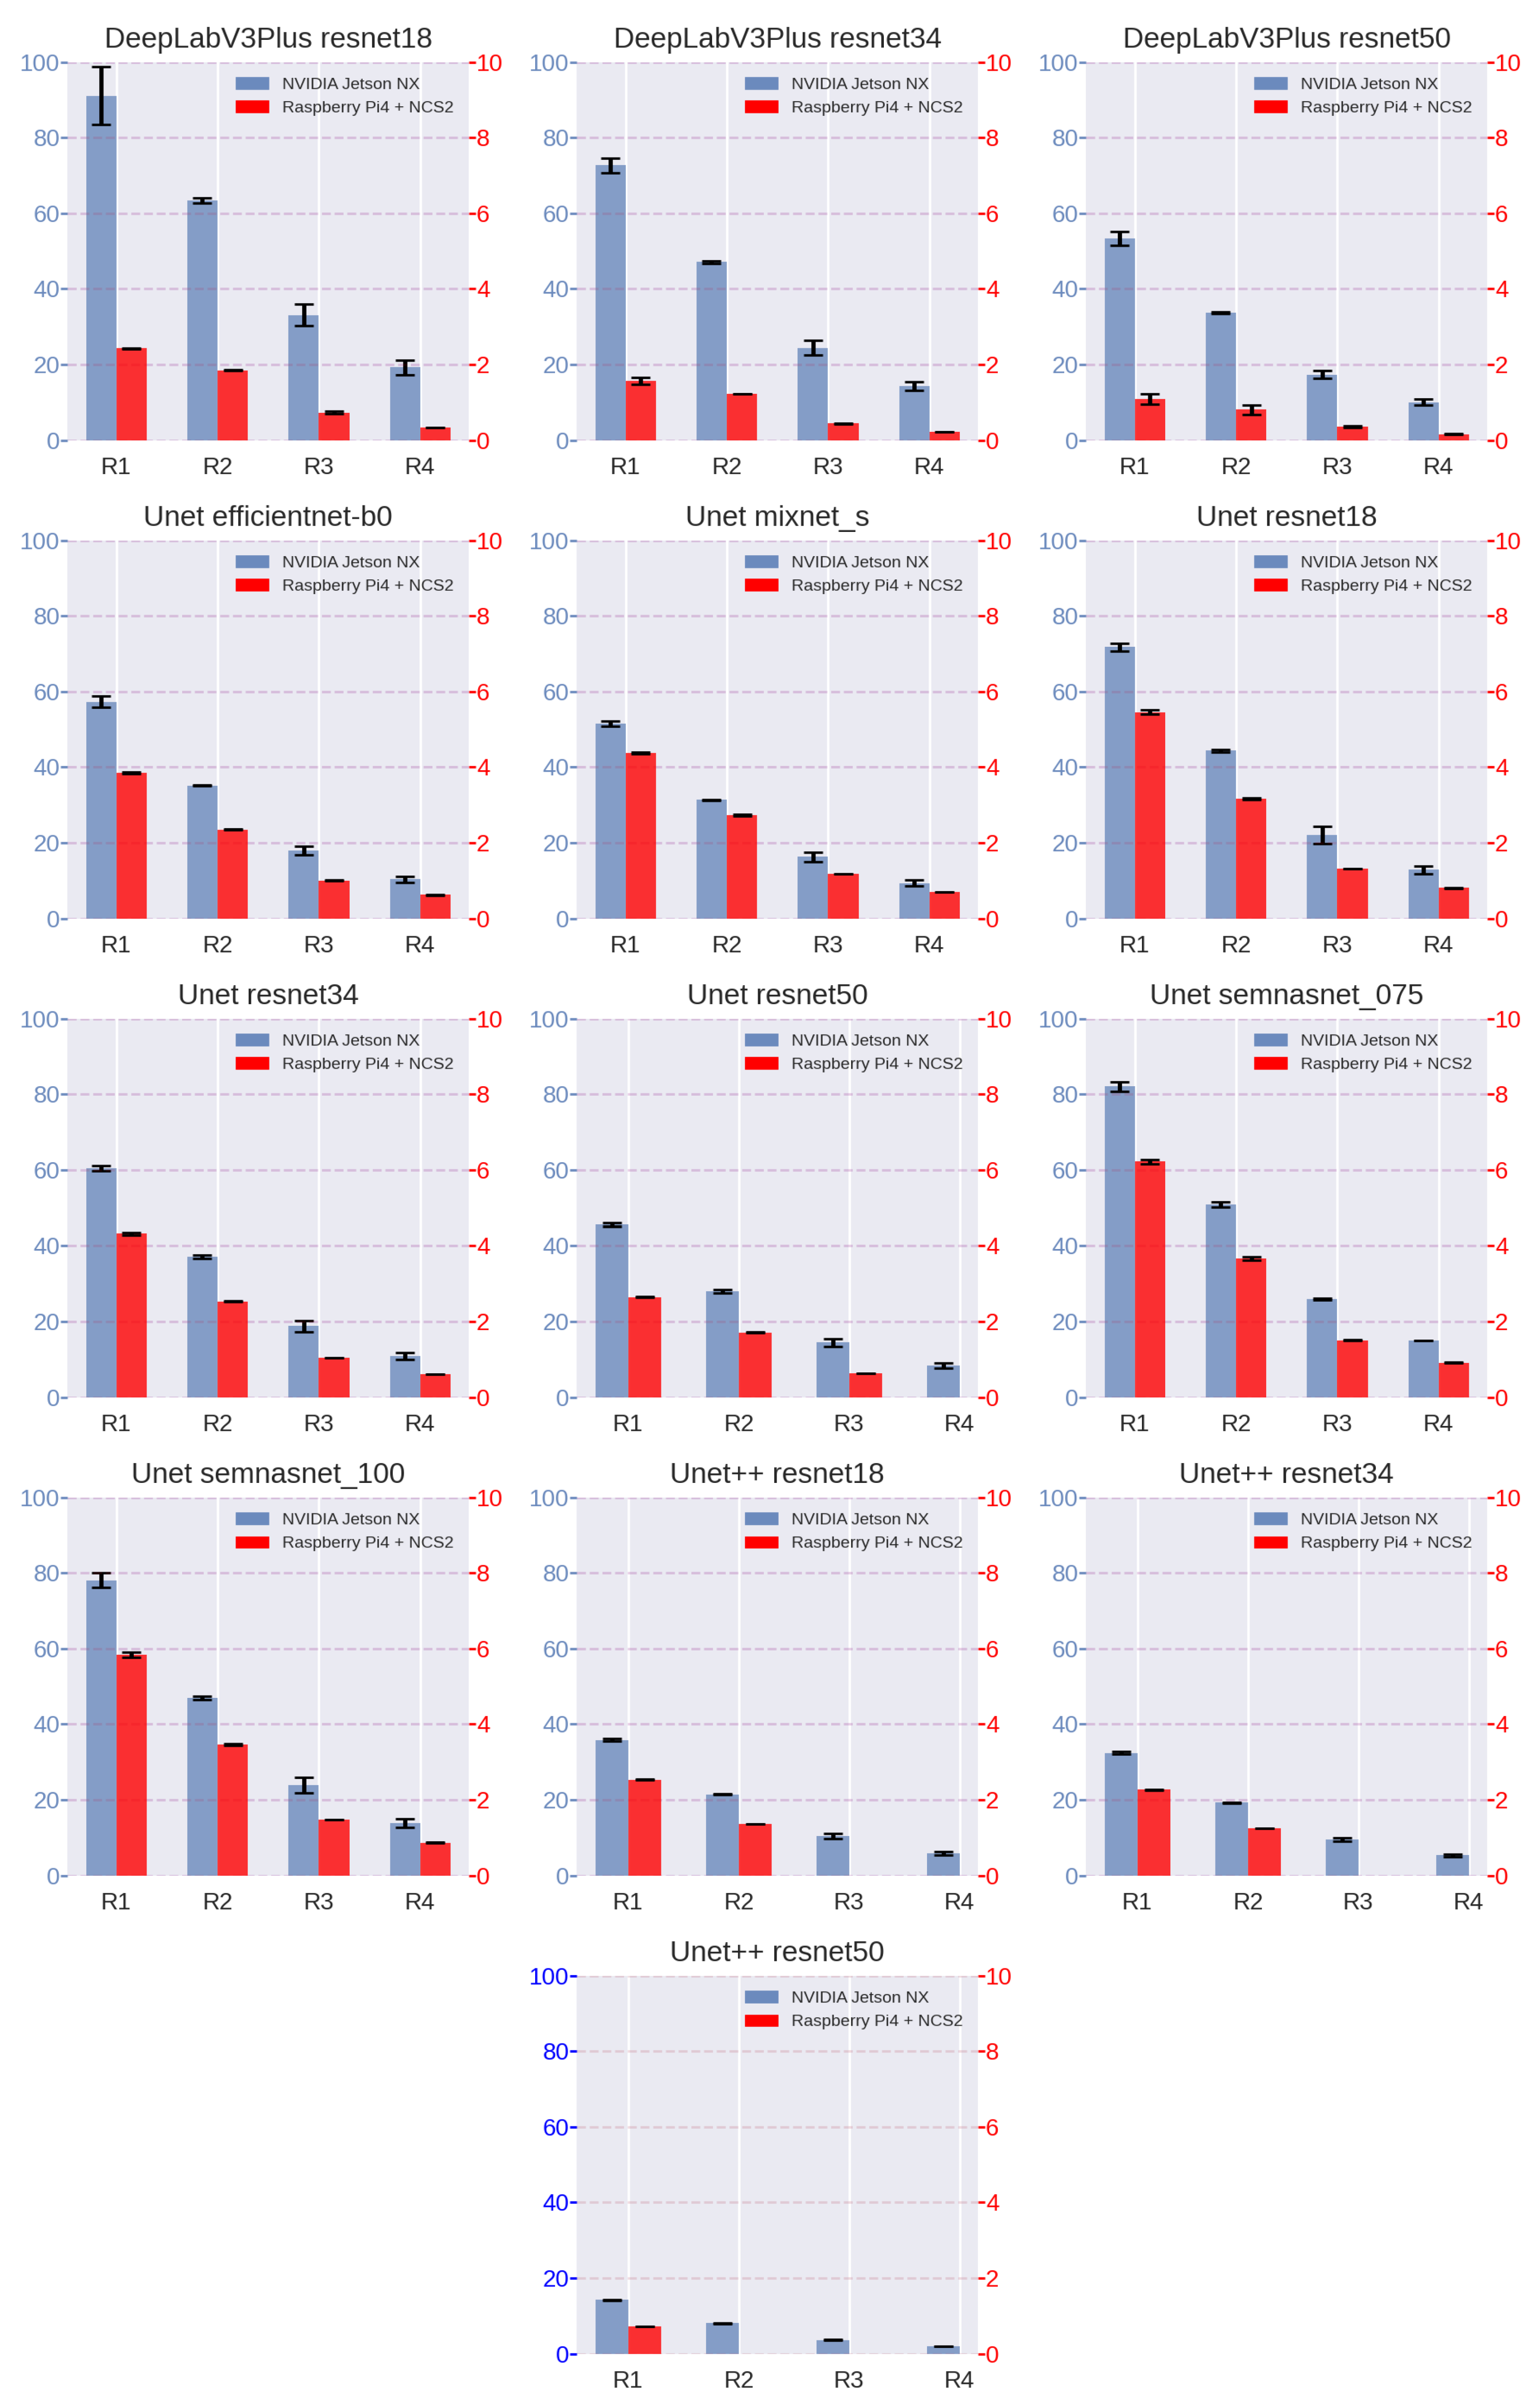
| UNet | resnet18 | 60.367 ± 0.688 | 37.127 ± 0.349 | 18.793 ± 1.445 | 10.879 ± 0.863 |
| resnet34 | 45.546 ± 0.481 | 27.970 ± 0.376 | 14.464 ± 1.013 | 8.367 ± 0.640 | |
| resnet50 | 57.265 ± 1.490 | 35.131 ± 0.171 | 17.916 ± 1.191 | 10.333 ± 0.812 | |
| mixnet_s | 51.561 ± 0.729 | 31.341 ± 0.135 | 16.257 ± 1.229 | 9.338 ± 0.764 | |
| semnasnet_075 | 82.018 ± 1.233 | 50.846 ± 0.636 | 25.949 ± 0.188 | 15.016 ± 0.049 | |
| semnasnet_100 | 78.074 ± 1.904 | 46.919 ± 0.412 | 23.816 ± 2.031 | 13.892 ± 1.175 | |
| efficientnet-b0 | 91.058 ± 7.687 | 63.451 ± 0.707 | 33.104 ± 2.919 | 19.241 ± 1.888 | |
| UNet++ | resnet18 | 35.856 ± 0.416 | 21.419 ± 0.129 | 10.368 ± 0.636 | 5.762 ± 0.431 |
| resnet34 | 32.417 ± 0.373 | 19.239 ± 0.085 | 9.537 ± 0.487 | 5.270 ± 0.384 | |
| resnet50 | 14.195 ± 0.058 | 8.045 ± 0.118 | 3.652 ± 0.021 | 1.982 ± 0.023 | |
| DeepLabV3+ | resnet18 | 91.058 ± 7.687 | 63.451 ± 0.707 | 33.104 ± 2.919 | 19.241 ± 1.888 |
| resnet34 | 72.688 ± 1.980 | 47.103 ± 0.353 | 24.402 ± 1.884 | 14.272 ± 1.236 | |
| resnet50 | 53.308 ± 1.790 | 33.778 ± 0.216 | 17.368 ± 1.103 | 10.055 ± 0.810 | |
| Model | Encoder | Input Resolution | |||
|---|---|---|---|---|---|
| 480 × 288 | 640 × 384 | 960 × 540 | 1280 × 736 | ||
| UNet | resnet18 | 5.450 ± 0.050 | 3.160 ± 0.021 | 1.305 ± 0.002 | 0.801 ± 0.002 |
| resnet34 | 4.320 ± 0.030 | 2.536 ± 0.010 | 1.034 ± 0.001 | 0.612 ± 0.001 | |
| resnet50 | 2.646 ± 0.012 | 1.709 ± 0.016 | 0.637 ± 0.001 | E1 | |
| mixnet_s | 4.372 ± 0.030 | 2.732 ± 0.021 | 1.179 ± 0.004 | 0.700 ± 0.002 | |
| semnasnet_075 | 6.217 ± 0.053 | 3.665 ± 0.051 | 1.500 ± 0.010 | 0.913 ± 0.006 | |
| semnasnet_100 | 5.839 ± 0.066 | 3.462 ± 0.023 | 1.469 ± 0.006 | 0.867 ± 0.006 | |
| efficientnet-b0 | 3.851 ± 0.027 | 2.351 ± 0.018 | 1.006 ± 0.001 | 0.619 ± 0.002 | |
| UNet++ | resnet18 | 2.528 ± 0.012 | 1.368 ± 0.002 | E2 | E2 |
| resnet34 | 2.269 ± 0.012 | 1.236 ± 0.001 | E2 | E2 | |
| resnet50 | 0.715 ± 0.001 | E2 | E2 | E2 | |
| DeepLabV3+ | resnet18 | 2.427 ± 0.013 | 1.844 ± 0.008 | 0.730 ± 0.034 | 0.337 ± 0.001 |
| resnet34 | 1.567 ± 0.094 | 1.220 ± 0.005 | 0.436 ± 0.021 | 0.224 ± 0.005 | |
| resnet50 | 1.082 ± 0.136 | 0.805 ± 0.121 | 0.344 ± 0.023 | 0.159 ± 0.012 | |
| Model | Encoder | Input Resolution | |||||||
|---|---|---|---|---|---|---|---|---|---|
| 480 × 288 (R1) | 640 × 384 (R2) | 960 × 540 (R3) | 1280 × 736 (R4) | ||||||
| M1 | M2 | M1 | M2 | M1 | M2 | M1 | M2 | ||
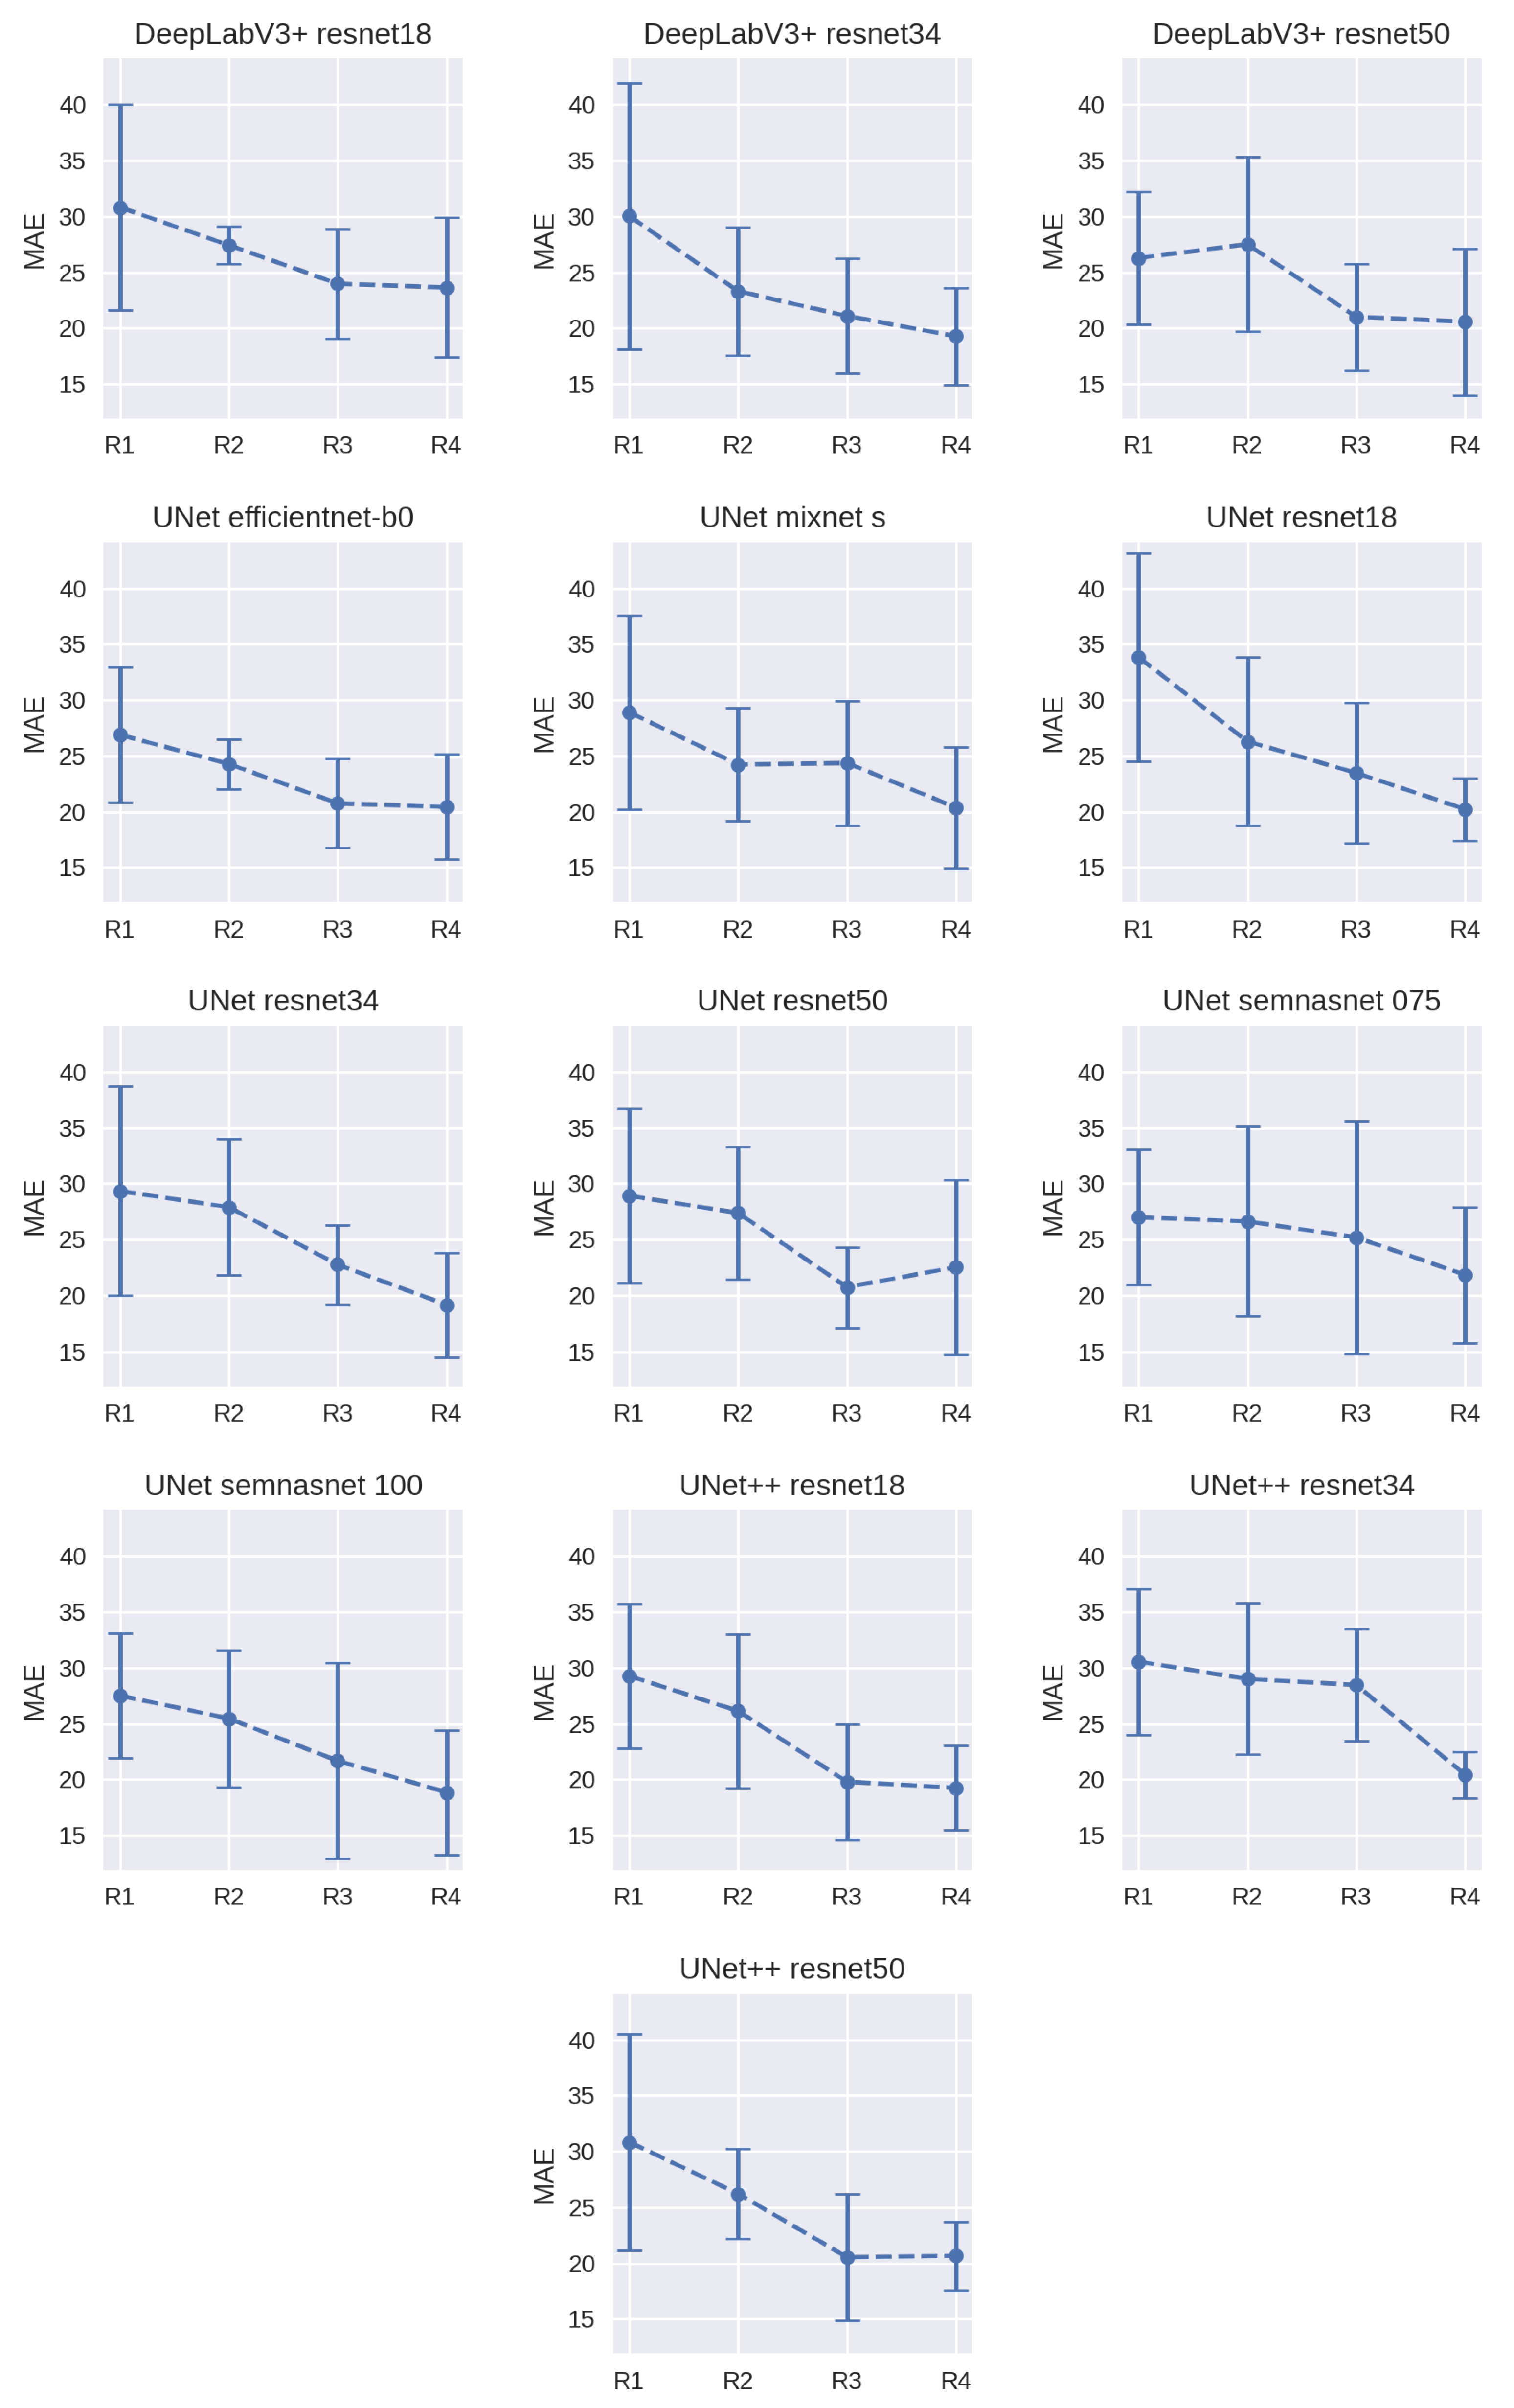
| UNet | resnet18 | 33.85 ± 9.30 | 0.27 ± 0.07 | 26.30 ± 7.56 | 0.20 ± 0.05 | 23.47 ± 6.31 | 0.17 ± 0.05 | 20.23 ± 2.78 | 0.16 ± 0.05 |
| resnet34 | 29.34 ± 9.35 | 0.24 ± 0.10 | 27.90 ± 6.10 | 0.22 ± 0.06 | 22.75 ± 3.55 | 0.18 ± 0.05 | 19.14 ± 4.66 | 0.14 ± 0.03 | |
| resnet50 | 28.92 ± 7.78 | 0.22 ± 0.04 | 27.37 ± 5.95 | 0.21 ± 0.05 | 20.73 ± 3.59 | 0.16 ± 0.06 | 22.53 ± 7.80 | 0.16 ± 0.02 | |
| mixnet_s | 28.90 ± 8.72 | 0.20 ± 0.04 | 24.23 ± 5.08 | 0.19 ± 0.04 | 24.36 ± 5.60 | 0.19 ± 0.06 | 20.38 ± 5.41 | 0.15 ± 0.04 | |
| semnasnet_075 | 26.99 ± 6.08 | 0.18 ± 0.04 | 26.62 ± 8.49 | 0.21 ± 0.10 | 25.19 ± 10.40 | 0.164 ± 0.02 | 21.83 ± 6.04 | 0.16 ± 0.02 | |
| semnasnet_100 | 27.53 ± 5.57 | 0.21 ± 0.05 | 25.46 ± 6.14 | 0.17 ± 0.04 | 21.67 ± 8.77 | 0.15 ± 0.02 | 18.85 ± 5.58 | 0.13 ± 0.02 | |
| efficientnet-b0 | 26.89 ± 6.06 | 0.21 ± 0.05 | 24.28 ± 2.27 | 0.18 ± 0.03 | 20.75 ± 4.01 | 0.15 ± 0.02 | 20.43 ± 4.66 | 0.14 ± 0.03 | |
| UNet++ | resnet18 | 29.27 ± 6.47 | 0.22 ± 0.06 | 26.13 ± 6.92 | 0.21 ± 0.06 | 19.79 ± 5.18 | 0.14 ± 0.03 | 19.26 ± 3.79 | 0.15 ± 0.03 |
| resnet34 | 30.56 ± 6.53 | 0.23 ± 0.07 | 29.01 ± 6.79 | 0.21 ± 0.06 | 28.47 ± 5.06 | 0.21 ± 0.07 | 20.42 ± 2.06 | 0.15 ± 0.05 | |
| resnet50 | 30.85 ± 9.68 | 0.22 ± 0.07 | 26.22 ± 4.03 | 0.21 ± 0.04 | 20.53 ± 5.67 | 0.15 ± 0.01 | 20.66 ± 3.05 | 0.15 ± 0.03 | |
| DeepLabV3+ | resnet18 | 30.82 ± 9.24 | 0.27 ± 0.09 | 27.43 ± 1.69 | 0.24 ± 0.08 | 23.97 ± 4.89 | 0.18 ± 0.06 | 23.63 ± 6.24 | 0.17 ± 0.04 |
| resnet34 | 30.03 ± 11.91 | 0.24 ± 0.08 | 23.30 ± 5.76 | 0.18 ± 0.07 | 21.07 ± 5.15 | 0.17 ± 0.05 | 19.27 ± 4.33 | 0.15 ± 0.03 | |
| resnet50 | 26.27 ± 5.91 | 0.20 ± 0.05 | 27.51 ± 7.83 | 0.21 ± 0.06 | 21.00 ± 4.79 | 0.15 ± 0.04 | 20.55 ± 6.56 | 0.14 ± 0.03 | |
Publisher’s Note: MDPI stays neutral with regard to jurisdictional claims in published maps and institutional affiliations. |
© 2022 by the authors. Licensee MDPI, Basel, Switzerland. This article is an open access article distributed under the terms and conditions of the Creative Commons Attribution (CC BY) license (https://creativecommons.org/licenses/by/4.0/).
Share and Cite
Ptak, B.; Pieczyński, D.; Piechocki, M.; Kraft, M. On-Board Crowd Counting and Density Estimation Using Low Altitude Unmanned Aerial Vehicles—Looking beyond Beating the Benchmark. Remote Sens. 2022, 14, 2288. https://doi.org/10.3390/rs14102288
Ptak B, Pieczyński D, Piechocki M, Kraft M. On-Board Crowd Counting and Density Estimation Using Low Altitude Unmanned Aerial Vehicles—Looking beyond Beating the Benchmark. Remote Sensing. 2022; 14(10):2288. https://doi.org/10.3390/rs14102288
Chicago/Turabian StylePtak, Bartosz, Dominik Pieczyński, Mateusz Piechocki, and Marek Kraft. 2022. "On-Board Crowd Counting and Density Estimation Using Low Altitude Unmanned Aerial Vehicles—Looking beyond Beating the Benchmark" Remote Sensing 14, no. 10: 2288. https://doi.org/10.3390/rs14102288