Article

Remote Sensing Mapping of Peat-Fire-Burnt Areas: Identification among Other Wildfires

Institute of Forest Science, Russian Academy of Sciences, Uspenskoye, 143030 Moscow, Russia
*
Author to whom correspondence should be addressed.
Remote Sens. 2022, 14(1), 194; https://doi.org/10.3390/rs14010194
Submission received: 10 November 2021 / Revised: 25 December 2021 / Accepted: 29 December 2021 / Published: 2 January 2022
(This article belongs to the Special Issue State-of-the-Art Technology of Remote Sensing in Russia)

Abstract

:
Peat fires differ from other wildfires in their duration, carbon losses, emissions of greenhouse gases and highly hazardous products of combustion and other environmental impacts. Moreover, it is difficult to identify peat fires using ground-based methods and to distinguish peat fires from forest fires and other wildfires by remote sensing. Using the example of catastrophic fires in July–August 2010 in the Moscow region (the center of European Russia), in the present study, we consider the results of peat-fire detection using Terra/Aqua Moderate Resolution Imaging Spectroradiometer (MODIS) hotspots, peat maps, and analysis of land cover pre- and post-fire according to Landsat-5 TM data. A comparison of specific (for detecting fires) and non-specific vegetation indices showed the difference index ΔNDMI (pre- and post-fire normalized difference moisture Index) to be the most effective for detecting burns in peatlands according to Landsat-5 TM data. In combination with classification (both unsupervised and supervised), this index offered 95% accuracy (by ground verification) in identifying burnt areas in peatlands. At the same time, most peatland fires were not detected by Terra/Aqua MODIS data. A comparison of peatland and other wildfires showed the clearest differences between them in terms of duration and the maximum value of the fire radiation power index. The present results may help in identifying peat (underground) fires and their burnt areas, as well as accounting for carbon losses and greenhouse gas emissions.

Graphical Abstract

1. Introduction

Wildfires are catastrophic hazards and are now occurring with increased frequency and magnitude due to climate change and human influence [1]. Among wildfires, peat fires stand out for their impact on land and climate, as these fires affect the most carbon-rich terrestrial ecosystems. Globally, the amount of carbon stored in peats exceeds that stored in vegetation [2]. Peat fires are characterized by smoldering combustion. Peat can burn for long periods, even under prolonged rainfall and snow cover [3,4,5,6]. Peat fires produce greenhouse gases (GHG) [7] and release large amounts of ancient carbon, equivalent to approximately 15% of human-induced emissions [8,9]. Moreover, smoke compounds are very dangerous to human health [5,10]. This factor was especially evident during the catastrophic forest-peat fires in the center of European Russia in July–August 2010 [11,12], during which a combination of anomalous hot weather [13] and extreme smog [14] dramatically increased mortality [15].
Most peat fires are associated with Southeast Asia [16], where they may have planetary consequences [17,18]. However, peat fires occur in all regions of the world where peatlands exist [5]. In Russia, such fires occur from the tundra to the steppe but most often in the boreal zone [19]. More than 21% of the country is covered by peat, comprising 139 million ha of peatland with ≥ 30 cm of peat and 230 million ha of paludified lands with <30 cm of peat [20]; in only the European part of Russia, the proportion is 17% [21]. In total, 38% of peatlands and 47% of paludified lands in Russia are covered with forest or sparsely treed vegetation [22]. In these areas, forest fires penetrate into the peat soil, become ground (peat) fires, damage the tree roots, and lead to death of the forest stand [23] (Figure 1). Lower groundwater levels produce deeper fires, more damage to trees, and larger soil-carbon losses [24], exacerbating the effects of climate change [4]. In dry years, natural mires can also burn, but the probability of fires is greatly increased in the case of drained peatlands [25]. In Russia, as in other countries, peatlands drained for milling peat extraction and for agriculture are most fire prone if they are abandoned and not controlled by the user [26].
Although peat fires are notable for their ecological consequences, separating peat fires from other wildfires (forest, grass, etc.) is difficult, especially when we consider not one specific fire but several fires covering large areas. This factor also applies to solving the problems of estimating related to peat-fire carbon losses and greenhouse gas emissions. The IPCC Guidelines for Greenhouse Gas Inventories [27,28,29] propose methodologies to account for emissions from wildfires from biomass burning only. The IPCC 2013 Supplement on Wetlands [7], which provides default methodologies and emission factors for CO2, CH4 and CO emissions from fires on organic soils, notes the difficulty of determining areas burnt by peat fires and the need to develop country-specific, high-level (Tier 2 and 3) methodologies for determining burnt areas in countries with frequent peat fires. This need primarily concerns Southeast Asia, Canada, the USA (especially Alaska), and Russia and highlights the relevance of developing and testing a methodology for mapping burnt areas from peat and forest-peat fires, which can only be done on the basis of remote data when studying extensive and difficult-to-access territories. Recently, unmanned aerial vehicles (UAVs) have been increasingly used to detect peat fires [30], but their use is local; UAVs can complement, but cannot replace, satellite data.
Satellite remote sensing data are widely used for identifying burnt areas. The identification of burnt areas on a global scale is based predominantly on low-spatial- resolution data The Advanced Very High Resolution Radiometer (AVHRR) and the Moderate Resolution Imaging Spectroradiometer (MODIS) [31]. For regional assessments, much attention has been given, including in Russia, to developing products based on Landsat data [32,33,34,35]. However, the approaches successfully used for MODIS, VEGETATION, etc. do not work properly with Landsat sensors due to its limited temporal resolution. Land-surface reflectance analysis is further complicated by cloud cover and rapid post-fire vegetation changes [36], especially in burnt peatlands [12,37,38]. Current experience relates to the identification of areas with burnt vegetation cover and has not been tested directly to identify peat fires.
The aim of the present work was to test the possibility of employing remote sensing data to map burnt areas from peat fires by using information on the distribution of peatlands based on the consequences of the catastrophic wildfires fires in July–August 2010 in central European Russia, specifically in the Moscow region. We sought to solve the following problems: – to identify peat fires by superimposing data on wildfires derived from Terra/Aqua MODIS hotspots onto a map of the peatlands; – to examine the applicability of known specific (i.e., detecting burnt areas) and non-specific spectral indices in mapping burnt areas, with verification of the results through ground data; – to carry out regional mapping and estimate the area burnt by peat fires; – and to compare the identified peat fires with other wildfires in terms of duration, burning temperature, and fire radiative power (FRP) to achieve detection of the fires in the absence of data on the distribution of peatlands.

2. Materials and Methods

2.1. Study Area

This study was based on areas burnt after the 2010 wildfires in the Moscow region (Figure 2), which were some of the most extensive peat fires in the boreal zone in recent decades [11,12,26]. With a total area of 44,329 km² (together with Moscow City 46,890 km²), the eastern part of the region is dominated by peatlands, with peat bogs and drained peatlands covering over 2500 km² or almost 6% of the territory [39]. Historically, this region leads the rest of Russia, and possibly the entire boreal zone of Europe and North America, in its areas of abandoned milled-peat extraction fields, which, together with unused drained agricultural land, are the most problematic areas in terms of peat fires. Depending on the weather and climatic conditions, peat fires appear regularly, with the most extensive peat fires having occurred in 2002 and 2010 [26]. To prevent future peat fires, 77 drained peatlands with a total area of 73,049 ha were rewetted in the Moscow region in between 2010 and 2013. This was the largest rewetting of peatland in the Northern Hemisphere, and subsequent monitoring by satellite data with ground verification unequivocally confirmed the effectiveness of this measure [12].

2.2. Source Data

The geographic information system (GIS) data for peatlands in the Moscow region were used to determine the position of fires in relation to the peatlands [39]. Bogs and drained peatlands have a wide range of vegetation (including varying degrees of afforestation) whose spectral characteristics can coincide with those of the surrounding land on mineral soils. Available sectorial and scientific data, including peat deposit inventories, soil, topographic, geobotanical map, and forest inventory data, were used to create the GIS, while other data served as further sources of primary information. This area was geo-referenced using specially obtained up-to-date multispectral imagery from the Spot-5 satellite, whose pixel size (10 m) enables the delineation of objects with a minimum area of up to 0.5 ha.
The total area of the recorded peatlands was 254,000 ha at this stage, the overwhelming majority of which had an area of less than 100 ha, with almost half from 1 to 10 ha. However, the key contribution to peat-covered lands was made by large peatlands, six of which had an area greater than 10,000 ha (accounting for 48%), and with an area of more than 1000 ha (in total, 35) for more than 75% of peatlands in the region [39]. This methodology was tested and used for other regions of Russia and is part of the GIS “Peatlands of Russia” [22,40].
To detect peat fires based on crossing wildfires with peatland boundaries [39], we used Collection 6 Terra/Aqua MODIS low-spatial-resolution 1 km hotspot satellite data (see Supplementary Material Table S1) on thermal anomalies provided by the Center for Collective Use "IKI-Monitoring" of the Space Research Institute of the Russian Academy of Sciences (http://ckp.geosmis.ru/) [41]. In addition to the raw hotspots, information on fires was obtained by combining several burning polygons for different dates when they overlapped or were less than 1 km apart with a time difference no more than five days. Burning polygons for each Terra/Aqua MODIS image were formed from several hotspots if they overlapped or if the distance between them did not exceed 0.3 km [42]. Additionally, for all fires from the Terra/Aqua MODIS hotspots of all wildfires in the Moscow region, the following values were obtained: average and maximum fire radiative power (FRP) [43] (see Supplementary Material S1), MOD14/MYD14 product temperature, and fire duration [44]. FRP values stored in the Collection 6 Terra/Aqua MODIS fire product suite were calculated using the equation originally formulated by Kaufman et al. [45] and amended by Giglio [46].
A total of 598 points on 151 peatland areas were randomly selected for ground verification of the accuracy of burnt-area detection. The total area of the regions with check points was 243 km² (Figure 3). A ground survey was carried out in 2017. The total length of the road routes was about 2000 km, and that of the foot routes was about 25 km. The sites were excavated to identify traces of peat fires, and photographs were taken. Shallow soil pits were made at these points to identify traces of peat fires, and photographs were taken of the area.
Landsat-5 TM data (https://earthexplorer.usgs.gov/ accessed on 1 February 2020 see Supplementary Material Table S1) were used to map peatland burns by comparing the spectral characteristics of the land cover before the fire with the spectral characteristics the year after the fire. For the pre-fire period, two pre-fire satellite swaths were used: two scenes for 1 July 2010, with 67% coverage of the study area, and three scenes for 15 July 2010, with 33% coverage (Figure 3). For the post-fire period, three satellite swaths were used, which included two scenes from 02 June 2011 (67% of area), 1 scene from 7 June 2011 (7%), and three scenes from 28 August 2011 (26%). When overlapping of 2011 data occurred, priority was given to images from 2 June 2011 and 7 June 2011. Radiometrically calibrated and atmospherically corrected images were used for thematic processing.

2.3. Methodology

The research methodology of this study involved several successive steps (see Supplementary Material Figure S1). First, peat fires were identified by overlaying wildfire data from Terra/Aqua MODIS hotspots onto the existing peatland map. The applicability of known specific (for detecting fires) and non-specific spectral indices for mapping burns from peatland fires was then examined using Landsat-5 TM data, and the results were verified against available ground data. The best performing index was then used to map burnt areas in 2010 in the peatlands of the Moscow region. We then compared data on peatland fires derived from Terra/Aqua MODIS hotspots and burnt areas from changes in vegetation cover as a result of fire according to Landsat-5 TM data. Finally, the identified peatland fires were compared with other wildfires based on their duration, temperature, and fire radiative power (FRP).
For the task of mapping burns from peat fires, we tested the most commonly used vegetation indices, including both general ones (NDVI, NDMI) and those specific for detecting burns (NBR, NBR2, MIRBI, BAI) (Table 1). The application of indices was considered for both the next post-fire vegetation season (2011; Index2011) and the difference between pre-fire and post-fire (the year following the fire) land cover status (ΔIndex).
The selection of the most appropriate index included the following steps: (1) clarifying the presence or absence of burnt peatlands within ground contours by comparing satellite data before and after the fire, including the exclusion of water bodies and unburnt vegetation; (2) calculating vegetation indices (Table 1) from satellite data before (2010) and after (2011) the fire (Index2010 and Index2011); (3) calculating the index difference ΔIndex = Index2010 − Index2011; (4) determining the Index2011 and ΔIndex values to identify burnt peatlands by choosing the values that best cover the refined ground burnt areas and avoiding the inclusion of foreign sites as much as possible; (5) merging the contours of identified burnt peatlands for all indices and producing a random set of points on these contours for ground truthing; and (6) choosing the best index by estimating the accuracy of Index2011 and ΔIndex for peatland burnt areas from ground data.
For each index, both the Index2011 post-fire period values and the differences between the pre-fire and post-fire period ΔIndex = Index2010 − Index2011 were analyzed. For each post-fire index and difference, thresholds for identifying burnt peatlands were determined. To begin selecting appropriate thresholds for each post-fire index or difference, the literature values for burnt areas from different natural fires were used as references: NBR [52,53,54], ΔNBR [49,55], ΔNBR2 [56], BAI [52,53], MIRBI [52,53], ΔMIRBI [56], NDVI [52,57], ΔNDVI [55], NDMI [58], and ΔNDMI [55]. The range of reference values was then expanded, narrowed, or shifted at small fractional intervals. If the haze coverage was satisfactory, the selected range was fixed.
The accuracy of the burnt areas determined for each index for both the post-fire and pre-fire–post-fire thresholds was assessed based on ground data. For this purpose, an area of 66,529 ha was generated, including all index-set havens. Where this area intersected with the ground data (56,053 ha), which amounted to 24,185 ha, a set of random points was generated for each of the 152 sites based on each site’s area. The number of points was calculated by dividing the area in ha by 50 with the addition of 1, and the points themselves were placed no closer than 100 m from each other. In this way, a set of 598 points was obtained.
The accuracy of the burnt areas for each Index2011 and ΔIndex was assessed from these points using ground verification. The ground verification plots were further investigated using satellite data, through which unburnt areas and water bodies were identified. In this way, both the burnt and unburnt areas were identified within the ground contours. To assess the accuracy of all Index2011 and ΔIndex indices within the peatland fire areas, each of the 598 points was checked to see if it fell within one of the Index2011 and ΔIndex indices and whether it was a burnt or unburnt area, as verified by the ground data.
For areas with optimal index threshold values established in the previous step for post-fire satellite data, an unsupervised classification was carried out with division into 50 classes. A larger number of classes enabled the subdivision of differentiated land cover and increased the accuracy in identifying categories of interest. Classification excluded classes with water bodies with noted detection errors when evaluating the applicability of all six indices and their temporal differences. Waterbody classes were visually determined from the ground data.
A number of extraneous areas, predominantly agricultural fields and river floodplains, were identified when detecting burnt areas in one of the three satellite swaths. To improve the quality of the detection, samples of burnt areas were added based on available ground data. A further four classes obtained by interactive supervised techniques were added to the previously obtained unsupervised classification, for a total of 54 classes. The assignment of fire/non-fire values to these classes was carried out by visual expert analysis using the available ground data.
Peat fires identified using Terra/Aqua MODIS hotspots were compared with burnt areas identified by changes in spectral characteristics before (2010) and after the fire (2011) using Landsat-5 TM data, from which we obtained a new set of Terra/Aqua MODIS peatland fire areas, confirmed by the peatland burnt areas identified by Landsat-5 TM data. A comparison of the number and area of peatland fires and all natural fires in general was made both for the whole warm period of 2010 (March–October) and for the period July-September, when catastrophic fires occurred.
Peatland fires and other wildfires were compared in terms of their burning duration (days), average and maximum temperature (K), and average and maximum fire radiation power (Megawatt, MW). Fire characteristics were compared for both March-October and for the period starting from July.
Multispectral data were analyzed using Erdas Imagine software (Erdas Inc., Norcross, GA, USA) and ScanEx Image Processor software (R&D Center ScanEx, Moscow, Russia), GIS analysis was performed using the software package MapInfo (Precisely, Pearl River, NY, USA) and ArcGis (ESRI, Redlands, CA, USA), and data processing and visualization were carried out in Excel and Statistica (TIBCO Software Inc., Palo Alto, CA, USA).

3. Results

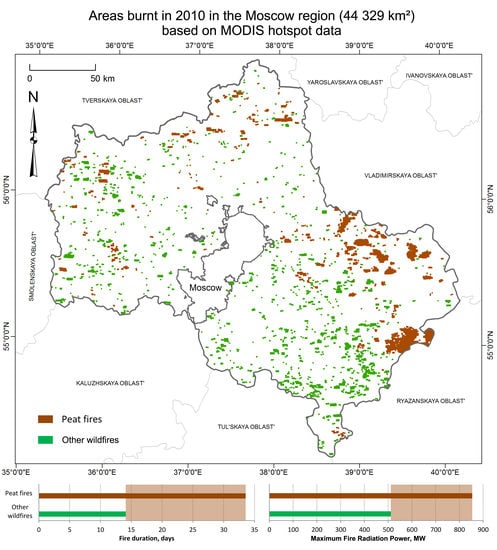
3.1. Identification of Peat Fires from Terra/Aqua MODIS Data and Peatland Map

According to the Terra/Aqua MODIS hotspots, 999 wildfires were identified in the Moscow region in 2010. By overlaying the wildfire data on the peatland map, we determined that 241 fires affected peatlands. The quantity of wildfires (and those touching peatlands) was distributed by month as follows: March—1 (0), April—777 (150), May—50 (14), June—11 (4), July—105 (44), August—50 (28), September—3 (1), and October—2 (0). The temporal dynamics reflected a characteristic peak in spring when wildfires occur due to grass fires. In peatlands, such fires can occur on abandoned drained land, where there is usually a great deal of dried past-year grass, which becomes very fire prone in dry and windy spring weather. However, in spring, the peat is usually very wet as a result of snowmelt. Therefore, spring fires rarely penetrate into the soil and do not turn into underground fires, instead limiting their spread to dry vegetation.
According to the Terra/Aqua MODIS hotspot, out of the 241 fires that affected peatlands, 165 fires had an area of up to 100 ha, 64 fires had an area of 100–1000 ha, 11 fires had an area of 1000–10,000 ha, and one fire had an area greater than 100,000 ha. In total, the fires, affected by the hotspots of Terra/Aqua MODIS peatlands, amounted to an area of more than 180 thousand ha—more than 70% of the area of all wildfires in 2010 in the Moscow region (more than 250 thousand ha). When considering the period following July, the total area of fires detected by Terra/Aqua MODIS hotspots and affecting peatlands amounted to more than 155 thousand ha. After spatially intersecting with the peatland boundaries, the total area of peatland fires amounted to 40,557 ha.

3.2. Applicability of Different Indices for Mapping Burnt Peatlands from Landsat-5 TM Data

Table 2 outlines the results of testing the various indices, both for the post-fire period and with respect to the difference between the pre-fire period and the year following the fire for 2 Landsat-5 TM swaths (1 July 2010 and 2 June 2011). The thresholds established in this work are given together with the accuracy of identifying burnt areas from peatland fires, as assessed by ground-truthing.
The NDMI index showed the best results in identifying burnt peatlands by comparing the vegetation cover before the fire with that during the year after the fire (ΔIndex). The satellite data used in the NIR (0.75–0.90 μm) and SWIR1 (1.55–1.75 μm) bands was optimal.
Somewhat less accurate over the post-fire period and close to NDMI in difference was the NBR fire index using a pair of spectral bands NIR (0.75–0.90 μm) and SWIR2 (2.08–2.35 μm). Less accurate was the fire index NBR2, using the spectral band pair SWIR1 (1.55–1.75 μm) and SWIR2 (2.08–2.35 μm).
The NDVI index performed even worse—not using SWIR bands, but only when using RED (0.63–0.69 μm) and NIR (0.75–0.90 μm). These spectral bands are widely used for mapping burnt areas, assessing vegetation cover damage, and monitoring vegetation recovery. The MIRBI and BAI were the lowest performing indices. These indices were developed to detect fresh burnt areas immediately after a past fire and provided less accurate detection results one year after the fire.

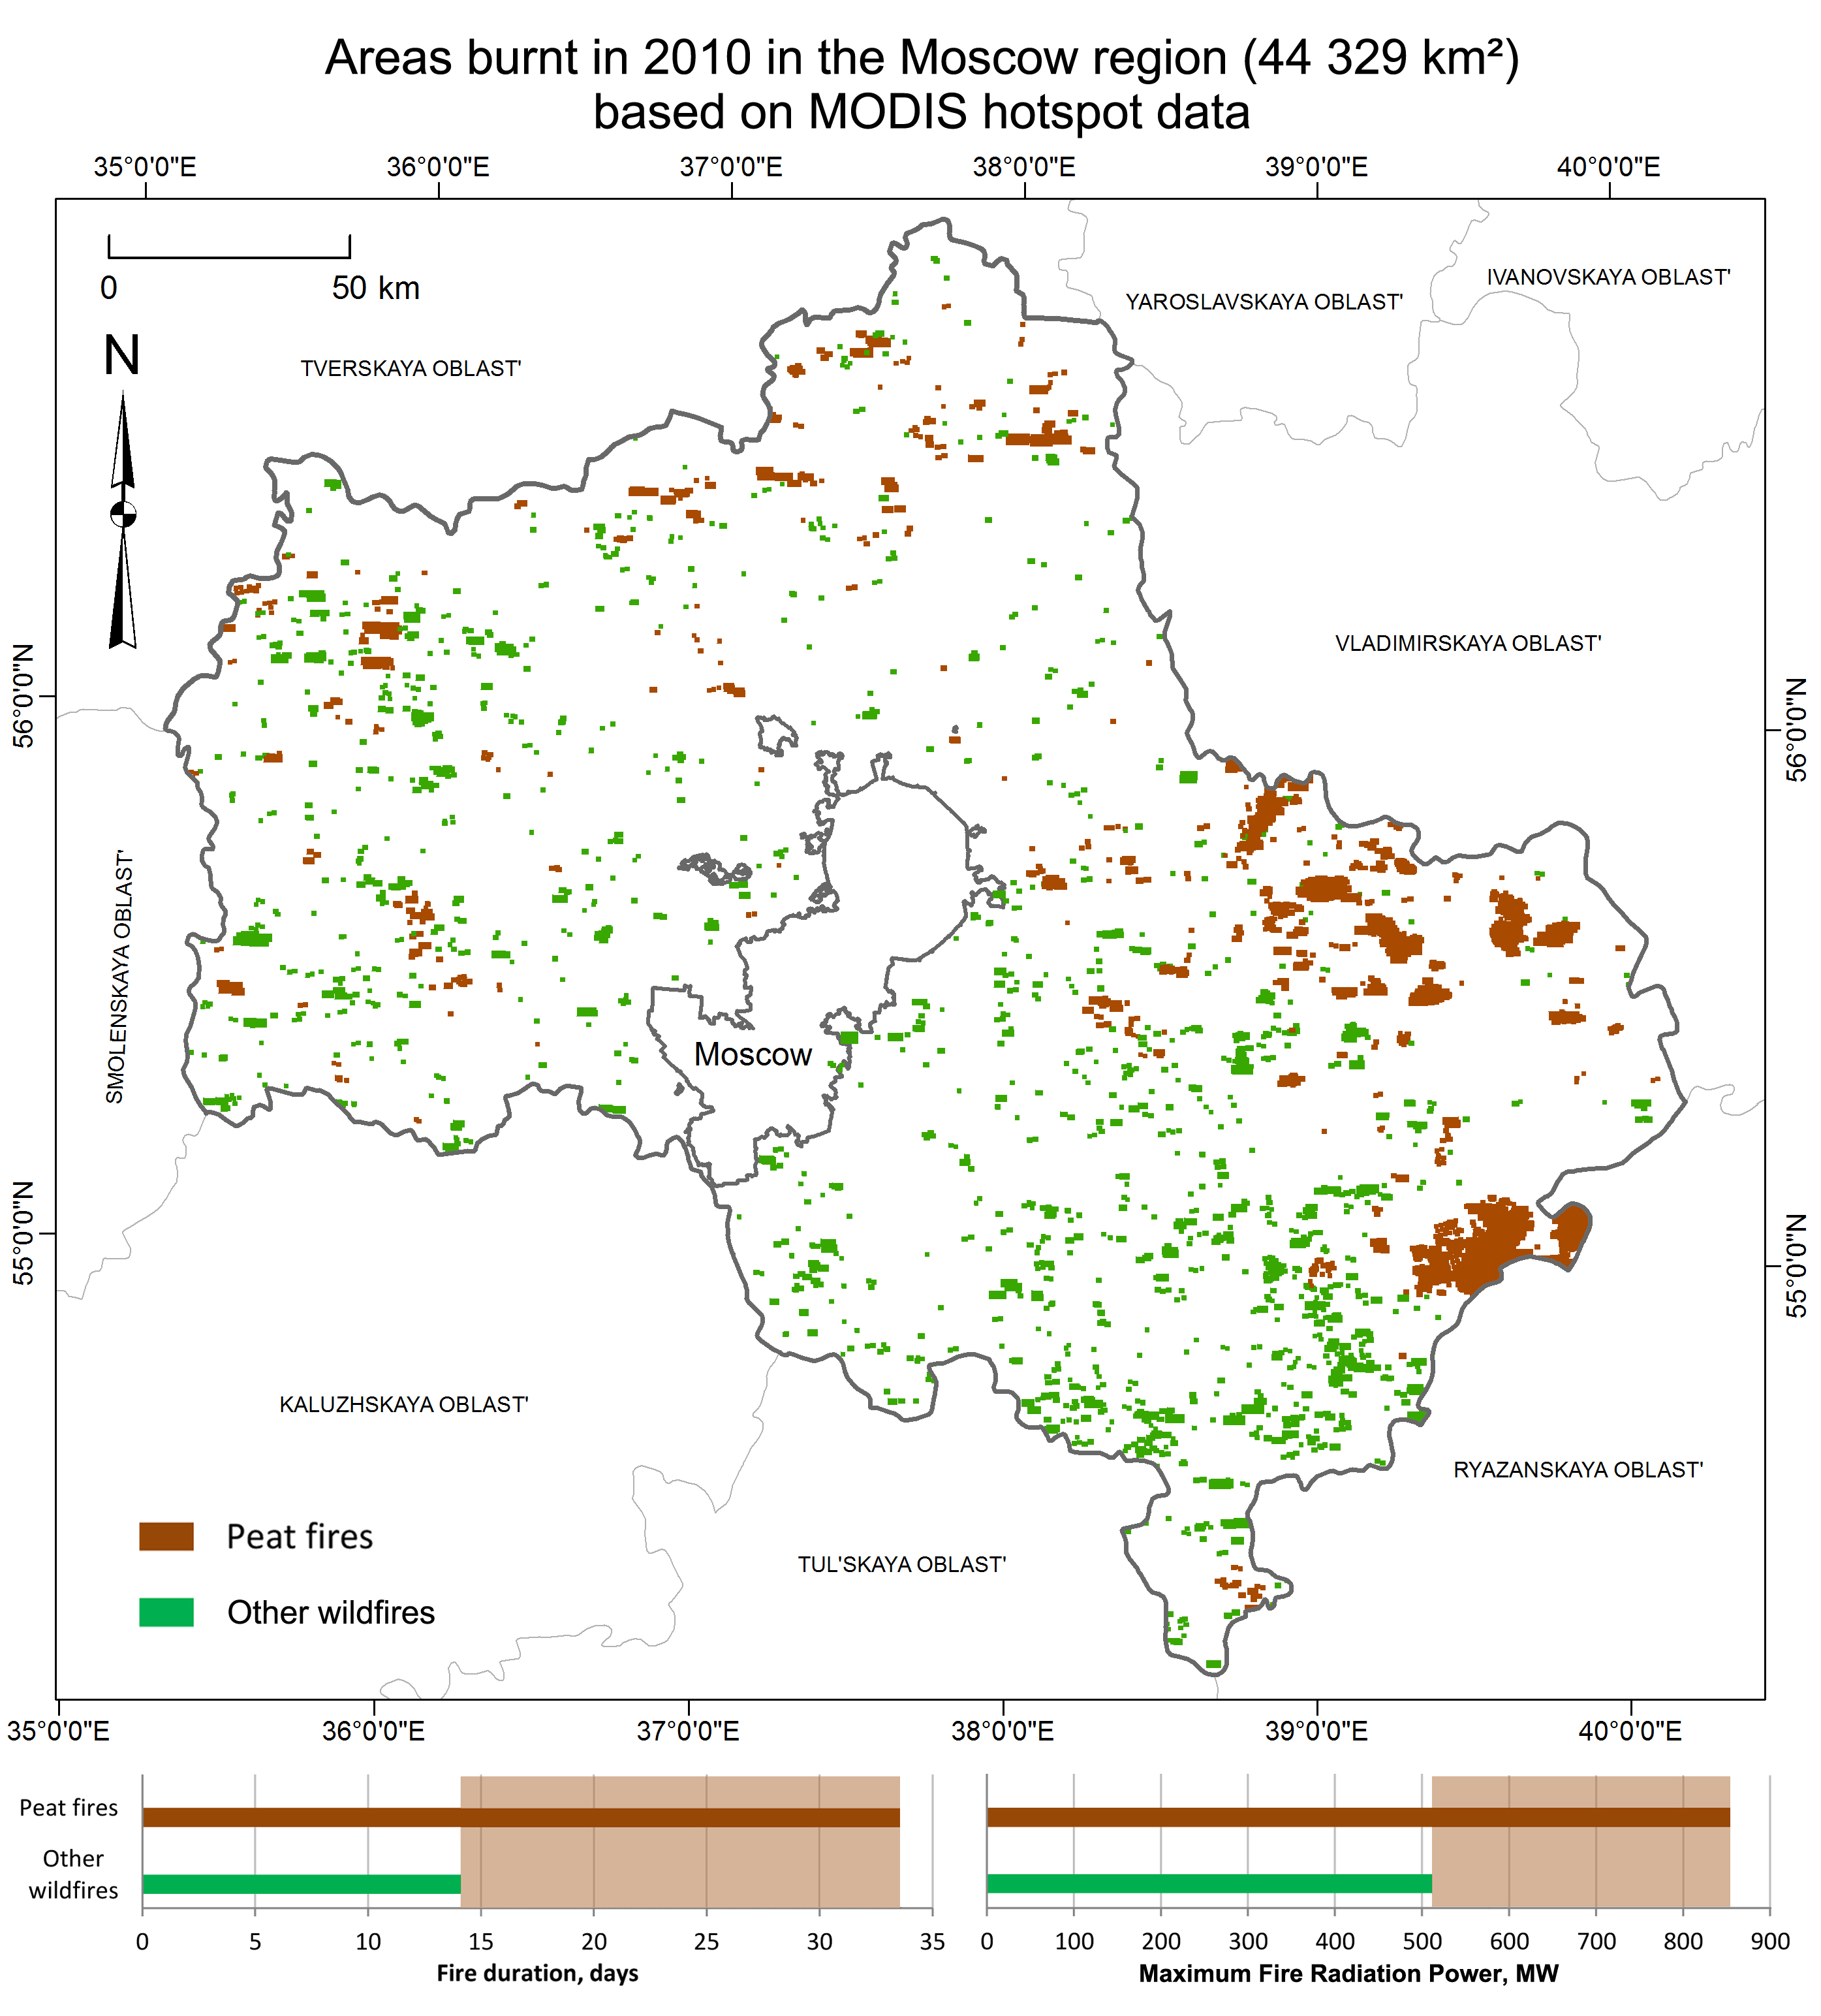
3.3. Mapping of Peatland Burnt Areas by Changes in Spectral Characteristics before and after Fires

The NDMI index difference (ΔNDMI), which showed the highest accuracy (93%) in detecting burnt areas (Table 2), was used to map the 2010 burnt areas of the Moscow Region. The difference ΔNDMI = NDMI2010–NDMI2011 was calculated for each of the three swaths of 2011. The applicability of the previously found ΔNDMI > 0.23 threshold for haze detection was then analyzed for all swaths based on the ground-truth and satellite-refined haze contours.
A very large number of noise areas were observed when burnt land was detected, the area of which did not exceed 8 Landsat-5 TM pixels (0.72 ha). Thus, the minimum reliably detectable size of burnt areas was determined to be at least 9 Landsat-5 TM pixels (0.81 ha).
The accuracy of the identified burnt areas in the peatlands of the Moscow region was estimated from 598 ground points (Table 3). An error matrix [59] with cross-tabulation was used to establish correspondences between values of the same classes obtained from remotely sensed data and data on the ground (Table 3). The main diagonal of the matrix, where the classes coincide (correct classification), is marked in grey, while those outside the diagonal reflect classification errors [60]. The sum of the values of the diagonal elements (grey) shows the total number of correctly classified sites, and the ratio of this number to the total number of sites is considered to be the overall classification accuracy, expressed in percentages. The producer’s accuracy (earth observation data reliability) is the conditional probability of a classification match, assuming ground truth data, obtained by dividing the diagonal matrix element by the total number of class elements identified from the ground data. The user accuracy (ground data reliability) is a similar probability calculated under the assumption of EO (earth observation) data reliability.
A check showed that in 328 cases out of 354 (92.7% accuracy), burnt sites identified by Landsat-5 TM data were confirmed by ground data. The accuracy was even higher (98.4%) for "unburnt" sites, with 240 points out of 244. In general, the accuracy of detecting burnt areas in Moscow region peatlands, according to the ground control, was almost 95%. This value indicates in how many points out of 598 the location or absence of burnt areas identified by remote sensing data was confirmed by ground verification.

3.4. Estimated Burnt Area in Peatlands in the Moscow Region According to Landsat-5 TM Data

According to the Landsat-5 TM data, the total area burnt by fires in 2010 in the peatlands of the Moscow Region amounted to 19.8 thousand ha. Most of the detected burnt areas were in the eastern and, to a lesser extent, northern sectors of the region (Figure 4). The percentage of burnt areas smaller than 1 ha was 21%; 1–9 ha, 66%; 10–99 ha, 11%; and 100–999 ha, 2%; 0.1% consisted of two burnt areas of 1.6 and 4.6 thousand ha (Figure 5a). Fires of less than 1 ha represented 2%, 1–9 ha represented 14%, 10–99 ha represented 23%, and 100–999 ha represented 30% of the total area; two fires of 1.6 ha and 4.6 thousand ha represented 31% of the total area (Figure 5b).
In the peatlands that were rewetted under the Moscow Region Peat Fire Prevention Program in 2010–2013 [12], 460 burnt areas with a total area of 9261 ha were identified, which is 31% of the total number (1438) and 47% of the total area (19.8 thousand ha) of peatlands burnt by the catastrophic fires during the second half of summer 2010 in the central region of European Russia.

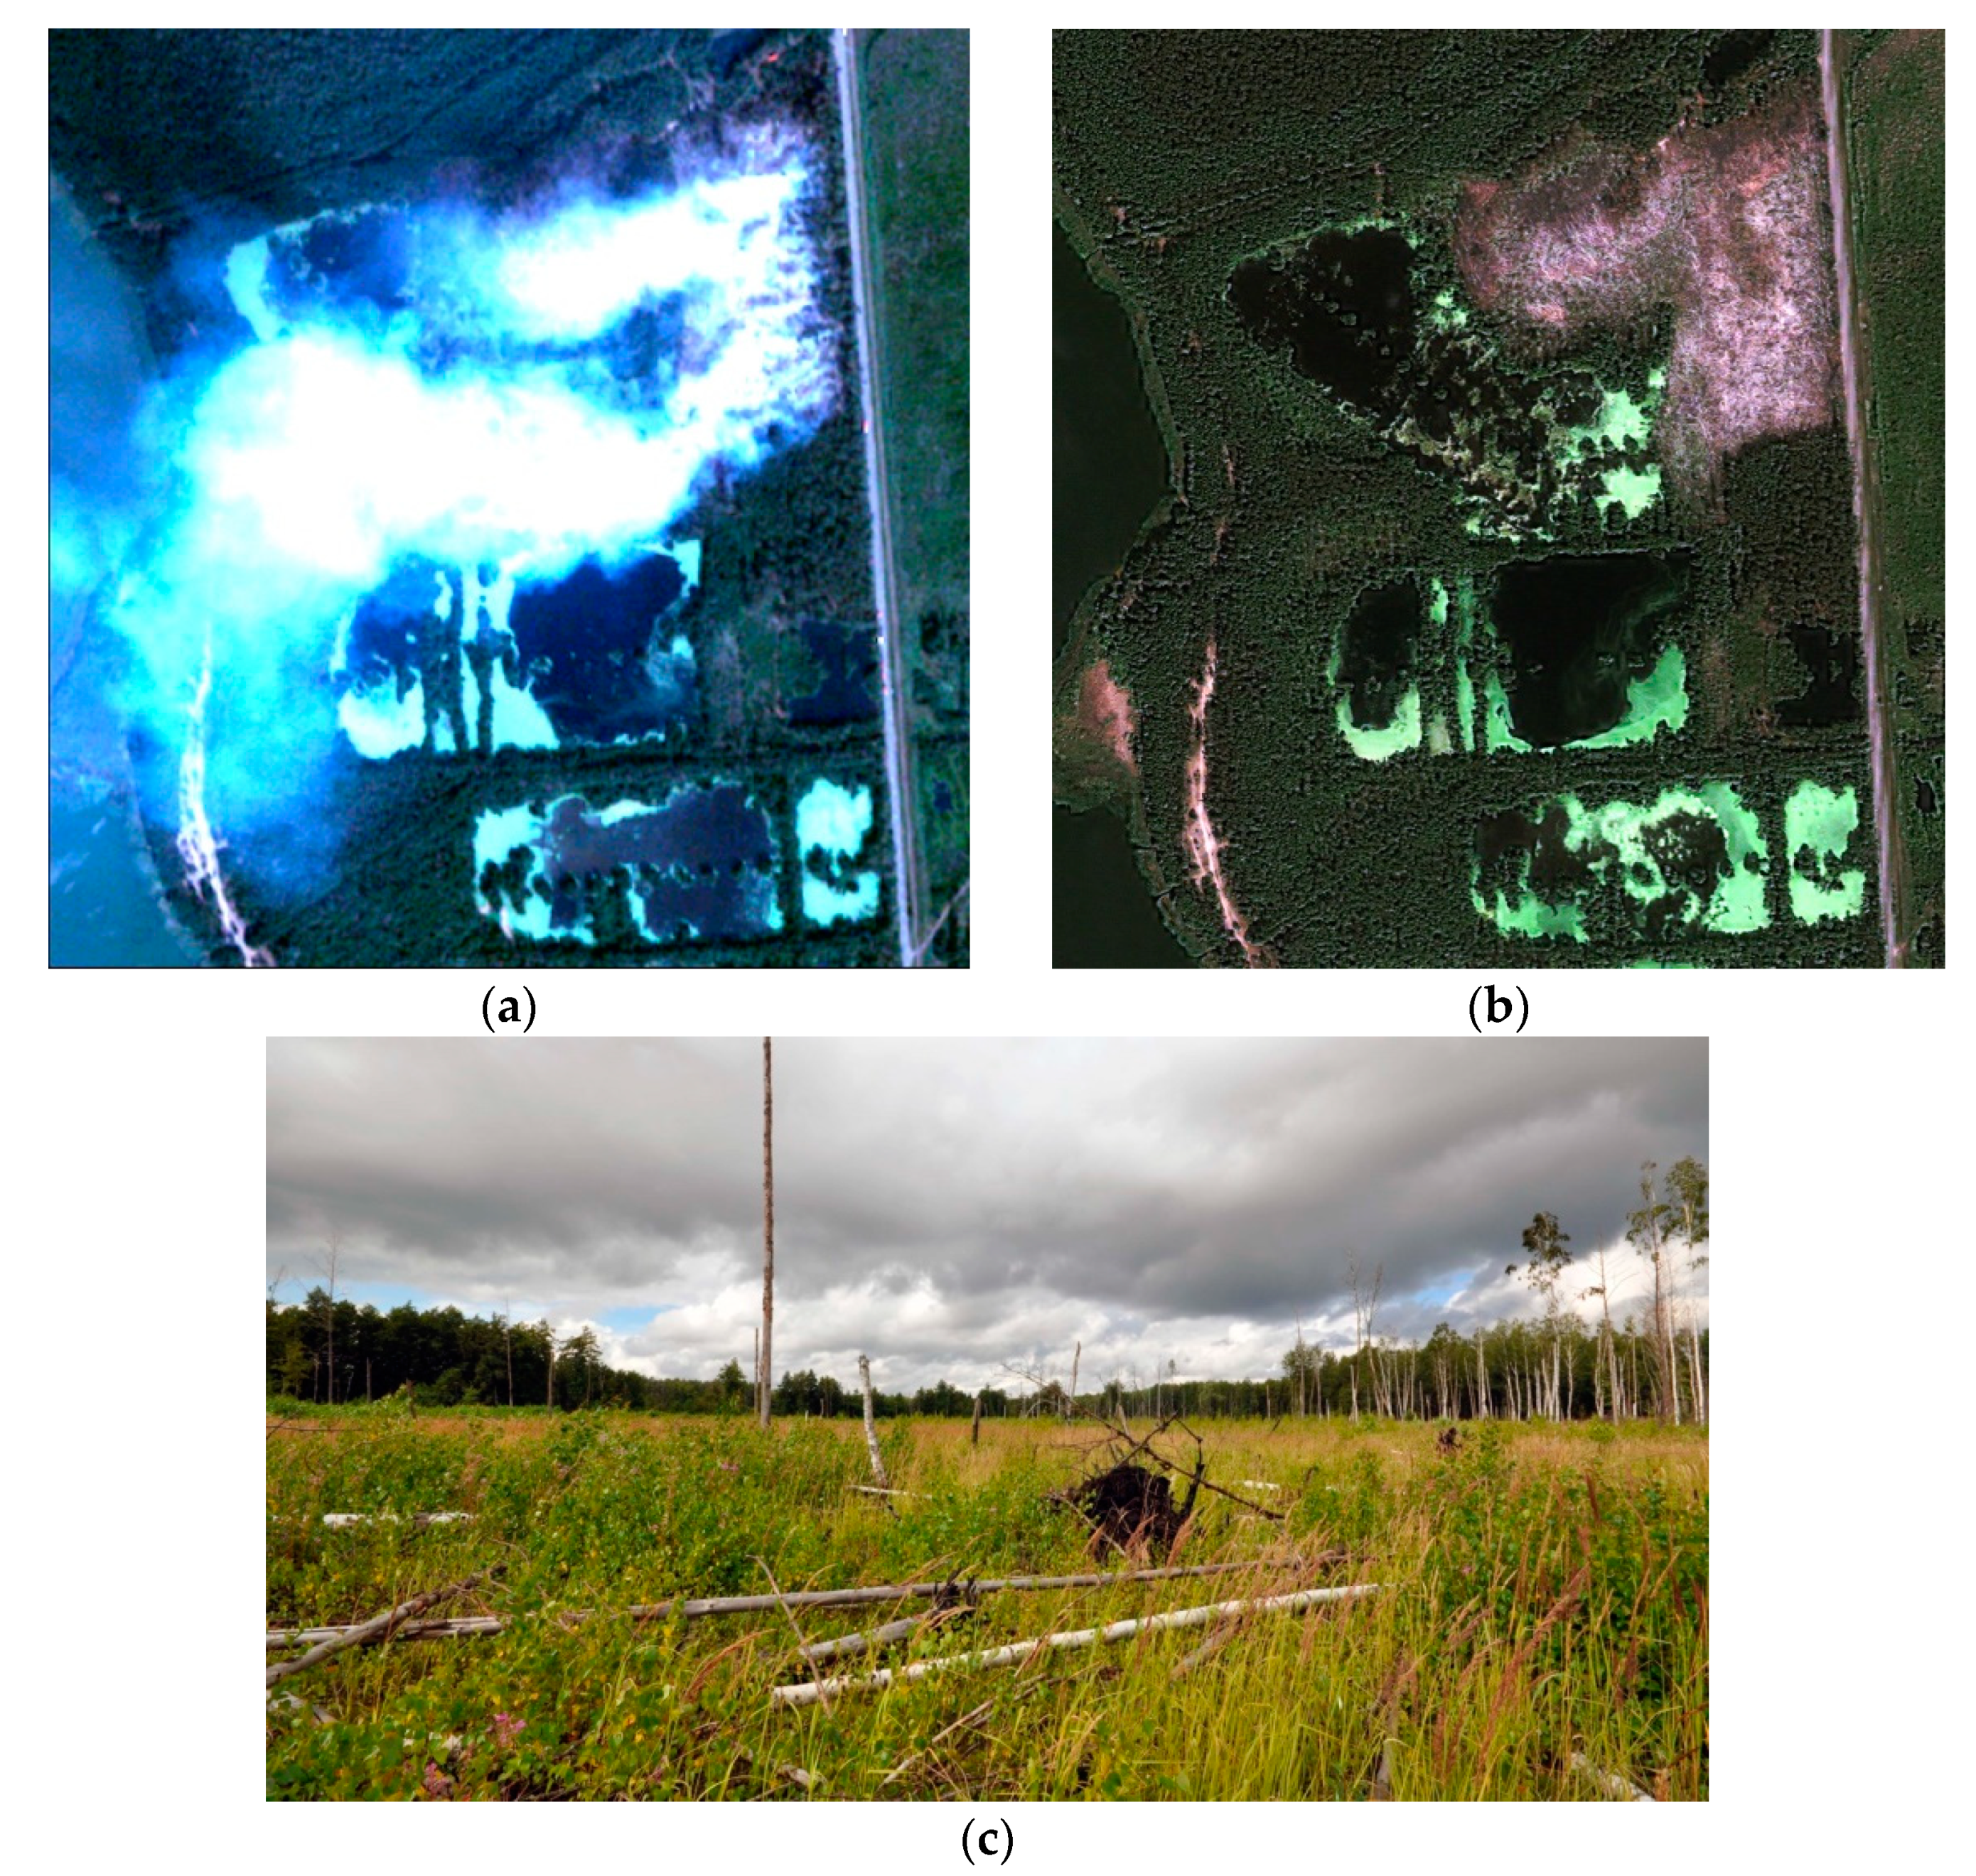
3.5. Characteristics of Peat and Other Wildfires

Characteristics of peat and other wildfires were obtained as follows: duration (days), average and maximum temperature (K), and average and maximum value of fire radiation power (Megawatt, MW). The results were represented by two data sets: fires for the whole fire-hazardous period of 2010 (March–October) detected by Terra/Aqua MODIS hotspots; fires for the period starting from July and related to burnt areas in peatlands detected by Landsat-5 TM data. Comparison of the average and maximum values of temperature and fire radiation power showed a large differentiation of fires based on the maximum values of these characteristics (Figure 6), which were then to further compare peat and other wildfires.
The distribution patterns of duration, maximum temperature (MaxT), and maximum fire radiation power (MaxFPR) for peat and other wildfires is shown in Figure 7, and their statistical values are summarized in Table 4. Figure 7a,b, as well as the rows of Table 4 without gray, show the data obtained for all fires in 2010. Figure 7c and the rows of Table 4, highlighted in grey, show data obtained for fires from July 2010, corresponding to burns identified using Landsat-5 TM data.
Despite the difference in the two data sets used, the pattern of distribution of characteristics (Figure 7) and statistical values (Table 4) were generally observed to be consistent. Compared to other wildfires, peatland fires are characterized by a longer duration, higher temperatures, and greater fire radiation power. For arithmetic averages and median values, these differences are not always obvious. However, for the maximum values of duration, temperature, and FRP, the differences between peatland fires and other wildfires were apparent.
The maximum duration of peat fires (33.67 days) was significantly higher than that of other wildfires (14.01 days). The average duration values of 1.83 and 0.51 days, respectively, were also higher. This was observed for all fires in 2010 identified by Terra/Aqua MODIS data. For fires since July 2010, identified from Landsat-5 TM data, the maximum duration values were almost the same (33.7 days), and the average values were higher (3.6 days).
Notable differences between peat fires and other wildfires also showed maximum FRP values, with maximum (854.5 and 511.5 MW), average (38.5 and 19.75 MW), and median (17.5 and 11.3 MW) values. The values of this characteristic for the fires identified using Landsat-5 TM data confirmed these conclusions, and the mean maximum FRP values were almost three times higher than those all the fires in 2010.
In contrast to the fire duration and the fire radiation power, the maximum temperature values showed no clear differences between peat fires and other wildfires, although at a small level, peat fires still presented higher values for this characteristic.

3.6. Comparison of Peatland Fire Detection Results from Different Data

The use of the NDMI pre-fire–post-fire difference index (ΔNDMI) featuring combined unsupervised and supervised classification made it possible to identify burnt areas in 2010 in the peatlands of the Moscow region with an accuracy of almost 95%. At the same time, out of 1438 burnt areas, 899 (63%) did not coincide with hotspots provided by CCU “IKI-Monitoring” [41] and obtained from Terra/Aqua MODIS data at a spatial resolution of 1 km [32]. The results showed that small fires were undercounted. The additional 899 burnt areas identified by Landsat-5 TM data amounted to a total of 3400 ha or 17% of the total area of peatland fires.
Notably, the burnt areas identified on peatlands corresponded to the threshold values of duration (>14.1 days) and FRP (>512 MW), which can separate peat fires from other wildfires. Out of the 1438 burnt areas in peatlands detected using Landsat-5 TM data, 222 burnt areas with a total area of 12.15 thousand ha featured a duration over 14.1 days and an FRP over 512 MW, encompassing 62% of all burnt areas. A duration over 14.1 days either FRP over 512 MW observed for 380 burnt areas with an area of 14.17 thousand ha, encompassing 72% of all burnt areas in peatlands.

4. Discussion and Conclusions

The results of this study show that the analysis of thermal anomalies from Terra/Aqua MODIS hotspot data is not sufficiently informative to detect peat fires. The omissions were mainly small fires, which formed smaller burnt areas. The small areas were established by analyzing the land cover before and after the fire using Landsat-5 TM data. Despite additional spatial refinement procedures [42], Terra/Aqua MODIS data with an initial spatial resolution of 1 km did not account for the spread of small fires. This result agrees with similar comparisons in a previous study, according to which about half of the fires were not reflected in thermal anomalies [35]. At the same time, for larger fires, estimates of the integral area (e.g., forest fires) based on active fire detection can achieve relative errors of less than 10% [61].
By their nature [3,4,5,6], peat fires are characterized by a longer duration, as confirmed by our analysis of this parameter. By combining individual hotspots of time into a single fire hotspot [42] the probability of fire fixation should, in principle, increase. However, small fires were not particularly long-lasting. Moreover, ground fires may not always burrow into the peat, thereby transforming a ground fire into an underground (peat) fire and, accordingly, increasing its duration with reference to space.
Due to the better spatial resolution of Landsat sensors, analyzing land-cover changes according to Landsat-5 TM data before and after a fire allows one to detect larger (judging by ground-based data verification) parts of fires in peatlands. In our work, Landsat-5 TM data were used. However, to solve this task, it is also possible to use images from sensors with similar bands (e.g., Landsat sensors with subsequent modifications (Landsat-7 ETM+, Landsat-8 OLI), starting from 2015 Sentinel-2 MSI and commercial satellites with higher resolution, if available). The use of imagery from other types of aircraft, including UAVs, could be considered if such aircraft provide data with the necessary spectral characteristics of land cover before and after a fire.
The applicability of six vegetation indices, both general ones (NDVI and NDMI) and those specific to detecting burnt areas (NBR, NBR2, MIRBI, and BAI), was tested to identify burnt areas based on changes in land cover before and after a fire. The best accuracy (93 and 92%) was shown by the Normalized Difference Moisture Index (NDMI) [48] and Normalized Burn Ratio (NBR) [49]. This confirmed the earlier conclusion that these indices are best performers for the detection of burn scars [62]. The Normalized Burn Ratio 2 (NBR2) [49] and Normalized Difference Vegetation Index (NDVI) [47] showed slightly worse accuracy with 87 and 86% respectively. However, only one index, the commonly used NDVI, did not require SWIR bands, which extended the hardware capabilities of acquiring this index. As indicated by the analysis of fire-prone peatlands [12,37,38,63,64], the availability of SWIR bands is critical for solving these problems.
The results show that using the difference between the index values before a fire and the following year after a fire can provide better accuracy than using the index value only for the post-fire period. This was the case for all indices considered in this paper, including the most effective ones (NDMI, NBR). Over the course of this work, the threshold values for all indices tested were adjusted and defined for burns in peatlands. In particular, ranges of values for the post-fire period (−0.25–0.03 and −0.3–0.3) and the threshold for pre-fire and post-fire differences (>0.23 and >0.3) were proposed for the best performing NDMI and NBR indices. The values of these indices differed markedly from the values obtained for NDMI [58] and ΔNDMI [55], as well as for NBR [52,53,54] and ΔNBR [49,55] for burnt areas in other land types.
The normalized difference moisture index (NDMI), which showed the highest accuracy, was tested for mapping burnt areas in 2010 in the peatlands of the Moscow region. By applying the before fire–after fire difference (ΔNDMI) with combined classification, both unsupervised and supervised, burnt areas were identified with 95% accuracy according to the ground data. The results obtained show that it was possible to use this approach to map peatland burnt areas if the satellite data with required parameters are available before a fire and in the year following a fire. The latter observation is important. Identifying freshly burnt areas immediately after a fire is likely easier with remote sensing data, but satellite data immediately after a fire are difficult to obtain. The fire season often ends in autumn, coinciding with heavy rainfall and cloud cover, which can affect the quality of the imagery. At the same time, satellite data are more likely to be available for the next vegetation season. As a result, these data can characterize land cover in a phenological state close to the survey period used to characterize the pre-fire period. The accuracy of the NDMI and NBR index differences for the pre-fire and post-fire periods differed by only 1%. Thus, an additional study should be conducted to analyze the accuracy of these two indices in detecting burnt areas in peatlands.
Ground verification and ground mapping provide more reliable information on the contours of burnt peatland areas. However, ground access to burnt areas, especially in the first years after fires, is extremely difficult and unsafe. Difficulties also apply to remote and inaccessible regions. Taking into account shallow peatlands, peat covers more than 1/5 of the territory in Russia [20], and in the boreal zone, bogging can be even higher [22]. Peat soils are also widespread in many remote regions of the northern United States and Canada [65]. To assess the spread of peatland fires and their particular environmental effects, it is often necessary to do so in advance, without the ability to conduct ground-based surveys. In these circumstances, the use of predominantly or exclusively remotely sensed data may be the only option.
The identification of fire burns in peatlands does not mean that such burns definitely originated from peat fires. Not all fires that occur in peatlands are buried in peat soil (i.e., underground peat fires). The depth of burial depends on the groundwater level (GWL) [24] and initial moisture content of the peat. There may be situations where the presence of dry combustible plant material is not indicative of low peat soil moisture. For example, in spring, when the GWL and moisture content of peat is high, a large amount of the previous year’s vegetation remains on the surface; this vegetation quickly reaches high flammability during the dry and windy spring period. A similar situation can also occur in autumn and during the vegetation season, when there is rapid, intense drought.
Fire parameters (duration, temperature, and fire radiative power) can provide additional information on the presence of subsurface (peat) fires. The present analysis showed that the most informative data in this respect are not the average or median values of these parameters but the maximum values, especially the maximum values of fire duration and FRP. The correlation of these indices with fires, as detected for peatlands, showed that a fire duration of more than 14.1 days and a fire radiative power greater than 512 MW indicate fires on peatlands (i.e., underground fires) (Figure 8). This result does not mean that the whole area of a fire, or the resulting burnt area, is necessarily characterized by peat burning, as there may be some areas where peat was not burnt. However, the indicated fire duration and FRP values can serve as indicators for the presence of peat (underground) fires and can be used for wildfires involving underground fires with foci of peat.
The quantitative thresholds of duration and fire radiation power that we found allow (underground) peat fires in the territory in question to be identified at least on a preliminary level by using Terra/Aqua MODIS hotspot data. This information indicates a special type of wildfires, characterized by the emission of hazardous substances for human health. In addition, there are major consequences for vegetation cover, especially tree cover, and carbon losses and greenhouse gas emissions into the atmosphere are associated not only with the burning of biomass, but also with peat soil.

Supplementary Materials

The following are available online at https://www.mdpi.com/article/10.3390/rs14010194/s1. Table S1: Characteristics of satellite data used; S1: MODIS Fire Radiative Power description; Figure S1: Processing chain.

Author Contributions

Conceptualization, A.S. and M.M.; methodology and investigation, M.M. and A.S.; writing—original draft preparation, review and editing, A.S. and M.M.; visualization, M.M.; supervision, project administration and funding acquisition, A.S. All authors have read and agreed to the published version of the manuscript.

Funding

The study was supported by the Russian Science Foundation (project 19-74-20185) and published with support from the project “Restoring peatlands in Russia—for fire prevention and climate change mitigation” financed under the International Climate Initiative (IKI) by the German Federal Ministry for the Environment, Nature Conservation, and Nuclear Safety (BMUB), facilitated through KfW, (project no. 11 III 040 RUS K. Restoring Peatlands).

Institutional Review Board Statement

Not applicable.

Informed Consent Statement

Not applicable.

Data Availability Statement

Not applicable.

Acknowledgments

The authors are grateful to Dmitry Makarov (Institute of Forest Science, Russian Academy of Sciences) for the ground survey of peatland burnt areas, to Aleksandr Maslov (the same institute) for providing with high resolution space imagery of the burnt site (Figure 1), to the Center for Collective Use "IKI-Monitoring" of the Institute of Space Research, Russian Academy of Sciences, for the data provided and personally to Ivan Balashov for their data preparation and to Evgeny Loupian for advice and support.

Conflicts of Interest

The authors declare no conflict of interest.

References

  1. Jia, G.; Shevliakova, E.; Artaxo, P.; De Noblet-Ducoudré, N.; Houghton, R.; House, J.; Kitajima, K.; Lennard, C.; Popp, A.; Sirin, A.; et al. 2019: Land–climate interactions. In Climate Change and Land: An IPCC Special Report on Climate Change, Desertification, Land Degradation, Sustainable Land Management, Food Security, and Greenhouse Gas Fluxes in Terrestrial Ecosystems; Shukla, P.R., Skea, J., Calvo Buendia, E., Masson-Delmotte, V., Pörtner, H.-O., Roberts, D.C., Zhai, P., Slade, R., Connors, S., van Diemen, R., et al., Eds.; 2019; in press. [Google Scholar]
  2. Parish, F.; Sirin, A.; Charman, D.; Joosten, H.; Minayeva, T.; Silvius, M.; Stringer, L. (Eds.) Assessment on Peatlands, Biodiversity and Climate Change: Main Report; Global Environment Centre: Kuala Lumpur, Malaysia; Wetlands International: Wageningen, The Netherlands, 2008; 179p. [Google Scholar]
  3. Rein, G. Smouldering fires and natural fuels. In Fire Phenomena and the Earth System: An Interdisciplinary Guide to Fire Science; Belcher, C.M., Ed.; Wiley: New York, NY, USA, 2013; pp. 15–34. ISBN 9780470657485. [Google Scholar] [CrossRef]
  4. Turetsky, M.R.; Benscoter, B.; Page, S.; Rein, G.; van der Werf, G.R.; Watts, A. Global vulnerability of peatlands to fire and carbon loss. Nat. Geosci. 2015, 8, 11–14. [Google Scholar] [CrossRef]
  5. Hu, Y.; Fernandez-Anez, N.; Smith, T.E.L.; Rein, G. Review of emissions from smouldering peat fires and their contribution to regional haze episodes. Int. J. Wildland Fire 2018, 27, 293–312. [Google Scholar] [CrossRef]
  6. Schulte, M.L.; McLaughlin, D.L.; Wurster, F.C.; Varner, J.M.; Stewart, R.D.; Aust, W.M.; Jones, C.N.; Gile, B. Short- and long-term hydrologic controls on smouldering fire in wetland soils. Int. J. Wildland Fire 2019, 28, 177–186. [Google Scholar] [CrossRef] [Green Version]
  7. IPCC. 2013 Supplement to the 2006 IPCC Guidelines for National Greenhouse Gas Inventories: Wetlands; Hiraishi, T., Krug, T., Tanabe, K., Srivastava, N., Baasansuren, J., Fukuda, M., Troxler, T.G., Eds.; IPCC: Geneva, Switzerland, 2014; 354p, Available online: https://www.ipcc.ch/publication/2013-supplement-to-the-2006-ipcc-guidelines-for-national-greenhouse-gas-inventories-wetlands/ (accessed on 30 October 2021).
  8. Poulter, B.; Christensen, N.L., Jr.; Halpin, P.N. Carbon emissions from a temperate peat fire and its relevance to interannual variability of trace atmospheric greenhouse gases. J. Geophys. Res. Atmos. 2006, 111, D06301:1–D06301:11. [Google Scholar] [CrossRef]
  9. Huang, X.; Rein, G. Downward spread of smouldering peat fire: The role of moisture, density and oxygen supply. Int. J. Wildland Fire 2017, 26, 907–918. [Google Scholar] [CrossRef]
  10. Marlier, M.E.; Liu, T.; Yu, K.; Buonocore, J.J.; Koplitz, S.N.; DeFries, R.S.; Mickley, L.J.; Jacob, D.J.; Schwartz, J.; Wardhana, B.S.; et al. Fires, smoke exposure, and public health: An integrative framework to maximize health benefits from peatland restoration. GeoHealth 2019, 3, 178–189. [Google Scholar] [CrossRef] [PubMed] [Green Version]
  11. Safronov, A.N.; Fokeeva, E.V.; Rakitin, V.S.; Grechko, E.I.; Shumsky, R.A. Severe Wildfires near Moscow, Russia in 2010: Modeling of Carbon Monoxide Pollution and Comparisons with Observations. Remote Sens. 2014, 7, 395–429. [Google Scholar] [CrossRef] [Green Version]
  12. Sirin, A.A.; Medvedeva, M.A.; Makarov, D.A.; Maslov, A.A.; Joosten, H. Multispectral satellite based monitoring of land cover change and associated fire reduction after large-scale peatland rewetting following the 2010 peat fires in Moscow region (Russia). Ecol. Eng. 2020, 158, 106044:1–106044:10. [Google Scholar] [CrossRef]
  13. Barriopedro, D.; Fischer, E.M.; Luterbacher, J.; Trigo, R.M.; García-Herrera, R. The hot summer of 2010: Redrawing the temperature record map of Europe. Science 2011, 332, 220–224. [Google Scholar] [CrossRef] [Green Version]
  14. Konovalov, I.B.; Beekmann, M.; Kuznetsova, I.N.; Yurova, A.; Zvyagintsev, A.M. Atmospheric impacts of the 2010 Russian wildfires: Integrating modelling and measurements of an extreme air pollution episode in the Moscow region. Atmos. Chem. Phys. 2011, 11, 10031–10056. [Google Scholar] [CrossRef] [Green Version]
  15. Shaposhnikov, D.; Revich, B.; Bellander, T.; Bedada, G.B.; Bottai, M.; Kharkova, T.; Kvasha, E.; Lind, T.; Pershagen, G. Long-Term Impact of Moscow Heat Wave and Wildfires on Mortality. Epidemiology 2015, 26, 21–22. [Google Scholar] [CrossRef]
  16. Rossi, S.; Tubiello, F.N.; Prosperi, P.; Salvatore, M.; Jacobs, H.; Biancalani, R.; House, J.I.; Boschetti, L. FAOSTAT estimates of greenhouse gas emissions from biomass and peat fires. Clim. Chang. 2016, 135, 699–711. [Google Scholar] [CrossRef] [Green Version]
  17. Page, S.E.; Rieley, J.O.; Banks, C.J. Global and regional importance of the tropical peatland carbon pool. Glob. Chang. Biol. 2011, 17, 798–818. [Google Scholar] [CrossRef] [Green Version]
  18. Page, S.E.; Siegert, F.; Rieley, J.O.; Boehm, H.-D.V.; Jaya, A.; Limin, S. The amount of carbon released from peat and forest fires in Indonesia during 1997. Nature 2002, 420, 61–65. [Google Scholar] [CrossRef]
  19. Minayeva, T.; Sirin, A.; Stracher, G.B. The Peat Fires of Russia. In Coal and Peat Fires: A Global Perspective. V.2: Photographs and Multimedia Tours; Stracher, G.B., Prakash, A., Sokol, E.V., Eds.; Elsevier: Amsterdam, The Netherlands, 2013; pp. 375–394. ISBN 9780444594129. [Google Scholar]
  20. Vompersky, S.E.; Ivanov, A.I.; Tsyganova, O.P.; Valyaeva, N.A.; Dubinin, A.I.; Glukhov, A.I.; Markelova, L.G. Bog organic soils and bogs of Russia and carbon pool of their peats. Eurasian Soil Sci. 1996, 28, 91–105. [Google Scholar]
  21. Tanneberger, F.; Tegetmeyer, C.; Busse, S.; Barthelmes, A.; Shumka, S.; Mariné, A.M.; Jenderedjian, K.; Steiner, G.M.; Essl, F.; Etzold, J.; et al. The peatland map of Europe. Mires Peat 2017, 19, 22:1–22:17. [Google Scholar] [CrossRef]
  22. Vompersky, S.E.; Sirin, A.A.; Sal’nikov, A.A.; Tsyganova, O.P.; Valyaeva, N.A. Estimation of forest cover extent over peatlands and paludified shallow-peat lands in Russia. Contemp. Probl. Ecol. 2011, 4, 734–741. [Google Scholar] [CrossRef]
  23. Vomperskii, S.E.; Glukhova, T.V.; Smagina, M.V.; Kovalev, A.G. Conditions and consequences of wildfires in pine forests on the drained mires. Russ. J. For. Sci. 2007, 6, 35–44. (In Russian) [Google Scholar]
  24. Glukhova, T.V.; Sirin, A.A. Losses of soil carbon upon a fire on a drained forested raised bog. Eurasian Soil Sci. 2018, 51, 542–549. [Google Scholar] [CrossRef]
  25. Joosten, H.; Sirin, A.; Couwenberg, J.; Laine, J.; Smith, P. The role of peatlands in climate regulation. In Peatland Restoration and Ecosystem Services: Science, Policy and Practice; Bonn, A., Joosten, H., Evans, M., Stoneman, R., Allott, T., Eds.; Ecological Reviews; Cambridge University Press: Cambridge, UK, 2016; pp. 63–76. [Google Scholar] [CrossRef]
  26. Sirin, A.; Minayeva, T.; Vozbrannaya, A.; Bartalev, S. How to avoid peat fires? Sci. Russ. 2011, 2, 13–21. [Google Scholar]
  27. Sirin, A.; Maslov, A.; Makarov, D.; Gulbe, Y.; Joosten, H. Assessing Wood and Soil Carbon Losses from a Forest-Peat Fire in the Boreo-Nemoral Zone. Forests 2021, 12, 880. [Google Scholar] [CrossRef]
  28. Blain, D.; Row, C.; Alm, J.; Byrne, K.; Parish, F.; Duchemin, É.; Huttunen, J.T.; Tremblay, A.; Delmas, R.; Menezes, C.F.S.; et al. Agriculture, forestry and other land use. Volume 4. Chapter 7. Wetlands. In 2006 IPCC Guidelines for National Greenhouse Gas Inventories; Eggleston, H.S., Buendia, L., Miwa, K., Ngara, T., Tanabe, K., Eds.; IGES: Hayama, Japan, 2006; 24p, Available online: https://www.ipcc.ch/report/2006-ipcc-guidelines-for-national-greenhouse-gas-inventories/ (accessed on 30 October 2021).
  29. IPCC. 2019 Refinement to the 2006 IPCC Guidelines for National Greenhouse Gas Inventories; Calvo Buendia, E., Tanabe, K., Kranjc, A., Baasansuren, J., Fukuda, M., Ngarize, S., Osako, A., Pyrozhenko, Y., Shermanau, P., Federici, S., Eds.; IPCC: Geneva, Switzerland, 2019; Available online: https://www.ipcc.ch/report/2019-refinement-to-the-2006-ipcc-guidelines-for-national-greenhouse-gas-inventories/ (accessed on 30 October 2021).
  30. Burke, C.; Wich, S.; Kusin, K.; McAree, O.; Harrison, M.E.; Ripoll, B.; Ermiasi, Y.; Mulero-Pázmány, M.; Longmore, S. Thermal-Drones as a Safe and Reliable Method for Detecting Subterranean Peat Fires. Drones 2019, 3, 23. [Google Scholar] [CrossRef] [Green Version]
  31. Long, T.; Zhang, Z.; He, G.; Jiao, W.; Tang, C.; Wu, B.; Zhang, X.; Wang, G.; Yin, R. 30 m Resolution Global Annual Burned Area Mapping Based on Landsat Images and Google Earth Engine. Remote Sens. 2019, 11, 489. [Google Scholar] [CrossRef] [Green Version]
  32. Bartalev, S.A.; Egorov, V.A.; Efremov, V.Y.; Loupian, E.A.; Stytsenko, F.V.; Flitman, E.V. Integrated burnt area assessment based on combine use of multi-resolution MODIS and Landsat-TM/ETM+ satellite data. Sovrem. Probl. Distantsionnogo Zondirovaniya Zemli Iz Kosm. 2012, 9, 9–27. (In Russian) [Google Scholar]
  33. Myachina, K.V.; Pavleichik, V.M. Opyt analiza garei v stepnykh raionakh yuzhnogo Predural’ya na osnove izobrazhenii sputnika Landsat (Experience in the analysis of burns in the steppes of the southern Urals based on Landsat satellite images). Izv. Orenb. Otd. Rus. Geogr. Obs. 2017, 9, 45–52. (In Russian) [Google Scholar]
  34. Shikhov, A.N.; Zaripov, A.S. Mnogoletnyaya dinamika poter’ lesov ot pozharov i vetrovalov na severo-vostoke evropeiskoi Rossii po sputnikovym dannym (Long-term dynamics of fireand wind-related forest losses in northeast European Russia from satellite data). Sovrem. Probl. Distantsionnogo Zondirovaniya Zemli Iz Kosm. 2018, 15, 114–128. (In Russian) [Google Scholar] [CrossRef]
  35. Shinkarenko, S.S. Pozharnyi rezhim landshaftov severnogo Prikaspiya po dannym ochagov aktivnogo goreniya (Fire regime of North Caspian landscapes according to the data of active burning centers). Sovrem. Probl. Distantsionnogo Zondirovaniya Zemli Iz Kosm. 2019, 16, 121–133. (In Russian) [Google Scholar] [CrossRef]
  36. Alonso-Cana, I.; Chuvieco, E. Global burned area mapping from ENVISAT-MERIS and MODIS active fire data. Remote Sens. Environ. 2015, 163, 140–152. [Google Scholar] [CrossRef]
  37. Medvedeva, M.A.; Vozbrannaya, A.E.; Sirin, A.A.; Maslov, A.A. Capabilities of Multispectral Remote-Sensing Data in an Assessment of the Status of Abandoned Fire Hazardous and Rewetting Peat Extraction Lands. Izv. Atmos. Ocean. Phys. 2017, 53, 1070–1078. [Google Scholar] [CrossRef]
  38. Sirin, A.; Medvedeva, M.; Maslov, A.; Vozbrannaya, A. Assessing the Land and Vegetation Cover of Abandoned Fire Hazardous and Rewetted Peatlands: Comparing Different Multispectral Satellite Data. Land 2018, 7, 71. [Google Scholar] [CrossRef] [Green Version]
  39. Sirin, A.A.; Maslov, A.A.; Valyaeva, T.A.; Tsyganova, O.P.; Glukhova, T.V. Mapping of Peatlands in the Moscow Oblast Based on High Resolution Remote Sensing Data. Contemp. Probl. Ecol. 2014, 79, 809–815. [Google Scholar] [CrossRef]
  40. Sirin, A.; Minayeva, T.; Yurkovskaya, T.; Kuznetsov, O.; Smagin, V.; Fedotov, Y.U. Russian Federation (European Part). In Mires and Peatlands of Europe: Status, Distribution and Conservation; Joosten, H., Tanneberger, F., Moen, A., Eds.; Schweizerbart Science Publishers: Stuttgart, Germany, 2017; pp. 589–616. [Google Scholar] [CrossRef]
  41. Loupian, E.A.; Proshin, A.A.; Bourtsev, M.A.; Kashnitskii, A.V.; Balashov, I.V.; Bartalev, S.A.; Konstantinova, A.M.; Kobets, D.A.; Mazurov, A.A.; Marchenkov, V.V.; et al. Opyt ekspluatatsii i razvitiya tsentra kollektivnogo pol’zovaniya sistemami arkhivatsii, obrabotki i analiza sputnikovykh dannykh (CKP “IKI-Monitoring”) (Experience of development and operation of the IKI-Monitoring center for collective use of systems for archiving, processing and analyzing satellite data). Sovrem. Probl. Distantsionnogo Zondirovaniya Zemli Iz Kosm. 2019, 16, 151–170. (In Russian) [Google Scholar] [CrossRef]
  42. Bartalev, S.A.; Egorov, V.A.; Efremov, V.Y.; Flitman, E.V.; Loupian, E.A.; Stytsenko, F.V. Assessment of Burned Forest Areas over the Russian Federation from MODIS and Landsat-TM/ETM+ Imagery. In Global Forest Monitoring from Earth Observation; Achard, F., Hansen, M.C., Eds.; CRC Press, Taylor & Francis Group: Boca Raton, FL, USA, 2013; pp. 259–286. [Google Scholar]
  43. Freeborn, P.H.; Wooster, M.J.; Roy, D.P.; Cochrane, M.A. Quantification of MODIS fire radiative power (FRP) measurement uncertainty for use in satellite-based active fire characterization and biomass burning estimation. Geophys. Res. Lett. 2014, 41, 1988–1994. [Google Scholar] [CrossRef]
  44. Loupian, E.A.; Balashov, I.V.; Senko, K.S.; Burtsev, M.A.; Stytsenko, F.V.; Mazurov, A.A. Obnovlennyi mnogoletnii ryad dannykh o pozharakh na territorii Rossii po dannym MODIS kollektsii 6 (An updated long-term series of data on fires on the territory of Russia according to MODIS collection 6). In Proceedings of the 18th All-Russian Open Conference “Sovremennye Problemy Distantsionnogo Zondirovaniya Zemli iz Kosmosa”, Moscow, Russia, 10–16 October 2020; Space Research Institute of the Russian Academy of Sciences: Moscow, Russia, 2020; p. 341. (In Russian). [Google Scholar] [CrossRef]
  45. Kaufman, Y.J.; Justice, C.O.; Flynn, L.P.; Kendall, J.D.; Prins, E.M.; Giglio, L.; Ward, D.E.; Menzel, W.P.; Setzer, A.W. Potential global fire monitoring from EOS-MODIS. J. Geophys. Res. 1998, 103, 32215–32238. [Google Scholar] [CrossRef]
  46. Giglio, L.; Descloitres, J.; Justice, C.O.; Kaufman, Y.J. An enhanced contextual fire detection algorithm for MODIS. Remote Sens. Environ. 2003, 87, 273–282. [Google Scholar] [CrossRef]
  47. Rouse, J.W.; Haas, R.H.; Schell, J.A.; Deering, D.W. Monitoring vegetation systems in the Great Plains with ERTS. In Proceedings of the Third ERTS Symposium; Washington, DC, USA, 10–14 December 1973, NASA: Washington, DC, USA, 1973; pp. 309–317. [Google Scholar]
  48. Gao, B. NDWI–A normalized difference water index for remote sensing of vegetation liquid water from space. Remote Sens. Environ. 1996, 58, 257–266. [Google Scholar] [CrossRef]
  49. Key, C.H.; Benson, N.C. The Normalized Burn Ratio (NBR): A Landsat TM Radiometric Measure of Burn Severity; United States Geological Survey, Northern Rocky Mountain Science Center: Bozeman, MT, USA, 1999.
  50. Trigg, S.; Flasse, S. An evaluation of different bispectral spaces for discriminating burned shrub-savannah. Int. J. Remote Sens. 2001, 22, 2641–2647. [Google Scholar] [CrossRef]
  51. Chuvieco, E.; Martin, M.P.; Palacios, A. Assessment of different spectral indices in the red–near-infrared spectral domain for burned land discrimination. Int. J. Remote Sens. 2002, 23, 5103–5110. [Google Scholar] [CrossRef]
  52. Martín, M.; Gómez, I.; Chuvieco, E. Burnt area index (BAIM) for burned area discrimination at regional scaleusing MODIS data. For. Ecol. Manag. 2006, 234, s221. [Google Scholar] [CrossRef]
  53. Boschetti, M.; Stroppiana, D.; Brivio, P.A. Mapping burned areas in a Mediterranean environment using softintegration of spectral indices from high-resolution satellite images. Earth Interact. 2010, 14, 1–20. [Google Scholar] [CrossRef]
  54. Spiridonova, N.S. Primenenie Dannykh Distantsionnogo Zondirovaniya Srednego Razresheniya Dlya Vydeleniya Povrezhdennykh Drevostoev (Application of Medium-Resolution Remote Sensing Data to Identify Damaged Stands). Master’s Thesis, SFU, Krasnoyarsk, Russia, 2017; 69p. (In Russian). [Google Scholar]
  55. Veraverbeke, S.; Verstraeten, W.W.; Lhermitte, S.; Goossens, R. Evaluating Landsat Thematic Mapper spectral indices for estimating burn severity of the 2007 Peloponnese wildfires in Greece. Int. J. Wildland Fire 2010, 19, 558–569. [Google Scholar] [CrossRef] [Green Version]
  56. Georgopoulos, N.; Stavrakoudis, D.; Gitas, I.Z. Towards a fully automated burned area mapping methodology based on sentinel-2 imagery. GeoScience 2018, 1, 4–11. [Google Scholar]
  57. Yurikova, E.A.; Kokutenko, A.A.; Sukhinin, A.I. Issledovanie vozmozhnosti primeneniya dannykh SPOT-4 dlya deshifrirovaniya povrezhdennykh pozharami uchastkov rastitel’nosti (Research of opportunities of application of data SPOT-4 for interpretation the areas of vegetation damaged by fires). Reshetnev Sib. State Univ. Sci. Technol. 2008, 4, 75–78. (In Russian) [Google Scholar]
  58. Bogdanov, A.P.; Karpov, A.A.; Demina, N.A.; Aleshko, R.A. Sovershenstvovanie monitoringa lesov putem ispol’zovaniya oblachnykh tekhnologii kak elementa ustoichivogo lesoupravleniya (Improving forest monitoring by using cloud technologies as an element of sustainable forest management). Sovrem. Probl. Distantsionnogo Zondirovaniya Zemli Iz Kosm. 2018, 15, 89–100. (In Russian) [Google Scholar] [CrossRef]
  59. Labutina, I.A. Deshifrirovanie Aerokosmicheskikh Snimkov: Ucheb. Posobie Dlia Studentov Vuzov (Interpretation of Remote Sensing Images: A Textbook for University Students); Aspekt Press: Moscow, Russia, 2004; 184p. (In Russian) [Google Scholar]
  60. Matritsa Oshibok i Raschet Pokazatelei Tochnosti Tematicheskikh Kart (Matrix of Errors and Calculation of Indicators of Accuracy of Thematic Maps). 2010. Available online: http://gis-lab.info/qa/error-matrix.html (accessed on 7 November 2021). (In Russian).
  61. Stytsenko, F.V.; Bartalev, S.A.; Ivanova, A.A.; Loupian, E.A.; Sychugov, I.G. Vozmozhnosti otsenki ploshchadei lesnykh pozharov v regionakh Rossii na osnove dannykh sputnikovogo detektirovaniya aktivnogo goreniya (Forest burnt area assessment possibilities in regions of Russia based on active fires detection by satellites). Sovrem. Probl. Distantsionnogo Zondirovaniya Zemli Iz Kosm. 2016, 13, 289–298. (In Russian) [Google Scholar] [CrossRef]
  62. Fornacca, D.; Ren, G.; Xiao, W. Evaluating the Best Spectral Indices for the Detection of Burn Scars at Several Post-Fire Dates in a Mountainous Region of Northwest Yunnan, China. Remote Sens. 2018, 10, 1196. [Google Scholar] [CrossRef] [Green Version]
  63. Medvedeva, M.A.; Vozbrannaya, A.E.; Bartalev, S.A.; Sirin, A.A. Otsenka sostoyaniya zabroshennykh torforazrabotok po mnogospektral’nym sputnikovym izobrazheniyam (Multispectral remote sensing for assessing changes on abandoned peat extraction lands). Issled. Zemli Iz Kosm. 2011, 5, 80–88. (In Russian) [Google Scholar]
  64. Medvedeva, M.A.; Vozbrannaya, A.E.; Sirin, A.A.; Maslov, A.A. Vozmozhnosti razlichnykh mul’tispektral’nykh kosmicheskikh dannykh dlya monitoringa neispol’zuemykh pozharoopasnykh torfyanikov i effektivnosti ikh obvodneniya (Potential of different multispectral satellite data for monitoring abandoned fire hazardous peatlands and rewetting effectiveness). Sovrem. Probl. Distantsionnogo Zondirovaniya Zemli Iz Kosm. 2019, 16, 150–159. (In Russian) [Google Scholar] [CrossRef]
  65. Global Peatland Database. Available online: https://www.greifswaldmoor.de/global-peatland-database-en.html (accessed on 7 November 2021).
Figure 1. An example of the 2010 forest-peat fire and the resulting burnt area, Moscow Region. (a) Active fire location, QuickBird image, 25 July 2010, © 2021 DigitalGlobe, Inc.; (b) burned area with fallen trees on Ikonos image, 12 June 2011, © 2021 GeoEye, Inc., (c) Photo 23.07.2013 r. Peat burn (the mean (median) depth across the burned area of 8 ha was 15 ± 8 (14) cm, varying from 13 ± 5 (11) to 20 ± 9 (19) [26]) resulted in damage to tree roots and the complete death of the tree stand. A peatland forest unaffected by can be seen in the distance (with aspen, pine and birch on the left and predominantly birch on the right).
Remotesensing 14 00194 g001
Figure 2. Wildfires in March–June (orange) and July–October (red) 2010 in the Moscow region.
Remotesensing 14 00194 g002
Figure 3. Landsat-5 TM swaths used in the study: pre-fire (2010) (a); post-fire (2011) (b). Peatlands [39] are shown in brown, ground surveyed areas in yellow. The green and red lines refer to the edges of Landsat-5 TM image scenes with missing data in some channels.
Remotesensing 14 00194 g003
Figure 4. Areas burnt after fires in 2010 in peatlands of the Moscow region.
Remotesensing 14 00194 g004
Figure 5. Distribution of 2010 fires in peatlands of the Moscow region by area gradation (a) and cumulative total (b).
Remotesensing 14 00194 g005
Figure 6. Characteristics of peat (brown) and non-peat (green) fires as determined by Terra/Aqua MODIS hotspots. On the left, the mean values of temperature (MeanT) and fire radiative power (MeanFRP) in relation to fire duration; on the right, the maximum values of temperature (MaxT) and fire radiative power (MaxFRP) in relation to fire duration.
Remotesensing 14 00194 g006
Figure 7. Frequency of duration, maximum temperature (MaxT) and Fire Radiative Power (FRP) for: (a) peat Terra/Aqua MODIS; (b) non-peat Terra/Aqua MODIS; (c) fires defined using Terra/Aqua MODIS data and Landsat-5 TM peat fires.
Remotesensing 14 00194 g007
Figure 8. Differences between peat fires and other wildfires in terms of duration (days) (a) and maximum Fire Radioactive Power (MW)(b).
Remotesensing 14 00194 g008
Table 1. Vegetation indices used in the study.
IndexCalculatuion Formula 1Reference
Normalized Difference Vegetation Index N D V I = N I R R E D N I R + R E D [47]
Normalized Difference Moisture Index N D M I = N I R S W I R 1 N I R + S W I R 1 [48]
Normalized Burn Ratio N B R = N I R S W I R 2 N I R + S W I R 2 [49]
Normalized Burn Ratio 2 N B R 2 = S W I R 1 S W I R 2 S W I R 1 + S W I R 2 [49]
Mid Infrared Burn Index M I R B I = 10 × S W I R 2 9 , 8 × S W I R 1 + 2 [50]
Burn Area Index B A I = 1 ( N I R 0 , 06 ) 2 + ( R E D 0 , 1 ) 2 [51]
1 Landsat-5 TM spectral bands: RED—0.63–0.69 μm; NIR—0.76–0.90 μm; SWIR1—1.55–1.75 μm; SWIR2—2.08–2.35 μm.
Table 2. Vegetation index values and accuracy in detecting burnt areas.
IndexIndex2011ΔIndex 1
Value 2Accuracy 3, %ValueAccuracy, %
NDMI−0.25–0.0381>0.2393
NBR−0.3–0.378>0.392
NBR20–0.2576>0.187
NDVI0.2–0.5568>0.286
BAI40–12065<−3072
MIRBI1.4–1.758<−0.259
Note: 1 ΔIndex = Index2010 − Index2011; 2 identified thresholds for detected burnt areas; 3 accuracy of fire detection when using an index with an appropriate threshold.
Table 3. The accuracy of the identified burnt areas in the peatlands of the Moscow region.
Ground Truth Data
EO Data 1BurntUnburntΣUser’s Accuracy, %
Burnt328433298.8%
Unburnt2624026690.2%
Σ354244598
Producer’s accuracy, %92.7%98.4% 94.98% 2
Note: 1 earth observation data; 2 overall classification accuracy.
Table 4. Descriptive statistics of the main characteristics of peat and other wildfires: duration (days), maximum temperature (K), and maximum fire radiation power (MW).
FiresNumber *MeanMedianMinMax
Duration_peat **2411.830033.67
Duration_peat ***923.60.20033.7
Duration_nopeat **7580.510014.01
MaxFRP_peat **24138.0217.54854.5
MaxFRP_peat ***92111.916.24.5784
MaxFRP_nopeat **75819.7511.33.2511.5
MaxT_peat **241319.02314.3300444.1
MaxT_peat ***92325.7318.6300.5444.1
MaxT_nopeat **758311.97308.2300430.7
*—number of objects; **—wildfires defined using Terra/Aqua MODIS data (March–October 2010); ***—peat fires defined using Terra/Aqua MODIS and Landsat-5 TM data (July–September 2010).
Publisher’s Note: MDPI stays neutral with regard to jurisdictional claims in published maps and institutional affiliations.

