Article

Precipitation and Anthropogenic Activities Jointly Green the China–Mongolia–Russia Economic Corridor

1
Key Lab of Land Surface Pattern and Simulation, Institute of Geographic Sciences and Natural Resources Research, 11A, Datun Road, Beijing 100101, China
2
University of Chinese Academy of Sciences, No. 19A, Yuquan Road, Beijing 100049, China
*
Author to whom correspondence should be addressed.
Remote Sens. 2022, 14(1), 187; https://doi.org/10.3390/rs14010187
Submission received: 17 December 2021 / Revised: 29 December 2021 / Accepted: 30 December 2021 / Published: 1 January 2022
(This article belongs to the Topic Climate Change and Environmental Sustainability)

Abstract

:
Climate change and anthropogenic activities are widely considered the main factors affecting vegetation growth. However, their relative contributions are under debate. Within the non-climatic impact, detailed human activities, particularly government policy adjustments, are less investigated. In this study, we develop a fractional vegetation coverage (FVC) extraction method based on MODIS-EVI satellite data to analyze the spatiotemporal variation of vegetation and its attributions in the China–Mongolia–Russia Economic Corridor (CMREC). The average FVC has improved, with a general increase of 0.02/10a from 2000 to 2020. We construct a driving factor identification system for FVC change, based on partial and multiple correlation coefficients, and we divide the driving forces of FVC changes into seven climate-driven types and one non-climate-driven type. The results reveal that FVC changes caused by climatic factors account for 28.2% of CMREC. The most prominent greening (19.5%) is precipitation-driven, and is extensively distributed in Khentii Aimag, Mongolia; southeast Inner Mongolia; west Jilin Province; and southwest Heilongjiang Province, China. Moreover, we quantify the relative contribution of climatic and non-climatic factors to significant FVC change using the first-difference multivariate regression method. The results indicate that the effects of non-climatic factors on vegetation change outweigh those of climatic factors in most areas. According to the land cover change and regional policy adjustment, anthropogenic activities such as afforestation, reclamation, and planting structure adjustment explain most vegetation improvement in the Northeast Plain; eastern Inner Mongolia; and the Hetao Irrigation District, China. Meanwhile, both vegetation improvement and degradation disperse concurrently in the Mongolian and Russian parts of CMREC, where climate change and anthropogenic activities positively and negatively affect vegetation change, respectively. Despite the greening in most CMREC, it must be noted that human-induced greening is unsustainable to some degree. The overdevelopment of black soil area and sandy land, adverse effects of afforestation projects, and natural hazards related to weather and climate extremes altogether threaten the local ecological security in the long run. Therefore, governments should develop new desertification countermeasures in accordance with the laws of nature, and enhance international cooperation to guarantee the ecological safety of CMREC.

Graphical Abstract

1. Introduction

Climate change and anthropogenic activities are widely considered the main factors affecting vegetation growth [1]. However, the relative contributions of regional climate change and local human activities to vegetation change are under debate [2]. Moreover, within the non-climatic impact, detailed human activities, particularly government policy adjustments, are less investigated. Therefore, in this study we analyze the spatiotemporal variation of vegetation and its attributions in the CMREC.
In recent decades, global land cover has changed dramatically due to natural and human forces [3], giving rise to a series of environmental problems [4]. Nevertheless, satellite data shows that one-third of the global vegetated area is greening, much larger than that which is browning [5]. CO2 fertilization effects and climate change explain most greening trends [1,6]. Beyond that, land-use changes have a marked impact on global vegetation improvement [5,7]. Furthermore, global warming is projected to increase continuously until at least the mid-21st century under all emissions scenarios considered (https://www.ipcc.ch/assessment-report/ar6/ (accessed on 16 December 2021)). In response to the threat posed by potential climate extremes and anthropogenic activities, it is indispensable to explore the dynamics and attribution of terrestrial vegetation.
Normalized Differential Vegetation Index (NDVI) is one widely used vegetation parameter with good stability and accessibility to identify regional vegetation changes [8]. Climate change is one of the most critical factors affecting vegetation change [9,10,11]. Within these climatic factors, precipitation and temperature stand out as the most important. Previous studies have documented a significant positive correlation between NDVI and temperature during the growing season, especially at high latitudes [12]. In addition, warmer temperatures positively impact vegetation activity in cold regions and negatively impact warm regions [13,14]. Studies have also reported that precipitation is positively correlated with grassland growth, except for in the Arctic region [15]. In China, the warmer temperature is responsible for the rise in NDVI at a national scale, while regional NDVI variations are related to precipitation [16].
As an essential part of the Belt and Road Initiative (BRI), a strategy that seeks to connect Asia with Africa and Europe via land and maritime networks, the CMREC was officially ratified to build jointly by the three governments in July 2015. The corridor is highly compatible with the Northeast Revitalization in China, the Eurasian Economic Union (EAEU), the Far East Development in Russia, and the Steppe Road in Mongolia [17]. Hence, promoting sustainable development and ecological safety in CMREC will guarantee the successful implementation of BRI. Presently, however, the ecological disasters caused by climate change have an increasing influence on CMREC, posing a massive threat to the safety of the region’s development, specifically for infrastructure such as roads, railways, and oil and gas pipelines [18]. Therefore, it is of urgency and significance to explore the vegetation change and its attribution in CMREC.
The vegetation coverage in CMREC has significantly improved over the last few decades. The NDVI has increased in more than half of the regions in China since 1982 [19]. The vegetation index change in Northeast China was intricate, i.e., growing in crop areas and declining in forest-dominated regions from 1982 to 2009. Simultaneously, the average trend of the growing season NDVI value was downward in the Mongolia Plateau during 2000–2004 and upward during 1982–2000 and 2004–2015 [20]. The region covered by vegetation continued to expand from 2000 to 2007 and reached its maximum in 2017 in Russia [21]. Furthermore, NDVI increased in more than 78% of the entire border region between Mongolia and Russia [22].
Nevertheless, CMREC has been suffering from destructive sandstorm disasters due to the adverse weather conditions of concurrent high temperatures, low humidity, and strong winds. In particular, a severe sandstorm hit Asia in mid-March 2021, bringing substantial environmental and economic losses, high casualties, and colossal livestock deaths and injuries (https://public.wmo.int/en/media/news/severe-sand-and-dust-storm-hits-asia (accessed on 16 December 2021)). Moreover, CMREC is home to the primary sand sources of this sandstorm event, including the Gobi Desert in Mongolia and Badain Jaran Desert in China. Hence, this study focuses on the spatiotemporal variation of vegetation and its climatic and anthropogenic driving forces in CMREC.
Here, we use MODIS-EVI satellite data instead of NDVI to analyze the vegetation change in CMREC. Despite its good stability and accessibility [8], NDVI has several flaws. Firstly, the algorithm of NDVI is based on the normalized ratio of the near-infrared (NIR) and red bands, making NDVI easy to saturate and resulting in its amplification in the low-value region and compression in the humid regions with dense vegetation coverage [23]. Secondly, the atmosphere correction scheme in NDVI only includes corrections for the ozone and Rayleigh scattering disturbances, with many interference factors—such as water vapor and aerosol—ignored [24]. In addition, NDVI lacks effective countermeasures against soil background disturbances, and has shortcomings in the maximum value synthesis algorithm [25]. Therefore, based on NDVI, the atmospheric resistance vegetation index (ARVI) [26], and the soil regulated vegetation index (Savi) [27,28], a feedback term is introduced in the enhanced vegetation index (EVI) to modify the effects of the atmosphere and soil [29], significantly improving the anti-interference capability [24]. Compared with NDVI, EVI is less prone to saturation and remains sensitive in high-biomass regions [23,30]. Therefore, based on MODIS-EVI data, we extract FVC, an index describing the proportion of vertical projection area of vegetation to the total area [31], to discuss the vegetation change in CMREC.
This study explores the driving forces of vegetation change in CMREC based on constructing a driving factor identification system of vegetation change. Statistical methods are favorable to identify the driving forces, and the partial and multiple correlation coefficients are the most critical indicators [32,33,34]. For example, scholars have clarified the driving effect of air temperature and precipitation on terrestrial vegetation change in China during 1983–1992 with partial and multiple correlation coefficients [32]. Furthermore, Wen et al. [34] apply a partial correlation coefficient method to detect the differentiation in global vegetation growth under the scenarios with cumulative climate effects considered or not. In addition, Piao et al. [33] provide evidence for the weakening relationship between temperature variability and vegetation productivity in the northern hemisphere. It is worth mentioning that most of the existing climate–vegetation relationship research usually selects temperature and precipitation as the main climatic factors affecting vegetation change [30,35]. However, wind speed is equally significant considering the severe desertification and sandstorm disaster and its profound impact on vegetation growth in CMREC. We, therefore, propose a driving factor identification system of FVC change based on the three climatic factors: precipitation, temperature, and wind speed. This method can identify the contribution of natural and anthropogenic activities to FVC changes and emphatically clarify the comprehensive effects of multiple climatic factors to ensure the completeness of the identification system.

2. Materials and Methods

2.1. Study Area

The study area is between 97.1°E to 134.8°E and 37.4°N to 58.4°N, covering a region of 4.3 × 10⁶ km2. CMREC includes twenty administrative regions, including three provinces and one autonomous region in China, eleven aimags (administrative regions in Mongolia, equal to provinces) in Mongolia, and four oblasts and one republic in Russia (Figure 1). The study area has a complex terrain structure, with an elevation drop of more than 3000 m. The large geomorphic units primarily include the East Sayan Mountains, the Yablonoi Mountains, the Gobi Altai Mountains, the Great Khingan Mountains, the Lesser Khingan Mountains, the Changbai Mountains, the Yinshan Mountains, the Mongolian Plateau, and the Northeast China Plain. There are four climatic zones in CMREC: temperate grassy zone, temperate desert zone, temperate deciduous broadleaf forest zone, and subarctic coniferous zone.

2.2. Data Source

2.2.1. MODIS EVI Data

The Terra Moderate Resolution Imaging Spectroradiometer (MODIS) MOD13A3 data are monthly vegetation data with a spatial resolution of 1 km, providing global vegetation data including NDVI, EVI, and NIR reflectance from 2000 to the present day (https://modis.gsfc.nasa.gov/data/ (accessed on 16 December 2021)). Due to the significant spatial differences in climatic conditions, vegetation distribution is diverse and complex in CMREC. Therefore, we used EVI to describe vegetation change for its sensitivity in high-biomass regions and the effective countermeasures against soil and atmosphere disturbances, which can better adapt to different climate and vegetation types. We selected EVI data in eleven tiles in eastern Asia (H23V03, H24V03, H24V04, H25V03, H25V04, H25V05, H26V03, H26V04, H26V05, H27V04, and H27V05) from February 2000 to December 2020, completely covering CMREC.

2.2.2. ERA5 Reanalysis Data

ERA5 (ECMWF’s Reanalysis 5) is the latest climate Reanalysis data from the European Centre for Mesoscale Weather Forecasts (ECMWF), providing a detailed record of the global atmosphere, land surface, and ocean waves since the 1950s [36]. We selected the ERA5-Land land-surface climate reanalysis datasets (https://cds.climate.copernicus.eu (accessed on 16 December 2021)). Compared with the previous version, this dataset has a more extended observation sequence and a higher spatial resolution (0.1° × 0.1°). In addition, we utilized the monthly mean grid data of temperature, precipitation, and wind speed from 2000 to 2020 in this paper.

2.2.3. Land Use/Cover Change Data and DEM Data

MCD12Q1 data describe the global land cover characteristics in the resolution of 500 m derived from observations spanning one year’s input of Aqua and Terra data [37]. According to the International Geosphere-Biosphere Programme (IGBP, https://www.igbp.ch/ (accessed on 16 December 2021)), there are seventeen primary land cover classes, including eleven natural vegetation classes and three developed land classes, and three non-vegetated land classes [38]. Among these, there are sixteen classes in CMREC.
Moreover, the Terra Advanced Spaceborne Thermal Emission and Reflection Radiometer (ASTER) Global Digital Elevation Model (GDEM) data (ASTER GDEM V3, https://lpdaac.usgs.gov/products/astgtmv003/ (accessed on 16 December 2021)) were also used with a spatial resolution of about 30 m in this study.

2.3. Statistical Methods

The statistical methods used here include correlation analysis and linear statistical models. Correlation analysis was employed to clarify vegetation variation with climate changes, while the linear statistical models and variance analysis helped figure out the trend of all factors and discuss the impact of spatial differences in climatic factors on vegetation change in CMREC.

2.3.1. Partial Correlation Coefficient

It is difficult for a simple correlation coefficient to accurately describe the relationship between a single independent and a dependent variable in multivariate correlation analysis. On the contrary, the partial correlation coefficient could eliminate the interference of other variables and obtain a more accurate judgment about the correlation between elements. The calculation of the partial correlation coefficient is as follows [39]:
r y i , 12 m = R y i * R y y * R i i *  
where r y i , 12 m is the partial correlation coefficient between dependent variable y and independent variable i with the other variables fixed. R y i * , R i i * and R y y * are the cofactors of the correlation coefficient matrix after removing row m  + 1 and column i , row i and column i , and row m + 1 and column m + 1, respectively. We use this method to study the relationship between FVC and three climatic factors (i.e., precipitation, temperature, and wind speed) in CMREC over the past decades. Then we distinguish the impact of different climatic factors on vegetation change. In addition, the t-test method is often used to test the significance of the partial correlation coefficient. The t-statistic is given below:
  t = r y i , 12 m 1 r y i , 12 m 2 n m 1  
where n is the number of samples and m is that of independent variables. When | t | is greater than t0.05 (the threshold t value at the level of 0.05), the partial correlation coefficient is considered statistically significant at the level of 0.05.

2.3.2. Multiple Correlation Coefficient

The multiple correlation coefficient correlates the dependent variable and multiple independent variables [40]. Therefore, the multiple correlation coefficient is calculated as follows:
R y , 12 m = 1 R * R y y *  
where R y , 12 m is the multiple correlation coefficient between a dependent variable y and m independent variables; R * is the cofactor of this coefficient; the value range of R y , 12 m is [0, 1]. The larger this coefficient is, the closer the relationship between the linear combination of m factors and y was. We aim to obtain the comprehensive influence of more than one climatic factor on vegetation change using the multiple correlation coefficient. The F-test method is usually adopted to test the statistical significance of multiple correlation coefficients. The F-statistic is calculated using Equation (4):
  F = R y , 12 m 2 1 R y , 12 m 2 n m 1 m  
When F is greater than F0.05 (the threshold F value at the level of 0.05), the multiple correlation coefficient is statistically significant with a level of 0.05.

2.3.3. Ordinary Least Square Method

The ordinary least square method (OLS) is a mathematical optimization scheme to seek the best matching result by minimizing the sum of squared errors [41], usually used for function fitting. Our research uses linear regressions to examine the temporal changes of annual average FVC and three climatic factors, namely precipitation, temperature, and wind speed. The statistically significant FVC change always corresponds to the definite vegetation improvement owing to specific anthropogenic activities or significant climate change.

2.3.4. Linear Mixed-Effects Models

Linear mixed-effects models (LMMS) provide a flexible tool to analyze grouped data [42]. This variance component model considers both the fixed effect and the random effect. Utilizing the “Lme4” package [43] in the R environment [44], LMMS, including time and location as random intercepts, is run to construct the linear relationship between FVC and climatic factors.
  F V C =   a + b x 1 + c x 2 + d x 3 + ε  
where a is the intercept of the FVC axis; x 1 , x 2 , and x 3 are the precipitation, temperature, and wind axis; b , c , d are the corresponding fixed coefficients; ε is the random effects term.
The spatial distribution of vegetation is tightly related to climatic factors. The multi-year distribution of vegetation and climatic factors can be represented as several two-dimensional raster matrices. We convert these two-dimensional matrices into one-dimensional sequences. Then we employ the LMMs to analyze these sequences, taking the FVC sequence as the dependent variable, the climatic factors as the explanatory variables, and the time and the placement as the terms of the random effects.

2.3.5. Analysis of Variance (ANOVA)

ANOVA is usually used to determine whether the independent variable has a significant effect on the dependent variable by analyzing the contribution of each variation to the total [45]. In this study, we discuss the contribution of each climatic factor to the FVC change by comparing the contribution rate ρ, which can be figured out by the ratio of the sum of square deviations (SS) of a single climatic factor over the total sum of square (SST) [46].
ρ i = S S i S S T  
The factor with ρ more significant than the others is considered the dominant factor in the vegetation change. Alternatively, the ANOVA method can also compare the LME (Linear mixed-effects) fit with an ordinary fit without random effects, which helps to discuss the influence of random effects on the fitting.

2.3.6. Relative Contribution Analysis

A first-difference multivariate regression method was used to separate the effects of climate change from the combined effects of climatic and non-climatic factors [47]. The response of vegetation change to climatic factors can be estimated using a multiple regression model [48], as shown in Equation (7):
Δ F V C = C P r e Δ P r e + C T e m Δ T e m + C W i n Δ W i n + i n t  
where Δ F V C is the first-difference FVC value at each position with an interval of one year; Δ P r e , Δ T e m , and Δ W i n are the first-difference values of precipitation, temperature and wind speed, respectively; C P r e , C T e m and C W i n are the regression coefficients, representing the sensitivity of FVC to climatic factor changes; int is the intercept. According to Equation (7), the isolated effects of climatic factors on FVC change can be calculated from Equation (8):
T F V C | C = C P r e T P r e + C T e m T T e m + C W i n T W i n  
The combined effects of climatic and non-climatic factors on FVC change were assumed to be equivalent to the combination of their net effects, as shown in Equation (9):
T F V C = T F V C | C + T F V C | N
where T F V C | C represents the FVC changes under the isolated effect of climate change. Therefore, the relative contribution of climate change ( R C C ) and non-climatic effects (including anthropogenic activities and random effects) ( R C N ) to FVC changes at each position can be determined using Equations (10) and (11):
R C C = | T F V C | C | | T F V C | C | + | T F V C | N | 100 %
R C N = | T F V C | N | | T F V C | C | + | T F V C | N | 100 %

2.4. Extraction of Vegetation Coverage

To preprocess the MOD13A3 EVI data in different tiles, we used the MODIS Reprojection Tool (MRT) to finish the image mosaics and reprojection, and used ArcGIS to clip the raster image according to the study area [49]. However, the quality of remote vegetation sensing data is poor because of cloud, atmosphere, and land surface disturbance. Therefore, we employed the maximum value composite (MVC) method, one of the most commonly used maximization synthesis methods [50], to control the quality of remote sensing data (Figure 2a). This method compares multiple EVI images pixel-by-pixel after quality control, and then displays the maximum value at each pixel in one image, eliminating the disturbance of cloud, atmosphere, and sun altitude angle to the vegetation index data. These annual maximum EVI distributions obtained from the monthly data help calculate the FVC, an index that reflects vegetation distribution more accurately and intuitively [51]. FVC in a limited area can be calculated by Equation (12) [52]:
F V C = E V I E V I s o i l E V I v e g E V I s o i l  
where E V I s o i l and E V I v e g are the EVI value in bare soil and pure vegetation areas, respectively. The E V I s o i l and E V I v e g in our research are replaced with the minimum (−0.02) and the maximum (0.85) EVI value of the region during the past 21 years, respectively.
It is worth noting that the EVI value of water bodies or outliers due to cloud and atmosphere disturbance are invalid. Here, we proposed a filter based on the land cover types and the continuity of the data to extract the valid E V I s o i l and E V I s o i l (Figure 2b). The valid E V I v e g and E V I s o i l must satisfy the following conditions: (1) The land cover is not a water body, snow, ice, wetland, urban or built-up land; (2) The surrounding EVI data is horizontal continuous. (3) The EVI value is not the outlier of the time series.
Therefore, we used the flow in Figure 2b to filter out the invalid values, where EVI(i, j, t) was the EVI value in the position (i, j) at time t; LC(i, j) was the land cover type; EVIave(i, j) and σ were the mean value and the standard deviation of the EVI time series in the position (i, j), respectively. We first used the MCD12Q1 land use/cover change (LUCC) data to ensure that the corresponding position was covered by vegetated area or barren. Then, the horizontal continuity was tested, screening out EVI with the differences between its surrounding value less than the constant c. Here, the constant c was selected as 0.01. Finally, we filtered out the outliers with the difference between EVI(i, j, t) and EVIave(i, j) greater than 2σ. The maximum/minimum EVI passing all the tests above were considered valid E V I v e g / E V I s o i l .
Roughly equivalent to the normalized EVI, FVC with a range from 0 to 1 eliminated the interference of EVI values equal to or lower than zero. Meanwhile, we resampled the FVC distribution using bilinear interpolation, and then produced the FVC distribution with the same resolution (0.1° × 0.1°) as ERA5 reanalysis data.

2.5. Desertification Classification

The classification indexes of the desertification degree are diversified because of different assessing factors and standards. Among the factors, FVC is an ideal index to assess desertification. The desertification process is closely related to the surface vegetation condition and directly influences the regional FVC. Considering the unique climate conditions and vegetation distributions in CMREC, areas that suffered from desertification are mostly wind-eroded grassland caused by climate change and excessive logging and grazing [53,54]. According to the Land Desertification Monitoring Method GB/T20483 (http://c.gb688.cn/bzgk/gb/showGb?type=online&hcno=62E00314AFED9EDF6BAC3562FA2AB276 (accessed on 16 December 2021)), the National Standards of PR China, we divide the desertification degree in CMREC into five categories: non-desertification, mild desertification, moderate desertification, severe desertification, and extremely severe desertification, corresponding to the FVC of more than 70%, 50–70%, 30–50%, 10–30%, and less than 10%, respectively.

3. Results

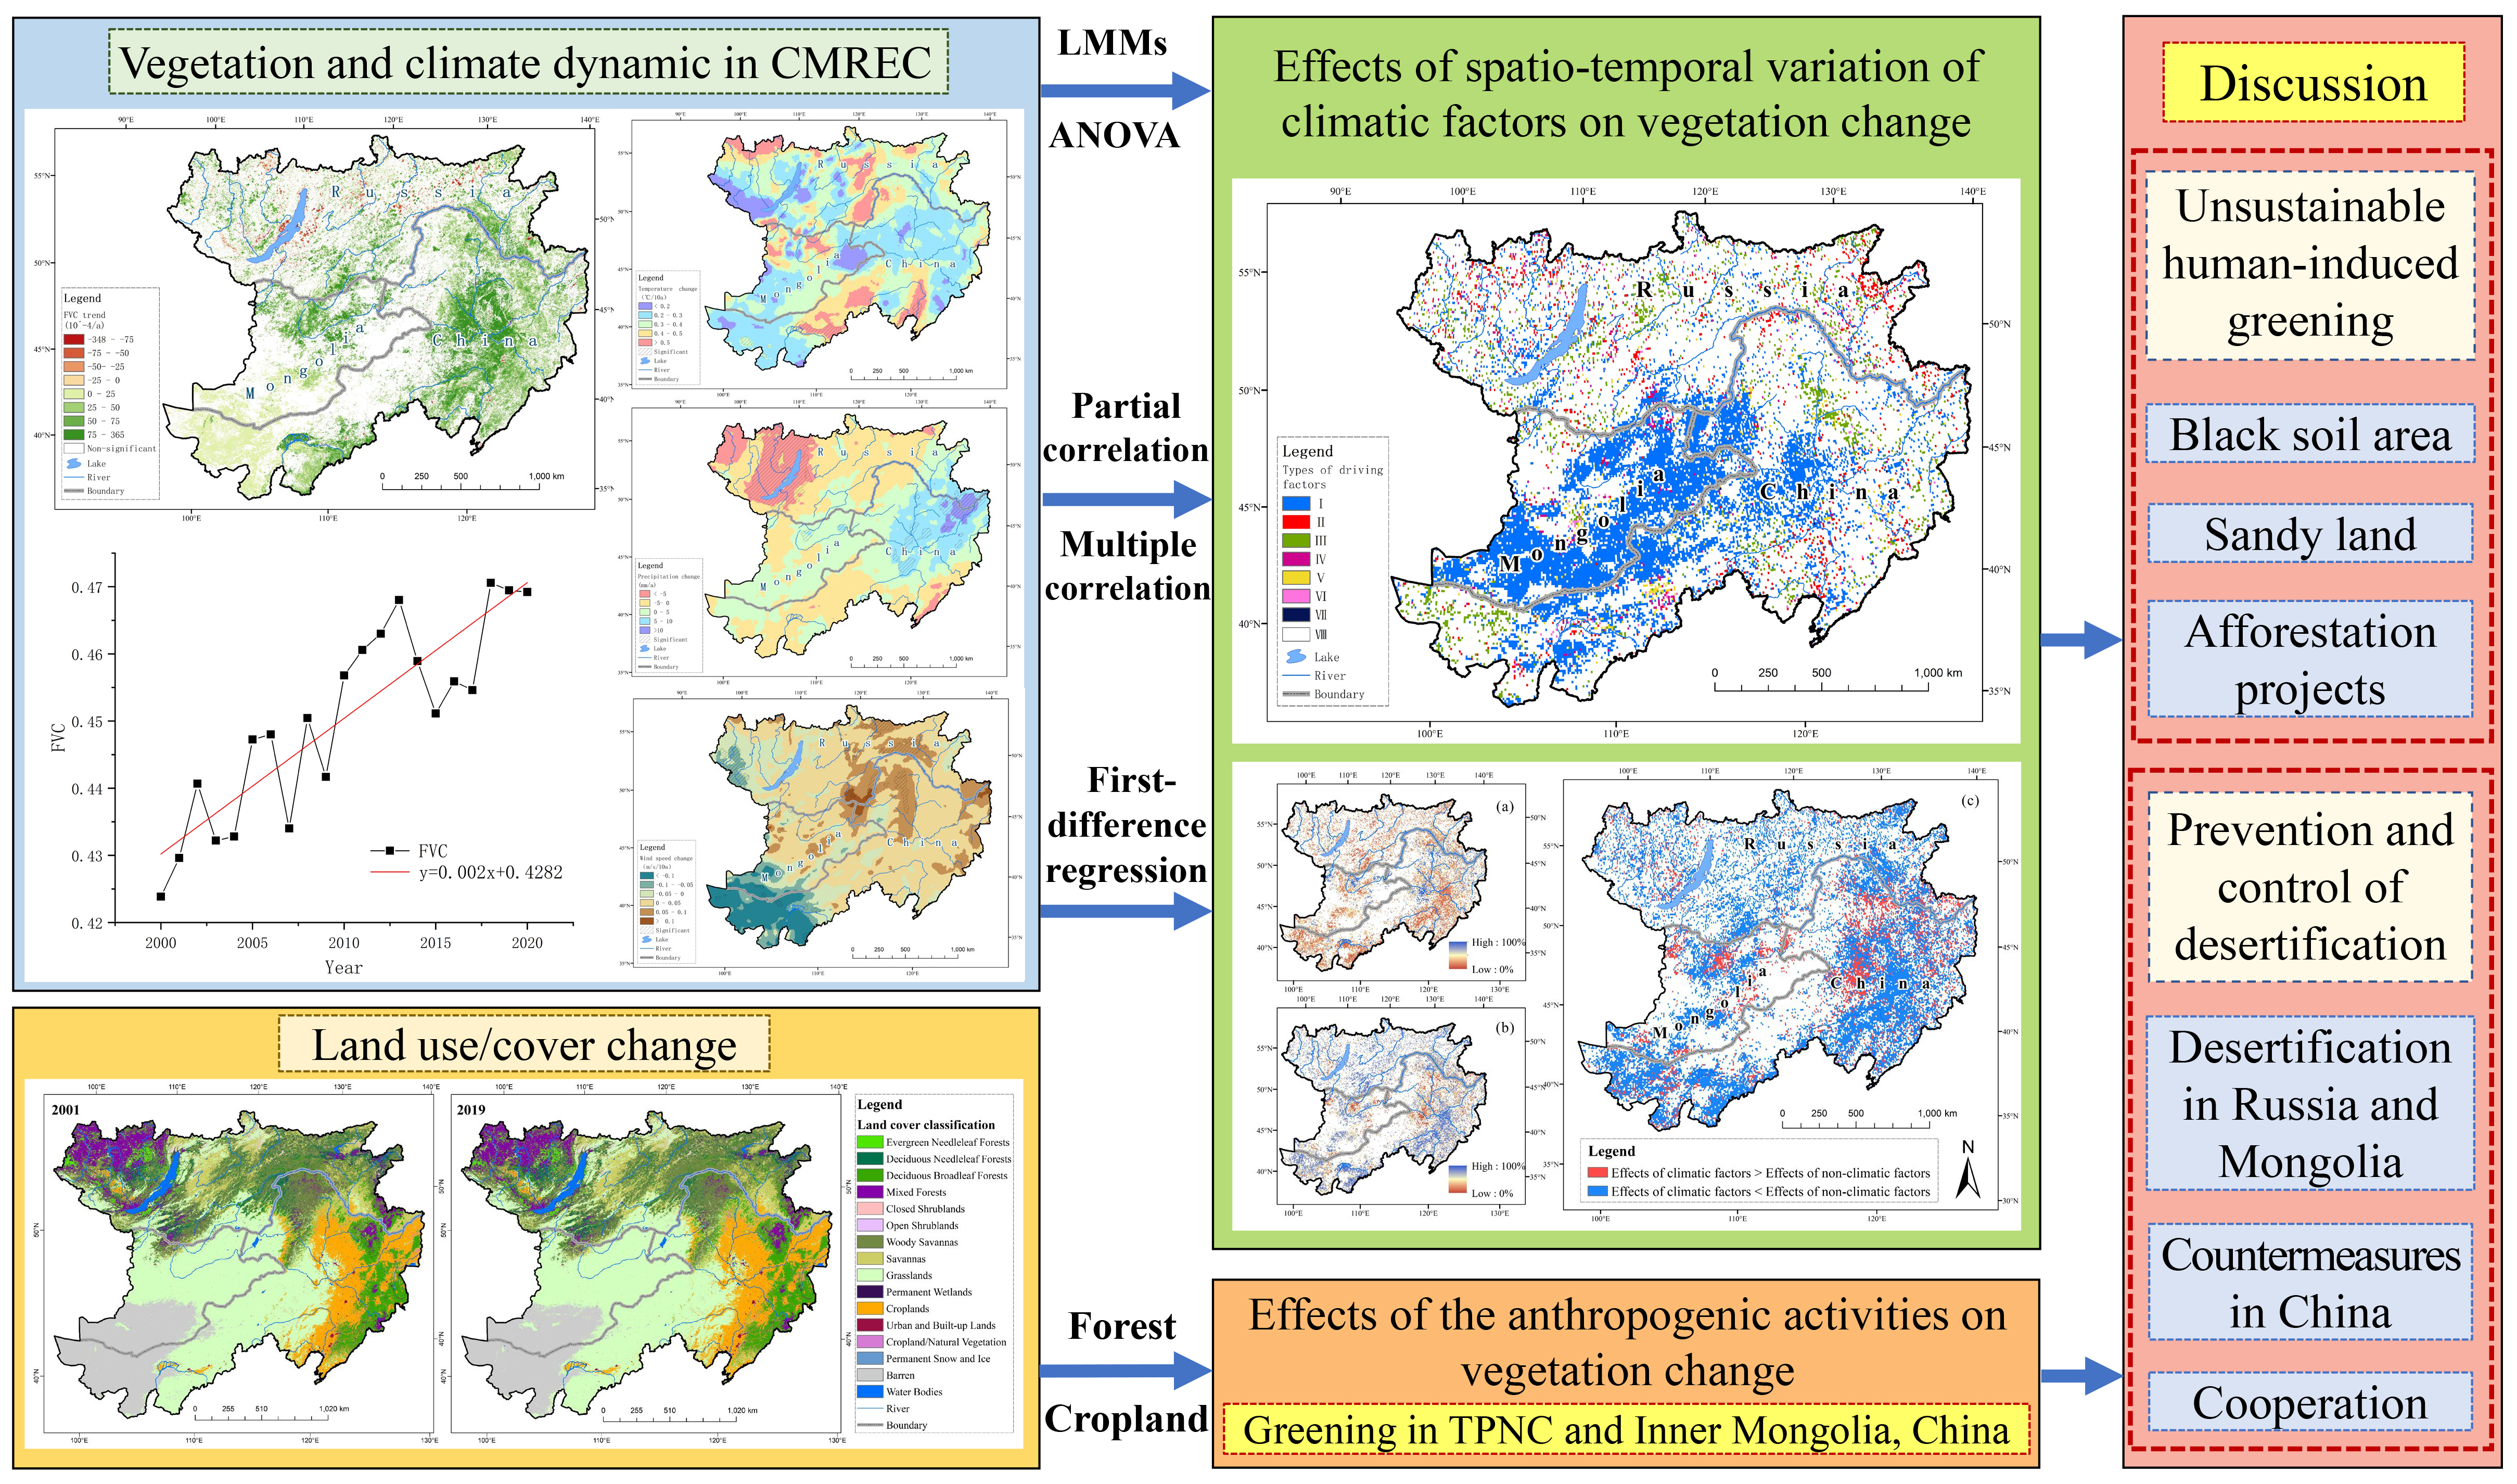
3.1. Vegetation Change

In the past twenty years, the average EVI increased from southwest to northeast in CMREC (Figure 3), with the dominant vegetation gradually shifting from desert to grassland to coniferous forest to deciduous broadleaf forest. The low-EVI value occurred in the South Omnogovi Aimag, Mongolia, and the Badain Jaran Desert in western Inner Mongolia, China, with the lowest value of −0.03. In contrast, the high-EVI value is extensively distributed in the eastern coastal areas of the Three Provinces in Northeast China (TPNC, including Heilongjiang, Jilin, and Liaoning provinces), with the maximum EVI value of 0.79.
From southwest to northeast, the annual average FVC in CMREC increased during 2000–2020 (Figure 4a), which is highly consistent with the EVI distribution (Figure 3) and responds to the gradually declining severity of desertification (Figure 4b). Therefore, we divided the whole region into several sections according to the five desertification types. The areas with extremely severe and severe desertification accounted for 2.3% and 18.5% of the total area, respectively, mainly located in temperate desert and grassland on the Mongolian Plateau. Significantly, the most severe desertification was along the bordering areas between Ejina Banner in Alxa League, Inner Mongolia, and the Gobi Altai Mountains, Mongolia. Moderate desertification areas made up 20.6% of CMREC, roughly in the ecological transition zone between grassland and forest. Northeastern Inner Mongolia in China and most of the Russian part of CMREC were mild desertification areas covered by subarctic coniferous forests, accounting for 36.4% of the total. Non-desertification regions were primarily located in the eastern part of CMREC, making up 22.3% of the total, where dominant vegetation was the temperate deciduous broadleaf forest. The areas of mild desertification and non-desertification totaled nearly 60% of CMREC, spared from severe desertification.
The regional average FVC indicated a significant increase of 0.02/10a (t-test, significance level = 0.05) from 2000 to 2020 (Figure 5a). The average value for the past two decades was 0.49, with the minimum value appearing in 2000 (0.42) and the maximum in 2018 (0.47). Figure 5b shows the spatial distribution of FVC change in CMREC. We find FVC increased significantly in western TPNC and eastern Inner Mongolia, with a maximum increase of 0.31/10a. In addition, there were two apparent concentrations of vegetation degradation for the west of Amur Oblast and the surrounding area of Baikal Lake. While for the subarctic coniferous region in northern CMREC, the FVC decreased scattering. Moreover, the large areas of insignificant FVC change occurred in central Inner Mongolia and southern Mongolia.

3.2. Climate and Land Cover Change

3.2.1. Climate Change

Climate change is one of the dominant factors affecting vegetation change. Therefore, before the attribution analysis of vegetation change in CMREC, we first figured out the average distribution of the three climatic factors (precipitation, temperature, and wind speed) during 2000–2020.
The temperature has generally decreased from south to north (Figure 6a) in CMREC over the past two decades. The high temperature (>9 °C) appeared in the Badain Jaran Desert in southwestern Inner Mongolia and southern Liaoning Province in China, with the low temperature (<−9 °C) distributed in the northern Republic of Buryatia. The overall temperature increased significantly in CMREC, with the most apparent warming up to 0.5 °C/10a (Figure 6b).
The distribution of mean annual precipitation was highly consistent with that of FVC in CMREC, with the overall rainfall increasing from southwest to northeast (Figure 6c). The low-precipitation area was located in the desert in southern Mongolia and western Inner Mongolia, with annual average precipitation of less than 200 mm. In comparison, the areas with sufficient annual precipitation over 1000 mm appeared on the eastern coastal areas of TPNC because of its location on the windward slope of the Changbai Mountains with abundant water vapor brought by the summer monsoon. On the other hand, precipitation decreased most significantly around Lake Baikal in Russia in the past two decades, with a minimum of −5.0 mm/a (Figure 6d). Meanwhile, the precipitation increase reached or exceeded 10.0 mm/a in Jewish Autonomous Oblast in Russia, parts of Heilongjiang Province, Jilin Province, Inner Mongolia in China, parts of Dornod Aimag and Khentii Aimag in Mongolia.
Westerly wind dominated the wind field in the study area and gradually shifted from the southwest wind in the southern CMREC to the northwest wind in the northern CMREC. Furthermore, the overall wind speed increased from north to south (Figure 6e). The entire Mongolian Plateau was an area of strong wind, with the maximum wind speed (>2.5 m/s) appearing north of the Yinshan Mountains to the south of the China–Mongolia border. The minimum value (<0.5 m/s) appeared in mountainous areas of Eastern Siberia. Wind speed in most of CMREC increased from 2000 to 2020 (Figure 6f). However, a decrease in wind speed could predominantly be found in Omnogovi Aimag in Mongolia, the west of Lake Baikal in Russia, and the west of Inner Mongolia in China.

3.2.2. Land Cover Change

There are about sixteen types of land cover in CMREC (Figure 7a,b). Two major types were grassland and savanna (including woody savanna), which accounted for 34.8% and 24.9% of the total, respectively (in 2019) (Figure 7b). Forests, including evergreen needleleaf forests, evergreen broadleaf forests, deciduous broadleaf forests, and mixed forests, were the third-largest land cover type, making up more than 16.0% of CMREC. Moreover, barren land (mainly desert) and land used for human activities (including cropland, and urban/built-up land) accounted for about 10% of the total.
Areas with land cover change accounted for 17.3% of CMREC from 2001–2019 (Figure 7c). The transition of the forest and savanna was the most significant, with the former decreasing by 3.85 × 10⁴ km2 and the latter increasing by 6.31 × 10⁴ km2. Moreover, the non-vegetated regions (soil, sand, and rock) decreased from 54.6 × 10⁴ km2 in 2001 to 50.1 × 10⁴ km2 in 2019. Meanwhile, the croplands in CMREC increased by 1.41 × 10⁴ km2.
Although the total forest areas decreased in CMREC, forests in China, especially TPNC, obviously increased (Table 1). The newly cultivated land in TPNC accounted for 36.2% of the total in CMREC.

3.3. Attribution of Vegetation Change

3.3.1. Climatic Impact on Vegetation Change

We analyzed the impact of climate on vegetation change from spatiotemporal perspectives. First, from the spatial perspective, we utilized the linear mixed-effects models (LMMs) to discuss the influence of climatic factors. Second, from the spatial perspective, we explored the effects of climate change using correlational analysis.

Vegetation Distribution

The vegetation distribution is closely related to climatic factors. We selected the explanatory variables of precipitation, temperature, and wind speed (Table 2), using LMMs and ANOVA to explore the influence of the uneven distribution of climatic factors on FVC. The results show that precipitation was the major contributor, with a p value of 68.3%. Precipitation was essential for plant growth through the water supply. As a result, with the moisture conditions gradually shifting from arid to semi-arid to semi-humid and finally to humid climate from southwest to northeast in CMREC, the dominant vegetation changed from desert to grassland to coniferous forest and eventually to deciduous broadleaf forest.
At the same time, the p value of temperature (0.1%) and wind speed (2.1%) was much smaller than that of precipitation. These two climatic factors were therefore considered less essential contributors, which means it is worth noting that the impact of temperature and wind speed varied remarkably in different regions in CMREC. The climatic warming promoted vegetation growth in high latitudes and was inhibitory in low and middle latitudes. While in the mid-to-high latitudes of the northern hemisphere, the sensitivity of vegetation index to temperature became more robust with the latitude increasing. CMREC belongs to the northernmost part of the mid-latitudes, where the relationship between temperature and vegetation growth was relatively weak.
Meanwhile, wind speed changes affect regional vegetation coverage through multiple perspectives such as plant physiology, soil, microclimate, ecological structure, and carbon flux [55]. Low wind speed affects the pollination success of the plants that need natural pollination [56]. In addition, the stability of the boundary layer increases under a calm wind environment, inhibiting the emission rate of CO2 [57]. However, excessive strong winds damage the surface of plant leaves, influencing the transpiration process of plants. In addition, heavy wind enhances wind erosion, dramatically increasing the possibility of soil organic matter loss [58,59]. Equally significantly, the high-speed near-surface wind strengthens the surface turbulence, accelerating soil water evaporation and causing soil water shortage [60].
Consequently, moderate wind speed is beneficial to vegetation growth, just as researchers indicate that too low or too high winds are unsuitable [61,62]. It was not difficult to notice that the vegetation distribution was weakly correlated with the wind speed in CMREC. The diversity of vegetation cover and the significant wind speed differentiation makes it hard to explain how wind speed influences vegetation growth by a single mechanism.

Vegetation Variation

We discuss the driving effect of climatic factors on FVC changes by giving the spatial distribution of the partial and multiple correlation coefficient between climatic factor time series and FVC sequence in CMREC from 2000 to 2020 (Figure 8 and Figure 9).
A.
Partial correlation coefficients
The partial correlation coefficients between FVC and precipitation, air temperature, and wind speed were different. The results with a t-statistic greater than t0.05 were accepted to pass the significance test, which responded to the absolute value of the partial correlation coefficient greater than 0.47 in Figure 8. Among the partial correlation coefficients between FVC and three climatic factors, the correlation between FVC and air temperature or wind speed was relatively poor, with few grid points passing the significance test at the level of 0.05 (Figure 8a,c). The partial correlation coefficient between air temperature and FVC was between −0.83 to 0.79. The significant regions were located in the central part of the Omnogovi Aimag, accounting for a minor proportion of the total.
The areas with the significant partial correlation coefficients between wind speed and FVC were slightly larger than those between FVC and air temperature. Regions with positive correlation coefficients principally appeared in northern Dornogovi Aimag in Mongolia, central Inner Mongolia, and eastern Heilongjiang Province in China. By comparison, negative correlation coefficients occurred in the Badain Jaran Desert in western Inner Mongolia. Thus, despite the insignificant change of FVC and wind speed in southeastern Inner Mongolia (Figure 5b and Figure 6f), the partial correlation coefficients were significant between FVC and wind speed.
Precipitation was a more crucial and direct contributor to FVC changes than temperature and wind speed. The regions with remarkable partial correlation coefficients between FVC and precipitation were relatively extensive and mainly located in the Mongolian Plateau (Figure 8b), areas with low (<30%) or medium (30–50%) vegetation coverage. FVC changes were significantly related to precipitation in more than 60% of Mongolia, with the partial correlation coefficients around 0.9. Additionally, north-central and southeastern Inner Mongolia were prominent, with partial correlation coefficients between FVC and precipitation.
B.
Multiple correlation coefficients
We obtained the multiple correlation coefficients under different configurations of climatic factors (Figure 9), including the correlation coefficients between FVC and two climatic factors or three factors. The results with an F-statistic greater than F0.05 were accepted to pass the significance test. That is to say, the multiple correlation coefficient of dual climatic factors larger than 0.55 (Figure 9a–c) and that of three climatic factors greater than 0.62 were considered significant (Figure 9d). The areas with significant multiple correlation coefficients between FVC and precipitation & temperature, precipitation & wind speed, and temperature & wind speed, precipitation & temperature & wind speed accounted for 18.8%, 20.1%, 4.9%, and 16.9% of CMREC, respectively. The distribution patterns of the multiple correlation coefficients between FVC and precipitation and temperature, precipitation and wind speed, and precipitation and temperature and wind speed, were roughly similar, with significant areas primarily gathered in southern and eastern Mongolia, north-central and eastern Inner Mongolia in China, which is consistent with the regions with significant partial correlation coefficients between precipitation and FVC. However, the multiple correlations between FVC and temperature–wind speed were relatively weaker than others.

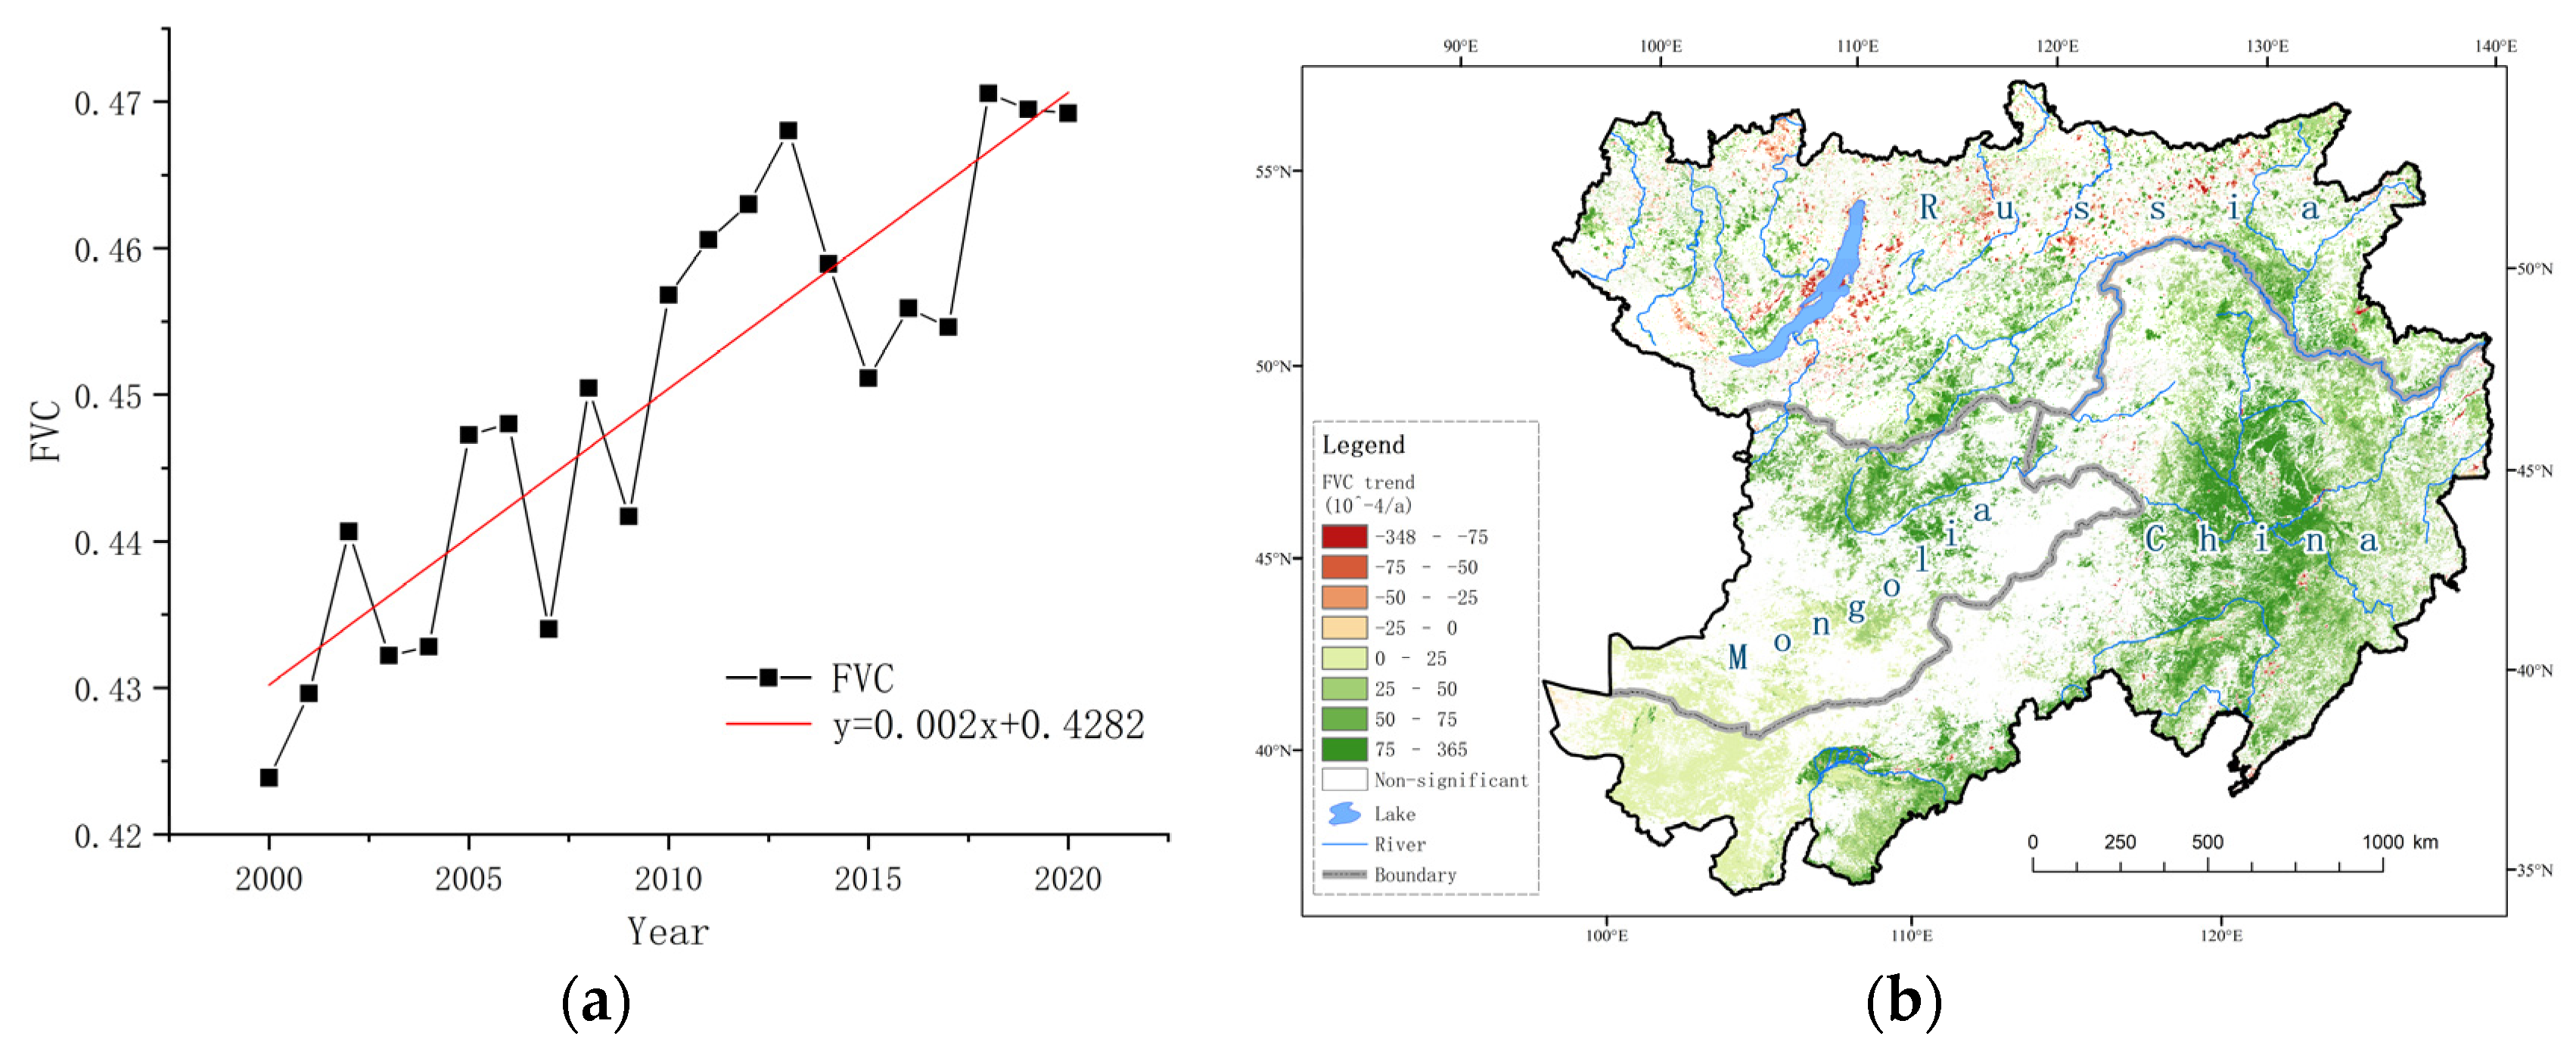
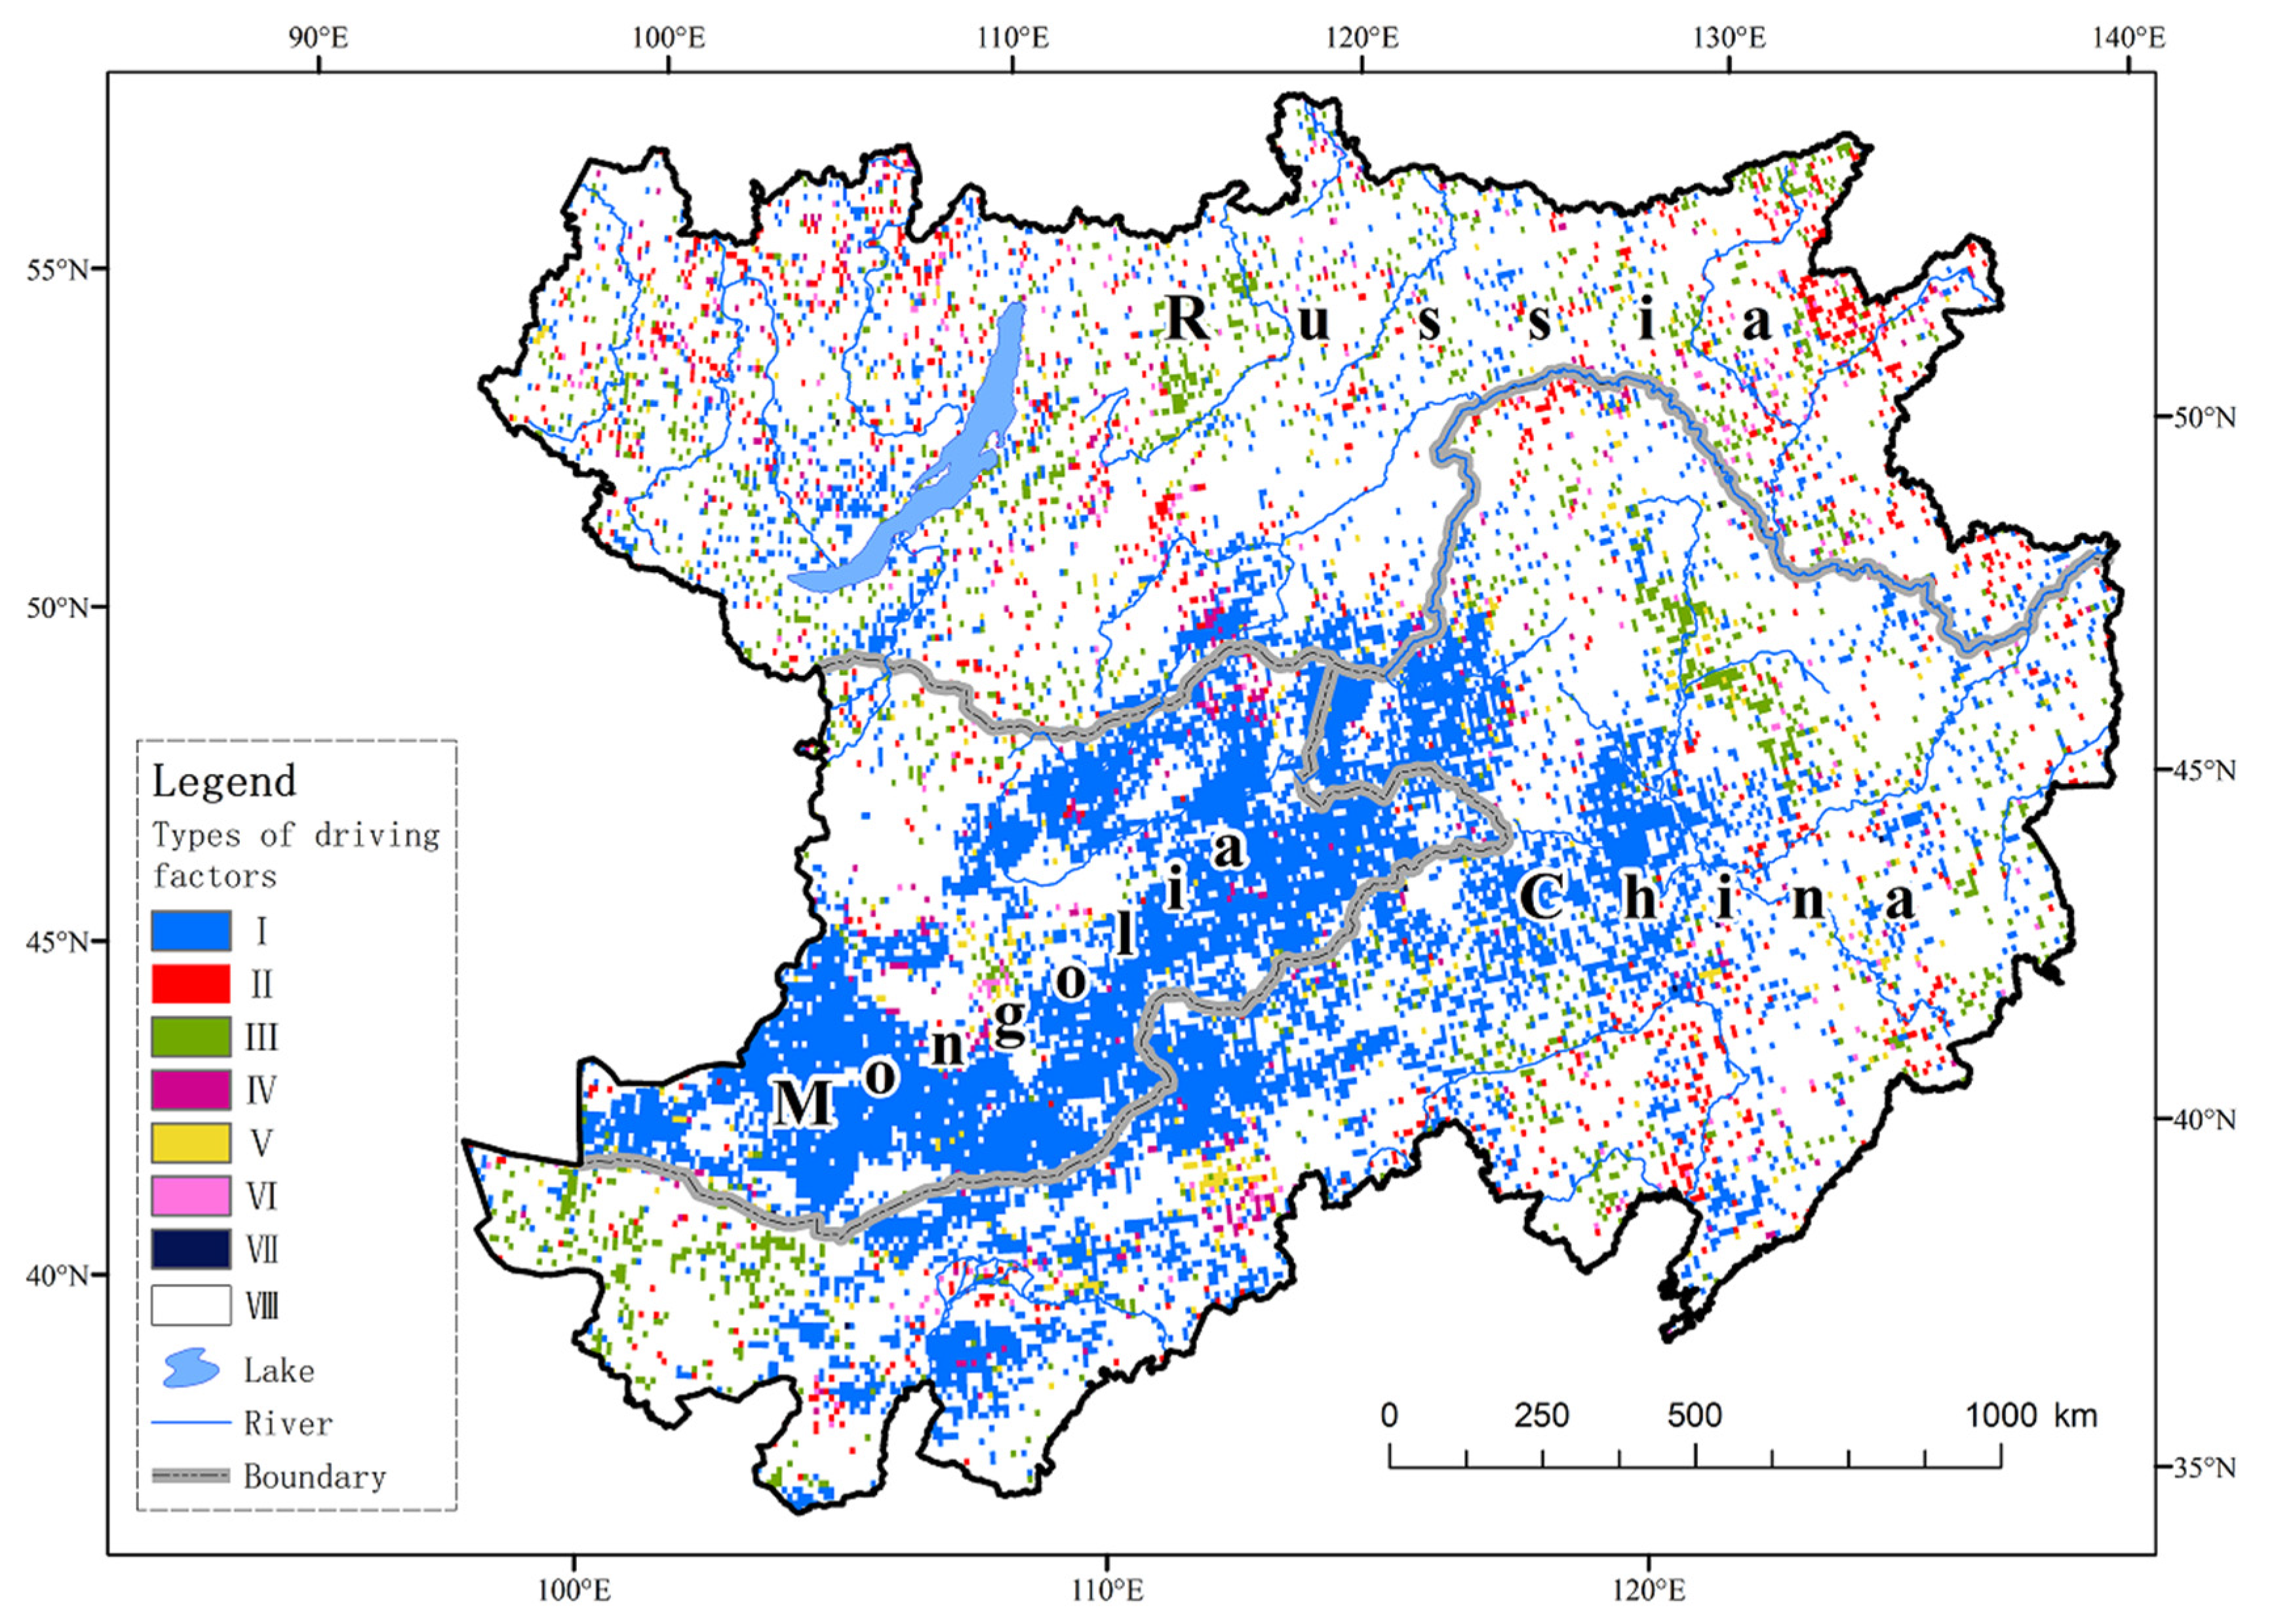
3.3.2. FVC Change Driving Type Classification

Based on the correlational analysis of FVC changes in CMREC during 2000–2020, we classified the driving factors of FVC change into eight categories, including seven climate-driven types and one non-climate-driven type (Table 3). Areas with significant partial correlation coefficients between FVC and the single climatic factor were identified as single-factor driving types (Type I, II, III). Regions with partial correlation coefficients insignificant and multiple correlation coefficients of dual climatic factors statistically significant were categorized as dual-factor driving types (Type IV, V, VI). Type VII was three-factor driving, with multiple correlation coefficients of three climatic factors significant, and that of dual climatic factors insignificant. Finally, a non-climate driving type (VIII) refers to the regions with all correlation coefficients insignificant.
Our studies show that areas with FVC changes driven by climatic factors accounted for approximately 28.2% of CMREC (Figure 10). Among the climate-driven types, Type I was dominant, with FVC changes driven by precipitation in 19.5% of the total. These areas are deserts and grasslands in arid or semi-arid regions, mostly distributed in eastern and southern Mongolia and north-central and eastern Inner Mongolia. In contrast, in humid and semi-humid regions, FVC changes were primarily driven by non-climatic factors because of the favorable natural condition for humankind’s survival. The argument is as follows: plant growth is highly dependent on precipitation in arid or semi-arid areas. Precipitation, however, is not a limiting factor in vegetation improvement for humid or semi-humid areas because abundant rainfall could offer more water than needed for essential plant growth.
Compared with precipitation, the driving effect of wind speed or temperature on FVC changes was relatively weak. Areas with FVC changes driven by wind speed (Type III) only accounted for 3.8% of the total. Overall, they scattered sparsely, with a slight concentration in southwestern Heilongjiang Province and the Badain Jaran Desert in western Inner Mongolia—flat regions with fewer elevation differences. Changes in surface roughness here involved hardly any factors except for vegetation. Therefore, vegetation was directly related to wind speed by affecting the near-surface friction, resulting in a significant correlation between wind speed and vegetation index.
Areas with FVC changes driven by temperature accounted for (Type II) 2.6% of CMREC and were more scattered in distribution than those dominated by Type I and Type III, with the largest cluster in Amur Oblast, Russia.
Compared with the three aforementioned types, areas with FVC changes driven by several climatic factors accounted for a much smaller proportion, totaling about 2.3%. Specifically, the areas with FVC changes driven by precipitation and temperature (Type IV), precipitation and wind speed (Type V), temperature and wind speed (Type VI) made up 0.8%, 1.0%, and 0.5% of the total, respectively. Thus, it was hard to find a large-scale area with FVC changes driven by multiple climatic factors in CMREC. Meanwhile, the regions where all climatic factors of precipitation, temperature, and wind speed jointly drove the FVC changes (Type VII) accounted for less than 0.1% of CMREC.

3.3.3. Relative Contribution to Significant Vegetation Change

For attribution of significant vegetation improvement, we used the first-difference multivariate regression method to discuss the relative contribution of the climatic or non-climatic impacts on significant FVC change (Figure 11). T F V C decomposed in this research passed the t-test, and the differences between T F V C and T F V C | C were determined using the two-sample t-test. We found that the effects of non-climatic factors on vegetation change are greater than those of climatic factors for most areas with a significant FVC increase during the past two decades.
Regions with the maximum climatic contribution were in eastern Inner Mongolia in China, Khentii Aimag, and Darhan-Uul Aimag in Mongolia (Figure 11a). In contrast, those with maximum non-climatic contribution were situated in western TPNC and the Hetao Plain in China (Figure 11b). Meanwhile, areas where climatic effects overweighed non-climatic effects ( R C N > 50 % ) were mainly located in eastern Inner Mongolia, northern TPNC in China, northern Mongolia, and scattered areas in Russia (Figure 11c).
Although non-climatic effects could not absolutely represent the influence of anthropogenic activities due to ignoring the more complex interactions such as synergistic or non-linear effects, the results of the relative contribution analysis here illustrated the magnitude of the direct effects of climatic factors and displayed the critical regions which might be deeply disturbed by human activities from 2000 to 2020, providing perspectives for the follow-up discussion about the impacts of anthropogenic activities on vegetation change in CMREC.

4. Discussion

Our study sheds light on the attribution of vegetation improvement in CMREC. Except for the large-scale areas with FVC changes driven by precipitation, non-climatic factors, especially government policy adjustments, afforestation and reclamation, agricultural technological advances, and other anthropogenic activities, were the primary driving forces in most CMREC [4,5,63]. Given the diversification of anthropogenic effects on regional vegetation distribution, we consider the comprehensive impacts of climatic and non-climatic factors when discussing the driving forces for the significant FVC change in CMREC.

4.1. Impact of Anthropogenic Activities on Vegetation Improvement

The vegetation improvement was most prominent in the Three Provinces in Northeast China (TPNC) and eastern Inner Mongolia in China for the whole CMREC during 2000–2020 (Figure 12). The increased precipitation explained the obvious greening in southeastern Inner Mongolia, western Jilin Province, and southwestern Heilongjiang Province in China (Figure 5b and Figure 6d). While for the rest areas with marked vegetation improvement, the obvious greening can be boiled down to anthropogenic activities.

4.1.1. Greening in TPNC

Northeast China is the largest commodity grain base in China and one of the world’s three black soil resources (Figure 12a,b). With the global “green revolution” initiated in the mid-20th century [64], effective agricultural measures such as hybrid cultivars, multiple cropping, fertilizer use, and farm mechanization have boosted the cropland expansion in Northeast China. Furthermore, the grain varieties’ structure and the regional planning have been continuously optimized to achieve high growth in grain output in the region, thereby increasing the vegetation coverage of cultivated land [65]. Consequently, the center of grain production in China has gradually shifted from the southwest to the northeast since 2000, resulting in the most significant adjustment of the national grain planting structure in Northeast China. Hence, the cropland area increased from 37.53 × 10⁴ km2 in 2001 to 38.04 × 10⁴ km2 in 2019 in Northeast China (Table 1).
When we discuss the forest coverage growing, it is unavoidable to mention the Three North Shelterbelt Program, a pioneering eco-construction work implemented by the Government of China, focusing on returning farmland to forest and grassland, essential for ecological restoration [66]. As a crucial component of this splendid project, the massive afforestation activities in TPNC are fruitful with forest area (including evergreen coniferous forest, deciduous coniferous forest, deciduous broadleaf forest, and mixed coniferous broadleaf forest) increasing by 0.88 × 10⁴ km2 from 2001 to 2019 in TPNC (Table 1).
Most notably, the growing areas of forests and croplands in TPNC were at the expense of grassland reduction from 10.10 × 10⁴ km2 in 2001 to 7.99 × 10⁴ km2 in 2019 (Table 1).

4.1.2. Greening in Inner Mongolia

The greening in Inner Mongolia is attributed to both climatic and anthropogenic factors. Here, we emphasize human-induced vegetation improvement in the irrigation areas, cities, sandy lands, and deserts.
The vegetation coverage has increased since the 2000s in the Hetao Plain, the traditional agricultural area and farming-pastoral transition zone in the upper reaches of the Yellow River (Figure 12c,d). The greening is the most significant in the Hetao Irrigation Area in southern Inner Mongolia. The local government proposed integrating green development into the irrigation district plan to deepen irrigation district reform and ecological water construction over the past two decades, especially since the 13th Five-Year Plan period (from 2016 to 2020). As a result, advances in crop structure and irrigation technology have been achieved, with the ecological environment well improved. At the same time, vegetation in cities with high population densities in the Hetao Plain has improved to a certain extent because of human activities. For example, in Ordos City, anthropogenic activities are considered the main reasons for the city’s reversal of desertification, with remarkable progress in forestry ecological construction (http://lcj.ordos.gov.cn/ (accessed on 16 December 2021)). Therefore, the vegetation index showed an upward trend of 0.06/10a in the Ordos as a whole [67].
Furthermore, the new desertification control model tailored to local conditions has been conducted in Inner Mongolia, famous for being home to four deserts and four sandy lands. We take the Mu Us Sandland and Hobq Desert as an example. Severe soil erosion and irrational human activities, such as overgrazing and over-reclaiming, exacerbated the region’s desertification before the 2000s [68,69]. When realizing the seriousness of the local ecological deterioration, the government carried out vigorous afforestation activities. On the one hand, creative sand-fixation technology has been developed, with sand-fixing vegetation and checkerboard sand-barriers widely used in the sand-protecting work [70,71]. These measures effectively improved the surface vegetation growth and played an essential role in suppressing the sand and dust.
On the other hand, the integrated model combining multiple sand control modes was applied in these sandy areas, including vegetation-engineering sand-fixing mode, sand industry mode, and photovoltaic industry mode [72]. Hence, eco-agriculture, sand-fixing forestry, and clean energy industry were developed on bulldozed sand dunes [73]. These sand control patterns took both ecological and economic benefits into account [74]. To date, the sandy areas in the Hobq Desert have sharply decreased from 45.76% to 28.66%, with the greening area of Mu Us Sandland reaching 93.24% owing to ecological restoration engineering [75,76]. The sand control experience in the Mu Us Sandland and Hobq Desert shows that sandland control strategies in the new era require scientific implementation and adaptation to local conditions.

4.2. Unsustainable Human-Induced Greening

Notwithstanding the greening in most CMREC, large areas of vegetation improvement boil down to anthropogenic activities, particularly afforestation, returning farmland to forests, and the planting structure adjustment. Thus, human-induced ecological restoration is unsustainable.
Firstly, the environment of CMREC is sensitive to climate change and vulnerable to extreme natural disasters, threatening vegetation growth [77]. The CMREC has long been plagued by a variety of disasters, such as widespread pest outbreaks [78], rodents [79,80], wildfires [81], and sandstorms [82]. Global warming has resulted in the growing frequency and intensity of extreme weather and climate events with abnormal hydrometeorological conditions [83]. For example, a severe sand and dust storm hit East Asia in the spring of 2021, leading to civilian casualties and massive losses of yurts, houses, and fences in Mongolia. This disaster was caused by persistent warming and drying conditions and a solid Mongolian Cyclone (https://public.wmo.int/en/media/news/severe-sand-and-dust-storm-hits-asia (accessed on 16 December 2021)). The projected climate in CMREC will continue warming with intensified extreme climate events [84], posing a threat to the region’s ecological security, particularly in arid and semi-arid regions, in the long run.
Secondly, as a vital commodity grain base, Northeast China faces the overdevelopment of the black soil area, resulting in the thinning of the black soil layer, the decline of soil organic matter, and the aggravation of soil salinization. Such problems, therefore, intensify soil function degradation and lead to severe soil erosion [85]. According to the China Soil and Water Conservation Bulletin in 2020, the soil erosion area of black soil in the northeast is 2.16 × 10⁵ km2, accounting for 19.86% of the total (http://www.mwr.gov.cn/sj/tjgb/zgstbcgb/202109/t20210930_1545971.html (accessed on 16 December 2021)). Hence, considering the unsustainability of the greening attributed to rapidly increasing cropland, the promotion of conservation tillage in black soil regions becomes imperative.
Furthermore, although afforestation projects such as the Three North Shelterbelt Program have significantly improved the vegetation coverage in northern China, the comprehensive effects are still nuanced [86]. Adverse outcomes have occurred, chiefly concentrated on shelter forest degradation, biodiversity decrease, and ecological migration [87]. Meanwhile, excessive human intervention leads to an ecological structural overshoot, exacerbating the regional drought due to previous anomalously marked increases in plant productivity [88]. These phenomena remind us to pay attention to the rapid extension of vegetation coverage in sandy land in Inner Mongolia, China. The water resources in the sandy areas are insufficient to carry out large-scale oasis development at present, which endangers the stability of the oasis ecosystem, sustainable agricultural development, and regional ecological security. Notably, the local governments or officials should be alert to the increasing forest coverage ratio, avoiding neglecting the potential ecological risk beneath the energetic landscape spontaneously.
Equally significantly, deserticulture, which is generally considered promising, is also a threat to the environment to some extent. Surging sandland exploitation is commonly accompanied by overutilization of water resources, resulting in excessive consumption of local ecological potential. For example, with some eco-agricultural industry promotion, Selenium-enriched watermelon has been widely cultivated in the sandland in Northwest China over the past two decades. However, this massive watermelon cultivation will accelerate the loss of soil water and fertility with increasing planting ages, exacerbating regional desertification and drought. As a result, the local governments have to give up or suspend such high-profit deserticulture (http://www.nxzw.gov.cn/xwzx/zwyw/202107/t20210706_2912539.html (accessed on 16 December 2021)). Therefore, according to the local conditions, entrepreneurs and peasants should cautiously exploit sandy land resources with scientific guidance, emphasizing future sustainability.

4.3. Prevention and Control of Desertification

Regional desertification is intensifying in CMREC, especially in Mongolia and Russia. Vegetation restoration and degradation are concurrent due to the combined effects of climate change and anthropogenic activities [20]. We found that climate change contributed to vegetation improvement, compared with the adverse effects of human activities on vegetation growth for Mongolia and Russia. The contribution pattern in the two countries is consistent with that in Central Asia [89,90]. The increasing precipitation is responsible for the vegetation restoration. However, since the local government has not issued effective decrees beneficial to vegetation restoration, vegetation coverage has declined sharply over the past two decades around the principal cities, the China–Mongolia–Russia Railway [91], or the Russia and Mongolia border territories [22]. Human factors, including overgrazing, rapid urbanization, deforestation, and unreasonable mineral mining, explain most land degradation [92,93]. The Mongolian government has established related policies, such as the “Green Great Wall” shelterbelt construction plan to enhance forest protection and desertification control in the early years [94]. These measurements, however, have not been achieved as expected, limited by the national economic strength to a large degree.
Simultaneously, there are also some unneglectable problems for the desertification prevention and control measures in China [95]. Existing desertification control measures are mainly state-led ecological projects, relying too much on the government. The short-term vegetation restoration takes “greening” as the main goal and breaks through the threshold of resource-carrying capacity [96]. Moreover, artificial vegetation sometimes cannot adapt to local natural conditions for the Three North Shelterbelt Program or the Returning Farmland to Forest/Grassland Program, with severe vegetation degradation occurring in some regions [97]. To solve these problems, the Chinese Government initiated the establishment of a new scheme of afforestation and grassland restoration based on the regional water resources’ bearing capacity, in accordance with the natural law of vegetation distribution.
In addition, straddling the borders of three countries, business cooperation and personnel exchange along the CMREC are frequent with cross-border disasters now and then, such as wildfire and sandstorms. Therefore, governmental efforts and enhanced international cooperation should focus on desertification control and regional sustainable development, especially in areas with apparent vegetation improvement induced by anthropogenic activities, to guarantee ecological security in the China–Mongolia–Russia Economic Corridor.

5. Conclusions

Our work provides new insights into the process and attribution of vegetation improvement at a cross-border scale. We constructed a driving factor identification system of FVC change to disclose the main driving forces of vegetation change in the China–Mongolia–Russia Economic Corridor (CMREC) during 2000–2020. This study uses the Linear Mixed Models to discuss the influence of climatic factors on vegetation distribution and employs the partial and multiple correlation coefficients to explore the attribution of vegetation change.
We detect the phenomena of vegetation improvement with an average FVC increase of 0.02/10a in CMREC over the past two decades, which can be explained chiefly by increasing precipitation and enhanced anthropogenic activities. The areas with climate-driven FVC changes account for 28.2% of the CMREC, with the most prominent greening (19.5%) of precipitation-driven distributing mainly in the Khentii Aimag in Mongolia, southeast Inner Mongolia, west Jilin Province, and southwest Heilongjiang Province in China. Meanwhile, the significant FVC change in more regions owes to non-climatic factors. Among these factors, anthropogenic activity is a double-edged sword to vegetation changes, particularly in most arid or semi-arid regions in CMREC. On the one hand, afforestation and agricultural development significantly improve the vegetation coverage in TPNC, eastern inner Mongolia, and the Hetao Irrigation District in China. On the other hand, human activities (i.e., overgrazing, deforestation, and urbanization) accelerate land degradation in some regions of CMREC, especially in Mongolia and Russia. Moreover, the ecological conservation and restoration projects and sandland exploitation which seemingly improve vegetation coverage are unsustainable in the long run.
Therefore, we must be alert to, and seriously deal with, the increasing greenness attributed to the overdevelopment of agriculture and deserticulture, with a long-lasting threat of extreme weather and climate events in a warming CMREC. Consequently, scientific desertification countermeasures and international cooperation should be strengthened to keep the vegetation improvement sustainable in CMREC.

Author Contributions

Conceptualization, X.L. and X.Z.; software, X.L. and X.Z.; formal analysis, X.L. and X.X.; data curation, X.L. and X.X.; writing, X.L. and X.Z.; and funding acquisition, X.Z. All authors have read and agreed to the published version of the manuscript.

Funding

This research was funded by the Strategic Priority Research Program of Chinese Academy of Sciences, Grant No. XDA20030203; and the Consultation and Evaluation Project of the Faculty of Chinese Academy of Sciences, Grant No. 2019-ZW09-A-032.

Data Availability Statement

Conflicts of Interest

The authors declare no conflict of interest.

References

  1. Zhu, Z.; Piao, S.; Myneni, R.B.; Huang, M.; Zeng, Z.; Canadell, J.G.; Ciais, P.; Sitch, S.; Friedlingstein, P.; Arneth, A.; et al. Greening of the Earth and Its Drivers. Nat. Clim. Chang. 2016, 6, 791–795. [Google Scholar] [CrossRef]
  2. Chen, Y.; Feng, X.; Tian, H.; Wu, X.; Gao, Z.; Feng, Y.; Piao, S.; Lv, N.; Pan, N.; Fu, B. Accelerated Increase in Vegetation Carbon Sequestration in China after 2010: A Turning Point Resulting from Climate and Human Interaction. Glob. Chang. Biol. 2021, 27, 5848–5864. [Google Scholar] [CrossRef] [PubMed]
  3. Song, X.P.; Hansen, M.C.; Stehman, S.V.; Potapov, P.V.; Tyukavina, A.; Vermote, E.F.; Townshend, J.R. Global Land Change from 1982 to 2016. Nature 2018, 560, 639–643. [Google Scholar] [CrossRef] [PubMed]
  4. Liu, H.; Gong, P.; Wang, J.; Wang, X.; Ning, G.; Xu, B. Production of Global Daily Seamless Data Cubes and Quantification of Global Land Cover Change from 1985 to 2020—IMap World 1.0. Remote Sens. Environ. 2021, 258, 112364. [Google Scholar] [CrossRef]
  5. Chen, C.; Park, T.; Wang, X.; Piao, S.; Xu, B.; Chaturvedi, R.K.; Fuchs, R.; Brovkin, V.; Ciais, P.; Fensholt, R.; et al. China and India Lead in Greening of the World through Land-Use Management. Nat. Sustain. 2019, 2, 122–129. [Google Scholar] [CrossRef] [PubMed]
  6. Piao, S.; Wang, X.; Park, T.; Chen, C.; Lian, X.; He, Y.; Bjerke, J.W.; Chen, A.; Ciais, P.; Tømmervik, H.; et al. Characteristics, Drivers and Feedbacks of Global Greening. Nat. Rev. Earth Environ. 2020, 1, 14–27. [Google Scholar] [CrossRef]
  7. Piao, S.; Huang, M.; Liu, Z.; Wang, X.; Ciais, P.; Canadell, J.G.; Wang, K.; Bastos, A.; Friedlingstein, P.; Houghton, R.A.; et al. Lower Land-Use Emissions Responsible for Increased Net Land Carbon Sink during the Slow Warming Period. Nat. Geosci. 2018, 11, 739–743. [Google Scholar] [CrossRef] [Green Version]
  8. Rouse, J.W.; Haas, R.W.; Schell, J.A.; Deering, D.W.; Harlan, J.C. Monitoring the Vernal Advancement and Retrogradation (Green Wave Effect) of Natural Vegetation. In Greenbelt, MD: NASA/GSFC Type III, Final Report; Texas A&M University: College Station, TX, USA, 1974. [Google Scholar]
  9. Overpeck, J.T.; Rind, D.; Goldberg, R. Climate-Induced Changes in Forest Disturbance and Vegetation. Nature 1990, 343, 51–53. [Google Scholar] [CrossRef]
  10. Theurillat, J.P.; Guisan, A. Potential Impact of Climate Change on Vegetation in the European Alps: A Review. Clim. Chang. 2001, 50, 77–109. [Google Scholar] [CrossRef]
  11. Fan, X.; Liu, Y.; Tao, J.; Wang, Y.; Zhou, H. MODIS Detection of Vegetation Changes and Investigation of Causal Factors in Poyang Lake Basin, China for 2001–2015. Ecol. Indic. 2018, 91, 511–522. [Google Scholar] [CrossRef]
  12. Ichii, K.; Kawabata, A.; Yamaguchi, Y. Global Correlation Analysis for NDVI and Climatic Variables and NDVI Trends: 1982–1990. Int. J. Remote Sens. 2002, 23, 3873–3878. [Google Scholar] [CrossRef]
  13. Piao, S.; Cui, M.; Chen, A.; Wang, X.; Ciais, P.; Liu, J.; Tang, Y. Altitude and Temperature Dependence of Change in the Spring Vegetation Green-up Date from 1982 to 2006 in the Qinghai-Xizang Plateau. Agric. For. Meteorol. 2011, 151, 1599–1608. [Google Scholar] [CrossRef]
  14. Sun, Y.; Yang, Y.; Zhang, L.; Wang, Z. The Relative Roles of Climate Variations and Human Activities in Vegetation Change in North China. Phys. Chem. Earth Parts A/B/C 2015, 87–88, 67–78. [Google Scholar] [CrossRef]
  15. Gao, Q.; Schwartz, M.; Zhu, W.; Wan, Y.; Qin, X.; Ma, X.; Liu, S.; Williamson, M.; Peters, C.; Li, Y. Changes in Global Grassland Productivity during 1982 to 2011 Attributable to Climatic Factors. Remote Sens. 2016, 8, 384. [Google Scholar] [CrossRef] [Green Version]
  16. Piao, S.; Fang, J.; Ji, W.; Guo, Q.; Ke, J.; Tao, S. Variation in a Satellite-Based Vegetation Index in Relation to Climate in China. J. Veg. Sci. 2004, 15, 219–226. [Google Scholar] [CrossRef]
  17. Dong, S.; Yang, Y.; Li, F.; Cheng, H.; Li, J.; Bilgaev, A.; Li, Z.; Li, Y. An Evaluation of the Economic, Social, and Ecological Risks of China-Mongolia-Russia High-Speed Railway Construction and Policy Suggestions. J. Geogr. Sci. 2018, 28, 900–918. [Google Scholar] [CrossRef] [Green Version]
  18. Wu, S.; Liu, L.; Liu, Y.; Gao, J.; Dai, E.; Feng, A.; Wang, W. The Belt and Road: Geographical Pattern and Regional Risks. J. Geogr. Sci. 2019, 29, 483–495. [Google Scholar] [CrossRef] [Green Version]
  19. Gao, J.; Jiao, K.; Wu, S. Investigating the Spatially Heterogeneous Relationships between Climate Factors and NDVI in China during 1982 to 2013. J. Geogr. Sci. 2019, 29, 1597–1609. [Google Scholar] [CrossRef] [Green Version]
  20. Miao, L.; Sun, Z.; Ren, Y.; Schierhorn, F.; Müller, D. Grassland Greening on the Mongolian Plateau despite Higher Grazing Intensity. Land Degrad. Dev. 2021, 32, 792–802. [Google Scholar] [CrossRef]
  21. Boori, M.S.; Choudhary, K.; Kupriyanov, A. Detecting Vegetation Drought Dynamics in European Russia. Geocarto. Int. 2020. [Google Scholar] [CrossRef]
  22. Sodnomov, B.V.; Ayurzhanaev, A.A.; Tsydypov, B.Z.; Zharnikova, M.A.; Batomunkuev, V.S.; Zh Garmaev, E. Vegetation Cover Dynamics of Russia and Mongolia Border Territories. IOP Conf. Ser. Earth Environ. Sci. 2019, 320, 012028. [Google Scholar] [CrossRef]
  23. Huete, A.; Didan, K.; Miura, T.; Rodriguez, E.P.; Gao, X.; Ferreira, L.G. Overview of the Radiometric and Biophysical Performance of the MODIS Vegetation Indices. Remote Sens. Environ. 2002, 83, 195–213. [Google Scholar] [CrossRef]
  24. Wang, Z.X.; Liu, C.; Huete, A. From AVHRR-NDVI to MODIS-EVI: Advances in Vegetation Index Research. Acta Ecol. Sin. 2003, 23, 979–987. [Google Scholar]
  25. Guo, N. Vegetation Index and Its Advances. Arid Meteorol. 2003, 21, 71–75. [Google Scholar]
  26. Kaufman, Y.J.; Tanre, D. Atmospherically Resistant Vegetation Index (ARVI) for EOS-MODIS. IEEE Trans. Geosci. Remote Sens. 1992, 30, 261–270. [Google Scholar] [CrossRef]
  27. Huete, A.R. A Soil-Adjusted Vegetation Index (SAVI). Remote Sens. Environ. 1988, 25, 295–309. [Google Scholar] [CrossRef]
  28. Qi, J.; Chehbouni, A.; Huete, A.R.; Kerr, Y.H.; Sorooshian, S. A Modified Soil Adjusted Vegetation Index. Remote Sens. Environ. 1994, 48, 119–126. [Google Scholar] [CrossRef]
  29. Liu, H.; Huete, A. A Feedback Based Modification of the NDVI to Minimize Canopy Background and Atmospheric Noise. IEEE Trans. Geosci. Remote Sens. 1995, 33, 457–465. [Google Scholar] [CrossRef]
  30. Chen, P.Y.; Fedosejevs, G.; Tiscareno-Lopez, M.; Arnold, J.G. Assessment of MODIS-EVI, MODIS-NDVI and VEGETATION-NDVI Composite Data Using Agricultural Measurements: An Example at Corn Fields in Western Mexico. Environ. Monit. Assess. 2006, 119, 69–82. [Google Scholar] [CrossRef]
  31. Adegoke, J.O.; Carleton, A.M. Relations between Soil Moisture and Satellite Vegetation Indices in the U.S. Corn Belt. J. Hydrometeorol. 2002, 3, 395–404. [Google Scholar] [CrossRef] [Green Version]
  32. Chen, Y.H.; Li, X.B.; Shi, P.J. Variation in NDVI Driven by Climate Factors across China, 1983–1992. Acta Phytoecol. Sin. 2001, 25, 716–720. [Google Scholar]
  33. Piao, S.; Nan, H.; Huntingford, C.; Ciais, P.; Friedlingstein, P.; Sitch, S.; Peng, S.; Ahlström, A.; Canadell, J.G.; Cong, N.; et al. Evidence for a Weakening Relationship between Interannual Temperature Variability and Northern Vegetation Activity. Nat. Commun. 2014, 5, 5018. [Google Scholar] [CrossRef] [PubMed] [Green Version]
  34. Wen, Y.; Liu, X.; Xin, Q.; Wu, J.; Xu, X.; Pei, F.; Li, X.; Du, G.; Cai, Y.; Lin, K.; et al. Cumulative Effects of Climatic Factors on Terrestrial Vegetation Growth. J. Geophys. Res. Biogeosci. 2019, 124, 789–806. [Google Scholar] [CrossRef]
  35. Measho, S.; Chen, B.; Trisurat, Y.; Pellikka, P.; Guo, L.; Arunyawat, S.; Tuankrua, V.; Ogbazghi, W.; Yemane, T. Spatio-Temporal Analysis of Vegetation Dynamics as a Response to Climate Variability and Drought Patterns in the Semiarid Region, Eritrea. Remote Sens. 2019, 11, 724. [Google Scholar] [CrossRef] [Green Version]
  36. Hersbach, H.; Bell, B.; Berrisford, P.; Hirahara, S.; Horányi, A.; Muñoz-Sabater, J.; Nicolas, J.; Peubey, C.; Radu, R.; Schepers, D.; et al. The ERA5 Global Reanalysis. Q. J. R. Meteorol. Soc. 2020, 146, 1999–2049. [Google Scholar] [CrossRef]
  37. Friedl, M.A.; McIver, D.K.; Hodges, J.C.F.; Zhang, X.Y.; Muchoney, D.; Strahler, A.H.; Woodcock, C.E.; Gopal, S.; Schneider, A.; Cooper, A.; et al. Global Land Cover Mapping from MODIS: Algorithms and Early Results. Remote Sens. Environ. 2002, 83, 287–302. [Google Scholar] [CrossRef]
  38. Loveland, T.R.; Reed, B.C.; Brown, J.F.; Ohlen, D.O.; Zhu, Z.; Yang, L.; Merchant, J.W. Development of a Global Land Cover Characteristics Database and IGBP DISCover from 1 km AVHRR Data. Int. J. Remote Sens. 2000, 21, 1303–1330. [Google Scholar] [CrossRef]
  39. Schielzeth, H. Simple Means to Improve the Interpretability of Regression Coefficients. Methods Ecol. Evol. 2010, 1, 103–113. [Google Scholar] [CrossRef]
  40. Fisher, R.A. The General Sampling Distribution of the Multiple Correlation Coefficient. Proc. R. Soc. Lond. A 1928, 121, 654–673. [Google Scholar] [CrossRef] [Green Version]
  41. McArdle, B.H. The Structural Relationship: Regression in Biology. Can. J. Zool. 1988, 66, 2329–2339. [Google Scholar] [CrossRef]
  42. Pinheiro, J.C.; Bates, D.M. Mixed-Effects Models in S and S-PLUS; Statistics and Computing; Springer: New York, NY, USA, 2000; ISBN 978-0-387-98957-0. [Google Scholar]
  43. Bates, D.; Mächler, M.; Bolker, B.; Walker, S. Fitting Linear Mixed-Effects Models Using Lme4. Stat. Comput. 2014, 1406, 133–199. [Google Scholar] [CrossRef]
  44. R Development Core Team. R: A Language and Environment for Statistical Computing; R Development Core Team: Vienna, Austria, 2015. [Google Scholar]
  45. Shapiro, S.S.; Wilk, M.B. An Analysis of Variance Test for Normality (Complete Samples). Biometrika 1965, 52, 591–611. [Google Scholar] [CrossRef]
  46. Wilks, D.S. Statistical Methods in the Atmospheric Sciences, 3rd ed.; International geophysics series; Elsevier: Amsterdam, The Netherlands; Academic Press: Cambridge, MA, USA, 2011; ISBN 978-0-12-385022-5. [Google Scholar]
  47. Nicholls, N. Increased Australian Wheat Yield Due to Recent Climate Trends. Nature 1997, 387, 484–485. [Google Scholar] [CrossRef]
  48. Chen, J.; Liu, Y.; Zhou, W.; Zhang, J.; Pan, T. Effects of Climate Change and Crop Management on Changes in Rice Phenology in China from 1981 to 2010. J. Sci. Food Agric. 2021, 101, 6311–6319. [Google Scholar] [CrossRef]
  49. Dwyer, J.; Schmidt, G. The MODIS Reprojection Tool. In Earth Science Satellite Remote Sensing; Qu, J.J., Gao, W., Kafatos, M., Murphy, R.E., Salomonson, V.V., Eds.; Springer: Berlin/Heidelberg, Germany, 2006; pp. 162–177. ISBN 978-3-540-35630-1. [Google Scholar]
  50. Holben, B.N. Characteristics of Maximum-Value Composite Images from Temporal AVHRR Data. Int. J. Remote Sens. 1986, 7, 1417–1434. [Google Scholar] [CrossRef]
  51. Liang, S.; Li, X.; Wang, J. (Eds.) Chapter 13—Fractional Vegetation Cover. In Advanced Remote Sensing; Academic Press: Boston, MA, USA, 2012; pp. 415–438. ISBN 978-0-12-385954-9. [Google Scholar]
  52. Carlson, T.N.; Ripley, D.A. On the Relation between NDVI, Fractional Vegetation Cover, and Leaf Area Index. Remote Sens. Environ. 1997, 62, 241–252. [Google Scholar] [CrossRef]
  53. Batjargal, Z. Desertification in Mongolia. RALA Rep. 1997, 200, 107–113. [Google Scholar]
  54. Guo, X.; Chen, R.; Thomas, D.S.G.; Li, Q.; Xia, Z.; Pan, Z. Divergent Processes and Trends of Desertification in Inner Mongolia and Mongolia. Land Degrad. Dev. 2021, 32, 3684–3697. [Google Scholar] [CrossRef]
  55. Lee, J.-J.; Kim, C.-H. Roles of Surface Wind, NDVI and Snow Cover in the Recent Changes in Asian Dust Storm Occurrence Frequency. Atmos. Environ. 2012, 59, 366–375. [Google Scholar] [CrossRef]
  56. Jackson, S.T.; Lyford, M.E. Pollen Dispersal Models in Quaternary Plant Ecology: Assumptions, Parameters, and Prescriptions. Bot. Rev 1999, 65, 39–75. [Google Scholar] [CrossRef]
  57. Loubet, B.; Cellier, P.; Génermont, S.; Flura, D. An Evaluation of the Wind-Tunnel Technique for Estimating Ammonia Volatilization from Land: Part 2. Influence of the Tunnel on Transfer Processes. J. Agric. Eng. Res. 1999, 72, 83–92. [Google Scholar] [CrossRef]
  58. Lei, L.; Zhang, K.; Zhang, X.; Wang, Y.; Xia, J.; Piao, S.; Hui, D.; Zhong, M.; Ru, J.; Zhou, Z.; et al. Plant Feedback Aggravates Soil Organic Carbon Loss Associated With Wind Erosion in Northwest China. J. Geophys. Res. Biogeosci. 2019, 124, 825–839. [Google Scholar] [CrossRef]
  59. Woodruff, N.P.; Siddoway, F.H. A Wind Erosion Equation. Soil Sci. Soc. Am. J. 1965, 29, 602–608. [Google Scholar] [CrossRef]
  60. Wu, C.; Wang, J.; Ciais, P.; Peñuelas, J.; Zhang, X.; Sonnentag, O.; Tian, F.; Wang, X.; Wang, H.; Liu, R.; et al. Widespread Decline in Winds Delayed Autumn Foliar Senescence over High Latitudes. Proc. Natl. Acad. Sci. USA 2021, 118, e2015821118. [Google Scholar] [CrossRef] [PubMed]
  61. Schlesinger, W.H.; Reynolds, J.F.; Cunningham, G.L.; Huenneke, L.F.; Jarrell, W.M.; Virginia, R.A.; Whitford, W.G. Biological Feedbacks in Global Desertification. Science 1990, 247, 1043–1048. [Google Scholar] [CrossRef] [PubMed] [Green Version]
  62. Ravi, S.; D’Odorico, P.; Breshears, D.D.; Field, J.P.; Goudie, A.S.; Huxman, T.E.; Li, J.; Okin, G.S.; Swap, R.J.; Thomas, A.D.; et al. Aeolian Processes and the Biosphere. Rev. Geophys. 2011, 49, RG3001. [Google Scholar] [CrossRef] [Green Version]
  63. Lü, Y.; Zhang, L.; Feng, X.; Zeng, Y.; Fu, B.; Yao, X.; Li, J.; Wu, B. Recent Ecological Transitions in China: Greening, Browning and Influential Factors. Sci. Rep. 2015, 5, 8732. [Google Scholar] [CrossRef] [PubMed]
  64. Jain, H.K. Green Revolution: History, Impact and Future; Studium Press LLC: Houston, TX, USA, 2010; ISBN 978-1-4416-7448-7. [Google Scholar]
  65. Zhang, Y.; Peng, C.; Li, W.; Tian, L.; Zhu, Q.; Chen, H.; Fang, X.; Zhang, G.; Liu, G.; Mu, X.; et al. Multiple Afforestation Programs Accelerate the Greenness in the ‘Three North’ Region of China from 1982 to 2013. Ecol. Indic. 2016, 61, 404–412. [Google Scholar] [CrossRef]
  66. Wang, Q.; Zhang, B.; Zhang, Z.; Zhang, X.; Dai, S. The Three-North Shelterbelt Program and Dynamic Changes in Vegetation Cover. J. Resour. Ecol. 2014, 5, 53–59. [Google Scholar] [CrossRef]
  67. Zhao, C.W.; Yan, Y.G.; Guo, W.; Gao, S.Q. Analysis of Vegetation Dynamics and Driving Forces in Ordos: 2000–2019. Ecol. Econ. 2020, 16, 4–17. [Google Scholar]
  68. Bao, X.; Chen, Q. Desert Eroded Situation and Its Reform Composition in the Kubuqi Region. Res. Soil Water Conserv. 1998, 5, 26–29. [Google Scholar]
  69. Wu, B.; Ci, L.J. Landscape Change and Desertification Development in the Mu Us Sandland, Northern China. J. Arid Environ. 2002, 50, 429–444. [Google Scholar] [CrossRef]
  70. Qu, J.; Zu, R.; Zhang, K.; Fang, H. Field Observations on the Protective Effect of Semi-Buried Checkerboard Sand Barriers. Geomorphology 2007, 88, 193–200. [Google Scholar] [CrossRef]
  71. Wang, S.; Zhang, B.; Xie, G.; Zhai, X.; Sun, H. Vegetation Cover Changes and Sand-Fixing Service Responses in the Beijing–Tianjin Sandstorm Source Control Project Area. Environ. Dev. 2020, 34, 100455. [Google Scholar] [CrossRef]
  72. Guo, C.Y.; Han, Z.W.; Ai-Min, L.I.; Zhong, S. The Typical Models of Ecological Management and Development and Utilization in the Hobq Desert. J. Northwest Norm. Univ. (Nat. Sci.) 2017, 53, 112–118. [Google Scholar]
  73. Wang, N.; Xie, J.; Han, J. A Sand Control and Development Model in Sandy Land Based on Mixed Experiments of Arsenic Sandstone and Sand: A Case Study in Mu Us Sandy Land in China. Chin. Geogr. Sci. 2013, 23, 700–707. [Google Scholar] [CrossRef] [Green Version]
  74. Wang, R.; Wu, X. New Pattern to Control Mu Us Sandland. Res. Soil Water Conserv. 2009, 16, 176–180. [Google Scholar]
  75. Cui, Y. Interpretation and Dynamic Analysis in Desertification—A Case Study of Kubuqi Desert. Appl. Mech. Mater. 2013, 295, 2102–2106. [Google Scholar] [CrossRef]
  76. Wang, G.; Zhao, B.; Li, Y. Mu Us Desert Is about to “Disappear” from Shaanxi. Shaanxi Daily, 23 April 2020. [Google Scholar]
  77. Ippolito, A.; Sala, S.; Faber, J.H.; Vighi, M. Ecological Vulnerability Analysis: A River Basin Case Study. Sci. Total Environ. 2010, 408, 3880–3890. [Google Scholar] [CrossRef]
  78. Hong, J.; Yi-Fei, N.I.; Gui-Lin, D.U.; Yun, X.J. Current Situation and Cause Analysis of Grassland Pests on Grassland in China. Pratacult. Sci. 2014, 31, 1374–1379. [Google Scholar]
  79. Su, J.; Liu, R.T.; Wei-Hong, J.I.; Jiao, T.; Cai, Z.S.; Hua, L.M. Stages and Characteristics of Grassland Rodent Pests Control and Research in China. Pratacult. Sci. 2013, 30, 1116–1123. [Google Scholar]
  80. Zhong, W.Q.; Zhou, Q.Q.; Sun, C.L. The Basic Characteristics of the Rodent Pests on the Pasture in Inner Mongolia and Its Ecological Strategies of Controlling. Acta Theriol. Sin. 1985, 5, 241–249. [Google Scholar]
  81. Malevsky-Malevich, S.P.; Molkentin, E.K.; Nadyozhina, E.D.; Shklyarevich, O.B. An Assessment of Potential Change in Wildfire Activity in the Russian Boreal Forest Zone Induced by Climate Warming during the Twenty-First Century. Clim. Chang. 2008, 86, 463–474. [Google Scholar] [CrossRef]
  82. Han, J.; Dai, H.; Gu, Z. Sandstorms and Desertification in Mongolia, an Example of Future Climate Events: A Review. Environ. Chem. Lett. 2021, 19, 4063–4073. [Google Scholar] [CrossRef] [PubMed]
  83. Meehl, G.A.; Zwiers, F.; Evans, J.; Knutson, T.; Mearns, L.; Whetton, P. Trends in Extreme Weather and Climate Events: Issues Related to Modeling Extremes in Projections of Future Climate Change. Bull. Am. Meteorol. Soc. 2000, 81, 427–436. [Google Scholar] [CrossRef] [Green Version]
  84. Luber, G.; McGeehin, M. Climate Change and Extreme Heat Events. Am. J. Prev. Med. 2008, 35, 429–435. [Google Scholar] [CrossRef]
  85. Qu, Y.; Pan, C.; Guo, H. Factors Affecting the Promotion of Conservation Tillage in Black Soil—The Case of Northeast China. Sustainability 2021, 13, 9563. [Google Scholar] [CrossRef]
  86. Bryan, B.A.; Gao, L.; Ye, Y.; Sun, X.; Connor, J.D.; Crossman, N.D.; Stafford-Smith, M.; Wu, J.; He, C.; Yu, D.; et al. China’s Response to a National Land-System Sustainability Emergency. Nature 2018, 559, 193–204. [Google Scholar] [CrossRef]
  87. Huang, S.; Kong, J. Assessing Land Degradation Dynamics and Distinguishing Human-Induced Changes from Climate Factors in the Three-North Shelter Forest Region of China. IJGI 2016, 5, 158. [Google Scholar] [CrossRef] [Green Version]
  88. Zhang, Y.; Keenan, T.F.; Zhou, S. Exacerbated Drought Impacts on Global Ecosystems Due to Structural Overshoot. Nat. Ecol. Evol. 2021, 5, 1490–1498. [Google Scholar] [CrossRef]
  89. de Beurs, K.M.; Wright, C.K.; Henebry, G.M. Dual Scale Trend Analysis for Evaluating Climatic and Anthropogenic Effects on the Vegetated Land Surface in Russia and Kazakhstan. Environ. Res. Lett. 2009, 4, 045012. [Google Scholar] [CrossRef]
  90. Chen, T.; Bao, A.; Jiapaer, G.; Guo, H.; Zheng, G.; Jiang, L.; Chang, C.; Tuerhanjiang, L. Disentangling the Relative Impacts of Climate Change and Human Activities on Arid and Semiarid Grasslands in Central Asia during 1982–2015. Sci. Total Environ. 2019, 653, 1311–1325. [Google Scholar] [CrossRef] [PubMed]
  91. Liang, X.; Li, P.; Wang, J.; Shun Chan, F.K.; Togtokh, C.; Ochir, A.; Davaasuren, D. Research Progress of Desertification and Its Prevention in Mongolia. Sustainability 2021, 13, 6861. [Google Scholar] [CrossRef]
  92. Filei, A.A.; Slesarenko, L.A.; Boroditskaya, A.V.; Mishigdorj, O. Analysis of Desertification in Mongolia. Russ. Meteorol. Hydrol. 2018, 43, 599–606. [Google Scholar] [CrossRef]
  93. Wang, J.; Wei, H.; Cheng, K.; Li, G.; Ochir, A.; Bian, L.; Davaasuren, D.; Chonokhuu, S.; Nasanbat, E. Spatio-Temporal Pattern of Land Degradation along the China-Mongolia Railway (Mongolia). Sustainability 2019, 11, 2705. [Google Scholar] [CrossRef] [Green Version]
  94. The World Bank. Mongolia—Lessons from Tree Planting Initiatives; The World Bank: Washington, DC, USA, 2010. [Google Scholar]
  95. Wang, J.; Wei, H.; Song, J.; Wang, H.; Bu, K. Implementation of the Informatization Application Scenario for Prevention and Control of Desertification in the China-Mongolia-Russia Economic Corridor of the Belt and Road Initiative—Taking the China-Mongolia Railway (Mongolia Section) as an Example. In China’s e-Science Blue Book 2020; Chinese Academy of Sciences, Cyberspace Administration of China, Ministry of Education of the PRC, Ministry of Science and Technology of the PRC, China Association for Science and Technology, Chinese Academy of Social Sciences, National Natural Science Foundation of China, Chinese Academy of Agricultural Sciences, Eds.; Springer: Singapore, 2021; pp. 335–357. ISBN 9789811583414. [Google Scholar]
  96. Suo, X.; Cao, S. China’s Three North Shelter Forest Program: Cost–Benefit Analysis and Policy Implications. Environ. Dev. Sustain. 2021, 23, 14605–14618. [Google Scholar] [CrossRef]
  97. Zhu, J.; Song, L. A Review of Ecological Mechanisms for Management Practices of Protective Forests. J. For. Res. 2021, 32, 435–448. [Google Scholar] [CrossRef]
Figure 1. Topographic map of CMREC located at the junction of China, Mongolia, and Russia.
Remotesensing 14 00187 g001
Figure 2. MODIS data processing flow (a) and EVI data filter (b).
Remotesensing 14 00187 g002
Figure 3. The annual average EVI distribution in CMREC from 2000 to 2020.
Remotesensing 14 00187 g003
Figure 4. Distribution of FVC (a) and division of desertification degree (b) in CMREC from 2000 to 2020.
Remotesensing 14 00187 g004
Figure 5. The variation of regional average FVC (a) and the spatial distribution of FVC change (b) in CMREC from 2000 to 2020.
Remotesensing 14 00187 g005
Figure 6. Average distribution and variation of air temperature (a,b), precipitation (c,d), and wind speed (e,f) in CMREC during 2000–2020.
Remotesensing 14 00187 g006
Figure 7. Land cover in 2001 (a) and 2019 (b), and the land cover change (c) from 2001 to 2019 in CMREC.
Remotesensing 14 00187 g007
Figure 8. Spatial distribution of partial correlation coefficients between FVC and air temperature (a), precipitation (b), and wind speed (c) in CMREC from 2000 to 2020.
Remotesensing 14 00187 g008
Figure 9. The spatial distribution of multiple correlation coefficients between FVC and (a) precipitation & temperature, (b) precipitation & wind speed, (c) temperature & wind speed, and (d) precipitation & temperature–wind speed in CMREC from 2000 to 2020.
Remotesensing 14 00187 g009
Figure 10. Spatial distribution of driving types of FVC changes in CMREC during 2000–2020. There are eight driving types, including seven climate-driven and one non-climate driven.
Remotesensing 14 00187 g010
Figure 11. The relative contribution of climatic (a) and non-climatic (b) factors to significant vegetation change and their comparison (c).
Remotesensing 14 00187 g011
Figure 12. The FVC and land cover change in TPNC (a,b) and the Hetao Irrigation (c,d). This figure is extracted from Figure 5 and Figure 7, representing vegetation and anthropogenic activities change in these significantly greening areas.
Remotesensing 14 00187 g012
Table 1. Forest, cropland, and grassland changes in TPNC from 2001 to 2019.
Vegetation Cover2001 (km2)2019 (km2)Difference (km2)
Evergreen Needleleaf Forests8.531.022.5
Deciduous Needleleaf Forests0.29 × 1040.31 × 104194.7
Deciduous Broadleaf Forests19.86 × 10420.50 × 1040.64 × 104
Mixed Forests3.03 × 1043.25 × 1040.22 × 104
Croplands37.53 × 10438.04 × 1040.51 × 104
Grasslands10.10 × 1047.99 × 1042.09 × 104
Table 2. Result of LMMs analysis in CMREC from 2000 to 2020, where the precipitation, temperature, and wind speed are explanatory variables; time and location are random intercepts.
Explanatory VariablesPrecipitationAir TemperatureWind SpeedIntercept
Coefficient0.00040.0005−0.04290.4241
Sum of square (SS)10,07215336Residual
4794
Contribution (p = SS/SST)68.3%0.1%2.1%29.6%
Table 3. The proportion of different driving types of vegetation change in CMREC and the classification criteria based on the partial and multiple correlation coefficients.
TypesDriving Factors 1ProportionClassification Indicators
Partial Correlation CoefficientMultiple Correlation Coefficient
RE-PRE-TRE-WRE-PTRE-PWRE-TWRE-PTW
IPrecipitation19.5%t > t0.05
IITemperature2.6% t > t0.05
IIIWind speed3.8% t > t0.05
IVPrecipitation, Temperature0.8%t < t0.05F > F0.05F < F0.05 or F < FE-PTF < F0.05 or F < FE-PT
VPrecipitation, Wind speed1.0%F < F0.05 or F < FE-PWF > F0.05F < F0.05 or F < FE-PW
VITemperature, Wind speed0.5%F < F0.05F < F0.05 or F < FE-TWF > F0.05
VIIPrecipitation, Temperature, Wind speed<0.1%F < F0.05F > F0.05
VIIINon-climatic factors71.7%F < F0.05
1 The climatic factors in the same type are in no particular order. RE-P, RE-T, RE-W are the partial correlation coefficient between FVC and precipitation, temperature, wind speed. RE-PT, RE-PW, RE-TW, and RE-PTW are the multiple correlation coefficients between FVC and precipitation–temperature, temperature–wind speed, precipitation–wind speed, and precipitation–temperature–wind speed, respectively.
Publisher’s Note: MDPI stays neutral with regard to jurisdictional claims in published maps and institutional affiliations.

