Article

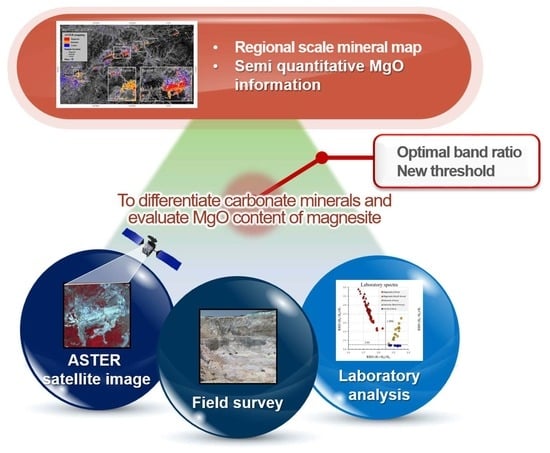
Application of ASTER Data for Differentiating Carbonate Minerals and Evaluating MgO Content of Magnesite in the Jiao-Liao-Ji Belt, North China Craton

Korea Institute of Geoscience and Mineral Resources, Daejeon 34132, Korea
*
Author to whom correspondence should be addressed.
Remote Sens. 2022, 14(1), 181; https://doi.org/10.3390/rs14010181
Submission received: 26 November 2021 / Revised: 17 December 2021 / Accepted: 24 December 2021 / Published: 1 January 2022
(This article belongs to the Special Issue Information Retrieval from Remote Sensing Images)

Abstract

:
Numerous reports have successfully detected or differentiated carbonate minerals such as calcite and dolomite by using the Advanced Spaceborne Thermal Emission and Reflection Radiometer (ASTER). However, there is a need to determine whether existing methods can differentiate magnesite from other carbonate minerals. This study proposes optimal band ratio combinations and new thresholds to distinguish magnesite, dolomite, and calcite using ASTER shortwave-infrared (SWIR) data. These were determined based on the spectral and chemical analysis of rock samples collected from Liaoning, China and Danchon, North Korea and the reflectance values from ASTER images. The results demonstrated that the simultaneous use of thresholds 2.13 and 2.015 for relative absorption band depths (RBDs) of (6 + 8)/7 and (7 + 9)/8, respectively, was the most effective for magnesite differentiation. The use of RBDs and band ratios to discriminate between dolomite and calcite was sufficiently effective. However, talc, tremolite, clay, and their mixtures with dolomite and calcite, which are commonly found in the study area, hampered the classification. The assessment of the ASTER band ratios for magnesite grade according to magnesium oxide content indicated that a band ratio of 5/6 was the most effective for this purpose. Therefore, this study proved that ASTER SWIR data can be effectively utilized for the identification and grade assessment of magnesite on a regional scale.

Graphical Abstract

1. Introduction

Magnesite (MgCO3) is not only a good refractory and common industrial material, but also an important ore that has been utilized for the extraction of magnesium compounds and magnesium metals [1]. Similar to other carbonate minerals such as dolomite (CaMg (CO3)2) and calcite (CaCO3), magnesite exhibits spectral absorption features in the shortwave-infrared (SWIR) wavelength range between 1.70 and 2.55 µm, owing to the vibrational processes of its carbonate ions (CO3−2) [2,3] (Figure 1). The position of absorption features of carbonates is controlled by metal cations (Mg2+, Ca2+) linked to carbonate ions in the crystal lattice [4,5]. Calcite shows strong absorptions at around 2.34 and 2.54 µm and dolomite displays strong absorptions at around 2.32 and 2.52 µm. However, strong absorptions of magnesite occur near 2.30 and 2.50 µm, which possess lower wavelengths than those associated with absorption of dolomite (Figure 1). These spectral differences can be utilized as diagnostic features to distinguish magnesite from dolomite and calcite, with less time and cost as compared to those required for chemical analysis. In particular, airborne or satellite remote sensing data can be effectively utilized for mapping or identifying magnesite in well-exposed and extensive areas.
Airborne hyperspectral imaging systems, such as AVIRIS and AisaFENIX, with high spatial and spectral resolutions, are advantageous for the detailed mapping of minerals or rocks. However, it is expensive to implement these systems in large areas. In addition, owing to the noise inherent in hyperspectral images and its size, the image processing procedure becomes complicated and time-consuming. Satellite multispectral systems, such as the Advanced Spaceborne Thermal Emission and Reflection Radiometer (ASTER) and Landsat 8 with moderate spatial and spectral resolutions, possess limitations for detailed mapping in comparison to airborne hyperspectral data. However, they can provide large-scale mapping at a low cost. As the image processing procedure implemented with multispectral data is relatively simple as compared to that utilizing hyperspectral data, they can be quickly and effortlessly used for mineral exploration.
ASTER launched on board the Terra platform in 1999 has three VNIR, six SWIR and five TIR spectral bands at 15, 30 and 90 m spatial resolution, respectively [6]. Although the SWIR sensor has not been operational since 2008, because the instrument has been in operation for almost 20 years, almost 4 million images of near-global coverage of the land have been archived [7]. The ASTER with six SWIR bands has been effectively utilized to detect or differentiate carbonate minerals such as calcite and dolomite [8,9,10,11,12]. However, few studies have used ASTER SWIR data to detect magnesite [13,14]. In addition, the assessment of the results is not elaborated and it is not clear if the implemented methods can differentiate magnesite from other carbonate minerals.
The purpose of this study is to propose an optimal ASTER SWIR band ratio and threshold value for the regional identification of magnesite and to evaluate the usefulness of ASTER SWIR band ratio for magnesium oxide (MgO) content in magnesite. This study also assessed the ASTER SWIR band ratio and the threshold for calcite and dolomite via the spectral and geochemical analyses of the rocks collected in the field. The demand for high-quality magnesite is increasing, and the MgO content is one of the major factors determining the grade of magnesite ore [1]. Liaoning (China) and Dancheon (North Korea), which are located within the Jiao-Liao-Ji Belt of the North China Craton, have been selected as the study areas because of their extensive exposure of magnesite mines with dolomite and calcite. North Korea and China are the first and third countries, respectively, with the largest magnesite reserves in the world [15]. We further discuss the performance and limitations of the ASTER band ratios for carbonate minerals using the USGS Spectral Library Version 7 [16].

2. Geology

The study area is located in the Jiao-Liao-Ji Belt, extending from Shandong (Jiaodong)-Liaoning-Jilin to the northeast of the Korean Peninsula (Figure 2a). The belt is tectonically considered as the suture zone of the collision between the Longgang and Nangrim complexes. In the belt, the sedimentary and volcanic successions include the Macheonryeong Group, the Jian and Laoling Groups, the Liaohe Group, and the Fenzishan and Jingshang Groups [17]. The Paleoproterozoic Dashiqiao Formation of the Liaohe Group in China and the Bugdaecheon series of the Macheonryeong Group in North Korea have similar dolomite–magnesite strata (Figure 2b,c) In addition, the magnesite deposits in both the regions exhibit similar Ca–Mg-rich sedimentary rocks (marble, dolostone, and tremolite dolostone), and hydrothermal alteration styles (talcification, chloritization, and dolomitization).
In Liaoning, China, the Paleoproterozoic Liaohe Group is the major host rock for a number of magnesite deposits. The stratigraphy includes the Langzishan, Lieryu, Gaojiayu, Dashiqiao and Gaixian formations (Figure 2c; [18]). The Gaojiayu Formation consists of garnet-bearing two-mica quartz schist, biotite schist, phyllite and dolomitic marble. The Dashiqiao Formation contains talc, serpentine, and world-class magnesite deposits (Shengshuishi, Qingshanhuai, Shuiquan, Huaziyu, Pailou, Jinjiabao, Xiafangsheng, and Fanjiabaozi) (Figure 2c), while consisting of 1054–3890 m thick carbonate–slate–phyllite–schist succession predominated by dolomitic marble [21,22,23]. The Dashiqiao Formation is subdivided into three members [24]: the lowermost member consists of thin limestone (calcite) interbedded with calcareous shale (1st member), the middle member contains shale intercalated with sandstone and limestone (2nd member), and the uppermost and thickest member consists of dolomitic carbonates that host the strata-bound or stratifrom magnesite deposits (3rd member).
In Dancheon, North Korea, the Macheonryeong Group is composed of Seongjin, Bugdaecheon, and Namdaecheon series, from the bottom to top. It also contains the Pyeonggang intrusive, Dancheon igneous rocks (Figure 2b; [25,26]). The Bugdaecheon series are composed of three units: a lower dolostone layer, a middle alternate layer of marble and schist, and an upper dolostone (dolomite) and marble layer. The carbonate rock of the series hosts the representative Daeheung and Ryongyang magnesite deposits and forms a mineralized belt that extends over 50 km along a north–south direction including small-scale deposits (Figure 2b; [25,26]). The Namdaecheon series mostly consists of marble, schist, and metasedimentary rocks. The intrusives include the Paleozoic-Mesozoic Pyeonggang intrusive, Mesozoic Dancheon igneous complex, and Quaternary basalts on the surface [25,27].

3. Methods

3.1. Spectral Measurements and Chemical Analysis

Rock samples obtained from Liaoning, China and Dancheon, North Korea were analysed for the performance evaluation of ASTER SWIR data (Table 1), with regard to the mapping of magnesite, dolomite, and calcite and the assessment of MgO content in magnesite. These samples were spectrally measured using a portable analytical spectral device (ASD) TerraSpec Halo, which records 2151 channels spanning a spectral range of 0.35–2.5 µm in the laboratory. The device has a spectral resolution of 0.003, 0.008, and 0.0098 µm from 0.35–1, 1.001–1.785, and 1.786–2.5 µm, respectively, and records the signal by resampling in units of 1 nm. In this study, only the SWIR wavelength region (1.6–2.43 µm) corresponding to the ASTER SWIR bands was used. The setting can be changed according to the brightness of the rock sample. In addition, the spectrum was recorded by repeating the measurements 100 times for dark rock samples and 50 times for bright rock samples within 15 s. The identification of major constituent minerals in rock samples using SWIR spectral analysis was cross-checked with results obtained via traditional methods such as X-ray diffraction (XRD) and X-ray fluorescence (XRF). To determine the appropriate ASTER band ratio and threshold values to distinguish magnesite from calcite and dolomite, the reflectance spectra of the rock samples were resampled to ASTER SWIR bandpass wavelengths.
An XRD analysis was conducted using an X-ray diffractometer (X’Pert MPD, Philips, Farnborough, UK) operated at the Korea Institute of Geoscience and Mineral Resources (KIGAM) to identify the major constituent minerals of the rock samples. The diffractometer was operated at 40 kV and 25 mA. Randomly orientated specimens were continuously scanned in the range of 3°–70° 2θ using CuK (α) radiation. XRF analysis was utilized to estimate the MgO content for the grade determination of the magnesite samples. Major element compositions were measured on fused glass beads prepared from 1.000 g of rock powder with 5.500 g of lithium tetraborate (Li2B4O7) by using an XRF instrument (MXF-240 model, Shimadzu, Kyoto, Japan) at the KIGAM. The detection limit was 1 wt.%.

3.2. ASTER Data and Pre-Processing

In this study, three cloud-free ASTER Level 1 Precision Terrain Corrected Registered At-Sensor Radiance (AST_L1T) images covering Liaoning, China and Dancheon, North Korea were utilized (Table 2). The AST_L1T product available from the NASA Land Processes Distributed Active Archive Center is created by performing geometric, radiometric, and cross-talk corrections on the original AST_L1A image [28]. For atmospheric correction, the six SWIR bands were resized to a 15 m spatial resolution by the nearest-neighbour method and layer stacked with the three VNIR bands. The nine VNIR-SWIR bands were calibrated from the at-sensor radiance to reflectance by using the FLAASH atmospheric correction software that incorporated the MODTRAN 4 radiation transfer model code [29]. Mosaicking procedure was applied to two reflectance images of Liaoning.
The average spectrum of the ASTER reflectance image at the magnesite sample collection site from the Pailou open-pit mine exhibits an unusually high reflectance in ASTER band 9 as compared to the ASTER SWIR wavelength range-resampled average spectrum of the magnesite sample (Figure 3c). This implies that the cross-talk effect, which occurs because of an anomalously high radiance (especially in ASTER bands 5 and 9) due to an SWIR optical leak from band 4 [30,31,32,33], has not been completely eliminated from the AST_L1T product. Scalar correction values were calculated by dividing the 9/8 band ratio of the ASTER resampled average spectrum of magnesite by the 9/8 band ratio of the ASTER image of the magnesite open-pit mines. Correction values of 0.82 and 0.73 were applied to the ASTER band 9 data from Liaoning, China and Dancheon, North Korea, respectively, to remove the residual crosstalk effect (Figure 3c).

3.3. ASTER SWIR Band Ratios for Carbonate Minerals

Band ratio is widely used for mineral and lithological mapping because it can highlight spectral features between the target and background materials, while reducing the effects related to albedo and topographic slope variations [34,35,36,37].
We evaluated whether the various ASTER SWIR band ratios proposed for calcite and dolomite in previous studies [8,12] could be applied to magnesite (Table 3). These band ratios for calcite and dolomite are based on the strong CO3 absorption features exhibited in ASTER bands 7 (2.26 µm) and 8 (2.33 µm) (Figure 1). The relative absorption band depth (RBD) is a ratio equation with three bands that is useful for showing Al-OH, Fe, Mg-OH, and CO3 absorption features and has been used to map limestone ((band 7 + band 9)/band 8) and dolomite ((band 6 + band 8)/band 7) in a previous study [8]. The band ratios of 8/7 and ((5 + 9)/7)/((6 + 9)/8) were suggested by Beirami and Tangestani [10] to separate dolomite and calcite. In this study, the threshold values for magnesite, dolomite, and calcite were determined by referring to rock samples and ASTER images in the study area.
To evaluate the capability of the ASTER band ratio for the assessment of MgO content in magnesite, the above four band ratios and three additional band ratios (5/6, 5/7, and 6/7) were tested.
Vegetation and shadow pixels can affect the usefulness of the band ratio. The 3/2 band ratio (<1.35) [28] was utilized to eliminate vegetation pixels containing chlorophyll absorption. Dark pixels with a reflectance of less than 15% in band 4 were masked.

4. Results

4.1. Thresholds for Magnesite, Dolomite, and Calcite

Figure 4a shows a scatter plot between the RBD ratios of (7 + 9)/8 and (6 + 8)/7 for dolomite, calcite, and magnesite spectra from rock samples belonging to Liaoning, China and Dancheon, North Korea. For the RBD ratio of (6 + 8)/7, calcite is separated from dolomite and magnesite by a ratio of 2.01; however, magnesite and dolomite are not separated. On the other hand, in the RBD ratio of (7 + 9)/8, magnesite can be separated from calcite and dolomite with a ratio value of 1.996; however, calcite and dolomite are not separated. Most of the dolomite, calcite, and magnesite are separated by the band ratio of ((5 + 9)/7)/((6 + 9)/8) (Figure 4c). Magnesite and dolomite were distinguished by a band ratio value of 1.026, while dolomite and calcite were differentiated with a band ratio value of 0.98. Among 87 samples, only one confused sample was observed. A dolomite sample with a band ratio of 0.972 was included in the calcite band ratio range. A ratio value of 1.026 for band 8/band 7 can separate magnesite from calcite and dolomite. However, this band ratio alone cannot distinguish calcite and dolomite.
ASTER reflectance pixels corresponding to the same locations of the collected rock samples were used to determine the optimal threshold values for the ASTER image to distinguish between calcite, dolomite, and magnesite. Unfortunately, as accurate location information of the rock samples collected from Dancheon, North Korea is not available, this calculation was performed only on the ASTER image from Liaoning, China. The number of ASTER pixels for calculating the band ratio value was reduced because several rock samples were acquired within close proximity to each other, and thus falling within the same 30 m ASTER SWIR pixels. Nevertheless, in the scatterplot of the band ratios, the distribution pattern of the ratio values of the ASTER image pixels was generally similar to that of the rock sample, and there was a slight difference in the threshold values (Figure 4). The difference in threshold values between the rock sample and the ASTER image spectra may be due to atmospheric attenuation effects in the ASTER image and/or to the mixing effect of minerals within the spatial resolution of a single pixel (30 m).
In the RBD (6 + 8)/7 ASTER image, calcite is separated from dolomite and magnesite with a ratio value of 1.995, and magnesite is separated from dolomite with a ratio value of 2.13 (Figure 4b). However, as shown in the scatterplot of the rock samples with a higher sample count (Figure 4a), this RBD can confuse dolomite and magnesite. In the RBD (7 + 9)/8 ASTER image, magnesite can be separated from calcite and dolomite with a ratio value of 2.015, but there is no clear threshold for distinguishing calcite and dolomite. Figure 4d shows that the threshold values of 1.033 and 0.977 differentiate calcite, dolomite, and magnesite in the band ratio of ((5 + 9)/7)/((6 + 9)/8). As displayed in the scatterplot of the rock sample (Figure 4c), the ASTER image shows some misclassification between calcite (one out of seven) and dolomite (one out of six) when this band ratio is implemented. A ratio value of 1.004 for band 8/band 7 can separate magnesite from calcite and dolomite. In addition, a threshold value (0.959) that can distinguish calcite from dolomite is shown, unlike the band ratio of the rock sample (Figure 4c). However, this threshold is incomplete because of the small number of ASTER sample pixels in dolomite and calcite.
Two band ratios were used together (Figure 4b; Table 3) to reduce the possibility of misclassification of carbonate minerals, which could be caused by the use of a single band ratio in the ASTER image. An ASTER RBD image in Liaoning, China, was generated by applying the threshold values proposed in this study ((band 6 + band 8)/band 7 and (band 7 + band 9)/band 8) for mapping carbonate minerals (magnesite, dolomite, and calcite) (Figure 4b and Figure 5a; Table 3). The thresholds of the two RBDs successfully mapped carbonate minerals in the validation area (Regions I and II) where rock samples were collected, and in the magnesite open-pit mines (Qingshanhuai, Huaziyui, Jinjiabao, Xiafangsheng, and Fanjiabaozi). The image (Figure 5b) formed using the thresholds proposed in this study, with band ratios of ((5 + 9)/7)/((6 + 9)/8) and 8/7 for magnesite, dolomite, and calcite (Figure 4); Table 3), is similar to the image generated using the thresholds of RBDs (Figure 5a). The total number of pixels of carbonate minerals mapped by the simultaneous use of ((band 5 + band 9)/band 7)/((band 6 + band 9)/band 8) and band 8/band 7 was 61,299, which was 4.8% more than the 58,497 pixels of carbonate mineral mapped by the simultaneous use of RBDs (6 + 8)/7 and (7 + 9)/8 (Figure 6a). The proportions of magnesite, dolomite, and calcite mapped using RBD were 16%, 31%, and 53%, respectively. On the other hand, the use of band ratios of ((5 + 9)/7)/((6 + 9)/8) and 8/7 for magnesite, dolomite, and calcite were 11%, 34%, and 55%, respectively.
Figure 7 displays the distribution of carbonate minerals in Dancheon, North Korea using the same RBDs, band ratios, and threshold values that were implemented in Liaoning, China (Table 3). Most of the Daeheung mine (open-pit) is mapped with magnesite. Calcite, dolomite and magnesite are distributed on the surface of the Ryongyang and Geomdeok mines, which are being developed underground. These results agree well with the analysis of rock samples (reflectance spectroscopy, XRD, and XRF) and the results of previous reports [19,25,26]. The classification results between RBD and band ratio exhibited a much larger difference compared to that seen in Liaoning, China. The simultaneous use of RBDs (6 + 8)/7 and (7 + 9)/8 resulted in a total number of 20,375 pixels mapped as carbonate minerals; however, the simultaneous use of band ratios ((5 + 9)/7)/((6 + 9)/8) and 8/7 resulted in 27,087 pixels that were mapped as carbonate minerals, which is 33% higher (Figure 6b). The proportions of magnesite, dolomite, and calcite mapped using RBDs were 49%, 14%, and 37%, respectively. However, magnesite, dolomite, and calcite mapped using band ratios were 12%, 21%, and 67%, respectively.

4.2. Band Ratio for Magnesium Oxide Content

Figure 8 displays the scatter plots of seven band ratios versus the MgO content for the ASTER-resampled spectra of magnesite samples, from China and North Korea. For all the band ratios, the correlation coefficient (r) values were greater than 0.59 and p-values were less than 0.01. The correlation coefficient between the 5/6 band ratio and MgO is 0.7, which is the highest among the band ratios. Although when applied to the ASTER image data the correlation decreased, this is probably because the samples were limited to only include Liaoning, China, the 5/6 band ratio exhibited the highest correlation (0.45) with magnesium oxide among the seven band ratios in the ASTER image (Figure 9).
Figure 10 displays the magnesium content map using the 5/6 band ratio in the open-pit magnesite mines from Pailou, China and Daeheung, North Korea. Higher band ratio values (>1.04), shown in red and yellow, indicate a higher magnesium oxide content. Pixels with a high band ratio value (>1.05) were more common in the Daeheung mine than in the Pailou mine (Figure 11). The average band ratio value of the Pailou mine was 1.028 and that of the Daeheung mine was 1.069. These results indicate that the magnesite grade of the Daeheung mine is higher than that of the Pailou mine. This is also consistent with the spectroscopic and XRF results for the magnesite samples (Table 4).
The reflectance spectrum of the pixel with the maximum value at a band ratio of 5/6 agrees well with the spectrum of the pure magnesite sample, which exhibits a deep absorption in band 7 (Figure 12). On the other hand, the reflectance spectrum of the pixel with the minimum value at a band ratio of 5/6 is similar to that of the magnesite mixture sample with additional absorption in band 5 by talc or tremolite.

5. Discussion

5.1. Band Ratio Assessment

In this study, we used rock samples from Liaoning, China and Tanchon, North Korea to evaluate the ASTER SWIR band ratios for carbonate minerals. Thresholds were chosen based on the ASTER image in Liaoning, China; therefore, their implementation in other regions may not be applicable and these samples can also be misunderstood as other minerals. Carbonate mineral spectra in the USGS Spectral Library Version 7 [16] were utilized to evaluate the performance and limitations of the ASTER SWIR band ratios for carbonate minerals. The spectra of minerals that are similar to carbonate minerals were also selected.
At all band ratios, the USGS magnesite spectra generate lower ratio values than those of the magnesite samples of the study area (Figure 13). This may be related to the purity of the samples. The spectra in this study are pure magnesite, and the USGS spectra are a mixture of magnesite and hydromagnesite. In the scatterplot of ((band 5 + band 9)/band 7)/((band 6 + band 9)/band 8) versus band 8/band 7, USGS magnesites are located near the threshold for distinguishing dolomite and calcite (Figure 13). This suggests that the magnesite mixtures may be classified as dolomite or calcite. In the ASTER classification image of Liaoning using RBDs (6 + 8)/7 and (7 + 9)/8, the proportion of pixels classified as magnesite was 16%, whereas the proportion of magnesite using band ratios ((5 + 9)/7)/((6 + 9)/8) and 8/7 was 11% (Figure 5 and Figure 6). Among the pixels classified as magnesite in the RBD result image, 3264 pixels were classified as dolomite in the final band ratio image. Field investigation and rock sample (chemical and spectroscopic) analysis revealed that most of the pixels where magnesite is confused with dolomite represent the mixtures of magnesite and talc. The proportion of magnesite in the RBD and band ratio images of Dancheon, North Korea was 49% and 12%, respectively, thereby showing a much larger difference than that observed for Liaoning, China (Figure 6b and Figure 7). Out of all the pixels classified as magnesite in the RBD image, 67% were classified as dolomite or calcite in the band ratio image. From previous reports, the rock samples from Dancheon, North Korea [19,25,26] and the ASTER classification result from Laoning, China suggest that magnesite may have been classified as dolomite or calcite in the final band ratio image when mixed with talc or other minerals. In the Daeheung open-pit mine, where the purity of magnesite is high, the difference in the proportion of magnesite according to RBD and band ratio is not large (Figure 7). The proportions of magnesite in the RBD and band ratio images were 79% and 66%, respectively. Considering the above results, the simultaneous use of RBDs (6 + 8)/7 and (7 + 9)/8 is more effective than the use of band ratios ((5 + 9)/7)/((6 + 9)/8) and 8/7 for magnesite separation.
The band ratio values of the USGS dolomite spectra were similar to those of the dolomite sample spectra implemented in this study (Figure 13). The scatterplot between RBDs (6 + 8)/7 and (7 + 9)/8 shows that the thresholds proposed for dolomite in this study cannot differentiate dolomite from talc, tremolite, chlorite, and epidote (Figure 13a). Simultaneous use of the thresholds of the band ratios ((5 + 9)/7)/((6 + 9)/8) and 8/7 for dolomite cannot differentiate between dolomite and mica (illite and muscovite) (Figure 13b). In the classification image of Liaoning, China, which utilizes RBD and band ratio, the proportion of dolomite was 31% and 34%, respectively (Figure 6a). However, 16% of the pixels mapped as dolomite in the band ratio image are expected to be magnesite mixtures (Figure 5b). However, if these pixels are excluded from the band ratio image, the dolomite pixels in the RBD are 5% more than in the band ratio. This may be because talc is classified as dolomite in the RBD. With the exception of magnesite, dolomite, and calcite, talc is the most abundant. In addition, mica (illite and muscovite), chlorite, and epidote are scarce in this region. Similarly, if the pixels that supposedly represent magnesite mixtures are excluded from the band ratio image of Dancheon, North Korea, the dolomite pixels in the RBD are 6% more than in the band ratio (Figure 6b and Figure 7). This may be related to the abundance of talc, tremolite, and chlorite in this region. The above results exhibit that the RBDs and band ratios for dolomite are effective for dolomite detection, but each method possesses different levels of shortcomings.
Figure 13a shows that our thresholds of RBDs (6 + 8)/7 and (7 + 9)/8 for calcite can confuse illite and chlorite with calcite. On the other hand, the simultaneous use of band ratios ((5 + 9)/7)/((6 + 9)/8) and 8/7 can confuse calcite with talc, tremolite, chlorite and kaolinite (Figure 13b). In Liaoning, China, calcite was more abundantly mapped in the band ratio result image than in the RBD result image (Figure 5 and Figure 6). This is because talc, which was classified as dolomite in the simultaneous use of RBD, has been classified as calcite in the simultaneous use of band ratio. In Dancheon, North Korea, the use of band ratios maps more than twice as much calcite as the use of RBDs (Figure 6b and Figure 7). This is presumably due to clay, such as kaolinite, which is widely distributed in this area. The band ratios ((5 + 9)/7)/((6 + 9)/8) and 8/7 were strongly influenced by soil and clay [12]. Therefore, the simultaneous use of RBD for calcite separation is recommended.

5.2. Grade of Magnesite

The assessment of the ASTER band ratios for magnesite grade according to MgO content demonstrated that a band ratio of 5/6 was the most effective for this purpose. However, this method should be applied only to pixels identified as magnesite. For example, the band ratio of 5/6 for dolomite and calcite can be similar to that of magnesite (Figure 1). Therefore, in this study, pixels other than magnesite were masked as much as possible using RBDs (6 + 8)/7 and (7 + 9)/8.
As no location information exists regarding the rock samples in Dancheon, North Korea with high MgO content, an equation for predicting the MgO content in the ASTER image was not proposed. However, the use of band 5/band 6 exhibited that the relative magnesite grade could be easily and quickly identified within the study area (Figure 10). This method can be effective for monitoring magnesite grade in open-pit mines where surface changes occur due to mining activities.

6. Conclusions

This study proposes new band ratio combinations and thresholds to distinguish magnesite, dolomite and calcite in ASTER images. The optimal band ratio combinations and threshold values for each carbonate mineral were determined based on the spectral and chemical analyses of rock samples collected from Liaoning (China) and Dancheon (North Korea) and the reflectance values from ASTER images. The simultaneous use of thresholds 2.13 and 2.015 for RBDs (6 + 8)/7 and (7 + 9)/8, respectively, was the most effective for magnesite differentiation in the Jiao-Liao-Ji Belt, North China Craton. The use of RBD and band ratios to discriminate between dolomite and calcite was sufficiently effective. However, talc, tremolite, clay, and their mixtures with dolomite and calcite, which commonly occurred in the study area, hampered the classification.
The correlation between the band ratio of 5/6 and MgO showed that ASTER images were effective in providing semi-quantitative MgO information at a regional scale.
The methods proposed in this study for the classification of carbonate minerals and the evaluation of MgO content are based on ASTER images and rock samples from China and North Korea, so their use in other areas may not be effective enough. Thus, further studies evaluating their applicability in similar and different geological environments are recommended. It is also necessary to investigate the mixing effect of minerals that may occur in the 30 m spatial resolution of ASTER SWIR data on the classification accuracy.

Author Contributions

Conceptualization, Y.-S.S.; data curation, Y.-S.S.; formal analysis, Y.-S.S.; funding acquisition, S.-M.K. and S.-J.C.; investigation, Y.-S.S., G.L., B.H.L. and N.K.; methodology, Y.-S.S.; project administration, S.-M.K. and S.-J.C.; resources, Y.-S.S., G.L., B.H.L. and N.K.; software, Y.-S.S. and G.L.; supervision, K.-E.K.; validation, Y.-S.S.; visualization, Y.-S.S. and G.L.; writing—original draft preparation, Y.-S.S. and G.L.; writing—review and editing, Y.-S.S. and K.-E.K.; All authors have read and agreed to the published version of the manuscript.

Funding

This work was supported by the Korea Institute of Geoscience and Mineral Resources (KIGAM) Basic Research Project (22-3211) funded by the Ministry of Science and ICT of Korea. This work was also supported by a National Research Council of Science & Technology (NST) grant by the Korea government (MSIT) (No. CRC-15-06-KIGAM).

Institutional Review Board Statement

Not applicable.

Informed Consent Statement

Not applicable.

Data Availability Statement

Not applicable.

Conflicts of Interest

The authors declare no conflict of interest.

References

  1. Mao, Y.C.; Xiao, D.; Cheng, J.F.; Jiang, J.H.; Ba, T.L.; Liu, S.J. Multigrades classification model of magnesite ore based on SAE and ELM. J. Sens. 2017, 2017, 9846181. [Google Scholar] [CrossRef] [Green Version]
  2. Gaffey, S.J. Spectral reflectance of carbonate minerals in the visible and near infrared (0.35–2.55 um): Anhydrous carbonate minerals. J. Geophys. Res.-Solid Earth 1987, 92, 1429–1440. [Google Scholar] [CrossRef]
  3. Clark, R.N.; King, T.V.V.; Klejwa, M.; Swayze, G.A.; Vergo, N. High spectral resolution reflectance spectroscopy of minerals. J. Geophys. Res.-Solid Earth 1990, 95, 12653–12680. [Google Scholar] [CrossRef] [Green Version]
  4. Gaffey, S.J. Spectral reflectance of carbonate minerals in the visible and near infrared (0.35–2.55 microns): Calcite, aragonite, and dolomite. Am. Miner. 1986, 71, 151–162. [Google Scholar]
  5. Kurz, T.H.; Dewit, J.; Buckley, S.J.; Thurmond, J.B.; Hunt, D.W.; Swennen, R. Hyperspectral image analysis of different carbonate lithologies (limestone, karst and hydrothermal dolomites): The Pozalagua Quarry case study (Cantabria, North-west Spain). Sedimentology 2012, 59, 625–643. [Google Scholar] [CrossRef]
  6. Yamaguchi, Y.; Kahle, A.B.; Tsu, H.; Kawakami, T.; Pniel, M. Overview of advanced spaceborne thermal emission and reflection radiometer (ASTER). IEEE Trans. Geosci. Remote Sens. 1998, 36, 1062–1071. [Google Scholar] [CrossRef] [Green Version]
  7. Abrams, M.; Yamaguchi, Y. Twenty years of ASTER contributions to lithologic mapping and mineral exploration. Remote Sens. 2019, 11, 1394. [Google Scholar] [CrossRef] [Green Version]
  8. Rowan, L.C.; Mars, J.C. Lithologic mapping in the Mountain Pass, California area using Advanced Spaceborne Thermal Emission and Reflectance Radiometer (ASTER) data. Remote Sens. Environ. 2003, 84, 350–366. [Google Scholar] [CrossRef]
  9. Ninomiya, Y.; Fu, B.; Cudahy, T.J. Detecting lithology with Advanced Spaceborne Thermal Emission and Reflectance Radiometer (ASTER) multispectral thermal infrared radiance-at-sensor data. Remote Sens. Environ. 2005, 99, 127–139. [Google Scholar] [CrossRef]
  10. Mars, J.C.; Rowan, L.C. ASTER spectral analysis and lithologic mapping of the Khanneshin carbonatite volcano, Afghanistan. Geosphere 2011, 7, 276–289. [Google Scholar] [CrossRef] [Green Version]
  11. Ghorbani, A.; Honarmand, M.; Shahriari, H.; Hassani, M.J. Regional scale prospecting for non-sulphide zinc deposits using ASTER data and different spectral processing methods. Int. J. Remote Sens. 2019, 40, 8647–8667. [Google Scholar] [CrossRef]
  12. Beirami, M.R.; Tangestani, M.H. A new band ratio approach for discriminating calcite and dlomite by ASTER imagery in arid and semiarid regions. Nat. Resour. Res. 2020, 29, 2949–2965. [Google Scholar] [CrossRef]
  13. Sridhar, M.; Muthukumar, M. Spectral library for various rocks and minerals of Salem district: A comparative study and validation with ASTER data. In On a Sustainable Future of the Earth’s Natural Resources; Ramkumar, M., Ed.; Springer: Berlin, Germany, 2013; pp. 149–157. [Google Scholar]
  14. Ranganathan, P.C.; Siddan, A. Geospatial assessment of ultramafic rocks and ore minerals of Salem, India. Arab. J. Geosci. 2020, 13, 1095. [Google Scholar] [CrossRef]
  15. U.S. Geological Survey. Mineral Commodity Summaries 2020; U.S. Geological Survey: Reston, VA, USA, 2020; 200p.
  16. Kokaly, R.F.; Clark, R.N.; Swayze, G.A.; Livo, K.E.; Hoefen, T.M.; Pearson, N.C.; Wise, R.A.; Benzel, W.M.; Lowers, H.A.; Driscoll, R.L.; et al. USGS Spectral Library Version 7; U.S. Geological Survey Data Series 1035; U.S. Geological Survey: Reston, VA, USA, 2017; 61p.
  17. Li, Z.; Chen, B.; Yan, X. The Liaohe Group: An Insight into the Paleoproterozoic tectonic evolution of the Jiao–Liao–Ji Belt, North China craton. Precambrian Res. 2019, 326, 174–195. [Google Scholar] [CrossRef]
  18. Tang, H.-S.; Chen, Y.-J.; Santosh, M.; Zhong, H.; Wu, G.; Lai, Y. C–O isotope geochemistry of the Dashiqiao magnesite belt, North China Craton: Implications for the Great Oxidation Event and ore genesis. Geol. J. 2013, 48, 467–483. [Google Scholar] [CrossRef]
  19. Kim, C.W.; Ryu, J.M.; Ri, S.R.; Um, H.Y.; Seo, W.S.; Kim, Y.H.; Kim, J.H. Ore Deposits of Joseon (3); Science Encyclopedia Publisher: Pyongyang, Korea, 1991; 400p. [Google Scholar]
  20. Chang, R.; Liu, Y.; Li, W.; Gu, D. Deformation and rheological properties of Dashiqiao Formation of Liaohe Group in Hupiyu area, eastern Liaoning Province. Geol. J. 2019, 54, 804–818. [Google Scholar] [CrossRef]
  21. Chen, C.X.; Jiang, S.Y.; Cai, K.Q.; Ma, B. Metallogenic conditions of magnesite and talc deposits in early Proterozoic Mg-rich carbonate formations, eastern Liaoning province. Miner. Depos. 2003, 22, 166–176. [Google Scholar]
  22. Chen, C.X.; Ni, P.; Cai, K.Q.; Zhai, Y.S.; Deng, J. The minerogenic fluids of magnesite and talc deposits in the Paleoproterozoic Mg-rich carbonate formations in eastern Liaoning province. Geol. Rev. 2003, 49, 645–651. [Google Scholar]
  23. Jiang, S.-Y.; Chen, C.X.; Chen, Y.Q.; Jiang, Y.-H.; Dai, B.Z.; Ni, P. Geochemistry and genetic model for the giant magnesite deposits in the eastern Liaoning province, China. Acta Petrol. Sin. 2004, 20, 765–772. [Google Scholar]
  24. Zhang, Q. Early proterozoic tectonic styles and associated mineral deposits of the North China Platform. Precambrian Res. 1988, 39, 1–29. [Google Scholar] [CrossRef]
  25. Jeon, G.B.; Park, H.W.; Kim, J.N.; Yang, J.H.; Ri, S.R.; Jo, I.W.; Gang, I.S. Geology of Joseon; Science and Technology Publishing House: Pyongyang, Korea, 2011; 442p. [Google Scholar]
  26. Kim, Y.M.; Han, B.S.; Park, I.S.; Um, H.Y.; Paik, R.J.; Jeong, S.I.; Ri, M.C. Geology and Underground Resources; Education Book Publishing House: Pyongyang, Korea, 1988; 667p. [Google Scholar]
  27. Lee, G.; Shin, D.; Lee, S.; Koh, S.M.; Lee, B.H.; You, B.W.; Yoo, B.C. Ore genesis and tectonic implication of the Daeheung-Ryongyang magnesite deposits in the East Jiao-Liao-Ji Belt, North Korea. Lithos 2021, 106402, 400–401. [Google Scholar] [CrossRef]
  28. Duda, K.; Daucsavage, J.; Siemonsma, D.; Brooks, B.; Oleson, R.; Meyer, D.; Doescher, C. Advanced Spaceborne Thermal Emission and Reflection Radiometer (ASTER) Level 1 Precision Terrain Corrected Registered At-Sensor Radiance Product (AST_L1T): AST_L1T Product User’s Guide, Version 1.1. 2020. Available online: https://lpdaac.usgs.gov/products/ast_l1tv003/ (accessed on 14 June 2021).
  29. Adler-Golden, S.M.; Matthew, M.W.; Bernstein, L.S.; Levine, R.Y.; Berk, A.; Richtsmeier, S.C.; Acharya, P.K.; Anderson, G.P.; Felde, J.W.; Gardner, J.A.; et al. Atmospheric correction for short-wave spectral imagery based on MODTRAN4. In Engineering, and Instrumentation; SPIE’s International Symposium on Optical Science: Denver, CO, USA, 1999. [Google Scholar]
  30. Iwasaki, A.; Tonooka, H. Validation of a crosstalk correction algorithm for ASTER/SWIR. IEEE Trans. Geosci. Remote Sens. 2005, 43, 2747–2751. [Google Scholar] [CrossRef]
  31. Mars, J.C.; Rowan, L.C. Regional mapping of phyllic-and argillic-altered rocks in the Zagros magmatic arc, Iran, using Advanced Spaceborne Thermal Emission and Reflectance Radiometer (ASTER) data and logical operator algorithms. Geosphere 2006, 2, 161–186. [Google Scholar] [CrossRef]
  32. Son, Y.S.; Kang, M.K.; Yoon, Y.J. Lithological and mineralogical survey of the Oyu Tolgoi region, Southeastern Gobi, Mongolia using ASTER reflectance and emissivity data. Int. J. Appl. Earth Obs. Geoinf. 2014, 26, 205–216. [Google Scholar] [CrossRef]
  33. Son, Y.S.; Kang, M.K.; Yoon, Y.J. Pyrophyllite mapping in the Nohwa deposit, Korea, using ASTER remote sensing data. Geosci. J. 2014, 18, 295–305. [Google Scholar] [CrossRef]
  34. Crowley, J.K.; Brickey, D.W.; Rowan, L.C. Airborne imaging spectrometer data of the Ruby Mountains, Montana: Mineral discrimination using relative absorption band-depth images. Remote Sens. Environ. 1989, 29, 121–134. [Google Scholar] [CrossRef]
  35. Sabins, F.F. Remote sensing for mineral exploration. Ore Geol. Rev. 1999, 14, 157–183. [Google Scholar] [CrossRef]
  36. Son, Y.S.; Kim, K.E.; Yoon, W.J.; Cho, S.J. Regional mineral mapping of island arc terranes in southeastern Mongolia using multispectral remote sensing data. Ore Geol. Rev. 2019, 113, 103106. [Google Scholar] [CrossRef]
  37. Son, Y.S.; You, B.W.; Bang, E.S.; Cho, S.J.; Kim, K.E.; Baik, H.; Nam, H.T. Mapping alteration mineralogy in eastern Tsogttsetsii, Mongolia, based on the WorldView-3 and field shortwave-infrared spectroscopy analyses. Remote Sens. 2021, 13, 914. [Google Scholar] [CrossRef]
Figure 1. Comparison of the reflectance spectra of carbonate minerals (black solid lines) in the study area. These spectra were measured using a portable analytical spectral device (ASD) TerraSpec Halo (Malvern Panalytical Ltd., Malvern, UK), which records 2151 channels spanning a spectral range of 0.35–2.5 µm. The solid lines with colour are the resampled spectra to the spectral resolution of ASTER SWIR band: (a) magnesite; (b) dolomite; (c) calcite. The black dotted lines show the location of the main absorption feature of each carbonate mineral in the ASTER SWIR band.
Remotesensing 14 00181 g001
Figure 2. (a) Map of the Paleoproterozoic Jiao-Liao-Ji Belt in the Eastern Block of the North China Craton (modified from [18]. The red solid boxes in the Liaohe Group and Macheonryeong Group are the location of the study area, which are enlarged in (b,c). Geological map of (b) Dancheon, North Korea [19], and (c) Liaonig, China [18,20].
Remotesensing 14 00181 g002
Figure 3. (a) ASTER false colour composite image (R: band 3, G: band 2, B: band 1) and (b) photo of the Pailou open-pit mine in Liaoning, China. (c) ASTER average spectra before (middle) and after scalar correction (top) at locations where magnesite samples were collected. Average spectrum of the magnesite samples is shown at the bottom.
Remotesensing 14 00181 g003
Figure 4. Scatter plots between band ratios calculated for carbonate minerals. RBD (7 + 9)/8 versus RBD (6 + 8)/7 for (a) rock samples and (b) ASTER image pixels at the locations where rock samples are collected. Band ratio of ((5 + 9)/7)/((6 + 9)/8) versus band ratio of 8/7 for (c) rock samples and (d) ASTER image pixels at the locations where rock samples are collected.
Remotesensing 14 00181 g004
Figure 5. Carbonate mineral map of the Liaoning, China, using threshold values proposed in this study (Table 3) for (a) RBDs and (b) band ratios. The white boxes are the validation areas (Regions I and II) from where the rock samples were collected; their enlarged views are also shown. The white solid line is the boundary of the geological units in Figure 2c.
Remotesensing 14 00181 g005
Figure 6. Total number and proportion of pixels classified as carbonate minerals by RBD and band ratio in ASTER images of (a) Liaoning, China and (b) Dancheon, North Korea.
Remotesensing 14 00181 g006
Figure 7. Carbonate mineral map of the Dancheon, North Korea, using threshold values proposed in this study (Table 3) for (a) RBDs and (b) band ratios. The white box represents the Daeheung open pit magnesite mine, which is enlarged. The white solid line is the boundary of the geological units in Figure 2b.
Remotesensing 14 00181 g007
Figure 8. Relationship between magnesium oxide (MgO) content and ASTER band ratio based on the magnesite samples from Liaonig, China and Dancheon, North Korea. The blue dotted line and the number are the relationships when the samples were limited to only include Liaoning, China.
Remotesensing 14 00181 g008
Figure 9. Relationship between MgO content and ASTER image band ratio at the locations from magnesite samples were collected (Liaoning, China).
Remotesensing 14 00181 g009
Figure 10. MgO content map of the (a) Pailou mine, China and the (b) Daeheung mine, North Korea, which uses the colour assignment generated from the ASTER band ratio of 5/6.
Remotesensing 14 00181 g010
Figure 11. Histogram of the band ratio 5/6 value in the (a) Pailou mine, China and (b) Dancheon, North Korea.
Remotesensing 14 00181 g011
Figure 12. (a) Spectra of pixels that associated with maximum and minimum values in the ASTER image associated with a band ratio of 5/6. (b) Representative spectra of magnesite, tremolite, and talc samples collected from the Pailou mine, China and the Daeheung mine, North Korea.
Remotesensing 14 00181 g012
Figure 13. Scatter plots between band ratios calculated for carbonate mineral spectra for this study and carbonate mineral spectra of the USGS Spectral Library Version 7 [16]. USGS spectra of minerals that are similar to carbonate minerals were also selected. (a) RBD (7 + 9)/8 versus (6 + 8)/7. (b) Band ratio ((5 + 9)/7)/((6 + 9)/8) versus 8/7.
Remotesensing 14 00181 g013
Table 1. Representative minerals and numbers of rock samples collected from the study area.
Study AreaMineralTotal Number of Samples
Liaoning, ChinaMagnesite33
Dolomite10
Calcite12
Dancheon, North KoreaMagnesite25
Dolomite4
Table 2. Acquisition dates for ASTER data used in this study.
Study AreaAcquisition Date
Liaoning, China16 June 2006
Dancheon, North Korea17 November 2006
Table 3. List of ASTER band ratios and thresholds used for carbonate minerals.
Target MineralEquation and ThresholdReference
Calcite B 7 +   B 9 B 8 , unknown threshold[8]
B 8 B 7 ≤ 1.021[12]
( B 5 +   B 9 B 7 ) ( B 6 +   B 9 8 ) ≤ 1.012
B 7 +   B 9 B 9   >   2.015   and   B 6 +   B 8 B 7 ≤ 1.995Proposed in this study
0.8   <   B 8 B 7     1.004   and   0.8   <   ( B 5 +   B 9 B 7 ) ( B 6 +   B 9 8 ) ≤ 0.977
Dolomite B 6 +   B 8 B 7 , unknown threshold[8]
B 8 B 7 > 1.021[12]
( B 5 +   B 9 B 7 ) ( B 6 +   B 9 8 ) > 1.012
B 7 +   B 9 B 9   >   2.015   and   B 6 +   B 8 B 7 > 1.995Proposed in this study
0.8   <   B 8 B 7     1.004   and   0.8   <   ( B 5 +   B 9 B 7 ) ( B 6 +   B 9 8 ) > 0.977
Magnesite B 7 +   B 9 B 9     2.015   and   B 6 +   B 8 B 7 > 2.13Proposed in this study
B 8 B 7   >   1.004   and   ( B 5 +   B 9 B 7 ) ( B 6 +   B 9 8 ) > 1.033
Table 4. Comparison of MgO content and the 5/6 band ratio value in the ASTER image at the Pailou mine, China and Daeheung mine, North Korea.
MineNumber of Rock SampleMgO Content (in Weight%)Number of Image PixelBand Ratio Value
Max.Min.Avg.Max.Min.Avg.
Pailou3847.3345.2146.4322071.130.961.028
Daeheung1148.4947.3747.47561.210.951.069
Publisher’s Note: MDPI stays neutral with regard to jurisdictional claims in published maps and institutional affiliations.

