1. Introduction
The surface water of lakes is an important indicator that can characterize the influence of climate change and human activities on lakes [
1,
2]. Climate change causes distribution changes of water resources in time and space and significantly changes lake surface water. For example, floods occurred frequently in the 1990s, as rainfall was above typical levels during this period. Researchers have indicated that the annual average air temperature has risen by 1.1 °C from 1951 to 2001 in China, and annual rainfall has increased by 60–130 mm from 1951 to 2001 in the middle and downriver sections of the Yangtze River and the southeast of China [
3,
4,
5]. In addition to meteorological factors, intensive human activities, including the construction of water conservancy projects and farmland reclamation from lakes, combined with the change to the hydrological regime, have resulted in spatiotemporal changes of surface water. The construction of the Three Gorges Dam (TGD) was regarded as the main factor leading to surface water changes in Donting Lake in recent years [
6,
7,
8]. Due to ongoing global climate change and intensive human activities, extreme flooding and droughts have occurred frequently and surface water cover has changed drastically over the past 40 years in Dongting Lake, which is one of the most significant periods of climate change and the most intensive periods of human activities that Dongting Lake has experienced [
6,
9]. With continuing changes to the hydrological regime in Dongting Lake, flood regulation and storage capacity of Dongting Lake has been significantly weakened, which has great impacts on the ecosystem and local agricultural production [
6,
9]. Therefore, research on the evolution of long-term surface water in the Dongting Lake Basin will help explain the changes in water resources, thereby preserving the sustainable use of the water and soil resources. The traditional method to study this is to use hydrological data collected at local monitoring stations to study the hydrological regime in Dongting Lake [
10,
11,
12,
13,
14]; however, it would be challenging to investigate long-term water surface changes with these data and especially to map inundated areas or shrinking areas of surface water when flooding or drought occurs, respectively. There are valuable multitemporal sources of remote-sensing data that are useful to investigate changes of large areas of surface water, especially in inundated areas.
There have been many studies on surface water area variation monitoring based on remote-sensing technology [
6,
8,
15]. Peng et al. applied moderate-resolution imaging spectroradiometer (MODIS) and geographic information systems (GIS) to study the relationship between water level and lake area in 1995, 1996, 2002 and 2003, and flood water levels have been reduced as a result of the implementation of the “return land to lake” policy in 1998 that came out of the study [
8]. Huang, et al. used MODIS 8-day composite images to dynamically monitor the water surface area of Dongting Lake from 2000 to 2009 [
6]. Long et al. used the Automatic Water Extraction Index to derive multitemporal water area with MODIS imagery and estimated the real-time water area of Dongting Lake according to the relationship between the water level and lake area [
15]. Gao et al. used Landsat time-series images to survey changes of water surface area for the inner lakes of the Lake Dongting district, quantified the influence of climate on the change of the inner lakes’ water and qualitatively analyzed the influence of human activities on lake changes [
16]. Yang et al. investigated long-term water in Dongting Lake using a Support Vector Machine with Landsat satellite observations from 1978 to 2019 and analyzed the influence of the TGD on water changes. They found that the water area in wet seasons decreased significantly during the post-TGD period compared with the pre-TGD period, especially in flood years, due to flood regulation and water storage of the TGD [
9]. Most of these studies monitored the lake area with low and medium resolution time-series remote-sensing data [
6,
15] or long-interval and single-phase remote-sensing data [
16,
17,
18]. However, low- and medium-resolution remote-sensing data, such as MODIS data, cannot be used to monitor lake surface water changes before 2000 and remote-sensing data of a single-phase cannot accurately reflect interannual changes of lake surface water. In addition, qualitative analysis of the factors driving long-term water changes in Dongting Lake have received limited attention.
In this paper, long-term surface water in Dongting Lake was systematically studied using full time-series Landsat and MODIS Terra data to document the annual and seasonal variation in surface water from 1975 to 2019. We aimed to reveal the meteorological and hydrological factors driving the long-term changes of surface water and to map the spatiotemporal distribution of seasonal surface water and permanent surface water.
2. Study Area and Datasets
2.1. Study Area
Dongting Lake is the second largest freshwater water lake in China and is a dish-shaped basin formed by the Yanshan Movement fault depression. Fault activity has occurred in Dongting basin since the Quaternary, which dominates the basin morphology and sedimentary strata. Dongting Basin belongs to the Quaternary sedimentary basin. On the basis of tectonic subsidence, Dongting Basin was filled by the sediments of Xiangjiang River, Zishui River, Yuanjiang River and Lishui River as well as the Yangtze River, and most of the area was covered by the Quaternary sediments [
19]. Dongting Lake is within both the Hunan and Hubei Province, located to the south of the middle Yangtze River which ranges from 28°42′N to 29°32′N and from 112°06′E to 113°09′E. There are seven water inlets feeding Dongting Lake including four rivers (Xiangjiang, Zishui, Yuanjiang and Lishui) and three outlets (Ouchi, Songzi, Taiping) of Yangtze River (
Figure 1) [
6,
9]. The water of Dongting Lake finally flows into the Yangtze River through Chenglingji hydrological station [
20]. The lake consists of East, West and South Dongting Lake. Its annual average air temperature is 16.8 °C, and annual precipitation ranges from 1100 to 1400 mm [
9,
12].
2.2. Datasets and Pre-Processing
2.2.1. Remote Sensing Dataset
The full time-series dataset of Landsat surface reflectance was used to obtain the annual occurrent frequency of surface water. The required Landsat surface reflectance was acquired directly from the GEE (Google Earth Engine) platform [
21]. The surface reflectance data from 1975 were a collection of Landsat Multispectral Scanner (MSS) with 78 m spatial resolution, the data from 1986 to 1999 and from 2003 to 2011 were a collection of Landsat Thematic Mapper (TM) with 30 m spatial resolution, the data from 2000, 2001, and 2012 were a collection of Landsat Enhanced Thematic Mapper (ETM) with 30 m spatial resolution, and the data from 2013 to 2019 were a collection of Landsat Operational Land Imager (OLI) with 30 m spatial resolution. The Landsat MSS dataset was resampled as images with 30 m spatial resolution to align the Landsat TM /ETM/ OLI datasets using the bilinear method. The Landsat ETM data from 2012 suffers from the banding issue, so ZiYuan-1 02C satellite (ZY-1-02C) data were used to improve the surface water result.
ZY-1-02C was launched on 22 December 2011 in China, equipped with a panchromatic multispectral (P/MS) cameral and two panchromatic high-resolution (HR) cameras. Its detail description of band parameters is listed in
Table 1. ZY-1-02C images with 10 m spatial resolution from June 13 and July 7 in 2012 were collected. The selected images were geometrically corrected using an RPC (Rational Polynomial Coefficient) model within a pixel error, and they were resampled as images with 30 m spatial resolution using the bilinear method.
The full time-series dataset of moderate-resolution imaging spectroradiometer (MODIS) TERRA surface reflectance (MOD09GA) with 500 m spatial resolution from 2000 to 2019 was employed to generate the monthly occurrence of surface water. This was acquired directly from the GEE platform and had a spatial resolution of 500 m.
A Digital Elevation Model (DEM) was used to remove the shadow of mountains and hills in order to improve the accuracy of surface water result. ALOS Global Digital Surface Model “ALOS World 3D-30m” Version 1.1 (AW3D30_V1_1) was selected and it was acquired directly from the GEE platform. AW3D30 was processed based on the AW3D DSM (Digital Surface Model) dataset, which was produced using the archived data of the Panchromatic Remote-sensing Instrument for Sterro Mapping (PRISM) onboard the Advanced Land Observing Satellite (ALOS) [
22]. The height accuracy of the AW3D30 dataset was confirmed as 4.4 m for Root Mean Square Error (RMSE) [
22].
2.2.2. Meteorological and Hydrological Data
Meteorological datasets, including monthly precipitation and temperature datasets from rain gauge measurements, were employed to analyze the response of surface water change to climate change. Monthly precipitation and air temperature data from meteorological stations at Changde, Nanjiang, Yueyang, pingjiang in the study area (
Figure 1) were collected from 1975 to 2019 and are available from the China Meteorological Administration (CMA,
http://data.cma.cn/, accessed on 2 December 2020). The rainfall and air temperature from the five stations closet to the Dongting Lake were averaged to represent the climate of the whole region in Dongting Lake [
9]. The monthly rainfall data was accumulated and added to obtain the annual rainfall, and the monthly mean air temperature was accumulated and averaged as annual mean air temperature.
Hydrological data of the annual average runoff of four rivers, three outlets and the Chenglingji hydrological station (
Figure 1) were used to analyze the influence of changes in hydrology on the surface water of Dongting Lake. Data were collected from previous literature [
9,
23] and the Hydrological Public Service Platform in Hunan Province (
http://yzt.hnswkcj.com:9090/#/, accessed on 5 April 2021).
3. Methods
In this paper, a multiple spectral indices method based on decision tree classification was used to extract surface water cover data for Dongting Lake. The surface water results extracted from the full-time Landsat surface reflectance dataset for each year were averaged as annual water occurrence from 1975 to 2019. That is, surface water occurrence is the water detections divided valid observations [
24]. For example, surface water occurrence in 2019 is water detections summed from 1 January to 31 December divided by valid observations from 1 January to 31 December in 2019. Similarly, the surface water results extracted from the full-time MOD09GA dataset for each month were averaged as monthly water occurrence frequency. In this paper, when the water occurrence was greater than 75%, the water was considered “permanent occurrent water” which is underwater throughout a period, such as the year, the month [
24]. When the occurrence value was greater than 5%, the water was considered “maximum surface water”, the maximum surface extent provides information on all the locations ever detected as water over a period [
24]. The seasonal occurrent water extent provides information on all the locations ever but not always detected as water over a period, so it can be computed by excluding the permanent occurrent water from the maximum surface water. Thus, annual permanent occurrent water broadly reflected the surface water cover in the dry season and annual maximum surface water represented the surface water cover in the wet season. The annual maximum surface water cover and annual permanent water cover were mapped to assess the inter-annual evolution of surface water from 1975 to 2019, and monthly maximum surface water cover was calculated to document the spatiotemporal variation of surface water cover in Dongting Lake. Hierarchical regression analysis and Mann–Kendall tests were used to quantitatively assess the meteorological and hydrologic factors driving surface water cover change. Finally, spatiotemporal changes of the permanent and seasonal occurrence surface water in Dongting Lake were analyzed according to the mutation of the long-term surface water from 1975 to 2019. A technical flow chart of the analysis is shown in
Figure 2.
3.1. Multiple Spectral Indices Method Based on a Decision Tree Classification
A multiple spectral indices algorithm based on decision tree classification was used to map surface water automatically on the GEE platform. Based on the analysis of spectral response mechanisms of the surface inland water, the algorithm used various synthetic indices and utilized the Joint Research Center (JRC) Global Surface Water dataset [
24] as prior knowledge to select samples randomly. Then, a decision tree model was built to train data and finally extract surface water cover automatically, as shown in
Figure 2.
3.1.1. Multiple Indices
The key to surface water extraction research is how to identify water from features which have similar spectral information, such as terrain shadows, buildings or building shadows, clouds or cloud shadows, ice or snow, and so on. In order to solve these problems, we utilized topographic indices, a modified normalized difference water index (MNDWI), the normalized difference water index (NDWI), the normalized difference vegetation index (NDVI) and automated water extraction index (AWEI).
(1) Terrain Shadow Mask
The topographic slope was calculated from the DEM dataset and was used to build a hill shadow mask. Slope was computed as the maximum rate of elevation difference between each pixel and its neighbors. The threshold of the topographic index was set with hill-shade slope > 10 degrees to identify terrain shadow mask, and then the impact of terrain shadow on water extraction can be weakened or even eliminated.
(2) NDVI
NDVI is indicative of vegetation cover and soil, so it is also widely used in methods for water extraction [
25,
26]. NDVI is calculated following [
27] by Equation (1).
where
and
are the surface reflectance of near infrared (NIR) band and red band, respectively.
(3) Water Indices
NDWI, which uses the difference ratio between green and near infrared (Equation (2)) and can enhance the information of water and weaken the information of vegetation, soil, buildings and other ground objects [
28]. It is calculated as follows:
MNDWI uses the difference ratio between short wave infrared (SWIR) and near infrared to increase the difference between water and other dark targets, especially high building shadows [
29]. MNDWI is calculated as follows (Equation (3)):
where
and
are the surface reflectance of band green and SWIR, respectively.
(4) AWEI
AWEI uses five spectral bands of Landsat TM data to enhance the contrast between water and other dark objects [
30]. There are two AWEI formulations,
and
, and they are calculated according to Equations (4) and (5) [
30], respectively.
can effectively eliminate dark built surfaces in urban areas.
can remove shadow objects that
may misclassify as water, but
cannot effectively eliminate ice, snow and reflective roofs [
30]. The study area is located in an area with limited ice and snow and around the hills, so
was used in this paper for Landsat and MODIS satellite observations.
where,
and
are the surface reflectance of band blue and SWIR2 band, respectively.
3.1.2. Classification and Regression Tree
The Classification and Regression Tree (CART) model is a decision tree prediction method developed by Breiman et al. [
31]. CART models can be used for both regression and classification, and its central method is to calculate the Gini coefficient to find the purest division method based on the impurity to form a binary tree. Owing to the advantages of the CART model—clear and easily understandable classification rules and efficient computation of large databases—it is widely used in remote sensing image classification [
25,
32]. In this paper, the CART algorithm provided by the GEE was applied to train decision classification rules. NDVI, MNDWI and AWEI were chosen as the input features of the algorithm for the Landsat TM/ETM/OLI and MOD09GA datasets, while NDVI and NDWI were chosen as the input features for Landsat MSS and ZY-1-02C datasets. Finally, the surface water cover results were predicted based on the trained classification model.
3.2. Mann–Kendall Test
The Mann–Kendall (M-K) test is a nonparametric statistical test that can judge increasing or decreasing trends of long time-series by statistic values and determine the possible mutations by drawing the curve of positive sequence statistic values called UF and inverse sequence statistic values called UB [
33,
34]. In this paper, the M-K test was used to analyze trend characteristics and potential mutations of surface water evolution in Dongting Lake. However, the M-K test calculates the sequence mutations only from the perspective of statistics. In order to make the analysis results more reasonable, the important time nodes of human activities in the basin and the formulation and change of the relevant policies should be considered to divide the surface water changes and hydrological stages.
If there is a time series sequence x with length
, the rank sequence
, the cumulative number that the number of the values at time
is greater than that at time
, can be constructed.
is expressed as Equations (6) and (7):
Values of a positive sequence
are identified using Equation (8):
where
is the mean (Equation (9)) of
, and
is the variance (Equation (10)) of
.
The statistics of inverted sequence are subsequently calculated by reversing the original time-series sequence and repeating the above steps. The significance level was set at p < 0.05, and the critical value in the normal distribution was obtained. Finally, the possible mutations were found by drawing the intersection points of and . Significant mutations were analyzed in combination with relevant policies and other hydrological data.
3.3. Hierarchical Multiple Regression
Comparing two or more regression models based on the difference in the variance explained by these models is known as hierarchical multiple regression (HMR). The more variance a model explains, the better it fits the data. HMR can also be used to evaluate individual variables. The way to test whether a predictor variable is significant is to compare two models, where the first model does not include the variable and the second model does. HMR was applied to explore the influence of meteorological factors and hydrological factors on the surface water cover of Dongting Lake. The evaluation statistics involved in HMR are listed in
Table 2.
4. Results and Analysis
4.1. Precision Validation of Extracted Surface Water Cover
The two track numbers from Landsat 5/7/8 data including path 124 row 40 and path 123 row 40 completely covered the study area, so ten images were randomly selected for every track to verify the water extraction results. The selected images are listed in
Table 3. Then, about 50 water sample points and 50 non-water sample points were selected using a stratified random approach. The original images combined with high resolution remote sensing images from Google Earth and Gao Fen number 1 and number 2 satellites (GF-1/2) launched in China were used as reference images for accuracy verification. The validation method was also applied to evaluate the accuracy of surface water extracted from Landsat MSS and ZY-1-02C data.
Table 4 shows the verification confusion matrix of surface water extraction results. It demonstrates that the mapping accuracy, user accuracy and overall accuracy of the surface water extraction was 90%, indicating that the method used was reliable for subsequent analysis.
A correlation analysis was used to evaluate the consistency of the surface water extraction results from MODIS and Landsat, and the result is shown in
Figure 3. The correlation coefficient of annual maximum surface water between Landsat and MODIS was 0.97148 and the RMSE was 47.64, showing that the surface water extraction results from MODIS data closely agreed with those from Landsat. Therefore, the surface water extracted from MODIS was reliable for seasonal change analysis of the surface water cover in the study area.
4.2. Annual Variation of Surface Water
4.2.1. Annual Changes of Long-Term Surface Water
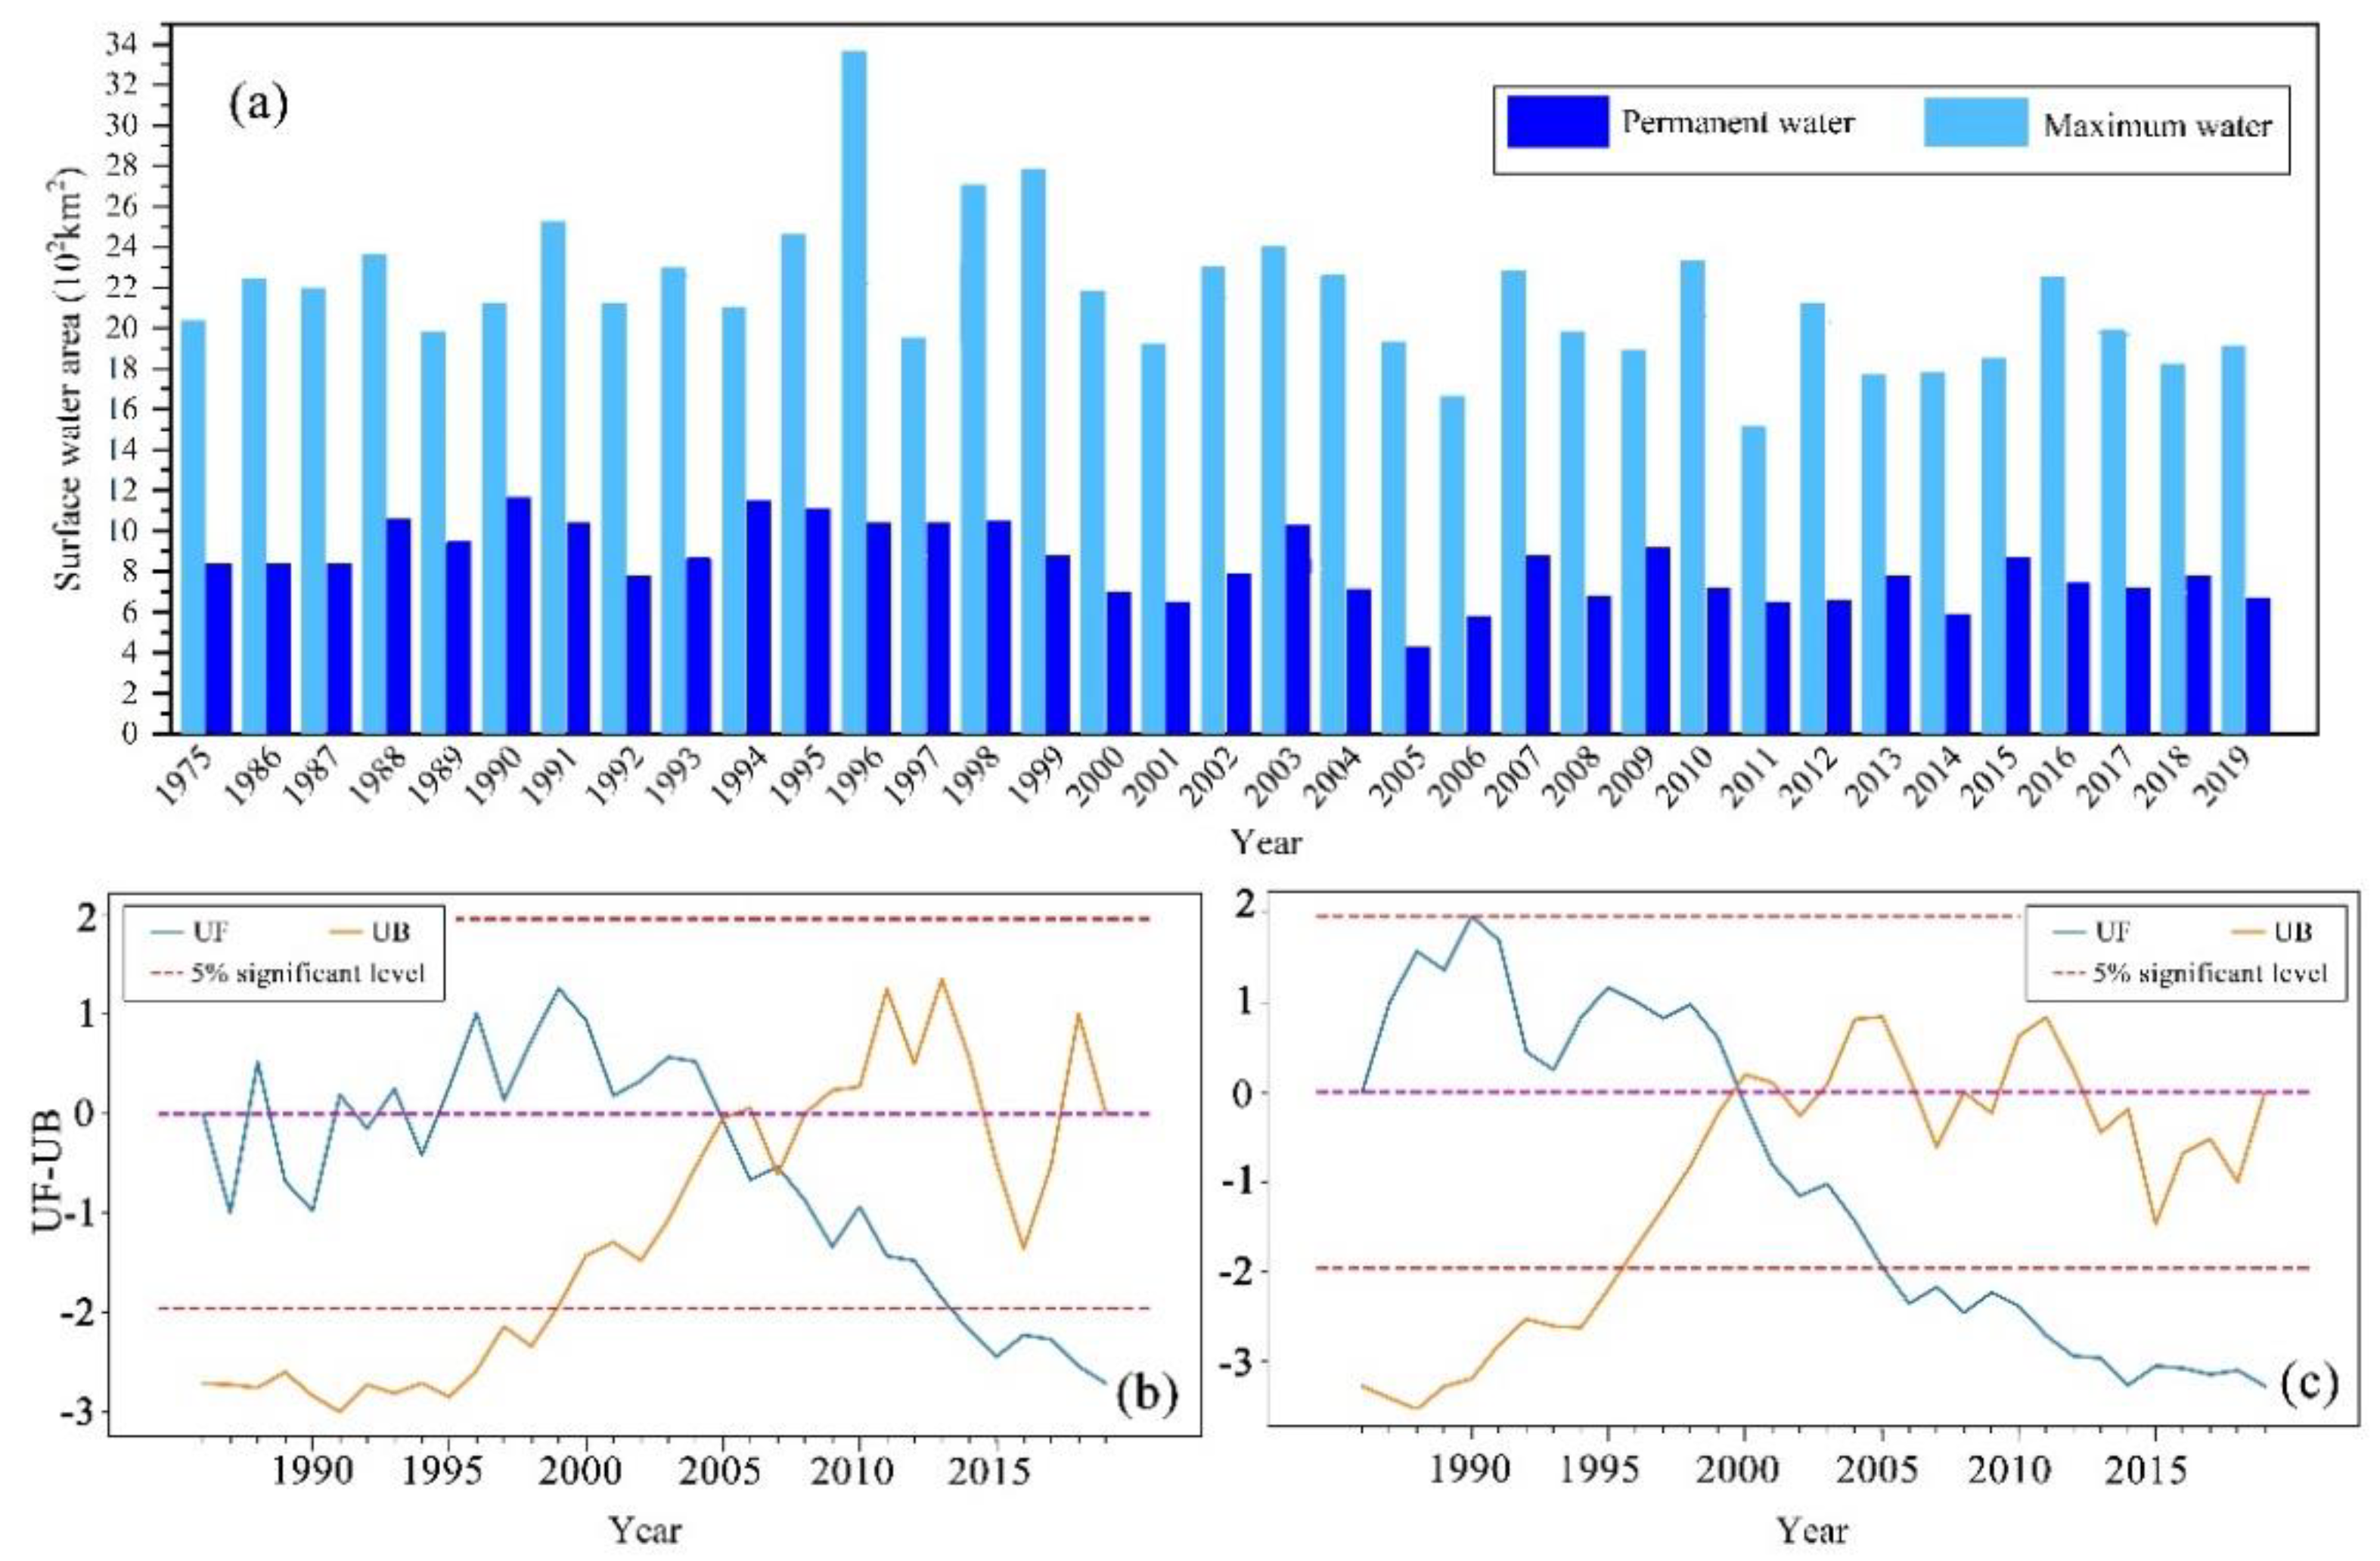
Figure 4 shows the annual maximum water and annual permanent water from 1975 to 2019 in Dongting Lake, while
Figure 5 shows the histograms and M-K test results for the annual maximum water and annual permanent water.
Figure 4 and
Figure 5a shows that the annual maximum surface water area in the 1990s was larger than in the other years. The largest annual maximum surface water area was recorded in 1996 at over 3200 km
2. The annual maximum surface water area was less than 1800 km
2 in 2006 and 2011, and the minimum was recorded in 2011. The M-K test results (
Figure 5b) of annual maximum water from 1986 to 2019 show that the annual maximum surface water surface of Dongting Lake increased during the 1990s but decreased obviously after 2000. There are two intersections in 2004 and 2006 between the UF and UB curves, which are possible statistical mutations. The possible mutation points of rainfall (
Figure 5b) and runoff at three outlets (Figure 7a) all occur around 2003. Furthermore, the TGD began to work after completed in 2003. Thus, it is possible that a mutation occurred in 2003 when considering hydrological, climate and anthropogenic factors. The results indicate that the annual maximum surface water in Dongting Lake reduced following 2003, and the average maximum water surface decreased by about 360 km
2 compared the pre-2003 period. The M-K test results (
Figure 5c) of annual permanent occurrent water demonstrate that the annual permanent occurrent water of Dongting Lake decreased from 1986 to 2019. An intersect between the UF and UB curves occurred in 1999 as well as that of air temperature. This suggests that the potential division point of permanent occurrent water sequence occurred in 1999, and the average permanent occurrent water after 1999 decreased by about 266 km
2 compared with the pre-1999 period.
4.2.2. Factors Driving Surface Water Change
(1) The Influence of Meteorological Elements on Surface Water
Annual rainfall and annual mean air temperature data were used to explore main climate factors that affect the annual change of surface water in the study area.
Figure 6a shows the change curves of annual precipitation and annual mean air temperature. The M-K test result (
Figure 6b) of rainfall shows that it decreased obviously from 2000 to 2011, and there are two intersects in 2003 and 2014 between the UF and UB curves, which are the possible statistical mutations. A potential mutation point of rainfall occurred in 2003, based on the maximum surface water and maximum runoff at three outlets all occurring around 2003. After 2003, the average rainfall decreased by about 137 mm compared. The M-K test result (
Figure 6c) of air temperature demonstrates that the change trend of the annual average air temperature of Dongting Lake is opposite to that of permanent occurrent water, that is, it increased from 1986 to 2019, especially after 1998, and a mutation occurred in 1999. The average temperature after 1999 overall increased by about 0.6 °C.
A correlation analysis was used to examine the relationship between climate and surface water (
Table 5). The correlation coefficient between annual maximum water with rainfall was 0.489 (
p < 0.01), which was higher than the correlation coefficient between annual maximum water with air temperature. The correlation coefficient between annual permanent occurrent water and temperature was −0.382 (
p < 0.05). These results suggest that rainfall has a significant positive impact on the annual maximum water, and temperature has a significant negative impact on annual maximum water.
The above results indicate that the maximum surface water is greatly affected by rainfall. The extreme annual maximum water surface cover values are closely related to the rainfall intensity in the Dongting Lake Basin. For example, the maximum surface water cover was larger in 1998, a year with an extreme flood event, and the maximum surface water cover was smaller in 2006 and 2011, in which there were extreme drought events. Temperature has a certain influence on the permanent occurrent water of Dongting Lake. The permanent occurrent water reflects the surface water in the dry season. Therefore, the rise of temperature will lead to the increase of evapotranspiration in Dongting Lake area, which reduces the permanent occurrent water. However, it is worth noting that the rainfall in 2002 was the largest from 1975 to 2019, but the maximum surface water remained relatively stable. When hydrological factors are considered, it can be found that the maximum surface water in 2002 resulted from low runoff of three outlets and high runoff at Chenglingji (
Figure 7a). This phenomenon may be caused by enhancing the regulation and storage capacity of Dongting Lake area after the implementation of the project of returning farmland to the lake since 1998.
Hierarchical regression was used to quantitatively evaluate the influence of rainfall and temperature on the annual maximum surface water in Dongting Lake. Linear regression model 1 was built with surface water area set as the independent variable and temperature set as the dependent variable. Rainfall was then added as a dependent variable to build linear regression model 2.
Table 6 shows the result of the hierarchical regression analysis. It demonstrates that when temperature is the only independent variable for linear regression analysis, the model R
2 value equals 0.125, and the model passed the F test. After adding rainfall based on model 1, the F value changed significantly and the R
2 value rose from 0.125 to 0.330. The results indicate that rainfall can explain 20.5% of the annual change of surface water and that air temperature can explain 12.5% of annual changes of surface water. This result suggests that changes of surface water are caused not only by temperature and rainfall but may also be affected by human activities that affect the hydrological regime.
(2) Influence of Hydrological Factors on Surface Water
According to the principle of lake water balance, the change of maximum surface water is mainly affected by the outlet and inlet runoff of lakes in terms of hydrological factors. In this paper, the main hydrological factors of surface water change are analyzed based on runoff data from three outlets, four rivers and the Chenglingji. The outlet and inlet runoff of lakes are affected by natural factors and human activities, which will directly lead to surface water changes. The M-K test result (
Figure 7c) of runoff at the three outlets shows that runoff decreased obviously from 1986 to 2018, and a potential mutation occurred in 2003 according to the intersect between UF and UB curves and the beginning of the TGD construction. The M-K test result (
Figure 7d) of runoff at the four rivers demonstrates that runoff increased from 1986 to 1998, then decreased obviously after 1998. There are several intersects from 2006 onward, which may be a statistical anomaly. The M-K test result (
Figure 7b) of the Chenglingji runoff data shows that runoff also increased there from 1986 to 1998 but decreased obviously after 1998. Potential mutation points of hydrological sequences in Dongting Lake appear to have occurred in 2003 according to this analysis. The change trend of three outlets runoff is the most consistent with the change trend of the maximum surface water. It suggests that the three outlets runoff is the main hydrological factor affecting the maximum surface water change in Dongting Lake. The average runoff at the three outlets after 2003 decreased by about 150 × 10
8 m
3.
To understand the influence of rainfall on water runoff, a correlation analysis between rainfall and runoff at the three outlets, four rivers and Chenglingji was carried out (
Table 7). It was found that all of the runoffs had a significant positive correlation with rainfall, and the correlations between runoff both at the Chenglingji and four rivers and rainfall were very strong, while the correlation between the three outlets runoff and rainfall was relatively weak. These results show that the influence of runoff at Chenglingji and four rivers on surface water is mainly caused by rainfall in Dongting Lake Basin, while the influence of human activities, such as water conservancy projects, in the four rivers basin on surface water is relatively weak. The influence of three outlets runoff on surface water is mainly caused by human activities. The three outlets discharge water from the upstream flow of the Yangtze River into Dongting Lake, and it decreased significantly due to the influence of human activities, such as the Gezhouba River closure and the TGD construction, especially after 2003 when the TGD became functional.
Hierarchical regression was used to analyze the influence of three outlets runoff and four rivers runoff on surface water in Dongting Lake. Linear regression model 1 was built with surface water area set as the independent variable and three outlets runoff set as the dependent variable. The four rivers runoff was added as the dependent variable to build linear regression model 2.
Table 8 shows the results of the hierarchical regression analyses. When the three outlets runoff is the only independent variable for the linear regression analysis, the model R
2 value equals 0.379, and the model passed the F test. After adding the four rivers runoff based on model 1, the F value changed significantly, and R
2 rose from 0.379 to 0.481. The results indicate that the three outlets runoff explained 37.9% of annual changes of surface water, and four rivers runoff explained 10.2% of annual change in surface water. Thus, we consider that the influence of runoff on surface water is stronger than the rainfall and air temperate. It also shows that changes of surface water are the result of the comprehensive influence of climate and human activities.
4.3. Changes of Surface Water with 2003 as the Mutation Points
It is known that the surface water area after 2003 (post-TGD) was reduced, so the changes of permanent and seasonal surface water were analyzed by taking 2003 as the division point. Maximum surface water and seasonal occurrent water from 1986 to 2003 (pre-TGD) and from 2004 to 2019 (post-TGD) were obtained based on the occurrence frequency of surface water. The permanent and seasonal surface water changes map (
Figure 8) was subsequently generated using the maximum surface water and permanent occurrent water over the two periods, and finally, the confusion matrix of surface water change was calculated (
Table 9). Permanent legend in
Figure 8 means the areas being always surface water both in the pre-TGD and post-TGD, new permanent legend is the areas being non-water in the pre-TGD but permanent occurrent water in the post-TGD, lost permanent legend is the areas being permanent occurrent water in the pre-TGD but non-water in the post-TGD, seasonal legend are the areas being seasonal occurrent water both in the pre-TGD and post-TGD, lost seasonal legend means the areas being seasonal occurrent water in the pre-TGD but non-water in the post-TGD, permanent to seasonal legend is the areas being permanent water in the pre-TGD but seasonal occurrent water in the post-TGD, seasonal to permanent legend is the areas being seasonal occurrent water in the pre-TGD but permanent occurrent water in the post-TGD.
Figure 8 illustrates that seasonal and permanent surface water dominates in East Dongting Lake, while there is mainly seasonal surface water in West Dongting Lake. The confusion matrix shows that the area of surface water always occurring from 1986 to 2019 was 525.4 km
2, while area of permanent occurrent water in the pre-TGD period that changed into seasonal water in the post-TGD period is 208.6 km
2. Very little permanent occurrent water in the pre-TGD period has disappeared in the post-TGD period. The area of seasonal occurrent water that was unchanged is 1974.4 km
2, while the area of seasonal occurrent water in the pre-TGD period that changed into permanent occurrent water in the post-TGD period is 31.3 km
2. The area of seasonal water in the pre-TGD that disappeared in the post-TGD period is 663.1 km
2, and this was mainly located in East Dongting Lake and South Dongting Lake.
4.4. Seasonal Variations of Surface Water
4.4.1. Seasonal Changes of Surface Water
Figure 9 shows the seasonal change curves of monthly maximum surface water, rainfall and temperature from 2000 to 2019. It illustrates that the surface water area has decreased overall after 2003 in the study area and that the surface water fluctuates regularly, with obvious seasonal characteristics. The surface water increases with the arrival of the flood season from May to June every year, then peaks during the period from July to September, and gradually shrinks in October, reaching a low in January and February. This pattern is highly consistent with the division of the dry season and wet season. However, the seasonal changes of surface water are significantly altered when droughts or floods occur.
Figure 10 and
Figure 11 show seasonal changes of surface water in dry years (2006 and 2011) and wet years (2010 and 2016). The monthly maximum surface water in 2006 began to expand in May, reaching a maximum of about 1400 km
2 in July, and it began to shrink rapidly in August which entered the dry period in advance about two months. The annual rainfall in 2006 was 1189.16 mm, which is close to the average, but the runoff at the three outlets was only 180 × 10
8 m
3, which was the lowest recorded in the last 40 years. The sharp decline of surface water cover in 2006 was likely caused by the hydrological drought event dominated by the decrease of runoff at the lake inlets. The monthly maximum surface water in 2011 began to expand in June, reaching about 1400 km
2 in July, and it began to shrink rapidly in September which entered the dry period in advance about one month. The annual rainfall in 2011 was only 872 mm, which was the minimum recorded in our data, and the runoff at three outlets was only 276 × 10
8 m
3. Thus, the extreme reduction of surface water in 2011 was caused by the hydrological and meteorological drought event that resulted from the decrease of rainfall in the basin.
The monthly maximum surface water in 2010 began to expand sharply in May, reaching a maximum of about 1800 km2 in August, and it reduced suddenly in November. The annual precipitation in 2010 was 1698.06 mm, which was the highest recorded from 2003 to 2019, and the runoff at the three outlets and four rivers was at its highest level since 2003. The monthly maximum surface water in 2016 began to increase quickly in April, reaching a maximum of about 2300 km2 in July, and it began to reduce again in September. The monthly precipitation in July 2016 was over 300 mm, and the runoff of the three outlets and four rivers was at its highest level since 2003. The results suggests that the significant rises of surface water in both 2010 and 2016 were the result of the hydrological and meteorological flood events caused by increased precipitation in the basin.
4.4.2. Response Analysis of Seasonal Change in Surface Water to Climate Change
Figure 9 shows that the seasonal change trend of surface water is highly consistent with the seasonal change trend of temperature, and the seasonal change of surface water has a certain delayed response to rainfall. That is, when rainfall reaches the peak, surface water usually reaches its peak one or two months later. Correlation analysis was used to analyze the delayed response of surface water to rainfall change, and experiments were conducted in three cases: response without delay, one-month delayed response and two-months delayed response. The correlation coefficient between rainfall and surface water area without delay was 0.318 (
p < 0.01), while for the one-month delay it was 0.571 (
p < 0.01) and for a two-month delay it was 0.559 (
p < 0.01). This result shows that surface water in all three cases exhibited a significant positive relationship with rainfall but that seasonal change of surface water has a one-month delayed response to rainfall, as this showed the strongest correlation coefficient. Finally, a linear regression model was built by taking one-month delayed water as the dependent variable and rainfall as the independent variable. The model R
2 value was 0.326, meaning rainfall explains 32.6% of seasonal changes in surface water.
5. Conclusions
Long-term surface water variations in Dongting Lake were monitored from 1975 to 2019 in this study, and we have reached the following conclusions.
(1) We proposed a decision tree-based multiple spectral indices method to evaluate surface water change in Dongting Lake. We selected NDVI, NDWI, MNDWI and AWEI as the input features and used a decision tree classification model to build classification rules. It realized automatic, high precision and fast extraction of surface water with over 90% mapping accuracy, user accuracy and overall accuracy.
(2) Both the annual maximum surface water and annual permanent occurrent water obviously decreased from 1975 to 2019 in Dongting Lake. The annual maximum surface water surface of Dongting Lake increased during the 1990s but decreased after 2000. Long-term changes of surface water are the result of the influence of both metrological factors and human activities in Dongting Lake. Metrological elements, including rainfall and temperature, accounted for 33% of the variance in surface water change. Rainfall is the main driving factor of surface water in the wet season, while temperature is the main influencing factor on surface water in dry season. Runoff at the three outlets, four rivers and Chenglingji explained 48.1% of the variance in surface water. The three outlets runoff, which is mainly affected by human activities, is the main hydrological factor affecting surface water change. A potential division year of both the hydrological regime and long-term surface water sequence from 1986 to 2019 is 2003, which coincides with the beginning of the TGD implementation. The surface water decreased by about 360 km2 and the three outlets runoff decreased by about 150 × 108 m3 after the impoundment of the TGD, which was likely the main cause of surface water changes over recent years.
(3) There is mainly seasonal and permanent occurrent surface water in East Dongting Lake and mainly seasonal occurrent surface water in West Dongting Lake. The area of surface water change from permanent occurrent water in the pre-TGD period to seasonal occurrent water in the post-TGD period was 208.6 km2, and this was mainly located in East Dongting Lake and South Dongting Lake. The area of surface water change from seasonal occurrent water in the pre-TGD period to permanent occurrent water in the post-TGD period was only 31.3 km2, and this was mainly located in West Dongting Lake.
(4) Surface water fluctuates seasonally in Dongting Lake, although these changes are altered when drought or flood events occur. The causes of flood and drought events are diverse and complex in Dongting Lake, for example, an extreme hydrological drought event occurring in 2006 was mainly caused by a serious decrease of runoff into the lake, while an extreme meteorological drought event occurring in 2011 resulted from a significant decrease in rainfall, and flooding in 2010 and 2016 was mainly the result of increased precipitation and runoff into the lake. These findings provide some guidance and reference for the formulation of scientific and reasonable measures to prevent flooding and drought disasters and to alleviate regional ecological and environmental problems. The seasonal change of surface water has a one-month delayed response to the seasonal change of rainfall.
Author Contributions
Conceptualization, G.H. and G.W.; methodology, Y.P.; software, Y.P.; validation, Y.P. and G.W.; formal analysis, Y.P.; investigation, Y.P.; resources, Y.P. and H.C.; data curation, Y.P.; writing—original draft preparation, Y.P.; writing—review and editing, G.H.; visualization, Y.P.; supervision, G.W.; project administration, G.H.; funding acquisition, G.H. All authors have read and agreed to the published version of the manuscript.
Funding
This research was funded by the Strategic Priority Research Program of the Chinese Academy of Sciences under Grant number XDA19090300; National Natural Science Foundation of China under Grant number 61731022; Key International (Regional) Cooperation Projects of the National Natural Science Foundation of China under Grant number 61860206004.
Data Availability Statement
Acknowledgments
We thank Google for providing GEE platform to efficiently process massive remote sensing data, we also thank the China Meteorological Administration and Hunan Hydrology and Water Resources Survey Center for providing relevant data support.
Conflicts of Interest
The authors declare no conflict of interest.
References
- Benson, L.V.; Paillet, F.L. The use of total lake surface area as an indicator of climatic-change: Examples from the lahontan basin. Quat. Res. 1989, 10, 262–275. [Google Scholar] [CrossRef]
- Smith, L.C.; Sheng, Y.; Macdonald, G.M.; Hinzman, L.D. Disappearing Arctic lakes. Quat. Res. 2005, 308, 1429. [Google Scholar] [CrossRef] [PubMed] [Green Version]
- Ren, G.; Guo, J.; Xu, M.; Chu, Z.; Zhang, L.; Zou, X.; Li, Q.; Liu, X. Climate Changes of China’s Mainland over the past Half Century. Acta Meteorol. Singca 2005, 63, 942–956. [Google Scholar]
- Ding, Y.; Ren, G.; Shi, G.; Gong, P.; Zheng, X.; Zhai, P.; Zhang, D.; Zhao, Z.; Wang, S.; Wang, H.; et al. National Assessment Report of Climate Change (I): Climate change in China and its future trend. Adv. Clim. Chang. Res. 2006, 2, 3–8. [Google Scholar]
- Zhang, L.; Chen, X.; Zhao, Z.; Hu, Z. Progress in study of Climate Change Impacts on Hydrology and Water Resources. Prog. Geogr. 2008, 3, 60–67. [Google Scholar]
- Huang, S.; Li, J.; Xu, M. Water surface variations monitoring and flood hazard analysis in Dongting Lake area using long-term Terra/MODIS data time series. Nat. Hazards 2012, 62, 93–100. [Google Scholar] [CrossRef]
- Li, J.; Yin, H.; Chang, J.; Lu, C.; Zhou, H. Sedimentation effects of the Dongting Lake Area. J. Geog. Sci. 2009, 19, 287–298. [Google Scholar] [CrossRef]
- Peng, D.; Xiong, L.; Guo, S.; Shu, N. Study of Dongting Lake area variation and its influence on water level using MODIS data. Hydrol. Sci. J. 2005, 50, 31–44. [Google Scholar] [CrossRef]
- Yang, L.; Wang, L.; Yu, D.; Yao, R.; Li, C.; He, Q.H.; Wang, S.; Wang, L. Four decades of wetland changes in Dongting Lake using Landsat observations during 1978–2018. J. Hydrol. 2020, 587, 1–14. [Google Scholar] [CrossRef]
- Zhao, S.; Fang, J. Impact of impoldering and lake restoration on land-cover changes in Dongting Lake area. R. Swed. Acad. Sci 2004, 33, 311–315. [Google Scholar] [CrossRef] [PubMed]
- Han, Q.; Zhang, S.; Huang, G.; Zhang, R. Analysis of long-term water level variation in Dongting Lake, China. Water 2016, 8, 306. [Google Scholar] [CrossRef] [Green Version]
- Hu, Y.; Huang, J.; Du, Y.; Han, P.; Wang, J.; Huang, W. Monitoring wetland vegetation pattern response to water-level change resulting from the Three Gorges Project in the two largest freshwater lakes of China. Ecol. Eng. 2015, 74, 274–285. [Google Scholar] [CrossRef]
- Yuan, Y.; Zeng, G.; Liang, J.; Huang, L.; Hua, S.; Li, F.; Zhu, Y.; Wu, H.; Liu, J.; He, X.; et al. Variation of water level in Dongting Lake over a 50-year period: Implications for the impacts of anthropogenic and climatic factors. J. Hydrol. 2015, 525, 450–456. [Google Scholar] [CrossRef]
- Yang, N.; Li, J.; Mo, W.; Luo, W.; Wu, D.; Gao, W.; Sun, C. Water depth retrieval models of East Dongting Lake, China, using GF-1 multi-spectral remote sensing images. Glob. Ecol. Conserv. 2020, 22, 1–10. [Google Scholar] [CrossRef]
- Long, Y.; Tang, R.; Jiang, C.; Hu, S. Estimating Real-Time Area of Dongting Lake Using Water Level Information. Water 2019, 11, 1240. [Google Scholar] [CrossRef] [Green Version]
- Gao, Y.; Xie, Y.; Zhou, D.; Hou, T.; Li, Z. Changes and driving factors of water surface area for inner lakes in Lake Dongting district in the past 40 years. J. Lake Sci. 2019, 27, 3025–3033. [Google Scholar] [CrossRef]
- Feng, Z.; Li, X. Remote sensing monitoring study for water area change and lakeshore evolution of Qinghai Lake in last 20 years. J. Palaeogeogr. 2006, 8, 131–141. [Google Scholar] [CrossRef] [Green Version]
- Zhao, Y.; Yang, J. Dynamic monitoring on water level of Angulinao Lake and the causes of drying up. J. Geo-Inf. Sci. 2009, 11, 312–318. [Google Scholar] [CrossRef]
- Zhao, J.; Li, C.; Zhang, Y.; Qiang, X.; Xiong, D. Quaternary Chronostratigraphy of Borehole S3-7 in Dongting Basin. Earth Sci. 2016, 41, 633–643. [Google Scholar]
- Lai, X.; Jiang, J.; Huang, Q. Effects of the normal operation of the Three Gorges Reservoir on wetland inundation in Dongting Lake, China: A modelling study. Hydrol. Sci. J. 2013, 58, 1467–1477. [Google Scholar] [CrossRef] [Green Version]
- Gorelick, N.; Hancher, M.; Dixon, M.; Ilyushchenko, S.; Thaub, D.; Moore, R. Google Earth Engine: Planetary-scale geospatial analysis for everyone. Remote Sens. Environ. 2017, 202, 18–27. [Google Scholar] [CrossRef]
- Tadono, T.; Nagai, H.; Ishida, H.; Oda, F.; Naito, S.; Minakawa, K.; Iwamoto, H. Initial Validation of the 30 m-mesh Global Digital Surface Model Generated by ALOS PRISM. Int. Arch. Photogramm. Remote Sens. Spat. Inf. Sci. ISPRS 2016, XLI-B4, 157–162. [Google Scholar] [CrossRef]
- Zhou, L.; Li, J.; Tang, X.; Zhou, Y.; Ni, X. Dynamics of water level of Lake Dongting during the past 60 years and the associated driving factors. J. Glaciol. Geocryol. 2017, 39, 660–671. [Google Scholar] [CrossRef]
- Pekel, J.F.; Cottam, A.; Gorelick, N.; Belward, A.S. High-resolution mapping of global surface water and its long-term changes. Nature 2016, 540, 418–422. [Google Scholar] [CrossRef] [PubMed]
- Feng, M.; Sexton, J.O.; Channan, S.; Townshend, J.R. A global, high-resolution (30-m) inland water body dataset for 2000: First results of a topographic-spectral classification algorithm. Int. J. Digit. Earth 2016, 9, 113–133. [Google Scholar] [CrossRef] [Green Version]
- Townshend, J.R.G.; Justice, C.O. Analysis of the dynamics of African vegetation using the normalized difference vegetation index. Int. J. Remote Sens. 1986, 7, 1435–1455. [Google Scholar] [CrossRef]
- Deering, D.W. Rangeland Reflectance Characteristics Measured by Aircraft and Spacecraft Sensors. Texas A&M University. 1978. Available online: https://hdl.handle.net/1969.1/DISSERTATIONS-253780 (accessed on 5 April 2021).
- McFeeters, S.K. The Use of Normalized Difference Water Index (NDW I) in the Delineation of Open Water Features. Int. J. Remote Sens. 1996, 17, 1425–1432. [Google Scholar] [CrossRef]
- Xu, H.Q. Modification of normalized difference water index (NDWI) to enhance open water features in remotely sensed imagery. Int. J. Remote Sens. 2006, 27, 3025–3033. [Google Scholar] [CrossRef]
- Feyisa, G.L.; Meilby, H.; Fensholt, R.; Pround, S.R. Automated Water Extraction Index: A new technique for surface water mapping using Landsat imagery. Remote Sens. Environ. 2014, 140, 23–35. [Google Scholar] [CrossRef]
- Breiman, L.; Friedman, R.; Olshen, R.; Stone, C.J. Classification and Regression Trees; Chapman and Hall/CRC: Boca Raton, FL, USA, 1984. [Google Scholar]
- Hansen, M.C.; Reed, B. A comparison of the IGBP DISCover and University of Maryland 1 km global land cover products. Int. J. Remote Sens. 2000, 21, 1365–1373. [Google Scholar] [CrossRef]
- Kendall, M.A.; Stuart, A. The Advanced Theory of Statistics, 2nd ed.; Charles Griffin: London, UK, 1967. [Google Scholar]
- Mann, H.B. Non-parametric tests against trend. Econometica 1945, 13, 245–259. [Google Scholar] [CrossRef]
Figure 1.
Map of the study area.
Figure 1.
Map of the study area.
Figure 2.
Flow chart of surface water change analysis based on multisource remote sensing images.
Figure 2.
Flow chart of surface water change analysis based on multisource remote sensing images.
Figure 3.
Correlation of annual maximum surface water between Landsat and MODIS.
Figure 3.
Correlation of annual maximum surface water between Landsat and MODIS.
Figure 4.
Annual maximum water and annual permanent occurrent water of Dongting Lake Figure 1975 to 2019.
Figure 4.
Annual maximum water and annual permanent occurrent water of Dongting Lake Figure 1975 to 2019.
Figure 5.
Changes of surface water from 1975 to 2019 at Dongting Lake: (a) Permanent and maximum surface water histograms; (b) M-K test results of maximum surface water; and (c) M-K test result of permanent occurrent water.
Figure 5.
Changes of surface water from 1975 to 2019 at Dongting Lake: (a) Permanent and maximum surface water histograms; (b) M-K test results of maximum surface water; and (c) M-K test result of permanent occurrent water.
Figure 6.
Annual changes of rainfall and air temperature from 1975 to 2019: (a) changes of rainfall and temperature; (b) M-K test result for rainfall; and (c) M-K test result for air temperature.
Figure 6.
Annual changes of rainfall and air temperature from 1975 to 2019: (a) changes of rainfall and temperature; (b) M-K test result for rainfall; and (c) M-K test result for air temperature.
Figure 7.
Change in runoff from 1986 to 2018: (a) Runoff curves; (b) M-K test result of Chenglingji runoff; (c) M-K test result of three outlets runoff; and (d) M-K test result of four rivers runoff.
Figure 7.
Change in runoff from 1986 to 2018: (a) Runoff curves; (b) M-K test result of Chenglingji runoff; (c) M-K test result of three outlets runoff; and (d) M-K test result of four rivers runoff.
Figure 8.
Permanent and seasonal water changes in Dongting Lake.
Figure 8.
Permanent and seasonal water changes in Dongting Lake.
Figure 9.
Seasonal changes of surface water, precipitation and temperature from 2000 to 2019.
Figure 9.
Seasonal changes of surface water, precipitation and temperature from 2000 to 2019.
Figure 10.
Dongting Lake monthly surface water in (a) 2006, (b) 2011, (c) 2010 and (d) 2016.
Figure 10.
Dongting Lake monthly surface water in (a) 2006, (b) 2011, (c) 2010 and (d) 2016.
Figure 11.
The monthly water area (a) and precipitation and temperature data (b) for 2006, 2011, 2010 and 2016.
Figure 11.
The monthly water area (a) and precipitation and temperature data (b) for 2006, 2011, 2010 and 2016.
Table 1.
Band parameters of the ZY-1-02C satellite.
Table 1.
Band parameters of the ZY-1-02C satellite.
| Parameters | P/MS Cameral | HR Cameral |
|---|
| Spectral region | Panchromatic band | B1: 0.51–0.85 um | 0.50–0.80 um |
| Multispectral bands | B2: 0.52–0.59 um |
| B3: 0.63–0.69 um |
| B4: 0.77–0.89 um |
| Spatial resolution | Panchromatic band | 5 m | 2.36 m |
| Multispectral bands | 10 m |
Table 2.
Evaluation statistics for HMR.
Table 2.
Evaluation statistics for HMR.
| Indexes | Explanation |
|---|
| R2 | The interpretation power of the model. The value ranges from 0 to1, with 1 indicating that the model fits the data better and model interpretation is stronger. |
| Adjusted R2 | The R2 when the number of penalty independent variables increases. |
| F | Used to determine whether a model is significant; a model is significant when p < 0.05. |
| ΔR2 | The change of R2 when the model is altered. |
Table 3.
Selected images used for accuracy verification.
Table 3.
Selected images used for accuracy verification.
| P123R40 | P124R40 |
|---|
| ID | Satellite | Date | Cloud Cover (%) | ID | Satellite | Date | Cloud Cover (%) |
|---|
| 1 | Landsat5 | 19971108 | 52 | 1 | Landsat5 | 19871120 | 1 |
| 2 | Landsat5 | 19930129 | 0 | 2 | Landsat5 | 19950907 | 1 |
| 3 | Landsat5 | 20000727 | 12 | 3 | Landsat5 | 20060719 | 4 |
| 4 | Landsat5 | 20060407 | 8 | 4 | Landsat5 | 20101205 | 3 |
| 5 | Landsat5 | 20090720 | 4 | 5 | Landsat5 | 19980814 | 16 |
| 6 | Landsat7 | 20001007 | 9 | 6 | Landsat7 | 20020105 | 0 |
| 7 | Landsat7 | 20020319 | 24 | 7 | Landsat7 | 20010915 | 0 |
| 8 | Landsat8 | 20140123 | 0.5 | 8 | Landsat8 | 20131010 | 0.36 |
| 9 | Landsat8 | 20161128 | 4.01 | 9 | Landsat8 | 20181125 | 9.49 |
| 10 | Landsat8 | 20191020 | 3.94 | 10 | Landsat8 | 20170717 | 2.97 |
Table 4.
Accuracy verification confusion matrix.
Table 4.
Accuracy verification confusion matrix.
| Data | Class | Water | Non-Water | User Accuracy (%) | Mapping Accuracy (%) |
|---|
| Landsat 5/7/8 | Water | 9971 | 29 | 99.71 | 99.81 |
| Non-water | 19 | 9981 | 99.81 | 99.71 |
| Overall accuracy (%) | 99.7 |
| Kappa | 0.995 |
| Landsat MSS | Water | 192 | 4 | 97.96 | 95.52 |
| Non-water | 9 | 195 | 95.59 | 97.99 |
| Overall accuracy (%) | 96.75 |
| Kappa | 0.935 |
| ZY-1-02C | Water | 190 | 7 | 96.45 | 96.94 |
| Non-water | 6 | 165 | 96.49 | 95.93 |
| Overall accuracy (%) | 96.47 |
| Kappa | 0.929 |
Table 5.
Correlation analysis of the relationship between surface water and climate.
Table 5.
Correlation analysis of the relationship between surface water and climate.
| Climate Data | Indexes | Maximum Water | Permanent Water |
|---|
| Precipitation | correlation coefficient | 0.489 ** | 0.274 |
| p-value | 0.004 | 0.123 |
| Temperature | correlation coefficient | −0.353 * | −0.382 * |
| p-value | 0.044 | 0.028 |
Table 6.
Result of the hierarchical regression analysis for meteorological data.
Table 6.
Result of the hierarchical regression analysis for meteorological data.
| Indexes | Model 1 | Model 2 |
|---|
| Temperature | 6677.124 ** (3.109),
−258.251 * (−2.103) | 5098.052 * (2.576),
−221.570 (−2.017) |
| Precipitation | - | 0.681 ** (3.034) |
| Sample numbers | 33 | 33 |
| R² | 0.125 | 0.330 |
| Adjusted R² | 0.097 | 0.286 |
| F value | F (1,31) = 4.422, p = 0.044 | F (2,30) = 7.398, p = 0.002 |
| ΔR² | 0.125 | 0.205 |
| ΔF value | F (1,31) = 4.422, p = 0.044 | F (1,30) = 9.203, p = 0.005 |
Table 7.
Correlation coefficients between different runoffs and precipitation.
Table 7.
Correlation coefficients between different runoffs and precipitation.
| Climate Data | Three Outlets Runoff | Four Rivers Runoff | Chenglingji Runoff |
|---|
| Precipitation | 0.451 ** | 0.751 ** | 0.845 ** |
Table 8.
Result of the hierarchical regression analysis for hydrological data.
Table 8.
Result of the hierarchical regression analysis for hydrological data.
| Indexes | Model 1 | Model 2 |
|---|
| Constant | 1416.324 **, (7.753) | 773.619 *, (2.430) |
| Three outlets runoff | 1.332 **, (4.283) | 1.123 **, (3.717) |
| Four rivers runoff | - | 0.455 *, (2.386) |
| Sample numbers | 32 | 32 |
| R² | 0.379 | 0.481 |
| Adjusted R² | 0.359 | 0.446 |
| F value | F (1,30) = 18.347, p = 0.000 | F (2,29) = 13.457, p = 0.000 |
| ΔR² | 0.379 | 0.102 |
| ΔF value | F (1,30) = 18.347, p = 0.000 | F (1,29) = 5.695, p = 0.024 |
Table 9.
Accuracy verification confusion matrix. Unit (km2).
Table 9.
Accuracy verification confusion matrix. Unit (km2).
| Before 2003 | Class | After 2003 |
| Permanent Water | Seasonal Water | Non-Water | Total |
| Permanent water | 525.4329 | 208.5593 | 0.0133 | 734.0055 |
| Seasonal water | 31.2932 | 1974.3678 | 663.1323 | 2668.7933 |
| Non-water | 0 | 18.6076 | - | - |
| Total | 556.7261 | 2201.5347 | - | - |
| Publisher’s Note: MDPI stays neutral with regard to jurisdictional claims in published maps and institutional affiliations. |
© 2021 by the authors. Licensee MDPI, Basel, Switzerland. This article is an open access article distributed under the terms and conditions of the Creative Commons Attribution (CC BY) license (https://creativecommons.org/licenses/by/4.0/).


