
Assessing the Impact of Light/Shallow Precipitation Retrievals from Satellite-Based Observations Using Surface Radar and Micro Rain Radar Observations


Abstract
:
1. Introduction
2. Methodology
2.1. Data Sets
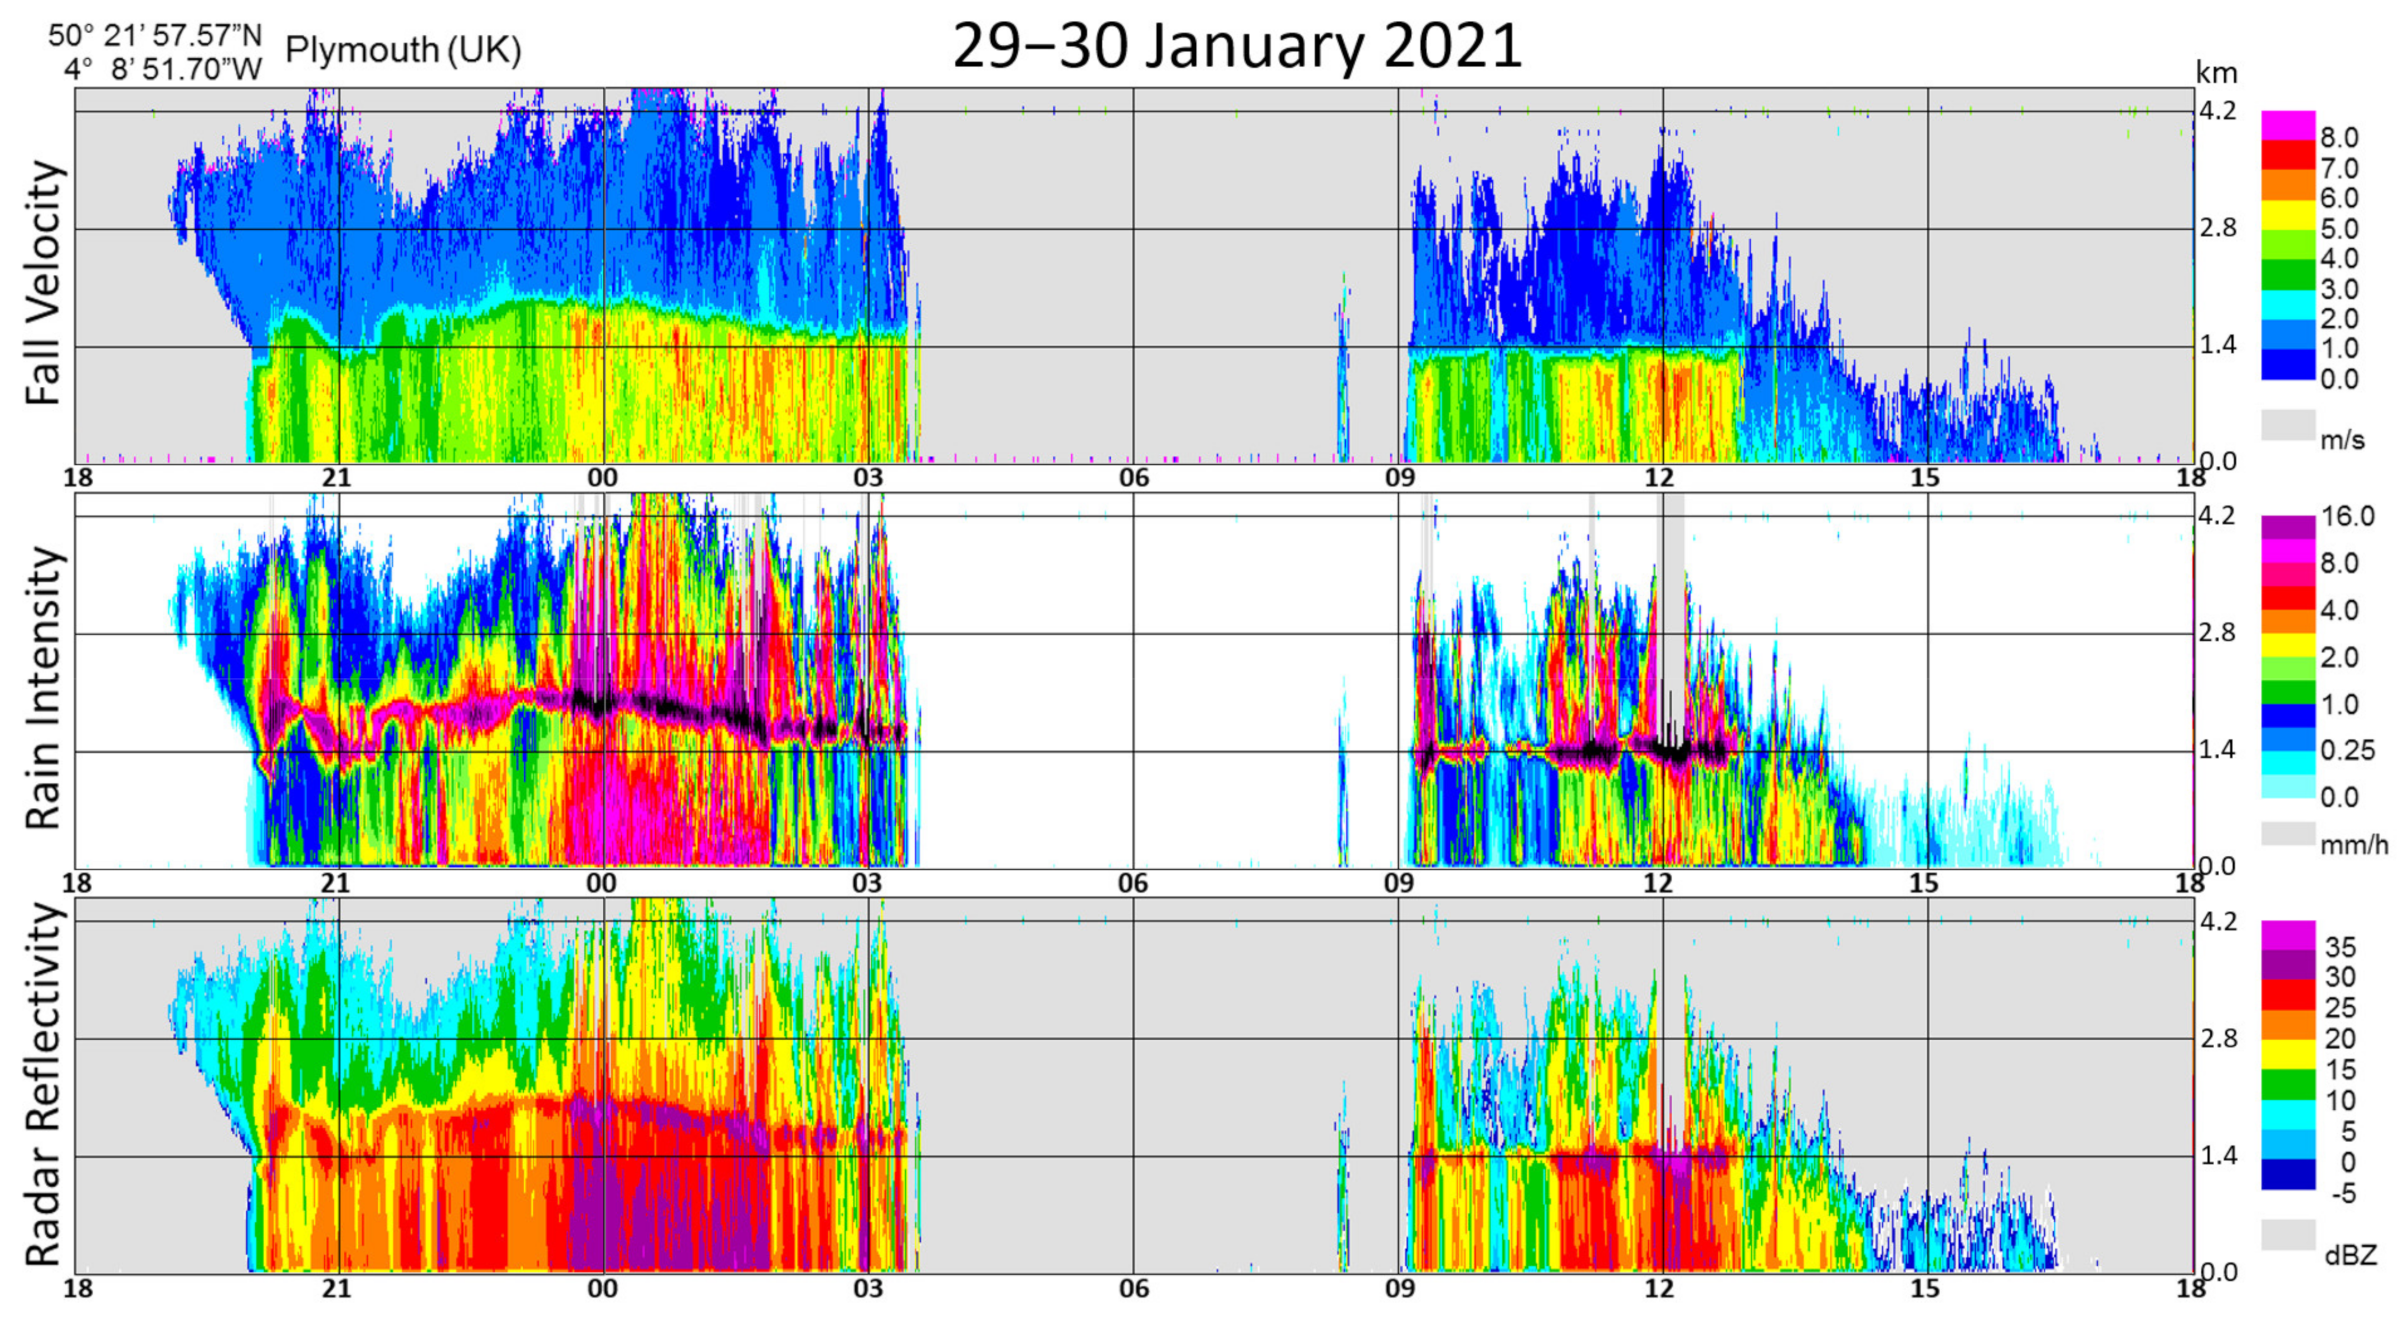
2.1.1. Surface Weather Radar Data
2.1.2. DPR Radar
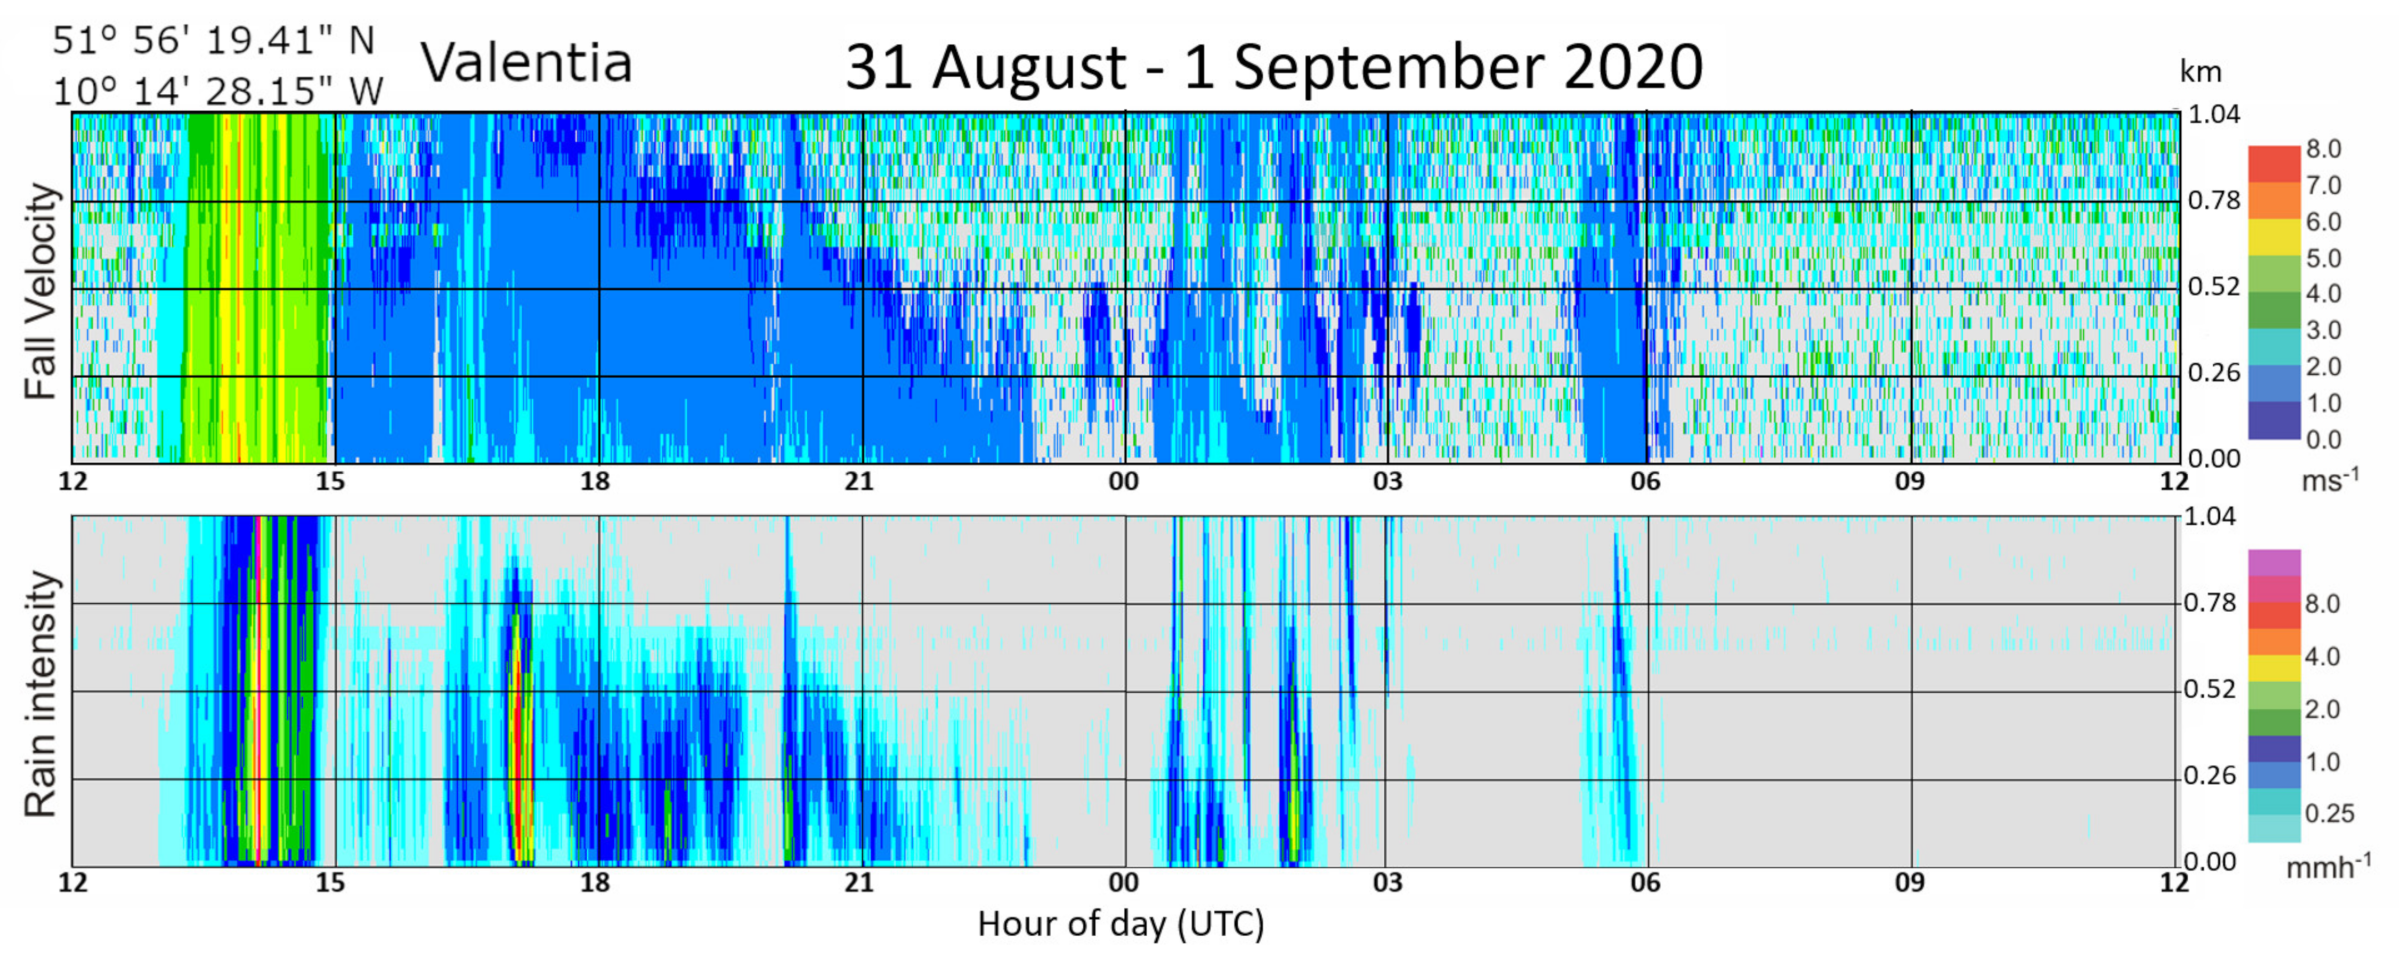
2.1.3. MRR Data
2.2. Data Processing
3. Results
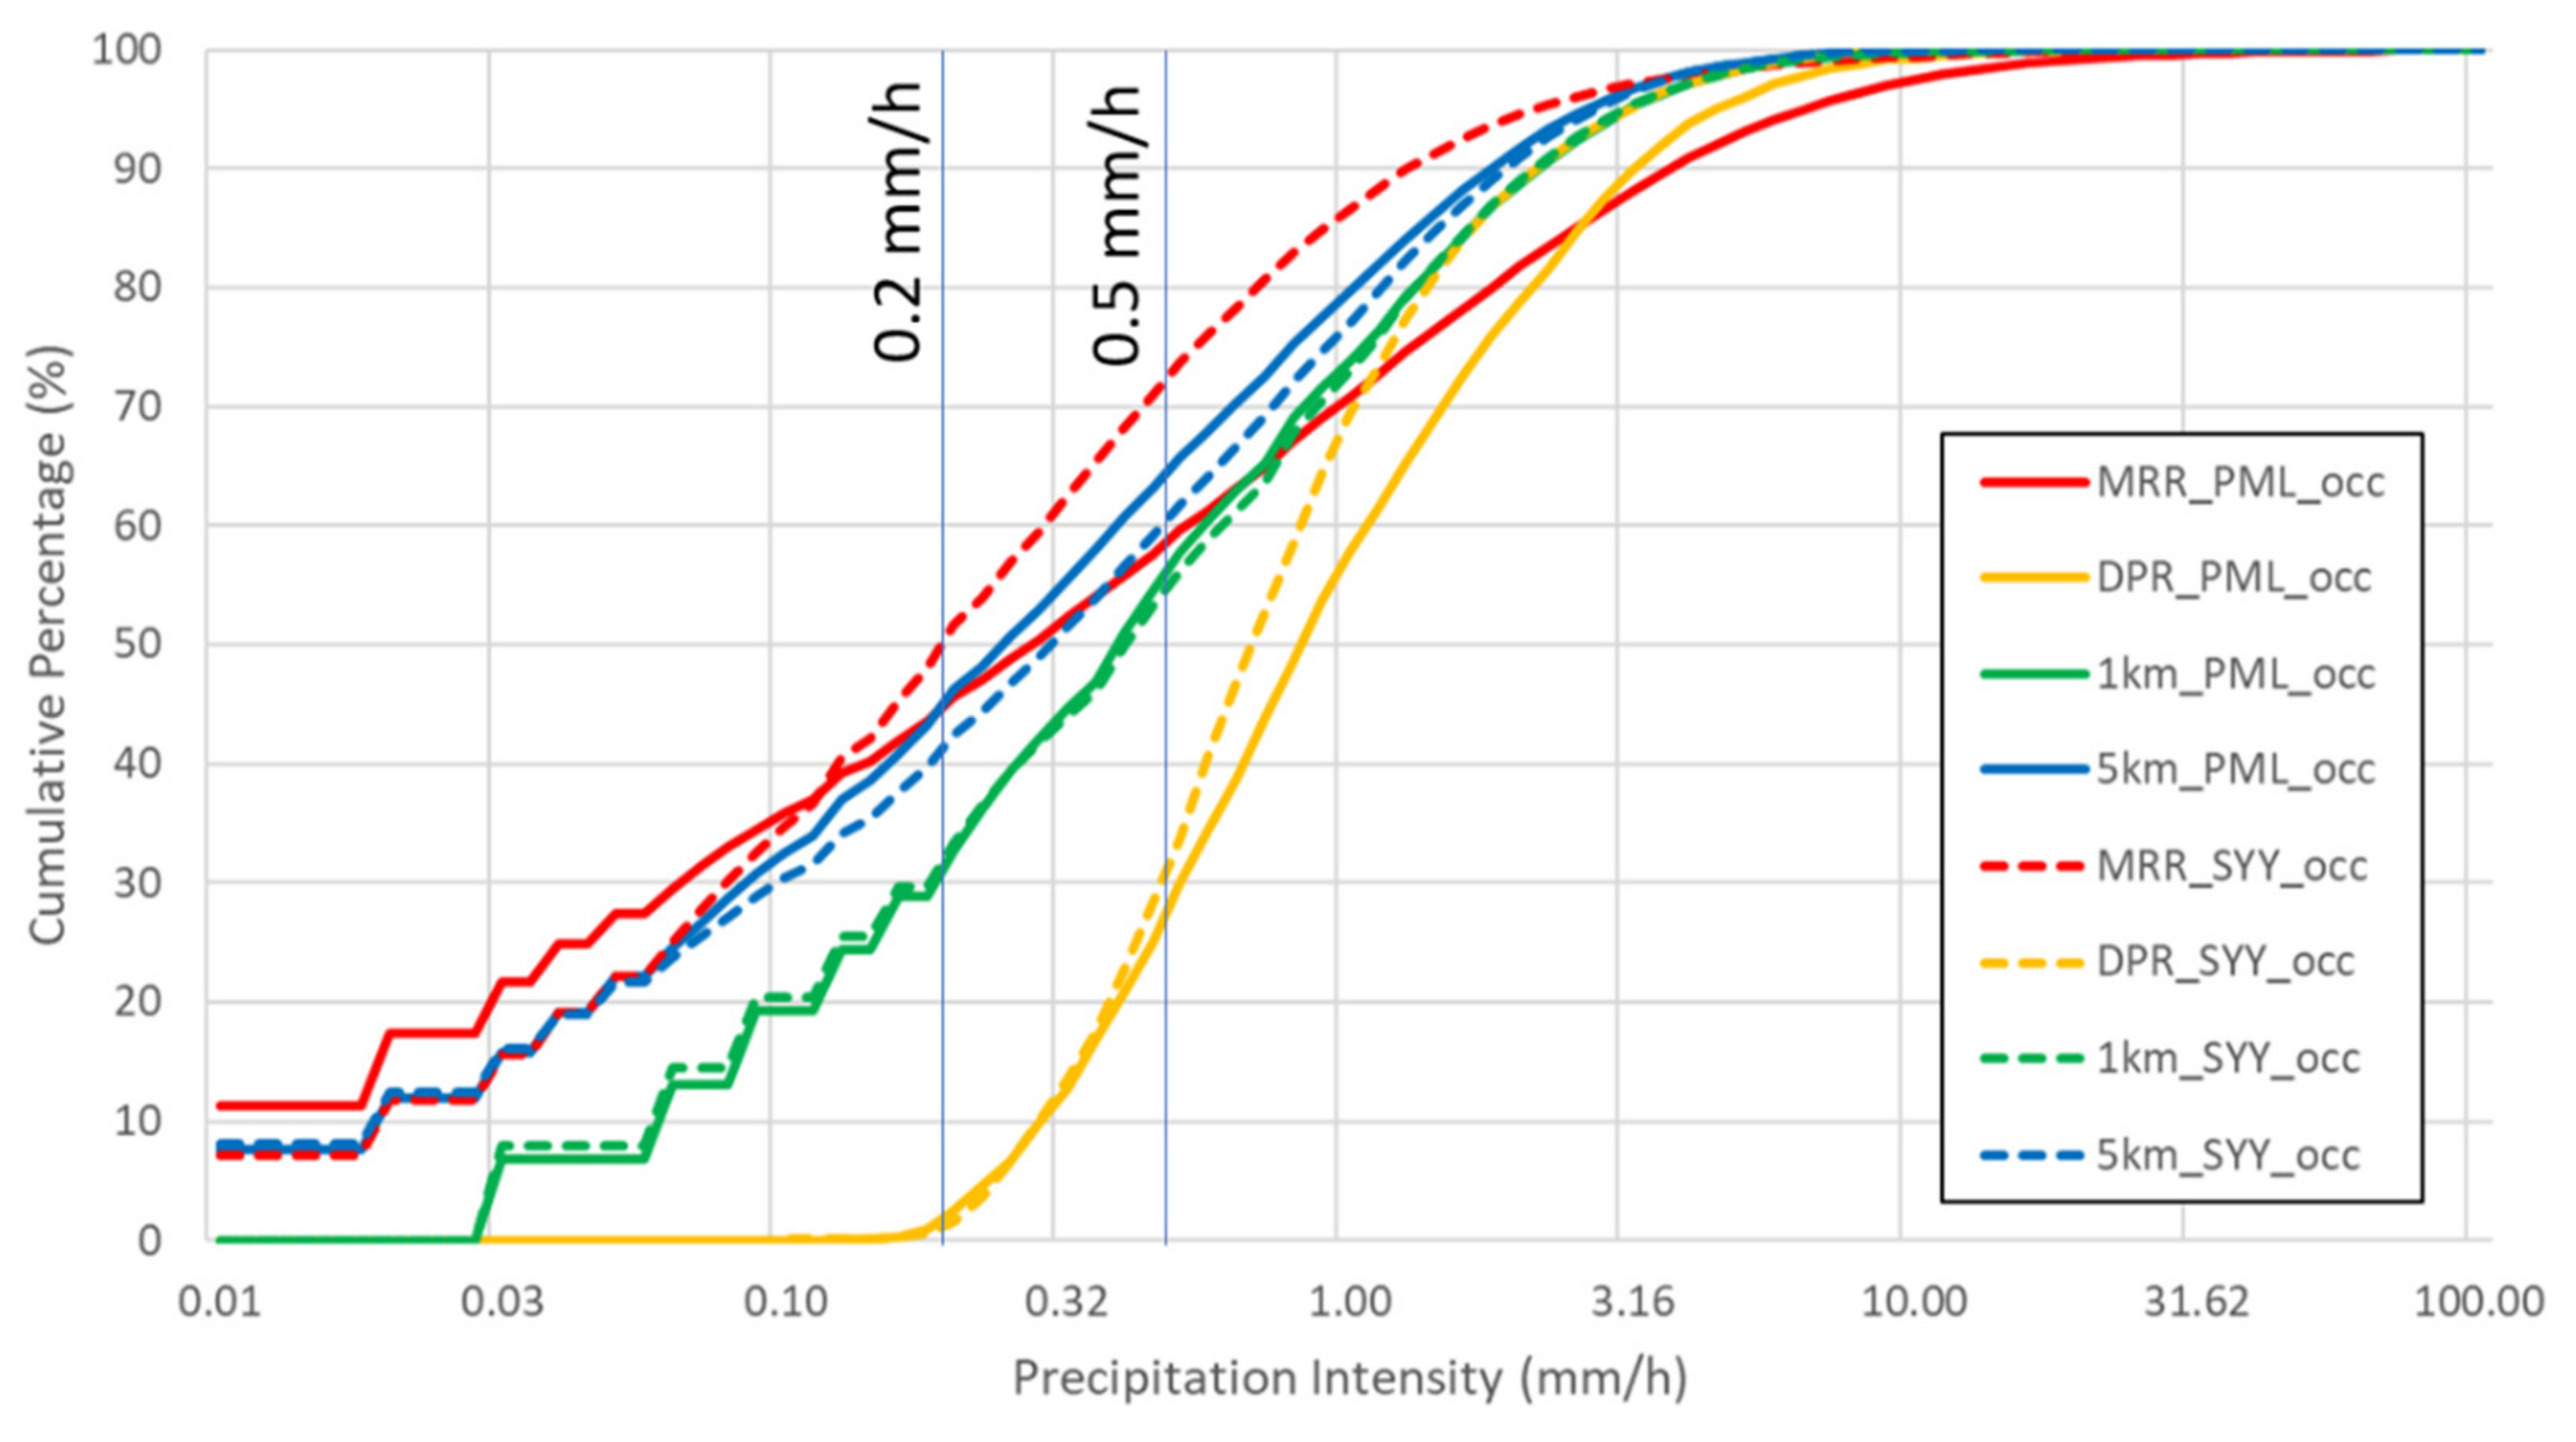
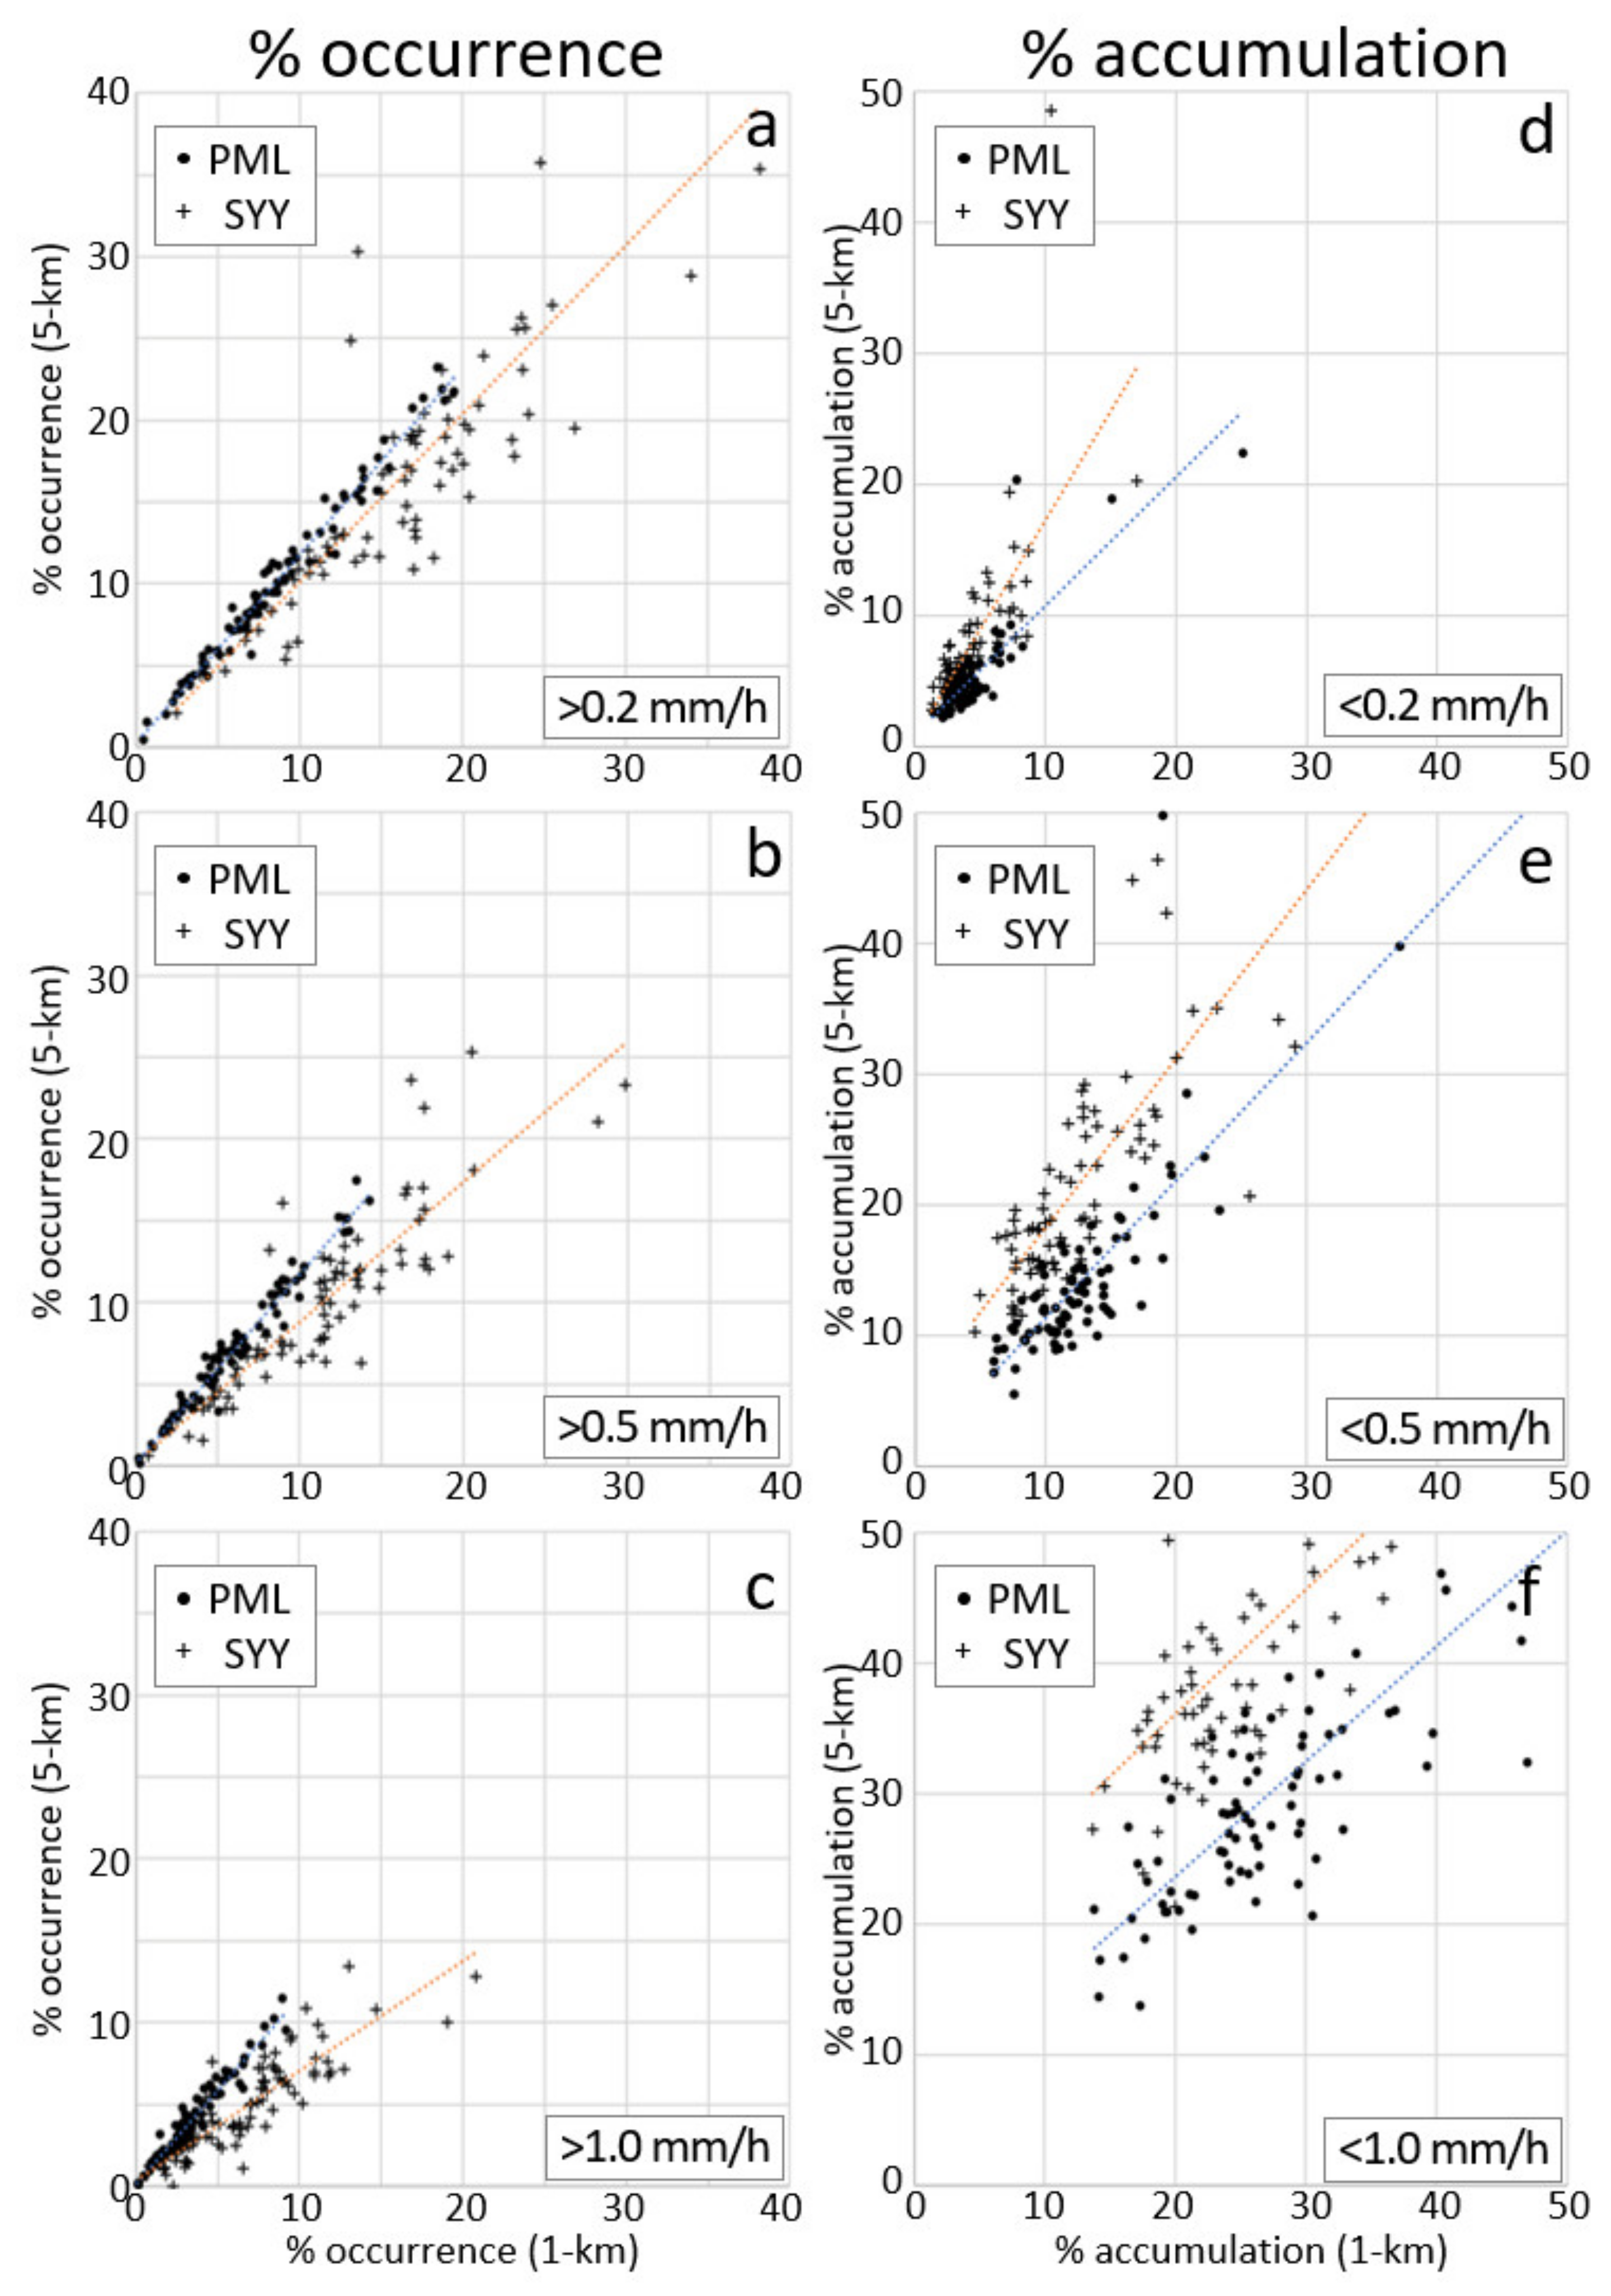
3.1. Occurrence of Precipitation
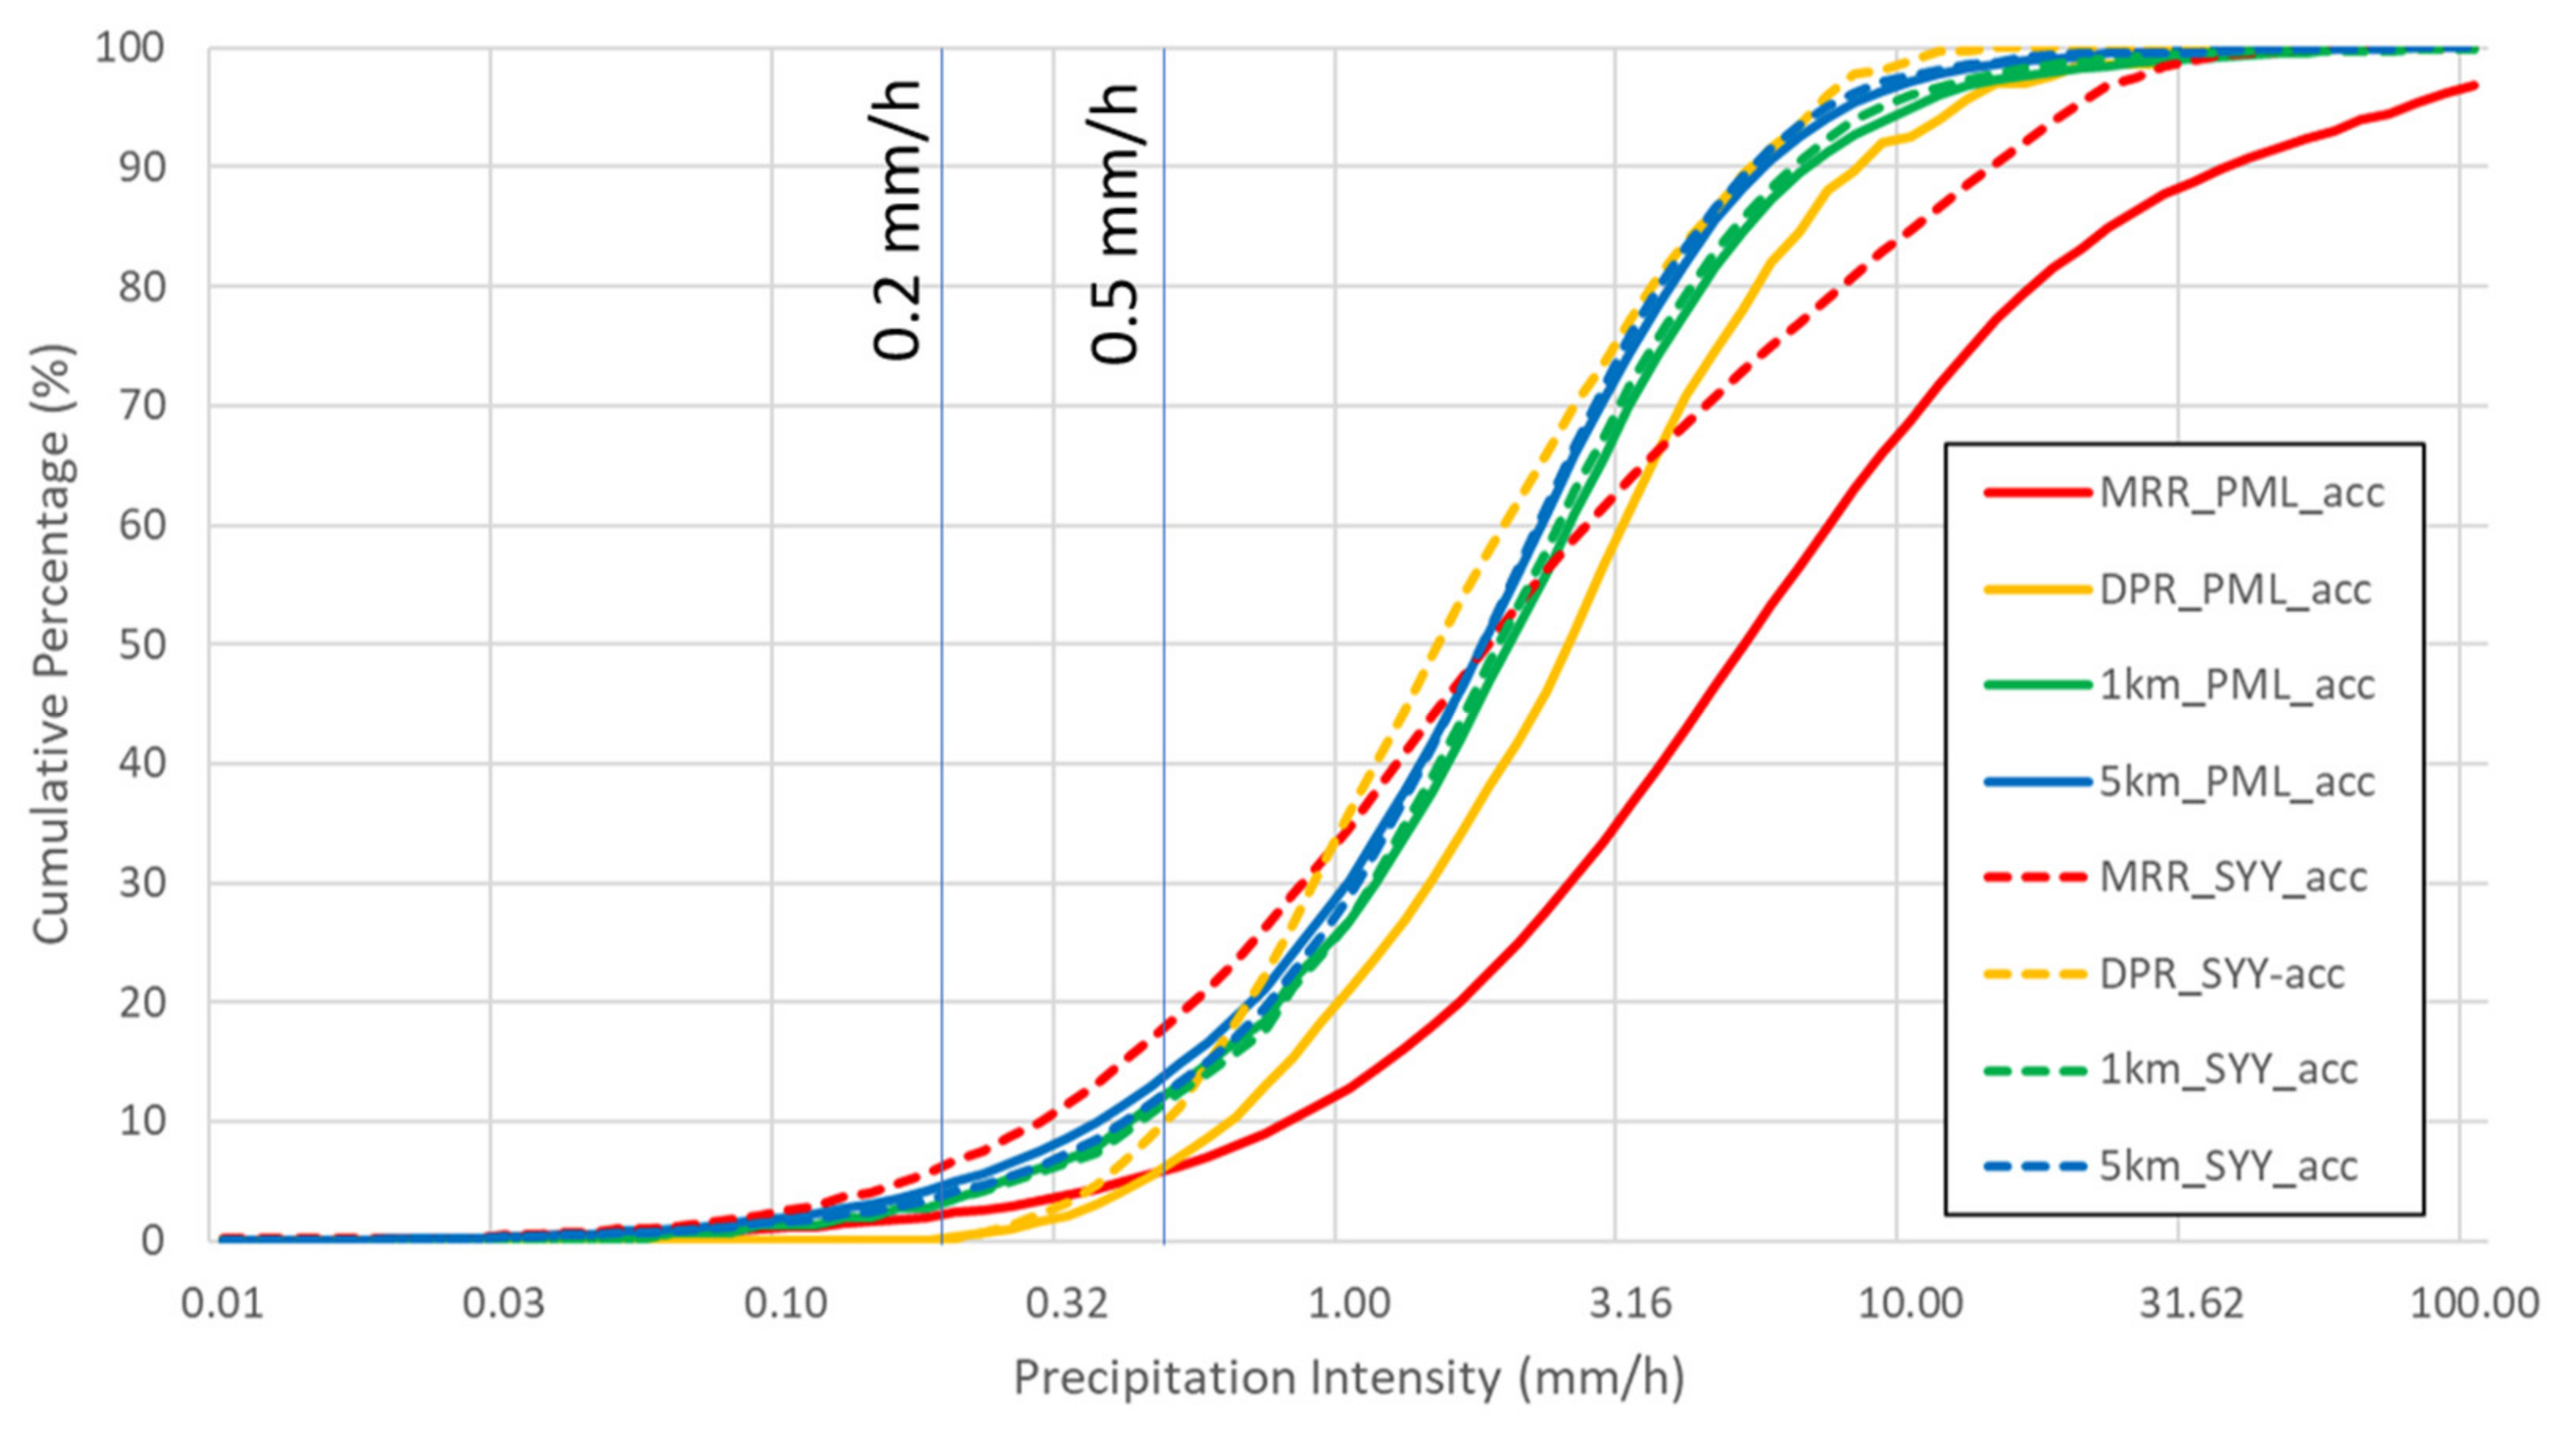
3.2. Accumulation of Precipitation
3.3. Impact of Spatial Resolution Using Surface Radar
3.4. Representation of Light Precipitation with Height
4. Discussion
5. Conclusions
- (i)
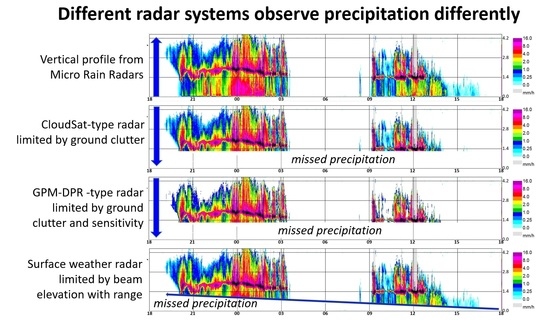
- Spaceborne radar systems are limited by the current technology and trade-offs between resolution, power and sensitivity [37]. The TRMM PR had a rain/no-rain sensitivity of about 0.5 mm/h, while the GPM DPR, more relevant for mid-latitude studies, had a nominal rain/no-rain sensitivity of about 0.5 mm/h for the Ku-only or 0.2 mm/h for the combined Ka/Ku retrievals. The impact of sensitivity alone means that the DPR would only see about 75% of the precipitation occurrence for the Ka/Ku retrievals, falling to about 62% for the Ku retrieval alone.
- (ii)
- At-surface retrievals from spaceborne radars are limited by the surface return or clutter. In the case of the PR and DPR, this is about 1000 m at nadir, increasing to about 1500 m at the edge of the radar swath or higher in regions with high relief or varied terrain. If rainfall as identified by the MRR at the surface is considered, typically, only in 80% of the cases is there precipitation at or above 1000 m or 64% at or above 1500 m.
- (iii)
- Combining the effects of sensitivity and height, if both the sensitivity and height criteria are analyzed, then in only about 62% to 63% of cases, where precipitation is seen at the surface, is precipitation present above 1000 m at intensities at or above 0.2 mm/h, falling to about 52% to 53% at or above 0.5 mm/h.
Author Contributions
Funding
Institutional Review Board Statement
Informed Consent Statement
Data Availability Statement
Acknowledgments
Conflicts of Interest
References
- L’Ecuyer, T.S.; Beaudoing, H.K.; Rodell, M.; Olson, W.; Lin, B.; Kato, S.; Clayson, C.A.; Wood, E.; Sheffield, J.; Adler, R.; et al. The Observed State of the Energy Budget in the Early Twenty-First Century. J. Clim. 2015, 28, 8319–8346. [Google Scholar] [CrossRef] [Green Version]
- Kirschbaum, D.B.; Huffman, G.J.; Adler, R.F.; Braun, S.; Garrett, K.; Jones, E.; McNally, A.; Skofronick-Jackson, G.; Stocker, E.; Wu, H.; et al. NASA’s Remotely Sensed Precipitation: A Reservoir for Applications Users. Bull. Am. Meteorol. Soc. 2017, 98, 1169–1184. [Google Scholar] [CrossRef]
- Trenberth, K.E.; Fasullo, J.T.; Kiehl, J. Earth’s Global Energy Budget. Bull. Am. Meteorol. Soc. 2009, 90, 311–324. [Google Scholar] [CrossRef]
- Sevruk, B. Regional dependency of precipitation-altitude relationship in the swiss ALPS. Clim. Chang. 1997, 36, 355–369. [Google Scholar] [CrossRef]
- Dorninger, M.; Schneider, S.; Steinacker, R. On the interpolation of precipitation data over complex terrain. Theor. Appl. Clim. 2008, 101, 175–189. [Google Scholar] [CrossRef]
- Kidd, C.; Becker, A.; Huffman, G.J.; Muller, C.L.; Joe, P.; Skofronick-Jackson, G.; Kirschbaum, D.B. So, How Much of the Earth’s Surface Is Covered by Rain Gauges? Bull. Am. Meteorol. Soc. 2017, 98, 69–78. [Google Scholar] [CrossRef]
- Illingworth, A.J.; Blackman, T.M. The Need to Represent Raindrop Size Spectra as Normalized Gamma Distributions for the Interpretation of Polarization Radar Observations. J. Appl. Meteorol. 2002, 41, 286–297. [Google Scholar] [CrossRef] [Green Version]
- Hong, Y.; Hsu, K.-L.; Sorooshian, S.; Gao, X. Precipitation Estimation from Remotely Sensed Imagery Using an Artificial Neural Network Cloud Classification System. J. Appl. Meteorol. 2004, 43, 1834–1853. [Google Scholar] [CrossRef] [Green Version]
- Kummerow, C.D. Introduction to Passive Microwave Retrieval Methods. In Advances in Global Change Research; Levizzani, V., Kidd, C., Kirschbaum, D.B., Kummerow, C.D., Nakamura, K., Turk, F.J., Eds.; Springer Nature: Cham, Switzerland, 2020; Volume 67, pp. 123–140. [Google Scholar]
- Hou, A.Y.; Kakar, R.K.; Neeck, S.; Azarbarzin, A.A.; Kummerow, C.D.; Kojima, M.; Oki, R.; Nakamura, K.; Iguchi, T. The global precipitation measurement mission. Bull. Am. Meteorol. Soc. 2014, 95, 701–722. [Google Scholar] [CrossRef]
- Skofronick-Jackson, G.; Petersen, W.A.; Berg, W.; Kidd, C.; Stocker, E.F.; Kirschbaum, D.B.; Kakar, R.; Braun, S.A.; Huffman, G.J.; Iguchi, T.; et al. The Global Precipitation Measurement (GPM) Mission for Science and Society. Bull. Am. Meteorol. Soc. 2017, 98, 1679–1695. [Google Scholar] [CrossRef]
- Stephens, G.L.; Vane, D.G.; Tanelli, S.; Im, E.; Durden, S.; Rokey, M.; Reinke, D.; Partain, P.; Mace, G.G.; Austin, R.; et al. CloudSat mission: Performance and early science after the first year of operation. J. Geophys. Res. Space Phys. 2008, 113, 18. [Google Scholar] [CrossRef]
- Kidd, C.; Levizzani, V. Status of satellite precipitation retrievals. Hydrol. Earth Syst. Sci. 2011, 15, 1109–1116. [Google Scholar] [CrossRef] [Green Version]
- Watters, D.; Battaglia, A.; Mroz, K.; Tridon, F. Validation of the GPM Version-5 Surface Rainfall Products over Great Britain and Ireland. J. Hydrometeorol. 2018, 19, 1617–1636. [Google Scholar] [CrossRef]
- Barrett, E.C.; Dodge, J.; Goodman, H.M.; Janowiak, J.; Kidd, C.; Smith, E.A. The first WetNet precipitation intercomparison project (PIP-1). Remote Sens. Rev. 1994, 11, 49–60. [Google Scholar] [CrossRef]
- Barrett, E.C.; Adler, R.F.; Arpe, K.; Bauer, P.; Berg, W.; Chang, A.; Ferraro, R.; Ferriday, J.; Goodman, S.; Hong, Y.; et al. The first WetNet Precipitation Inter-comparison Project: Interpretation of Results. Remote Sens. Rev. 1994, 11, 303–373. [Google Scholar] [CrossRef]
- Adler, R.F.; Kidd, C.; Petty, G.W.; Morissey, M.; Goodman, H.M. Intercomparison of Global Precipitation Products: The Third Precipitation Intercomparison Project (PIP–3). Bull. Am. Meteorol. Soc. 2001, 82, 1377–1396. [Google Scholar] [CrossRef]
- Behrangi, A.; Yang, S. A new estimate for oceanic precipitation amount and distribution using complementary precipitation observations from space and comparison with GPCP. Environ. Res. Lett. 2020, 15, 124042. [Google Scholar] [CrossRef]
- Grecu, M.; Olson, W.S. Precipitation Retrievals from Satellite Combined Radar and Radiometer Observations; Levizzani, V., Kidd, C., Kirschbaum, D.B., Kummerow, C.D., Nakamura, K., Turk, F.J., Eds.; Springer Nature: Cham, Switzerland, 2020; Volume 67, pp. 231–248. [Google Scholar]
- Becker, A.; Finger, P.; Meyer-Christoffer, A.; Rudolf, B.; Schamm, K.; Schneider, U.; Ziese, M. A description of the global land-surface precipitation data products of the Global Precipitation Climatology Centre with sample applications including centennial (trend) analysis from 1901–present. Earth Syst. Sci. Data 2013, 5, 71–99. [Google Scholar] [CrossRef] [Green Version]
- Berg, W.; L’Ecuyer, T.; Haynes, J.M. The Distribution of Rainfall over Oceans from Spaceborne Radars. J. Appl. Meteorol. Clim. 2010, 49, 535–543. [Google Scholar] [CrossRef]
- Suzuki, K.; Stephens, G.L.; Heever, S.C.V.D.; Nakajima, T.Y. Diagnosis of the Warm Rain Process in Cloud-Resolving Models Using Joint CloudSat and MODIS Observations. J. Atmos. Sci. 2011, 68, 2655–2670. [Google Scholar] [CrossRef] [Green Version]
- Lin, X.; Hou, A.Y. Estimation of Rain Intensity Spectra over the Continental United States Using Ground Radar–Gauge Measurements. J. Clim. 2012, 25, 1901–1915. [Google Scholar] [CrossRef]
- Kulie, M.S.; Bennartz, R. Utilizing Spaceborne Radars to Retrieve Dry Snowfall. J. Appl. Meteorol. Clim. 2009, 48, 2564–2580. [Google Scholar] [CrossRef] [Green Version]
- Behrangi, A.; Christensen, M.; Richardson, M.; Lebsock, M.; Stephens, G.; Huffman, G.J.; Bolvin, D.; Adler, R.F.; Gardner, A.; Lambrigtsen, B.; et al. Status of high-latitude precipitation estimates from observations and reanalyses. J. Geophys. Res. Atmos. 2016, 121, 4468–4486. [Google Scholar] [CrossRef]
- Short, D.A.; Nakamura, K. TRMM radar observations of shallow precipitation over the tropical oceans. J. Clim. 2000, 13, 4107–4124. [Google Scholar] [CrossRef]
- Kulie, M.S.; Milani, L.; Wood, N.B.; Tushaus, S.A.; Bennartz, R.; L’Ecuyer, T.S. A Shallow Cumuliform Snowfall Census Using Spaceborne Radar. J. Hydrometeorol. 2016, 17, 1261–1279. [Google Scholar] [CrossRef]
- Petersen, W.A.; Kirstetter, P.-E.; Wang, J.; Wolff, D.B.; Tokay, A. The GPM Ground Validation Program; Levizzani, V., Kidd, C., Kirschbaum, D.B., Kummerow, C.D., Nakamura, K., Turk, F.J., Eds.; Springer Nature: Cham, Switzerland, 2020; Volume 69, pp. 471–502. [Google Scholar]
- Kidd, C.; Tan, J.; Kirstetter, P.; Petersen, W.A. Validation of the Version 05 Level 2 precipitation products from the GPM Core Observatory and constellation satellite sensors. Q. J. R. Meteorol. Soc. 2018, 144, 313–328. [Google Scholar] [CrossRef] [Green Version]
- Met Office. 1 km Resolution UK Composite Rainfall Data from the Met Office Nimrod System. NCAS British Atmospheric Data Centre. 2003. Available online: https://catalogue.ceda.ac.uk/uuid/27dd6ffba67f667a18c62de5c3456350 (accessed on 3 March 2021).
- Harrison, D.L.; Scovell, R.W.; Kitchen, M. High-resolution precipitation estimates for hydrological uses. Proc. Inst. Civ. Eng. Water Manag. 2009, 162, 125–135. [Google Scholar] [CrossRef]
- Harrison, D.L.; Norman, K.; Pierce, C.; Gaussiat, N. Radar products for hydrological applications in the UK. Proc. Inst. Civ. Eng. Water Manag. 2012, 165, 89–103. [Google Scholar] [CrossRef]
- Fairman, J.G.; Schultz, D.M.; Kirshbaum, D.J.; Gray, S.L.; Barrett, A.I. A radar-based rainfall climatology of Great Britain and Ireland. Weather 2015, 70, 153–158. [Google Scholar] [CrossRef] [Green Version]
- Iguchi, T. Dual-Frequency Precipitation Radar (DPR) on the Global Precipitation Measurement (GPM) Mission’s Core Observatory. In Advances in Global Change Research; Levizzani, V., Kidd, C., Kirschbaum, D.B., Kummerow, C.D., Nakamura, K., Turk, F.J., Eds.; Springer Nature: Cham, Switzerland, 2020; Volume 67, pp. 183–192. [Google Scholar]
- Peters, G.; Fischer, B.; Andersson, T. Rain observations with a vertically looking Micro Rain Radar (MRR). Boreal Environ. Res. 2002, 7, 353–362. [Google Scholar]
- Skofronick-Jackson, G.; Kulie, M.; Milani, L.; Munchak, S.J.; Wood, N.B.; Levizzani, V. Satellite Estimation of Falling Snow: A Global Precipitation Measurement (GPM) Core Observatory Perspective. J. Appl. Meteorol. Clim. 2019, 58, 1429–1448. [Google Scholar] [CrossRef] [PubMed]
- Battaglia, A.; Kollias, P.; Dhillon, R.; Lamer, K.; Khairoutdinov, M.; Watters, D. Mind the gap—Part 2: Improving quantitative estimates of cloud and rain water path in oceanic warm rain using spaceborne radars. Atmos. Meas. Tech. 2020, 13, 4865–4883. [Google Scholar] [CrossRef]


| Location | Abbreviation | Latitude | Longitude | Type |
|---|---|---|---|---|
| Stornoway (Scotland) | SYY | 58°12′50.45″N | 6°23′54.41″W | MRR-2 |
| Plymouth (UK) | PML | 50°21′57.60″N | 4°08′57.71″W | MRR-Pro |
| Valentia (Ireland) | VAL | 51°56′18.04″N | 10°14′27.93″W | MRR-2 |
| SYY 16-05-2015:03-09-2019 | PML 15-08-2019:22-02-2021 | |||||
|---|---|---|---|---|---|---|
| Number of Profiles | % of All Profiles | % of Raining Profiles | Number of Profiles | % of All Profiles | % of Raining Profiles | |
| Number of all valid profiles | 2,132,508 | 100.0% | 748,179 | 100.0% | ||
| Profiles with > 0.0 | 342,385 | 16.1% | 100.0% | 117,818 | 15.7% | 100.0% |
| Profiles with ≥0.2 | 264,014 | 12.4% | 77.1% | 87,107 | 11.6% | 73.9% |
| Profiles with ≥ 0.5 | 209,544 | 9.8% | 61.2% | 73,777 | 9.9% | 62.6% |
| Profiles with > 0.0 above 1000 m | 276,400 | 13.0% | 80.7% | 92,722 | 12.4% | 78.7% |
| Profiles with ≥ 0.2 above 1000 m | 218,874 | 10.3% | 63.9% | 72,657 | 9.7% | 61.7% |
| Profiles with ≥ 0.5 above 1000 m | 176,572 | 8.3% | 51.6% | 62,600 | 8.4% | 53.1% |
| Profiles with > 0.0 above 1500 m | 220,513 | 10.3% | 64.4% | 76,267 | 10.2% | 64.7% |
| Profiles with ≥ 0.2 above 1500 m | 173,054 | 8.1% | 50.5% | 61,784 | 8.3% | 52.4% |
| Profiles with ≥ 0.5 above 1500 m | 138,985 | 6.5% | 40.6% | 53,267 | 7.1% | 45.2% |
Publisher’s Note: MDPI stays neutral with regard to jurisdictional claims in published maps and institutional affiliations. |
© 2021 by the authors. Licensee MDPI, Basel, Switzerland. This article is an open access article distributed under the terms and conditions of the Creative Commons Attribution (CC BY) license (https://creativecommons.org/licenses/by/4.0/).
Share and Cite
Kidd, C.; Graham, E.; Smyth, T.; Gill, M. Assessing the Impact of Light/Shallow Precipitation Retrievals from Satellite-Based Observations Using Surface Radar and Micro Rain Radar Observations. Remote Sens. 2021, 13, 1708. https://doi.org/10.3390/rs13091708
Kidd C, Graham E, Smyth T, Gill M. Assessing the Impact of Light/Shallow Precipitation Retrievals from Satellite-Based Observations Using Surface Radar and Micro Rain Radar Observations. Remote Sensing. 2021; 13(9):1708. https://doi.org/10.3390/rs13091708
Chicago/Turabian StyleKidd, Chris, Edward Graham, Tim Smyth, and Michael Gill. 2021. "Assessing the Impact of Light/Shallow Precipitation Retrievals from Satellite-Based Observations Using Surface Radar and Micro Rain Radar Observations" Remote Sensing 13, no. 9: 1708. https://doi.org/10.3390/rs13091708