1. Introduction
Since the influence of the signal modulation method, the disturbance of the GNSS signal-in-space transmission, the decoding accuracy of the receiver and thermal noise, the raw observations of the GNSS receiver (including code and carrier phase observations) have noise or errors [
1]. The BDS system construction can be divided into three steps, and its third-generation system named BDS-3 was completed in July 2020 [
2]. The evaluation of the BDS satellite signal performance can be traced back to the previous generation BDS-2 system. Hauschild et al. [
3] evaluated the signal quality, carrier-to-noise ratio, the accuracy of code and carrier observations of the first MEO-1 satellite of the BDS-2 system, and compared it with the performance of GPS and Galileo satellites. Yang et al. [
4] used the zero-baseline single difference (SD) to evaluate the performance of the BDS-2 satellites, where the accuracy of code observation is about 33 cm, and the accuracy of carrier observation is about 2 mm. However, the code observations of the BDS-2 satellites have systematic errors related to elevation [
5]. Compared with the Beidou-2 MEO satellites, the rubidium atomic clock and hydrogen atomic clock with better performance are carried on the new MEO navigation satellites of Beidou-3 [
6], and the center frequency, bandwidth and modulation method of the signal was further improved [
7].
The BDS-3 satellites have been broadcasting new signals different from BDS-2, and the exploration of their performance by the GNSS scientists and engineers is still in the preliminary stage. It is worth noting that before the BDS-3 satellites were launched, China had launched five Beidou-3 test satellites (BDS-3e), including two IGSO and three MEO satellites [
8]. Then the launch speed of the BDS-3 satellites was accelerated, and there are currently more than 20 BDS-3 satellites, as shown in
Appendix A. Zhang et al. [
5] evaluated the signal performance of five BDS-3 experimental satellites, and the results show that it is at the same level as GPS L1/L2/L5 and Galileo E1/E5a/E5b signals. Yang Y [
9] predicted the performance of the BDS-3 global constellation through the performance of the BDS-3e satellites. Similar to BDS-2, BDS-3 also transmits signals at B1, B2 and B3, but some new signals were added in [
2,
10]), which are detailed in a later section. Most of the existing literature analyzes the existing GPS, GLONASS and Galileo signals, while the analysis of BDS satellite signals only includes BDS-2 and a few BDS-3E satellites. Moreover, there are few studies on B1C and B2a signals of BDS-3 and their contrast with GPS and Galileo signals at the same frequency, lacking a thorough, comprehensive analysis and review. In this contribution, the characteristics of the new signal of the BDS-3 global constellation are comprehensively and in-depth evaluated by the authors.
The structure of this article is as follows: First, the new signal of BDS-3 is introduced in detail. Then, the evaluation of the signal strength and the accuracy of observations are carried out, including the comparison of the BDS-3 new signal and the BDS-2 signal, with the comparison of BDS-3 new signal and GPS/Galileo. The accuracy of different signals is evaluated using two linear combination observations of CC and MultiPath (MP); the accuracy of the carrier phase is evaluated using the zero-baseline method. The PPP accuracy is used to evaluate new signals. The last of this contribution contains discussion and conclusions.
2. Structure of BDS-3 New Signals
BDS-1, also known as the COMPASS system, has a constellation composed of three GEO satellites [
11]. The frequency used by BDS-1 is the radio determination satellite service (RDSS) frequency band. The uplink signal is in the L band (1610–1626.5 MHz), while the downlink signal is in the S-band (2483.5–2500 MHz). Moreover, RDSS has been extended on the GEO satellites of BDS-2 and BDS-3. The satellites of BDS-2 broadcast B1I (1561.098 MHz), B2I (1207.14 MHz) and B3I (1268.52 MHz) open service signals [
12], the signal modulation of which is mainly based on quadrature phase-shift keying (QPSK). The B1I and B3I signals of BDS-2 are inherited to BDS-3, and new public service signals of B1C (1575.42 MHz), B2a (1176.45 MHz) and B2b (1207.14 MHz) are adopted. Furthermore, the Bs (frequency) signal was tested on an experimental satellite of BDS-3e [
13]. The BDS signals in L-band are shown in
Figure 1.
The characteristics of the BDS-3 signal are described in detail, and a comparison with other GNSS signals is shown in
Table 1. The modulation method of B1I and B3I signals in BDS-3 satellites is strictly consistent with that of BDS-2 satellites, and it is compatible with the open service of BDS-2. The B1C signal is the main open service signal of BDS-3. It provides public services to single/dual/multi-frequency users in the world. The center frequency of the B1C signal is 1575.42 MHz, which coincides with the frequencies of GPS L1C, Galileo E1 OS, QZSS L1, and NAVIC L1. It uses the combined modulation method of the BOC (1,1) and the QMBOC (6,1,4/33) to maintain high compatibility and interoperability with other GNSSs [
14,
15]. The B2a and B2b signals are the second and third public service signals of BDS-3, respectively, which can be applied to dual/multi-frequency receivers in the fields of life safety and high-precision position. In addition, specific PPP service information of BDS-3 is broadcast on B2b. The B2a signal is consistent with the center frequency of the GPS L5, Galileo E5a, QZSS L5, and NAVIC L5 signals, and the BPSK (10) modulation method is used for their data component and pilot component. In addition, the receiver can also obtain the B2a+B2b signal with integrated better performance by integrated B2a and B2b in ACE-BOC mode [
16].
The characteristics of the new signals of the BDS-3 satellites are analyzed and evaluated in depth. B1I and B3I of BDS-3 are often used for comparison with BDS-2 satellites co-frequency signals, while B1C, B2a, B2b of BDS-3 are used for comparison with other GNSS co-frequency signals.
3. Experimental Design
In order to evaluate the characteristics of the new signal from the BDS-3 satellites, a series of experiments was conducted in Xi’an, China; its geographic location is shown in
Figure 2. The experiment used the GNSS observatory on the top of the MAC building and used a Trimble’s alloy receiver (
Figure 3) and a choke antenna [
17]. On the same day, the same GNSS receiver was used for 24-hour continuous observations. All BDS satellites were evaluated, including BDS-2 and BDS-3 satellites. Some satellites of GPS, Galileo and QZSS were selected with the same frequency as B1C and B2a of BDS-3 for analysis. Since the sampling interval of the GNSS receiver is 1 second, 86,400 observations were collected in one day.
In this contribution, three experiments were used to evaluate the accuracy of the GNSS signal. The first experiment evaluated the strength of the new BDS-3 signal, and the C/N
0 indicator was used for analysis. The second experiment analyzed the quality of code observation of the BDS-3 new signal and, CC/MP indicators were used for analysis. The third experiment used DD observations and a zero-baseline solution (Bakker P F D, 2012) (as shown in
Figure 4) to evaluate the quality of carrier phase observations of the new BDS-3 signal.
4. Carrier-To-Noise Density Ratio
When GNSS receivers record navigation messages and observations, they generally record the signal strength, which can characterize the quality of observations data and receiver signal tracking performance [
18]. The signal strength is described by the signal-to-noise ratio index (that is, the signal-to-noise ratio SNR), which is defined as the ratio of the carrier signal power to the noise power in dB. Carrier-to-noise ratio C/N
0 is the normalized signal-to-noise ratio, which is defined as C/N
0 over a 1 Hz bandwidth in dB/Hz (see Equation (1)).
where the C/N
0 indicates the carrier-to-noise density ratio 1 Hz bandwidth, 20 is a constant, lg is the logarithmic operator, SNR (usually in dB) is the signal-to-noise ratio, and s is short for seconds.
There are many factors affecting C/N
0, including external factors of the receiver, such as satellite transmit power, satellite antenna gain, space loss, and atmospheric attenuation. The local factors, such as include receiver antenna gain, receiver performance, noise level and multipath effects, etc. In addition, it may also be affected by factors such as season and temperature. C/N
0 has been widely used in the modeling multipath error or random model in the GNSS high-precision applications [
19].
Because the signals of the GNSS satellites in different orbits are different, the MEO, GEO and IGSO satellites of BDS-3 are discussed and analyzed separately.
4.1. Statistical Characteristics of C/N0 of GEO Satellites
In China and parts of the Asia-Pacific region, GEO satellites are visible almost all day, and they can be selected as reference satellites in the relative positioning mode. The BDS-2 system contains five GEO satellites, and the BDS-3 system contains three satellites GEO satellites. The elevation of the GEO satellite is relatively fixed, and it is limited to a small range. Five BDS-2 GEO satellites and two BDS-3 GEO satellites were statistically analyzed, as shown in
Table 2. We can find that the average elevation of all 5 GEO satellites of BDS-2 is 35.04 degrees, which is very close to the average elevation of 35.31 degree of the two GEO satellites of BDS-3. However, the C/N
0 values of BDS-2 GEO satellites on the B1I and B3I frequencies are 37.59 dB/Hz and 42.62 dB/Hz, respectively, which are significantly lower than the average value of the BDS-3 GEO satellites (the C/N
0 values on the B1I and B3I frequencies are 42.82 dB/Hz and 44.57 dB/Hz, respectively). Therefore, we can infer that the C/N
0 of the GEO satellite of BDS-3 at the frequency points B1I and B3I was significantly improved compared with that of BDS-2.
4.2. C/N0 Statistical Characteristics of IGSO Satellites
Similar to GEO satellites, IGSO satellites are also high-orbit satellites. However, the orbital elevation and visibility of IGSO satellites are constantly changing, which is similar to MEO satellites. The results of all IGSO satellites (including 7 BDS-2 satellites and 3 BDS-3 satellites) are shown in
Table 3. It can be found that the average elevation of all 7 IGSO satellites of BDS-2 is 54.67 degrees, which is almost the same as the average elevation of 54.88 degrees of the two IGSO satellites of BDS-3. At the B1I frequency, the C/N
0 value of BDS-3 is dB/Hz higher than that of BDS-2, while at the B3I frequency, the two are almost equal. The average C/N
0 value of the new signal B1C of the BDS-3 IGSO satellite is 45.76 dB/Hz, while the average C/N
0 value of B2a is 49.31 dB/Hz, which is significantly higher than the signals at all other frequency points. Therefore, the B1I and B3I signals of the BDS-3 IGSO satellites have less improvement than the BDS-2 satellite, while the B1C and B2a have better signal strength, especially the signal strength of B2a is nearly 3 dB/Hz higher than other frequencies.
4.3. C/N0 Statistical Characteristics of MEO Satellites
BDS-3 has a large number of MEO satellites and is the main component of the BDS-3 space segment. The MEO constellation of BDS-3 uses a total of 27 satellites in the three orbital planes A, B, and C. In order to study the difference in C/N
0 between BDS-3 and BDS-2 satellites on different frequencies, all MEO satellites were analyzed and evaluated. Because the elevation of MEO satellites varies widely, and the elevation trajectories between different satellites are extremely different. C14 (BDS-2) and C24 (BDS-3) have similar elevation ranges, so they are put together for comparison.
Figure 5 shows the analysis results of the two satellites. It can be found that the C/N
0 values are closely related to the elevation. On the B1 frequency, the C/N
0 value of the C24 satellite of BDS-3 is significantly higher than that of C14, while at frequency B3, the C/N
0 value of C14 is slightly higher than that of the C24 satellite. The strength of the B2a signal of the C24 is significantly higher than other frequencies.
The C/N
0 of all MEO satellites are analyzed (including 3 BDS-2 satellites and 24 BDS-3 satellites), and the results are shown in
Table 4. Because there are fewer BDS-2 satellites, the average elevation on the day of the experiment is 32.41 degrees, which is much lower than the BDS-3 satellite elevation of 39.33 degrees. On the B1I frequency, the MEO satellites of BDS-3 have a significant improvement over BDS-2, while on the B3I frequency, they are equivalent. For the new signal of the BDS-3 MEO satellites, B1C is higher than B1I but lower than B3I, while B2a is significantly higher than other frequencies.
C/N
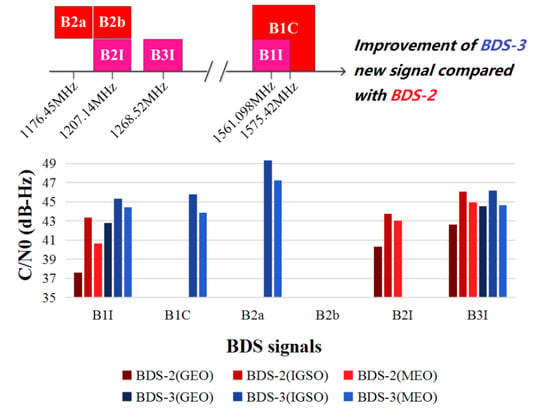
0 of different types of BDS satellites are shown in
Table 5, including all BDS-2 and BDS-3. The C/N
0 of the BDS-3 satellites on B1I frequency is significantly higher than that of the BDS-2 satellites, and they are equivalent at the B3I frequency. The new B1C and B2a signals have been broadcast on IGSO and MEO satellites of BDS-3. The C/N
0 value of the B2a signal is nearly 3 dB/Hz higher than other frequencies (as shown in
Figure 6).
4.4. Comparison of BDS-3 and GPS, GLONASS and QZSS Satellites at the Same Frequency
Since the B1C and B2a signals of the BDS-3 MEO satellites have good interoperability with other GNSS signals at the same frequency, they are compared. Since the performance of the GNSS satellites declines with the aging of the payload, the authors chose three satellites from BDS-3, GPS and Galileo launched in 2018. Meanwhile, the authors selected the J01 satellite with better visibility in China because QZSS has no new satellite after 2018. In this contribution, the C/N
0 of the same-frequency signals of the four satellites C25 (BDS-3), G04 (GPS), E13 (Galileo) and J01 (QZSS) are compared. The C/N
0 of B1C, L1, E1 and L1 (QZSS) is shown in
Figure 7, from which we can be found that the signal strength of BDS-3 and GPS is slightly higher than Galileo and QZSS. Since the J01 satellite of QZSS is more than 10 years old, its performance inevitably deteriorates with the aging of the onboard load. Therefore, in this contribution, the performance of the J01 satellite deviates from other satellites.
The C/N
0 statistical results of different GNSS satellites are shown in
Table 6. We can find that, except for the QZSS satellite which has a higher average elevation, the average elevation of the other three GNSS satellites are in the range of 33–40 degree. The signal strengths of different GNSS systems on the two frequencies are relatively close, and the B2a frequency point is 3–4 dB/Hz higher than that of B1C.
Except for GEO satellites, all BDS-3 satellites can transmit B1C and B2a signals. The signal strength of B1C and B2a signals is significantly higher than other signals, especially B2a signals are about 3 dB/Hz higher. Moreover, the signal strength of B1C and B2a signals is very close to other GNSS signals at the same frequency. Therefore, when using BDS-3 signals for positioning and navigation, B1C and B2a have priority.
5. Quality of Code Observation
The accuracy of code observation is evaluated in this section. Code-minus-carrier (CC) and multipath MP) indicators are often used to evaluate the accuracy of the code observation. In this contribution, the CC values of various frequencies of different GNSS and different types of satellites are analyzed, then the MP of the B1I/B3I and the MP of B1C (L1/E1)/B2a (L5/E5a) are analyzed. The observations were statistically evaluated and compared.
5.1. Code-Minus-Carrier (CC)
The typical theoretical accuracy of code observation is 1/100 of the chip width, and the range is generally from tens of centimeters to several meters. However, due to factors related to navigation satellites, propagation paths and receivers, the reduced accuracy causes degradation of user positioning. The combined observations of the two carriers and code pseudo-ranges are often used to evaluate the accuracy of code observations. The first linear combination observation is code-minus-carrier (CC). The basic observations in a GNSS receiver are the code and carrier phase. This difference of the range by code and range calculated by carrier phase (phase multiplied by wavelength) can be expressed as CC. The CC at a certain epoch
t is expressed as follows:
where
ρ and
ϕ is the code and carrier phase observation, respectively.
I is the ionospheric delay.
and
Mϕt include multipath and modeling errors in the code and carrier phase observations, respectively.
This method makes a difference between the pseudo-range and carrier phase observations at a certain frequency and then eliminates the effects of the ionosphere by quadratic polynomial fitting to obtain CC observations [
20,
21].
The statistical results of all GEO and IGSO satellites are shown in
Table 7 and
Table 8, respectively. The CC of GEO satellites on the B3I frequency point is less than 0.2 m, while it is less than 0.1 m for IGSO satellites. The CC of both B1I and B3I of the BDS-3 GEO satellites was significantly improved compared to the BDS-2 satellites. On the other hand, the CC of the new signals B1C and B2a from the IGSO satellites are between the B1I and B3I, while the CC of B2a is significantly lower than B1C.
There is a comparison of CC values between C14 and the C24 satellites in
Figure 8. It can be found that the CC value on B3I is significantly lower than that of B1I and B2I, while the CC values on the B1I and B1C are significantly higher than the other two frequencies. The statistical results of all IGSO satellites are shown in
Table 9. The CC value of B2a is the best with 0.13 m, and the CC value of B3I is sub-excellent with 0.14 m. The CC values of both B1I and B1C are higher than 0.2 m. By contrast, the CC values of the B1I/B3I of the BDS-3 GEO satellites are significantly improved compared to the BDS-2 satellites. The CC value on B2a of the new signal of BDS-3 is significantly lower than that of B1C.
Table 10 shows the average values of CC for different types of satellites on different frequencies (B2b vacancies), including all BDS-2 and BDS-3 satellites. It can be found that the CC value of BDS-3 satellites on B1I is significantly higher than that of the BDS-2 satellites, while on B3I, there is a smaller degree of improvement. The CC value of the new B2a signal broadcast on IGSO and MEO of BDS-3 satellites is significantly lower than that of B1C (
Figure 9).
The B1C/B2a frequency of the BDS-3 MEO satellites has good interoperability with other GNSS. Therefore, the CC values on the same frequency are compared. In this contribution, the CC values of C25 (BDS-3), G04 (GPS), E13 (Galileo) and J01 (QZSS) on the same are compared.
Figure 10 shows that the CC values of B1C, L1, E1 and L1 (QZSS) are relatively close, while the CC values of B2a, L5, E5a and L5 (QZSS) are also relatively close. At the same time, the CC value at the frequency point B2a (L5/E5a) is significantly lower than that of B1C (L1/E1) more than 0.3 m.
Figure 11 shows the elevation changes of these satellites in one day.
The CC statistics of different GNSS satellites are shown in
Table 11. For different GNSS satellites, the average CC of the B2a (L5/E5a) frequency point does not exceed 0.15 m, which is significantly better than the B1C (L1/E1) frequency. The E1 frequency of Galileo has the best CC value with 0.29 m, followed by B1C of BDS-3, which is significantly better than the L1 frequency of GPS and QZSS. The CC values of B2a, L5 and E5a frequency points are very close within 0.05 m.
The code observation accuracy of B1C/B2a is about 0.05 m better than traditional B1/B2/B3 signals, especially the code observation accuracy of B2a is better than 0.15 m. In comparison with other GNSS, B2a (L5/E5a) is better than B1C (L1/E1) by more than 0.5 meters, except for Galileo. Galileo’s E1 and E5 range code accuracy is very close. Therefore, in low-cost navigation applications, if a single-frequency ranging code is used for positioning, the B2a (L5/E5a) frequency is the best choice.
5.2. MP
CC used in
Section 5.1 is usually used for the evaluation of single-frequency receivers, which are susceptible to the ionosphere and multipath noise. The MP can deal with these problems, which are geometry-free and ionosphere-free. The interference delay effect caused by the satellite signal entering the receiver through multiple reflection paths is called the multipath. The expression of dual-frequency MP observation is shown in Equation (2) [
22,
23]. MP was determined by the pseudo-range multipath and noise, which is defined as Equation (3).
P and
the code and phase observation, respectively.
f and
represent the frequency and wavelength of the GNSS signal, respectively.
where the subscripts
i and
j (
i = j) indicate the difficult frequencies,
MPi is the multipath combination in meters. In the absence of cycle slips, bij is considered constant because it is composed of ambiguous terms and hardware delay deviation.
In order to make the MP values statistically significant, the authors analyzed all GEO/IGSO satellites, with the results are shown in
Table 12 and
Table 13. For the MP13 combination, the average value of BDS-3 GEO satellites is 0.03 m lower than BDS-2, while for the MP31 combination, the average value of BDS-3 is also 0.02 m lower than that of BDS-2. In contrast, for the MP13 combination, the average value of BDS-3 IGSO satellites is 0.07 m lower than of BDS-2, while for the MP31 combination, the average value of BDS-3 is also 0.07 m lower than that of BDS-2. Regardless of the BDS-2 or BDS-3 GEO/IGSO satellites, MP31 is lower than MP13 by more than 0.3 m.
Figure 12 shows the comparison of the MP values of the C14 satellite of BDS-2 and the C24 satellite of BDS-3. When the elevation of the C14 satellite increases, the MP value decreases, but after the elevation exceeds 50°, the MP values also show an extremely abnormal increase. In contrast, the MP value of C24 of BDS-3 decreases with the increase in elevation, and there is no abnormal phenomenon in C24. It can be seen that BDS-3 improves the systematic deviation of BDS-2 MEO satellites in MP.
Table 14 shows the MP13 and MP31 values of all BDS-2 and BDS-3satellites. By analyzing the average value, it can be found that the value of MP31 is nearly 0.07 m lower than that of MP13, while the MP noise of the MEO satellite of BDS-3 is better than that of BDS-2 exceed 0.05 m. At the same time, the research results of the MP noise of the new BDS-3 signals B1C and B2a show that it is nearly 0.03 m lower than the traditional frequency combination of B1I and B3I, while MP21 is also nearly 0.03 m lower than MP12.
In
Figure 13, at the first frequency point B1C (L1/E1) and the second frequency point, B2a (L5/E5a) for multiple GNSS interoperability, two MP observations are formed, namely MP12 and MP21. The values of the MP12 combination are relatively close, and MP21 has the same conclusion. No matter which GNSS system, the MP21 value is significantly lower than MP12.
In order to quantitatively analyze the MP value of the GNSS satellites, the MP statistics of different GNSS satellites are shown in
Table 15. It can be found that the MP12 and MP21 values of different GNSS are lower than 0.3 m, while MP21 is significantly lower than MP12 (except for E13 satellites). In short, the MP values of different GNSS satellites at the same frequency are very closely.
MP reflects the multipath noise characteristics of the GNSS signal. The multipath noise of MP12 and MP21 on BDS-3 B1C/B2a signals is about 0.5 m lower than traditional MP12 and MP21. In high-precision dual-frequency positioning, the combination of B1C and B2a is a better choice. In multi-system applications, the noise level of the combination of B1C and B2a and the combination of L1/E1 and L5/E5 is very close, and the multi-GNSS combination can be used in interoperability applications.
6. Quality of Carrier Phase Observations Based on Zero Baseline
Carrier phase observations are currently the most accurate observations for GNSS measurement, the measurement accuracy of which is on the order of millimeters. In this section, the authors analyze the accuracy of carrier phase observations. The zero-baseline [
18] observation method was used to evaluate the accuracy of carrier phase observation. In
Section 6.1, double-difference observations are used to evaluate the accuracy of the carrier, while in
Section 6.2, the zero-baseline solution of different navigation systems is used.
6.1. DD Phase Measurements
In order to evaluate the carrier accuracy of BDS-2 and BDS-3 on different frequency points, seven sets of double difference combinations were selected for evaluation. From
Figure 14 and
Table 16. It can be found that for BDS-2 satellites, the carrier accuracy of the B1I, B1I and B3I is about 2–2.5 mm, while MEO satellites have the highest accuracy among different types of satellites, followed by IGSO, GEO has the worst accuracy. For BDS-3 satellites, the carrier accuracy of the two frequency points of B1I and B2I was close, and the accuracy of MEO satellites was also the highest, followed by IGSO and GEO had the worst accuracy. As for the carrier accuracy of the same type of satellites at the same frequency, BDS-3 satellites are 0.3 m higher than BDS-2 satellites.
In this contribution, the double-difference values of C24-32 (BDS-3), C25-32 (BDS-3), G04-G16 (GPS), E13-E08 (Galileo) and J01-J03 (QZSS) on the same frequency (B1C/L1/E1/L1 (QZSS) and B2a/L5/E5a/L5) were compared.
Figure 15 shows the double-difference comparison of B1C/L1/E1/L1 (QZSS) and B2a/L5/E5a/L5, from which we can see that the accuracy of the dual-frequency zero-baseline observation value of the navigation system at the same frequency point was very close to each other. In
Table 16, the observation accuracy of B1C/L1/E1/L1 (QZSS) was in the range of 1.2–1.4 mm, while the accuracy of B2a/L5/E5a/L5 was slightly worse, which was in the range of 1.3–1.6 mm. The statistical characteristics of the accuracy of the single-frequency DD are very prominently shown in
Table 16. The carrier phase accuracy of the B1/B2/B3 frequency was higher than 2 mm, while the accuracy of the new signals B1C and B2a was better than 1.5 mm, which was very close to the L1/E1 and L5/E5 signals of GPS, Galileo and QZSS. Therefore, when using the carrier phase for high-precision positioning, B1C and B2a are both better choices.
6.2. Zero Baseline Solutions
The zero-baseline model was used to evaluate the accuracy of the carrier observations, including three coordinate components as E (east), N (north) and U (up), which were calculated and compared with the known baseline (theoretical value was zero). The carrier phase observation noise was calculated according to the error propagation law. The following was an analysis of the zero-baseline positioning of the BDS B1I and B3I signals, and the zero-baseline resulted of the new BDS B1C, and B2a signals were compared. By analyzing
Figure 16 and
Table 17, we can see that the zero baseline positioning results of the B1C and B2a signals were over 2 mm higher than the B1I and B3I signals, and the zero-baseline resulted of the B1C frequency point had the highest accuracy less than 2 mm in three dimensions.
L1/E1 and L5/E5 signals of GPS and Galileo were used to compare the BDS-3 new B1C and B2a signals.
Figure 17 and
Figure 18 show the zero-baseline results of GPS and Galileo, respectively. The statistical values are shown in
Table 17, in which we can see that the accuracy of zero-baseline resolution on B1C, L1 and E1 of Galileo was significantly higher than B2a of BDS, L5 of GPS and E5a of Galileo. This difference was at least 1 mm in three dimensions. Therefore, in the differential positioning mode, carrier phase observations of B1C, L1 and E1 frequencies are a better choice.
7. Discussion
BDS-3 was put into operation at the end of July 2020; the new signals B1C and B2a broadcast by BDS-3 satellites are not available in BDS-2. In the past year, a large number of positioning performance evaluations of SPP [
24], PPP [
25] and RTK [
26] of BDS-3 have been published. However, there are few studies evaluating the B1C and B2A signal performance of BDS-3 in-depth. Therefore, a comprehensive and in-depth performance evaluation of the new signals is very helpful for high-precision positioning applications and interoperability with other GNSS.
The carrier-to-noise ratio is an important parameter that characterizes the strength of the GNSS signals. After a large amount of data analysis, we found that BDS-3 has a significant improvement over BDS-2 at the traditional B1I and B3I frequency points, especially the improvement of B1I, which has reached 4–5 dB/Hz. It can be concluded that the signal strength of BDS-3 B1C and B2a is significantly better than B1I, B2I and B3I. Correspondingly, the signal strength of other GNSS co-frequency points is very close to the B1C and B2a signals of BDS-3. The evaluation results in this contribution reflect that the new signal of BDS-3 has good signal strength. Especially, the abnormal carrier-to-noise ratio of BDS-2 disappeared on the BDS-3 satellite.
CC and MP are used to evaluate the accuracy of the code observation. In fact, the accuracy of the code observation of the BDS-3 satellites was minorly improved than BDS-2, while the accuracy of the code observations on B1C and B2a is better than that of B1I, B2I and B3I. However, the code observation accuracy of B3I is better than that of B1C, which can be comparable to B2a. If only the single-frequency BDS code observation is used for positioning, B3I and B2a are preferred. The accuracy of the ranging code of other GNSS at the same frequency is equivalent to that of the B1C and B2a of the BDS-3 satellites. The evaluation result of the code observation can provide a basis for the selection of different frequencies.
DD and zero-baseline were used for an accurate evaluation of the carrier phase. Even so, the hardware thermal noise of the two Trimble receivers used in zero-baseline is still different, so DD observations may absorb unmodeled errors. The results of all carrier evaluations can reflect the relative accuracy of carriers at different frequencies. The DD accuracy of B1I, B2I and B3I frequency points are in the order of 2–2.5 mm, while the DD accuracy of B1C and B2a is in the range of 1–1.5 mm, which is significantly higher than the previous BDS signal. The DD accuracy of other GNSS at the same frequency is also in the range of 1–1.5 mm. As can be seen, the DD accuracy of B1C/L1/E1 is significantly higher than that of B2a/L5/E5a. The calculation result of the zero-baseline also confirms the above conclusion. The zero-baseline accuracy of B1C/L1/E1 is significantly higher than that of B2a/L5/E5a. Therefore, through the data analysis in this contribution, it can be inferred that the carrier on B1C/L1/E1 has the best accuracy and stability and is more suitable for high-precision positioning.
This contribution makes a detailed study of the characteristics of the new B1C/B2a signal and the old B1I/B2I/B3I signal of BDS-3 and separately discusses the GEP/MEO/IGSO satellites. Furthermore, the B1C/B2a signal was compared and analyzed with other GNSS signals at the same frequency. The research results of The contribution can provide an important reference for frequency selection in scenarios such as single-frequency pseudo-range positioning, single-frequency carrier phase differential positioning, and dual-frequency positioning. In addition, the signal accuracy evaluation results can provide prior information for algorithm design and model establishment in high-precision positioning. These analysis results can lay a solid foundation and provide an important reference for the use of BDS-3 new signals.
8. Conclusions
The analysis result of this contribution is the panorama of the new BDS-3 signal, including B1C and B2a. Compared with BDS-2 satellites signal, B1C/B2a has better signal strength, and the C/N0 of B2a signal is about 3 dB higher than other signals. The code observation accuracy of B1C/B2a is about 0.05 m higher than that of traditional B1/B2/B3 signal, especially that of B2a is better than 0.15 m. The double difference results of the zero-baseline show that the observation accuracy of B1C/L1/E1/L1 (QZSS) is between 1.2 and 1.4 mm and that of B2a/L5/E5A/L5 is slightly worse, between 1.3 and 1.6 mm, which is consistent with the results of the zero-baseline solution. It should be noted that the performance of the J01 satellite has declined due to its launch for more than ten years.
In the future, the authors plan to evaluate and study the accuracy of B2B PPP and Bs signal of BDS-3 in the next step. In addition, the same frequency signals of NAVIC are evaluated and compared.


