Article

Vegetation Cover Change and Its Attribution in China from 2001 to 2018

1
State Key Laboratory of Remote Sensing Science, Jointly Sponsored by Beijing Normal University and Aerospace Information Research Institute of Chinese Academy of Sciences, Faculty of Geographical Science, Beijing Normal University, Beijing 100875, China
2
Beijing Engineering Research Center for Global Land Remote Sensing Products, Institute of Remote Sensing Science and Engineering, Faculty of Geographical Science, Beijing Normal University, Beijing 100875, China
3
Department of Ecology and Evolutionary Biology, Cornell University, Ithaca, NY 14853, USA
4
Communication and Information Center of Ministry of Emergency Management, Beijing 100013, China
5
School of Earth and Space Sciences, Peking University, Beijing 100871, China
6
China Centre for Resources Satellite Data and Application, Beijing 100040, China
*
Author to whom correspondence should be addressed.
Remote Sens. 2021, 13(3), 496; https://doi.org/10.3390/rs13030496
Submission received: 22 December 2020 / Revised: 22 January 2021 / Accepted: 27 January 2021 / Published: 30 January 2021

Abstract

:
It is confirmed that China has been greening over the last two decades. Such greening and its driving factors are therefore significant for understanding the relationship between vegetation and environments. However, studies on vegetation changes and attribution analyses at the national scale are limited in China after 2000. In this study, fractional vegetation cover (FVC) data from Global Land Surface Satellite (GLASS) was used to detect vegetation change trends from 2001 to 2018, and the effects of CO2, temperature, shortwave radiation, precipitation, and land cover change (LCC) on FVC changes were quantified using generalized linear models (GLM). The results showed that (1) FVC in China increased by 14% from 2001 to 2018 with a greening rate of approximately 0.0019/year (p < 0.01), which showed an apparent greening trend. (2) On the whole, CO2, climate-related factors, and LCC accounted for 88% of FVC changes in China, and the drivers explained 82%, 89%, 90%, and 89% of the FVC changes in the Qinghai–Tibet region, northwest region, northern region, and southern region, respectively. CO2 was the major driving factor for FVC changes, accounting for 31% of FVC changes in China, indicating that CO2 was an essential factor in vegetation growth research. (3) The statistical results of pixels with land cover changes showed that LCC explained 12% of FVC changes, LCC has played a relatively important role and this phenomenon may be related to the ecological restoration projects. This study enriches the study of vegetation changes and its driving factors, and quantitatively describes the response relationship between vegetation and its driving factors. The results have an important significance for adjusting terrestrial ecosystem services.

1. Introduction

Fractional vegetation cover (FVC) was essential for characterizing vegetation [1,2,3], which is originally defined as the ratio of the vertical projected area of green vegetation on the ground [4], and vegetation in China shows a pronounced greening trend after 2000 [5]. Factors affecting the FVC change include CO2, precipitation, temperature, shortwave radiation and land cover change (LCC), evaluating the impact and contribution of these factors has been becoming one of the research hotspots. Some research results have shown that climate-related factors (e.g., precipitation, temperature, and radiation) provided favorable hydrothermal conditions for vegetation growth [6,7,8]. Climate warming affected growing period and photosynthesis, which in turn affects vegetation growth [9,10,11,12,13]; in arid and semiarid regions, precipitation limited vegetation growth [14,15,16]; and radiation dominated vegetation growth in rainforest areas [17]. In addition, increasing CO2 can enhance photosynthesis, which was considered to be the dominant factor for vegetation greening [18,19].
In China, relevant studies have researched vegetation change and its drivers in the past few decades. It has been suggested that China has experienced climate warming [20,21], and this warming has stimulated vegetation changes in southern China [17]. Studies have also shown that precipitation was the main factor affecting vegetation growth in northwestern and northern China [17,22], and radiation impacted vegetation in central China and the Three-River Source Region. Moreover, increased CO2 was the main driving factor of vegetation change in China [19]. In addition to the climate and CO2, the driving factors related to human activities involve land cover change (LCC) and land management, including irrigation, fertilization, and urbanization, which also played an important role [18,23,24,25]. However, vegetation change studies and attribution analyses at the national scale were limited in China after 2000.
According to whether land cover data can be used to calculate the impact of driving factors on FVC, we divided the methods into two categories. The first category, including correlation analysis, and partial derivative method, was not applicable to land cover data [26,27,28,29]. The second category, including ecological model and GLM (generalized linear models), was applicable to land cover classification [18,19,30]. In the first category, correlation analysis and the partial derivative method generally require that each variable has a normal joint distribution [31], and the results of correlation analysis were easily affected by extreme values in the process [31,32]. In the second category, the ecological model structure and parameter selection increased model usage complexity [33,34,35]. In contrast, GLM provided a flexible and simple framework that can fit nonlinear regression and was also suitable for independent variables of classified attributes or count data; the model was also efficient [30,36,37,38].
The objective of this study was to quantify the FVC changes and its attribution in China from 2001 to 2018. We first analyzed the changes in FVC based on linear regression Furthermore, according to the FVC data from Global Land Surface Satellite (GLASS), the meteorological data from the National Tibetan Plateau Data Center, the CO2 from NOAA Earth System Research Laboratories, and the land cover data from the United States National Aeronautics and Space Administration, GLM was used to quantitatively analyze the contributions of CO2, mean precipitation, mean temperature, mean shortwave radiation and land cover change to FVC changes.

2. Materials and Methods

2.1. Study Area

China covers a land area of about 9.63 × 10⁶ km2 [39]. In our study, China was divided into four areas based on factors such as temperature, and precipitation (Figure 1a): the Qinghai–Tibet region, northwest region, northern region, and southern region [40,41]. To highlight changes in the main land cover types, we merged 17 classifications into 6 (Table 1): cropland, forest, grassland, water, built-up land and bare land. Cropland included croplands and cropland/vegetation mosaics. Forest included evergreen needleleaf forests, evergreen broadleaf forests, deciduous needleleaf forests, deciduous broadleaf forests, mixed forests, closed shrublands, open shrublands, and woody savannas. Grassland includes savannas and grasslands. Water included permanent wetlands, snow and ice. Built-up land included urban and built-up land. Bare land includes barren or sparsely vegetated land. The main land cover types from west to east were bare land, grassland, cropland and forest (Figure 1a). Grassland was mainly distributed across the Qinghai–Tibet region and northwest region; cropland was distributed across the northern region; and forest was mainly distributed across the southern region (Figure 1b). The southern region has the highest mean precipitation and mean temperature. The Qinghai–Tibet region had the highest mean shortwave radiation, and the northwest region had the lowest mean precipitation (Figure 1c).

2.2. Data Sources

GLASS products: Global Land Surface Satellite (GLASS) FVC from 2001 to 2018 was offered by Beijing Normal University (http://glass-product.bnu.edu.cn/). The Moderate Resolution Imaging Spectrometer (MODIS) reflectance reprocessing method proposed by Tang et al. [42]. was used in production to generate reliable reflectance data. Then, the general regression neural networks were used to generate global FVC products from the preprocessed MODIS data. The spatial resolution is 0.5 km, and the temporal resolution is 8 days [43,44]. The coefficient of determination (R2) and root-mean-square error (RMSE) of this product were 0.86 and 0.087, respectively [45]. GLASS FVC has complete long time series and global coverage data, which was suitable for characterizing vegetation greening trends. In this study, the annual mean data were calculated based on FVC data for every 8 days.
Land cover products: The study was based on the MODIS land cover type product (MCD12Q1) from 2001 to 2018 offered by the United States National Aeronautics and Space Administration (NASA) (https://earthexplorer.usgs.gov) with a spatial resolution of 0.5 km and a temporal resolution of 1 year. The product includes 5 classification schemes (IGBP: International Geosphere-Biosphere Programme, UMD: University of Maryland, LAI: Leaf Area Index, BGC: BIOME-Biogeochemical Cycles, and PFT: Plant Functional Types). The IGBP was used in our study, which identified 17 land cover classes [46,47]. To highlight changes in the main land cover types, we merged 17 classifications into 6 (Table 1): cropland, forest, grassland, water, built-up land, and bare land, Table 1 showed the correspondence between 17 classes and 6 classes. 17 classes of land cover were used in the GLM, and 6 classes of land cover were used when drawing the chart.
Climate products: Precipitation, temperature and shortwave radiation data from 2001 to 2018 were offered by the National Tibetan Plateau Data Center (http://data.tpdc.ac.cn/en/data), and the spatial resolution of these grid data is 0.1° (~11 km), and the temporal resolution is 1 year. They were produced by integrating remote sensing products, reanalysis data sets and field station data [48,49].
CO2 dataset: CO2 data were site values from the National Cryosphere Desert Data Center (http://www.ncdc.ac.cn) and the NOAA Earth System Research Laboratories (ESRL) (https://www.esrl.noaa.gov/). The site from which CO2 was obtained is China Global Atmosphere Watch Baseline Observatory Mount Waliguan (WLG), and the data had good data quality. The CO2 used in our study was from WLG record value from 2001 to 2018 [50].

2.3. Data Preprocessing and Trend Analysis

The time resolution of FVC data was every 8 days, so there were 46 scenes in FVC every year. By calculating the average values of these 46 scenes, we can get the annual average value of FVC in all years. Following the overall research workflow (Figure 2), we first analyzed the spatial and temporal changes of FVC from 2001 to 2018. Then, nearest-neighbor resampling was used for resampling of CO2, and climate data to match the 0.5 km spatial resolution of the land cover data on a pixel-based level. After the steps of resampling, data with the same spatial and temporal resolution was obtained. GLM was then established to analyze the relationship between FVC, climate data, CO2, and land cover data from 2001 to 2018 on a per-pixel basis. Considering that many pixels consistently remained zero value of FVC from 2001 to 2018, we calculated the standard deviation of FVC based on the FVC data from 2001 to 2018. The pixels with a standard deviation of zero were not involved in drawing the chart.
The following formula represents the process of calculating the mean:
Mean   =   1 m i m Scene i ( i   =   1 ,   2 ,   ,   m ) ,
where i represents the scene number, m represents the total number of scenes. For the mean FVC, m is 46, and for the CO2, m is 12.
FVC is the response variable, and year is the independent variable. The following formula expressed the relationship between them:
FVC = k × Year + b,
where k is the FVC change trend, representing the interannual variability of FVC, and b is the intercept term [51]. A positive value of k indicated an increasing trend in FVC, while a negative value indicated a decreasing trend in FVC.
The p-values of two-sided Student’s t-tests were computed to test the significance of the trend (k). The p-value of 0.05 was the threshold to distinguish whether the pixel had a significant temporal change [51]. According to the p-value and k value, we divided the change of FVC into five situations: (1) k > 0 and p < 0.01: significant increase; (2) k > 0 and 0.01 < p <0.05: slight increase; (3) k < 0 and p < 0.01: significant decrease; (4) k < 0 and 0.01 < p <0.05: slight decrease; (5) p > 0.05: not significant.

2.4. Attribution Analysis

We selected CO2, mean precipitation, mean temperature, mean shortwave radiation, and land cover as factors. Then we used GLM to quantitatively analyze the contributions of CO2, mean precipitation, mean temperature, mean shortwave radiation and land cover to FVC changes. GLM provided a flexible framework for describing the relationship between the response variable and explanatory variables [30,38]. As an intermediate function between the linear predictor and response portions of the model, a link function g () allows for the use of nonnormal distributions, including normal, Poisson, gamma and binomial distributions. As such, dependent variables may be either discrete or continuous, and explanatory variables either quantitative or categorical [37,52].
Y = g (b0 + b1 × x1 +···bm × xm),
where Y called the response variable; x called explanatory variables; b called the regression coefficients; and g (…) is a link function. All analyses were carried out in R Version 3.6.1. Choosing a suitable model family for the specific work was the superiority of GLM over ordinary least squares [37].

3. Results

3.1. Spatial Patterns of FVC

Mean FVC across China showed considerable spatial variation from the west to the east and presented a flaky distribution. The land cover type in the areas with high FVC value was mainly forest, and the FVC value increased gradually as latitude decreased, indicating that the southern region was more suitable for forest growth. The main vegetation type in the Inner Mongolia was grassland, and the FVC decreased gradually as the distance from the coastline. In the northwest region, there were some areas with high FVC, and the corresponding land cover type was cropland, which may be affected by artificial irrigation (Figure 3a).
The FVC of the northern and southern regions was higher, ranging from 0 to 0.8, while the FVC in the Qinghai–Tibet and northwest regions was lower, ranging from 0 to 0.5. Part of the bare land was concentrated in the Qinghai–Tibet region and the northwest region. The proportion of bare land in the Qinghai–Tibet region was 38.9%, and that in the northwest region was 53.4%. The statistical results show that the ratio of FVC values between 0 and 0.2 in the Qinghai–Tibet region and the northwest region was very large, and the box plots and histograms of these two regions were generally similar. Cropland was the main land cover type in the northern region, accounting for 43.6%. At the same time, forest was the main land cover type in the southern region, accounting for 49.1%, which made the FVC value in the northern region and the southern region higher than that in the Qinghai–Tibet region and the northwest region (Figure 3b).
To further explore the difference in the average FVC of cropland, forest and grassland, the pixels that consistently remained one type of land cover from 2001 to 2018 were used for statistics. The figure indicated that there were remarkable diversities in FVC among cropland, forest and grassland. Specifically, the forest had the highest FVC values over China, ranging from 0.3 to 0.7, and the cropland and grassland had the lowest FVC values in the northwest region (Figure 3c).

3.2. Trend Analysis of the Changes in FVC

FVC showed a clear increasing trend in China from 2001 to 2018. The regions with increased significantly trend in FVC accounted for 30.31%, and the regions with decreased significantly trend in FVC accounted for 3.38%. Increasing FVC was generally found in the Northeast Plain, Loess Plateau, and Yunnan–Guizhou Plateau, and decreasing FVC was generally found in the Middle-Lower Yangtze Plain (Figure 4a).
In the statistics of Figure 4b, the annual average and standard deviation of the FVC in the statistical area were first calculated, and then the trend of the annual average FVC was fitted by a linear regression. Last, the consistency of the trend was tested by calculating the p-value of the two-sided Student’s t-test. Figure 4b showed that FVC increased by 14%, showing a significant greening trend, and the standard deviation varied between 0.23 and 0.25 from 2001 to 2018 across China. FVC values were highest in 2017 and 2018 and lowest in 2001. The FVC increase slope was approximately 0.0019/year, and FVC decreased slightly from 0.296 in 2002 to 0.291 in 2006. After 2009, FVC in China increased steadily, from 0.294 in 2009 to 0.322 in 2018. Generally, the increased speed and stability of the FVC from 2001 to 2008 were lower than those from 2009 to 2018. (Figure 4b)
The purpose was to compare FVC trends among the four regions, the annual average of the FVC was first calculated, and then the linear regression was used to obtain the trend. The statistics presented that FVC increased rapidly in the northern region and southern region and increased slowly in the Qinghai–Tibet region and northwest region. FVC trends in the southern and northern regions were approximately three times than those in the Qinghai–Tibet and northwest regions (Figure 4c).

3.3. Attribution Analysis of FVC Changes

3.3.1. Spatial Distribution of the Main Driving Factors

We calculated the contribution of driving factors to FVC change based on GLM. Figure 5 showed the spatial distribution characteristics of the contribution of driving factors to FVC, and Figure 5a was the R2 of GLM. Figure 6 showed the p-value of five drivers. We also have made statistics on the contribution of the driving factors in the four regions. The uncalculated pixels in Table 2 were pixels whose FVC was remained zero value from 2001 to 2018. We calculated the average contribution of each driving factor in the four regions. To highlight the contribution of land cover to FVC, we further extracted the pixels where the land cover data changed to obtain the mean contribution of the five driving factors in the four regions (Table 3).
The R2 of the GLM model was higher in the east and lower in the west (Figure 5a). Areas with R2 higher than 50% were mainly distributed in north region, south region and northwest region, especially in Inner Mongolia, Loess Plateau, Qinling Mountains, and Yunnan–Guizhou Plateau, while areas with R2 lower than 50% were mainly distributed in Qinghai–Tibet. At the country scale, increasing CO2 was the major driving factor for FVC changes. At the regional scale, CO2 was critical for FVC changes in southern and northern regions, especially in the Loess Plateau, Qinling Mountains, and Yunnan–Guizhou Plateau. However, CO2 had a small relatively importance in FVC changes in the eastern region of the Inner Mongolia Plateau (Figure 5b).
Precipitation had a high importance in FVC changes in arid and semiarid areas, while it had a small importance in the southern region (Figure 5c). FVC changes in the Qinghai–Tibet region were mainly affected by temperature (Figure 5d), and shortwave radiation was critical for FVC changes in the Qinghai–Tibet region and northern region (Figure 5e). The importance of LCC was relatively low, and it was mainly concentrated in the west North China Plain, and southern region. In areas where forest, cropland and grassland were widely distributed, LCC has played a relatively important role (Figure 5f).
Figure 6 showed the spatial distribution of p-value. Generally speaking, the area with a p-value less than 0.05 was regarded as the significance area. The results showed the area of CO2 with a p-value less than 0.05 was largest, and the area of precipitation with a p-value less than 0.05 was concentrated in arid and semi-arid areas and part of the southern region. However, the p-value of temperature and radiation less than 0.05 were relatively scattered, and they distributed in the southern and northern region. The number of pixels with a p-value less than 0.05 of land cover data was very small.

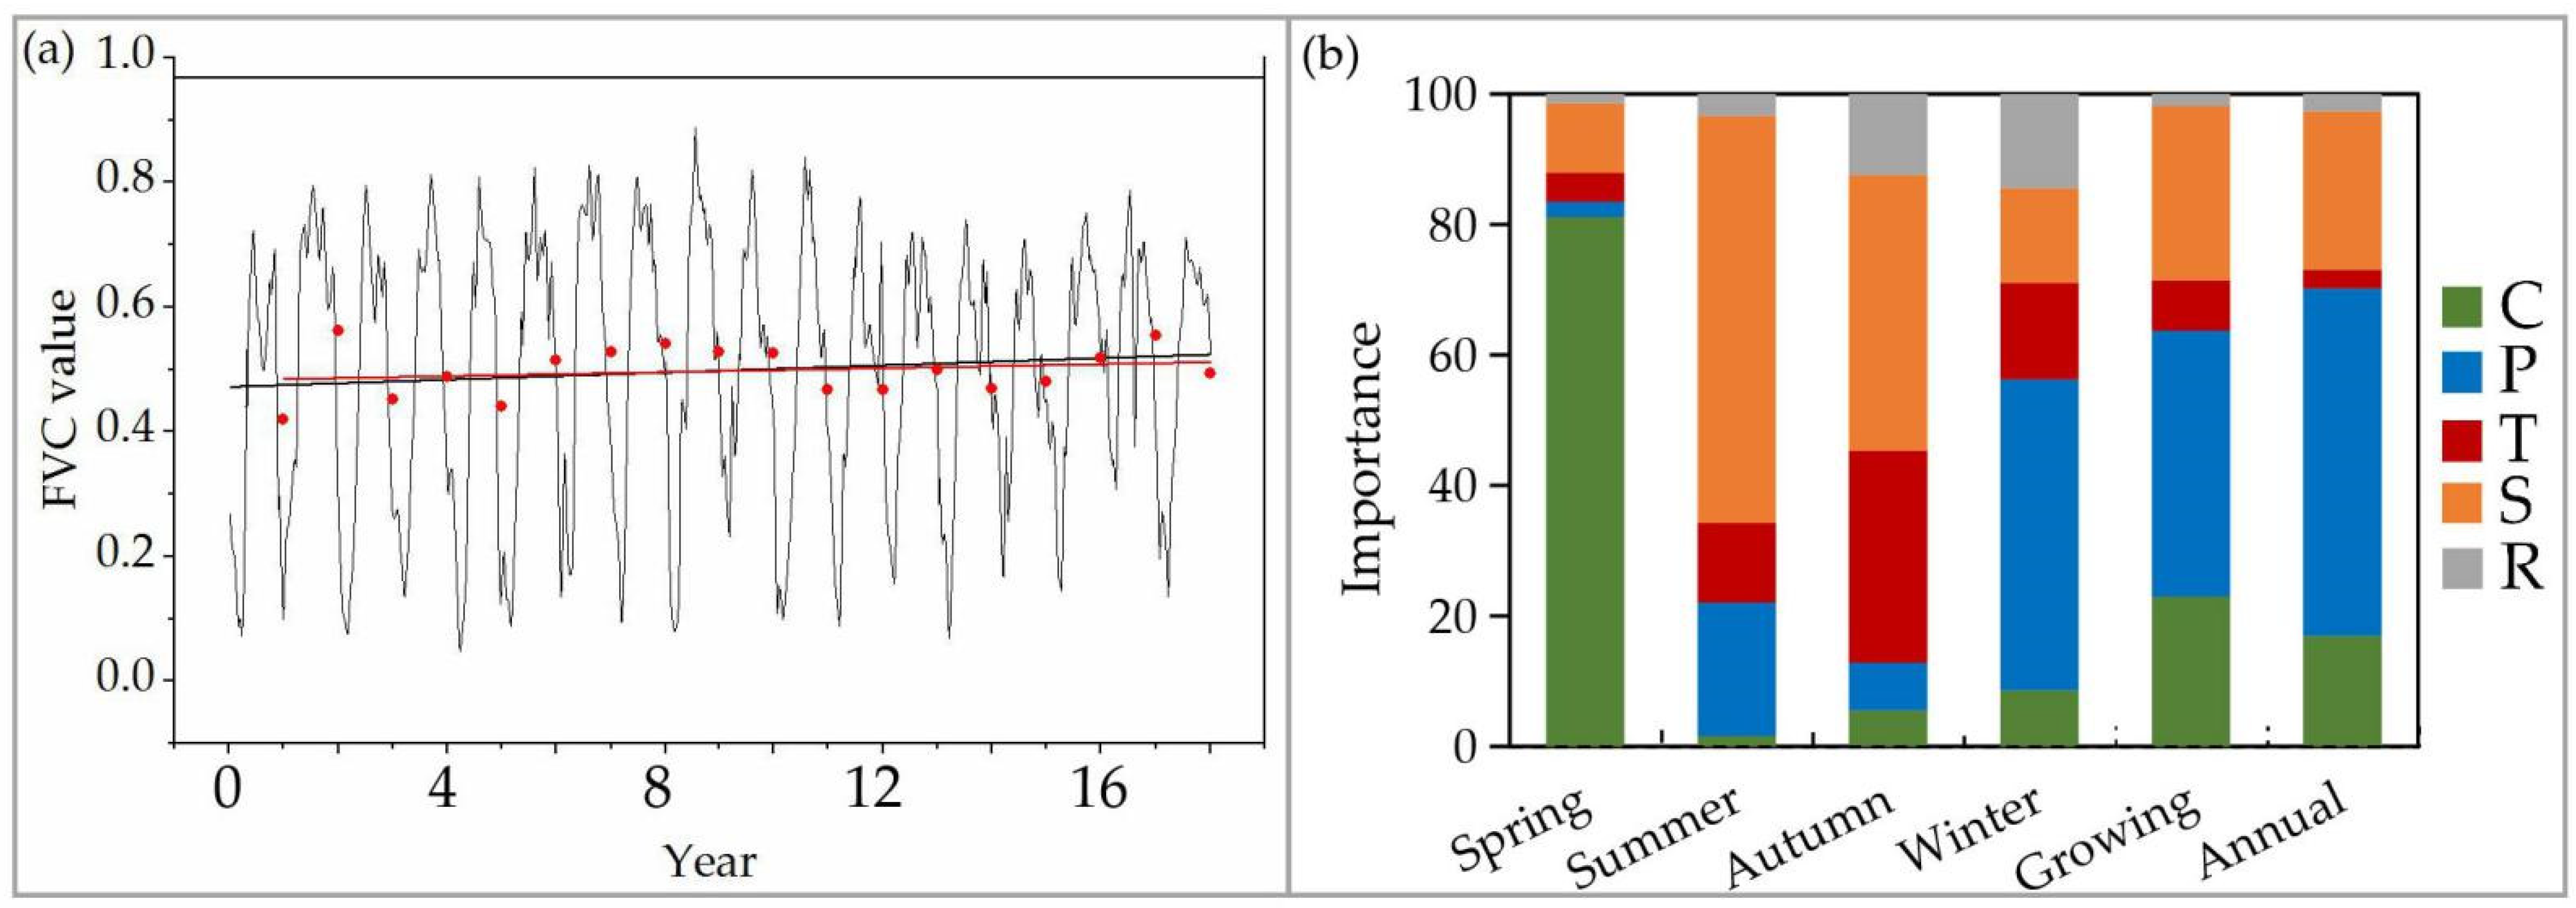
3.3.2. Contribution of Major Drivers

Changes in precipitation, temperature, and shortwave radiation varied from region to region. Precipitation increased rapidly in the northern and southern regions, and more slowly in the Qinghai–Tibet and northwest regions. The temperature increased most slowly in the Qinghai–Tibet region, while in other regions, the temperature increased faster. Shortwave radiation showed an increasing trend in the Qinghai–Tibet region, and a decreasing trend in the southern, northern and northwest regions (Figure 7). CO2 showed an obvious increasing trend from 2001 to 2018, with a slope of 2.20 ppm/year (p < 0.01) (Figure 8).
CO2, climate-related factors, and LCC in sum accounted for 88% of FVC changes in China, and the importance of driving factors in the east was high, while that in the west was relatively low. The drivers explained 82%, 89%, 90%, and 89% of the FVC changes in the Qinghai–Tibet region, northwest region, northern region, and southern region, respectively (Table 2).
At the country scale, CO2 was the main driver of FVC changes, accounting for 31%, and the effect of climate-related factors on vegetation change could not be ignored, among which precipitation, temperature and radiation accounted for 24%, 17% and 14% of FVC changes, respectively. Mean precipitation was the main driving factor for FVC changes in the Qinghai–Tibet region and northwest region, explaining 24% and 36% of FVC changes, respectively. CO2 was the major driving factor for FVC changes in northern and southern regions, explaining 38% and 40% of FVC changes, respectively. LCC played a relatively small role, explaining 2% of FVC changes (Table 2).
To further explore the impact of LCC on FVC changes, the pixels with changes in land cover data were used for statistics. The results showed that the importance of LCC to FVC changes increased from 2% to 12%. At the regional scale, LCC explained 15%, 11%, 10%, and 11% of FVC changes in the Qinghai–Tibet region, northwest region, northern region, and southern region, respectively. CO2, precipitation, temperature, shortwave radiation and LCC accounted for 90% of the FVC changes, an increase by 2% compared with these statistics at a country scale (Table 3).

4. Discussion

This study quantifies the trend of FVC in China over the past 18 years and its drivers. The result showed that FVC showed an apparent greening in China from 2001 to 2018, especially in south and north regions, and this result was similar to some existing results [5,17,53]. In addition to areas with significant increased, there were also some areas where FVC was showing a decreased trend, such as southwestern and Yangtze River Delta. Related research results indicated that decrease in vegetation in southwestern China might be related to extreme drought [54], while the decrease in vegetation in the Yangtze River Delta might be related to the urbanization [55].
Our study concentrated on analyzing the annual FVC changes and its attribution, thus we calculated the annual mean of FVC, precipitation, temperature, shortwave radiation and CO2. The annual mean of FVC has also been applied to many previous studies [29,53,56,57], Chen et al. [53] emphasized that the advantage of the annual mean vegetation index was that it was simple and reliable. To test the consistency of this method, we also selected some points randomly and obtained the month mean CO2, precipitation, temperature, shortwave radiation, and eight-day FVC value, respectively. Taking one point as example (Figure 9), we used the linear fitting of the trend of 8-day FVC and annual FVC, and the result showed that the trend of eight-day FVC was similar to the annual trend (Figure 9a). Considering that the response of vegetation to different driving forces might be affected by the seasons, we also calculated the importance of driving factors to FVC in spring (March–May), summer (June–August), autumn (September–November), winter (December–February), growing season (April–October) and inter-annual [58]. The results showed that the main drivers affecting vegetation were similar during the growing season and the inter-annual. However, the factors affecting the growth of FVC were different at different seasons, and this difference may be caused by the seasonal characteristics of the analyzed factors [59] (Figure 9b).
CO2 was an important factor affecting the growth of vegetation. Related research results showed that increasing CO2 can significantly increase vegetation productivity [60], and CO2 was the dominant factor in the greening trend of vegetation in the northern hemisphere [61]. Our model results suggest that CO2 was the major driving factor for FVC changes, accounting for 31% of FVC changes in China. FVC in southern region and northern region increased significantly (Figure 4), with CO2 accounting for 40% and 38% of FVC changes, respectively. Statistical results also illustrated that CO2 increased greatly in the past 18 years (Figure 8), making CO2 the main factor affecting FVC changes. Piao’s research also indicated the dominance of CO2, which was similar to our result [19].
Precipitation was the major factor affecting FVC changes in arid and semiarid regions (Figure 5c). In Fensholt’s study [16], precipitation was an essential factor affecting vegetation growth in arid regions, and a similar conclusion was drawn in Zhao’s study [22]. In addition, we have noticed that FVC was greatly affected by precipitation in the Qinghai–Tibet region, and similar result was found in previous studies [62,63]. However, there was also study showed that the temperature was the limiting factor in the Qinghai–Tibet region during dry periods, while precipitation promoted vegetation growth in warm periods [64,65]. Overall, climate change played an important role in explaining vegetation changes in the Qinghai–Tibet region, but more research was still needed to resolve this difference [19]. In addition, relevant studies have shown that temperature was the dominant factor affecting vegetation changes in high northern latitudes, and radiation was particularly important in tropical rainforests [14].
Limited by earlier methods, such as linear regression, many studies did not directly consider LCC, but used linear regression and residual methods to indirectly separate the impacts of human activity and climatic factors on vegetation changes [24,66,67,68]. However, the human activity obtained by this method contained other potential factors [69]. GLM was suitable for the independent variables of classified attributes, making the results easier to explain and more practical [36,70]. Our research results showed that in areas where land cover changed, LCC played a relatively important role, explaining 12% of FVC changes.
Although the contributions of five factors to FVC changes were quantified, there were still some uncertainties in this study. First, climate was closely related to human activities. For example, climate warming might cause vegetation to turn green, and warming was caused in part by human triggers [71]. At present, the response of vegetation to climate-related factors and human activities was still under debate [43,70], and vegetation has a certain time-lag effect on climatic factors [8,57]. Second, we mainly studied the effects of CO2, climate and LCC on FVC changes; however, vegetation growth in the ecosystem was also influenced by many other factors, including nitrogen and topographic factors [18,19,72,73]. Third, there were some uncertainties in the importance assessment of LCC in this study, which was mainly due to the fact that the spatial resolution of land cover data was 0.5 km and a pixel often contained multiple surface types, which caused mixed pixel phenomenon. Last, the response of vegetation to driving factors varied in different seasons; therefore, we will consider the influence of seasons in the future study of vegetation driving forces.

5. Conclusions

Vegetation status is an essential indicator in an ecosystem. Therefore, understanding the relationship between CO2, climate change, LCC, and FVC is critical for ecosystem conservation. In our work, we used GLM to quantitatively assess the contributions of different factors such as CO2, mean precipitation, mean temperature, mean shortwave radiation and LCC on FVC changes. We found the following: (1) FVC in China increased by 14% from 2001 to 2018 with a greening rate of approximately 0.0019/year (p < 0.01), which showing an apparent greening trend. The regions with increased significantly trend in FVC accounted for 30.91%, and the regions with decreased significantly trend in FVC accounted for 3.38%; (2) CO2, climatic factors, and LCC accounted for 88% of FVC changes in China. CO2 was the major driving factor for FVC growth, accounting for 31% of FVC changes, in contrast, precipitation, temperature, radiation and LCC accounted for 24%, 17%, 14%, and 2% of FVC changes, respectively; (3) The statistical results of pixels with LCC showed that LCC explained 12% of FVC changes.
Based on our research, vegetation growth in China continuously improved from 2001 to 2018, and increasing CO2 was the major driving factor for FVC growth in China. In arid and semiarid areas, it is necessary to change the way of water use and adopt drip irrigation and other management measures to improve the vegetation growth. In addition, land cover change has affected the growth of vegetation to a certain extent. These findings are helpful for understanding the relationship between environmental factors and vegetation growth.

Author Contributions

Conceptualization, B.M., X.Z. and D.W.; Formal analysis, B.M. and X.Z.; Funding acquisition, X.Z.; Methodology, X.Z.; Writing—original draft, B.M.; Writing—review and editing, B.M., X.Z., D.W., X.W., J.Z., H.W., Q.Z., X.D. and N.L. All authors have read and agreed to the published version of the manuscript.

Funding

This study was supported by the National Key Research and Development Program of China (No. 2016YFB0501404 and No. 2016YFA0600103).

Acknowledgments

We appreciate the “National Earth System Science Data Center, National Science & Technology Infrastructure of China (http://www.geodata.cn)” for providing fractional vegetation cover data. We appreciate the “National Tibetan Plateau Data Center (http://data.tpdc.ac.cn)” for providing the climate-related data. We also appreciate the “National Cryosphere Desert Data Center (http://www.ncdc.ac.cn)” and “NOAA Earth System Research Laboratories (ESRL) (https://www.esrl.noaa.gov/) “for providing the CO2 data.

Conflicts of Interest

The authors declare no conflict of interest.

References

  1. Zhang, X.; Liao, C.; Li, J.; Sun, Q. Fractional vegetation cover estimation in arid and semi-arid environments using HJ-1 satellite hyperspectral data. Int. J. Appl. Earth Obs. Geoinf. 2013, 21, 506–512. [Google Scholar] [CrossRef]
  2. Tu, Y.; Jia, K.; Wei, X.; Yao, Y.; Xia, M.; Zhang, X.; Jiang, B. A time-efficient fractional vegetation cover estimation method using the dynamic vegetation growth information from time series Glass FVC product. IEEE Geosci. Remote Sens. Lett. 2019, 17, 1672–1676. [Google Scholar] [CrossRef]
  3. Wu, D.; Wu, H.; Zhao, X.; Zhou, T.; Tang, B.; Zhao, W.; Jia, K. Evaluation of spatiotemporal variations of global fractional vegetation cover based on GIMMS NDVI DATA from 1982 to 2011. Remote Sens. 2014, 6, 4217–4239. [Google Scholar] [CrossRef] [Green Version]
  4. Mu, X.; Song, W.; Gao, Z.; McVicar, T.R.; Donohue, R.J.; Yan, G. Fractional vegetation cover estimation by using multi-angle vegetation index. Remote Sens. Environ. 2018, 216, 44–56. [Google Scholar] [CrossRef]
  5. Piao, S.; Wang, X.; Park, T.; Chen, C.; Myneni, R.B. Characteristics, drivers and feedbacks of global greening. Nat. Rev. Earth Environ. 2020, 1, 14–27. [Google Scholar] [CrossRef]
  6. Pearson, R.G.; Phillips, S.J.; Loranty, M.M.; Beck, P.S.A.; Damoulas, T.; Knight, S.J.; Goetz, S.J. Shifts in Arctic vegetation and associated feedbacks under climate change. Nat. Clim. Chang. 2013, 3, 673–677. [Google Scholar] [CrossRef]
  7. Peng, S.; Piao, S.; Ciais, P.; Myneni, R.B.; Chen, A.; Chevallier, F.d.r.; Dolman, A.J.; IJanssens, v.A.; Pen˜uela, J.; Zhang, G.; et al. Asymmetric effects of daytime and night-time warming on Northern Hemisphere vegetation. Nature 2013, 501, 88–92. [Google Scholar] [CrossRef]
  8. Wu, D.; Zhao, X.; Liang, S.; Zhou, T.; Huang, K.; Tang, B.; Zhao, W. Time-lag effects of global vegetation responses to climate change. Glob. Chang. Biol. 2015, 21, 3250–3531. [Google Scholar] [CrossRef]
  9. Piao, S.; Ciais, P.; Friedlingstein, P.; Peylin, P.; Reichstein, M.; Luyssaert, S.; Margolis, H.; Fang, J.; Barr, A.; Chen, A.; et al. Net carbon dioxide losses of northern ecosystems in response to autumn warming. Nature 2008, 451, 49–53. [Google Scholar] [CrossRef]
  10. Niemand, C.; K€ostner, B.; Prasse, H.; Gr€unwald, T.; Bernhofer, C. Relating tree phenology with annual carbon fluxes at Tharandt forest. Meteorol. Z. 2005, 14, 197–202. [Google Scholar] [CrossRef] [Green Version]
  11. Jeong, S.J.; Ho, C.H.; Kim, K.Y.; Jeong, J.H. Reduction of spring warming over East Asia associated with vegetation feedback. Geophys. Res. Lett. 2009, 36, L18705. [Google Scholar] [CrossRef]
  12. Lucht, W.; Prentice, I.C.; Myneni, R.B.; Pierre, S.S.; Friedlingstein, P.; Wolfgang, C.; Philippe, B.; Wolfgang, B.; Benjamin, S. Climatic control of the high- latitude vegetation greening trend and Pinatubo effect. Science 2002, 296, 1687–1689. [Google Scholar] [CrossRef] [PubMed] [Green Version]
  13. Ho, C.H.; Lee, E.J.; Lee, I.; Jeong, S.J. Earlier spring in Seoul, Korea. Int. J. Climatol. 2006, 26, 2117–2127. [Google Scholar] [CrossRef]
  14. Nemani, R.R.; Keeling, C.D.; Hashimoto, H.; Jolly, W.M.; Piper, S.C.; Tucker, C.J.; Myneni, R.B.; Running, S.W. Climate-driven increases in global terrestrial net primary production from 1982 to 1999. Science 2003, 300, 1560–1563. [Google Scholar] [CrossRef] [PubMed] [Green Version]
  15. Guo, B.; Zhang, J.; Meng, X.; Xu, T.; Song, Y. Long-term spatio-temporal precipitation variations in China with precipitation surface interpolated by ANUSPLIN. Sci. Rep. 2020, 10, 1–17. [Google Scholar] [CrossRef]
  16. Fensholt, R.; Langanke, T.; Rasmussen, K.; Reenberg, A.; Prince, S.D.; Tucker, C.; Scholes, R.J.; Le, Q.; Bondeau, A.; Eastman, R. Greenness in semi-arid areas across the globe 1981–2007—An Earth Observing Satellite based analysis of trends and drivers. Remote Sens. Environ. 2012, 121, 144–158. [Google Scholar] [CrossRef]
  17. Hua, W.; Chen, H.; Zhou, L.; Xie, Z.; Qin, M.; Li, X.; Ma, H.; Huang, Q.; Sun, S. Observational quantification of climatic and human influences on vegetation greening in China. Remote Sens. 2017, 9, 425. [Google Scholar] [CrossRef] [Green Version]
  18. Zhu, Z.; Piao, S.; Myneni, R.B.; Huang, M.; Zeng, Z.; Canadell, J.G.; Ciais, P.; Sitch, S.; Friedlingstein, P.; Arneth, A. Greening of the earth and its drivers. Nat. Clim. Chang. 2016, 6, 791–795. [Google Scholar] [CrossRef]
  19. Piao, S.; Yin, G.; Tan, J.; Cheng, L.; Huang, M.; Li, Y.; Liu, R.; Mao, J.; Myneni, R.B.; Peng, S. Detection and attribution of vegetation greening trend in China over the last 30 years. Glob. Chang. Biol. 2015, 21, 1601–1609. [Google Scholar] [CrossRef]
  20. Sun, Y.; Zhang, X.; Ren, G.; Zwiers, F.W.; Hu, T. Contribution of urbanization to warming in China. Nat. Clim. Chang. 2016, 6, 706–709. [Google Scholar] [CrossRef]
  21. Sun, J.; Ao, J. Changes in precipitation and extreme precipitation in a warming environment in China. Chin. Sci. Bull. 2013, 58, 1395–1401. [Google Scholar] [CrossRef] [Green Version]
  22. Zhao, X.; Tan, K.; Zhao, S.; Fang, J. Changing climate affects vegetation growth in the arid region of the northwestern China. J. Arid Environ. 2011, 75, 946–952. [Google Scholar] [CrossRef]
  23. Mu, S.; Zhou, S.; Chen, Y.; Li, J.; Ju, W.; Odeh, I.O.A. Assessing the impact of restoration-induced land conversion and management alternatives on net primary productivity in Inner Mongolian grassland, China. Glob. Planet. Chang. 2013, 108, 29–41. [Google Scholar] [CrossRef]
  24. Wang, J.; Wang, K.; Zhang, M.; Zhang, C. Impacts of climate change and human activities on vegetation cover in hilly southern China. Ecol. Eng. 2015, 81, 451–461. [Google Scholar] [CrossRef]
  25. De Long, J.R.; Sundqvist, M.K.; Gundale, M.J.; Giesler, R.; Wardle, D.A. Effects of elevation and nitrogen and phosphorus fertilization on plant defence compounds in subarctic tundra heath vegetation. Funct. Ecol. 2016, 30, 314–325. [Google Scholar] [CrossRef]
  26. Forzieri, G.; Alkama, R.; Miralles, D.G.; Cescatti, A. Satellites reveal contrasting responses of regional climate to the widespread greening of Earth. Science 2017, 356, 1180–1184. [Google Scholar] [CrossRef] [Green Version]
  27. Tang, R.; Zhao, X.; Zhou, T.; Jiang, B.; Wu, D.; Tang, B. Assessing the impacts of urbanization on albedo in Jing-Jin-Ji Region of China. Remote Sens. 2018, 10, 1096. [Google Scholar] [CrossRef] [Green Version]
  28. Zhou, Q.; Zhao, X.; Wu, D.; Tang, R.; Du, X.; Wang, H.; Zhao, J.; Xu, P.; Peng, Y. Impact of urbanization and climate on vegetation coverage in the Beijing–Tianjin–Hebei Region of China. Remote Sens. 2019, 11, 2452. [Google Scholar] [CrossRef] [Green Version]
  29. Zheng, K.; Wei, J.; Pei, J.; Cheng, H.; Zhang, X.; Huang, F.; Li, F.; Ye, J. Impacts of climate change and human activities on grassland vegetation variation in the Chinese Loess Plateau. Sci. Total Environ. 2019, 660, 236–244. [Google Scholar] [CrossRef]
  30. Tao, S.; Fang, J.; Zhao, X.; Zhao, S.; Shen, H.; Hu, H.; Tang, Z.; Wang, Z.; Guo, Q. Rapid loss of lakes on the Mongolian Plateau. Proc. Natl. Acad. Sci. USA 2015, 112, 2281–2286. [Google Scholar] [CrossRef] [Green Version]
  31. Li, P.; He, Z.; He, D.; Xue, D.; Wang, Y.; Cao, S. Fractional vegetation coverage response to climatic factors based on grey relational analysis during the 2000–2017 growing season in Sichuan Province, China. Int. J. Remote Sens. 2020, 41, 1170–1190. [Google Scholar] [CrossRef]
  32. Chew, G.; Walczyk, T. A Monte Carlo approach for estimating measurement uncertainty using standard spreadsheet software. Anal. Bioanal. Chem. 2012, 402, 2463–2469. [Google Scholar] [CrossRef] [PubMed]
  33. Sitch, S.; Huntingford, C.; Gedney, N.; Levy, P.E.; Lomas, M.; Piao, S.L.; Betts, R.; Ciais, P.; Cox, P.; Friedlingstein, P. Evaluation of the terrestrial carbon cycle, future plant geography and climate-carbon cycle feedbacks using five Dynamic Global Vegetation Models (DGVMs). Glob. Chang. Biol. 2008, 14, 2015–2039. [Google Scholar] [CrossRef]
  34. Piao, S.; Sitch, S.; Ciais, P.; Friedlingstein, P.; Peylin, P.; Wang, X.; Ahlström, A.; Anav, A.; Canadell, J.G.; Cong, N. Evaluation of terrestrial carbon cycle models for their response to climate variability and to CO2 trends. Glob. Chang. Biol. 2013, 19, 2117–2132. [Google Scholar] [CrossRef] [Green Version]
  35. Fang, H.; Jiang, C.; Li, W.; Wei, S.; Baret, F.; Chen, J.; Garcia-Haro, J.; Liang, S.; Liu, R.; Myneni, R.B. Characterization and intercomparison of global moderate resolution leaf area index (LAI) products: Analysis of climatologies and theoretical uncertainties. J. Geophys. Res. Biogeoences 2014, 118, 529–548. [Google Scholar] [CrossRef]
  36. He, S.; Mazumdar, S.; Arena, V.C. A comparative study of the use of GAM and GLM in air pollution research. Environmetrics 2005, 17, 81–93. [Google Scholar] [CrossRef]
  37. Lopatin, J.; Dolos, K.; Hernández, H.J.; Galleguillos, M.; Fassnacht, F.E. Comparing generalized linear models and random forest to model vascular plant species richness using LiDAR data in a natural forest in central Chile. Remote Sens. Environ. 2016, 173, 200–210. [Google Scholar] [CrossRef]
  38. Calcagno, V.; De Mazancourt, C. glmulti: An R package for easy automated model selection with (generalized) linear models. J. Stat. Softw. 2010, 34, 1–29. [Google Scholar] [CrossRef] [Green Version]
  39. Ding, Y.; Xu, J.; Wang, X.; Peng, X.; Cai, H. Spatial and temporal effects of drought on Chinese vegetation under different coverage levels. Sci. Total Environ. 2020, 716, 137166. [Google Scholar] [CrossRef]
  40. Li, S. Agroclimatic regionalization of China. J. Nat. Resour. 1987, 2, 71–83. [Google Scholar] [CrossRef]
  41. Zhao, S.; Hu, H.; Tian, F.; Tie, Q.; Wang, L.; Liu, Y.; Shi, C. Divergence of stable isotopes in tap water across China. Sci. Rep. 2017, 7, 43653. [Google Scholar] [CrossRef] [PubMed] [Green Version]
  42. Tang, H.; Yu, K.; Hagolle, O.; Jiang, K.; Geng, X.; Zhao, Y. A cloud detection method based on a time series of MODIS surface reflectance images. Int. J. Digit. Earth 2013, 6, 157–171. [Google Scholar] [CrossRef]
  43. Jia, K.; Liang, S.; Liu, S.; Li, Y.; Xiao, Z.; Yao, Y.; Jiang, B.; Zhao, X.; Wang, X.; Xu, S. Global land surface fractional vegetation cover estimation using general regression neural networks from MODIS surface reflectance. IEEE Trans. Geosci. Remote Sens. 2015, 53, 4787–4796. [Google Scholar] [CrossRef]
  44. Yang, L.; Jia, K.; Liang, S.; Liu, J.; Wang, X. Comparison of four machine learning methods for generating the GLASS fractional vegetation cover product from MODIS Data. Remote Sens. 2016, 8, 682. [Google Scholar] [CrossRef] [Green Version]
  45. Jia, K.; Liang, S.; Wei, X.; Yao, Y.; Yang, L.; Zhang, X.; Liu, D. Validation of Global LAnd Surface Satellite (GLASS) fractional vegetation cover product from MODIS data in an agricultural region. Remote Sens. Lett. 2018, 9, 847–856. [Google Scholar] [CrossRef]
  46. Loveland, T.R.; Reed, B.C.; Brown, J.F.; Ohlen, D.O.; Zhu, Z.; Yang, L.; Merchant, J.W. Development of a global land cover characteristics database and IGBP discover from 1 km AVHRR data. Int. J. Remote Sens. 2000, 21, 1303–1330. [Google Scholar] [CrossRef]
  47. Sulla-Menashe, D.; Friedl, M.A. User Guide to Collection 6 MODIS Land Cover (MCD12Q1 and MCD12C1) Product; USGS: Reston, VA, USA, 2018; pp. 1–18.
  48. Yang, K.; He, J.; Tang, W.; Qin, J.; Cheng, C.C.K. On downward shortwave and longwave radiations over high altitude regions: Observation and modeling in the Tibetan Plateau. Agric. For. Meteorol. 2010, 150, 38–46. [Google Scholar] [CrossRef]
  49. He, J.; Yang, K.; Tang, W.; Lu, H.; Qin, J.; Chen, Y.; Li, X. The first high-resolution meteorological forcing dataset for land process studies over China. Sci. Data 2020, 7, 1–11. [Google Scholar] [CrossRef] [Green Version]
  50. Wu, H. Data of Continuous Change of Carbon Dioxide Concentration in Waliguan from 1994 to 2016. National Cryosphere Desert Data Center. 2018. Available online: www.ncdc.ac.cn (accessed on 30 January 2021).
  51. Du, X.; Zhao, X.; Zhou, T.; Jiang, B.; Xu, P.; Wu, D.; Tang, B. Effects of climate factors and human activities on the ecosystem water use efficiency throughout Northern China. Remote Sens. 2019, 11, 2766. [Google Scholar] [CrossRef] [Green Version]
  52. Ravindra, K.; Rattan, P.; Mor, S.; Aggarwal, A.N. Generalized additive models: Building evidence of air pollution, climate change and human health. Environ. Int. 2019, 132, 104987. [Google Scholar] [CrossRef]
  53. Chen, C.; Park, T.; Wang, X.; Piao, S.; Xu, B.; Chaturvedi, R.K.; Fuchs, R.; Brovkin, V.; Ciais, P.; Fensholt, R.; et al. China and India lead in greening of the world through land-use management. Nat. Sustain. 2019, 2, 122–129. [Google Scholar] [CrossRef] [PubMed]
  54. Zhao, X.; Wei, H.; Liang, S.; Zhou, T.; He, B.; Tang, B.; Wu, D. Responses of natural vegetation to different stages of extreme drought during 2009–2010 in Southwestern China. Remote Sens. 2015, 7, 14039–14054. [Google Scholar] [CrossRef] [Green Version]
  55. Yuan, J.; Xu, Y.; Xiang, J.; Wu, L.; Wang, D. Spatiotemporal variation of vegetation coverage and its associated influence factor analysis in the Yangtze River Delta, eastern China. Environ. Sci. Pollut. Res. 2019, 26, 32866–32879. [Google Scholar] [CrossRef] [PubMed]
  56. Jiang, H.; Xu, X.; Guan, M.; Wang, L.; Huang, Y.; Jiang, Y. Determining the contributions of climate change and human activities to vegetation dynamics in agro-pastural transitional zone of northern China from 2000 to 2015. Sci. Total Environ. 2020, 718, 134871. [Google Scholar] [CrossRef] [PubMed]
  57. Lü, Y.; Zhang, L.; Feng, X.; Zeng, Y.; Fu, B.; Yao, X.; Li, J.; Wu, B. Recent ecological transitions in China: Greening, browning, and influential factors. Sci. Rep. 2015, 5, 8732. [Google Scholar] [CrossRef] [PubMed]
  58. Xiao, J.; Moody, A. Trends in vegetation activity and their climatic correlates: China 1982 to 1998. Int. J. Remote Sens. 2004, 25, 5669–5689. [Google Scholar] [CrossRef]
  59. Piao, S.; Fang, J. Seasonal changes in vegetation activity in response to climate changes in china between 1982 and 1999. Acta Geogr. Sin. 2003, 58, 119–125. [Google Scholar] [CrossRef]
  60. Norby, R.J.; DeLucia, E.H.; Gielen, B.; Calfapietra, C.; Giardina, C.P.; King, J.S.; Ledford, J.; McCarthy, H.R.; Moore, D.J.P.; Ceulemans, R.; et al. Forest response to elevated CO2 is conserved across a broad range of productivity. Proc. Natl. Acad. Sci. USA 2005, 102, 18052–18056. [Google Scholar] [CrossRef] [Green Version]
  61. Ahlbeck, J.R. Comment on “Variations in northern vegetation activity inferred from satellite data of vegetation index during 1981–1999” by L. Zhou et al. J. Geophys. Res. Atmos. 2002, 107, ACH 9-1-ACH 9-2. [Google Scholar] [CrossRef]
  62. Yang, Y.; Piao, S. Variations in grassland vegetation cover in relation to climatic factors on the Tibetan Plateau. Chin. J. Plant Ecol. 2006, 30, 1–8. [Google Scholar] [CrossRef]
  63. Zhang, X.; Lu, X.; Wang, X. Spatial-temporal NDVI variation of different alpine grassland classes and groups in northern tibet from 2000 to 2013. Mt. Res. Dev. 2015, 35, 254–263. [Google Scholar] [CrossRef]
  64. Huang, K.; Zhang, Y.; Zhu, J.; Liu, Y.; Zu, J.; Zhang, J. The influences of climate change and human activities on vegetation dynamics in the Qinghai-Tibet Plateau. Renote Sens. 2016, 8, 876. [Google Scholar] [CrossRef] [Green Version]
  65. Gao, Q.; Guo, Y.; Xu, H.; Granjurjav, H.; Li, Y.; Wan, Y.; Qin, X.; Ma, X.; Liu, S. Climate change and its impacts on vegetation distribution and net primary productivity of the alpine ecosystem in the Qinghai-Tibetan Plateau. Sci. Total Environ. 2016, 554, 34–41. [Google Scholar] [CrossRef] [PubMed]
  66. Li, Y.; Xie, Z.; Qin, Y.; Zheng, Z. Estimating relations of vegetation, climate change, and human activity: A case study in the 400 mm annual precipitation fluctuation zone, China. Remote Sens. 2019, 11, 1159. [Google Scholar] [CrossRef] [Green Version]
  67. Li, J.J.; Peng, S.; Li, Z. Detecting and attributing vegetation changes on China’s Loess Plateau. Agric. For. Meteorol. 2017, 247, 260–270. [Google Scholar] [CrossRef]
  68. Liu, R.; Xiao, L.; LIu, Z.; Dai, J. Quantifying the relative impacts of climate and human activities on vegetation changes at the regional scale. Ecol. Indic. 2018, 93, 91–99. [Google Scholar] [CrossRef]
  69. Zhang, Y.; Zhang, C.; Wang, Z.; Chen, Y.; Gang, C.; An, R.; Li, J. Vegetation dynamics and its driving forces from climate change and human activities in the Three-River Source Region, China from 1982 to 2012. Sci. Total Environ. 2016, 563–564, 210–220. [Google Scholar] [CrossRef]
  70. Pourghasemi, H.R.; Rossi, M. Landslide susceptibility modeling in a landslide prone area in Mazandarn Province, north of Iran: A comparison between GLM, GAM, MARS, and M-AHP methods. Theor. Appl. Climatol. 2017, 130, 609–633. [Google Scholar] [CrossRef]
  71. De Jong, R.; Schaepman, M.E.; Furrer, R.; De Bruin, S.; Verburg, P.H. Spatial relationship between climatologies and changes in global vegetation activity. Glob. Chang. Biol. 2013, 19, 1953–1964. [Google Scholar] [CrossRef]
  72. Peng, J.; Liu, Z.; Liu, Y.; Wu, J.; Han, Y. Trend analysis of vegetation dynamics in Qinghai–Tibet Plateau using Hurst Exponent. Ecol. Indic. 2012, 14, 28–39. [Google Scholar] [CrossRef]
  73. Mao, J.; Ribes, A.; Yan, B.; Shi, X.; Thornton, P.E.; Séférian, R.; Ciais, P.; Myneni, R.B.; Douville, H.; Piao, S. Human-induced greening of the northern extratropical land surface. Nat. Clim. Chang. 2016, 6, 959–963. [Google Scholar] [CrossRef]
Figure 1. Land cover and climate information. (a) the land cover distribution in 2018; (b) the ratio of land cover in 2018, and changes between 2001 and 2018 in the four regions; (c) mean and standard deviation of the precipitation (green bar chart), temperature (pink bar chart), and shortwave radiation (blue bar chart) in the four regions: Qinghai–Tibet (QT), Northwest (NW), Northern (N), and Southern (S).
Remotesensing 13 00496 g001
Figure 2. The methodological workflow of the research. (a) the spatial patterns of fractional vegetation cover (FVC); (b) the change trend of FVC from 2001 to 2018; (c) the spatial distribution and mean value of contribution in four regions: Qinghai–Tibet, Northwest, Northern, and Southern. The full name of generalized linear models (GLM) was generalized linear models.
Remotesensing 13 00496 g002
Figure 3. Statistical information on annual mean FVC. (a) the spatial distribution of the mean FVC from 2001 to 2018; (b) boxplot and histogram showing the mean FVC in four regions; (c) mean and standard deviation of FVC for cropland, forest, and grassland in four regions: Qinghai–Tibet (QT), Northwest (NW), Northern (N), and Southern (S).
Remotesensing 13 00496 g003
Figure 4. Spatiotemporal variation of the annual mean FVC. (a) the spatial distribution of the FVC change trend from 2001 to 2018; (b) the annual mean FVC and standard deviation from 2001 to 2018. The black curve connects annual mean FVC, the green stars represent the standard deviation, and the black straight line is the linear fitting result of annual mean FVC; (c) the mean FVC trend in four regions: Qinghai–Tibet (QT), Northwest (NW), Northern (N), Southern (S).
Remotesensing 13 00496 g004
Figure 5. Spatial patterns of importance to FVC changes. (a) the spatial distribution of R2; (b) importance of CO2 to FVC changes; (c) the importance of precipitation to FVC changes; (d) the importance of temperature to FVC changes; (e) the importance of shortwave radiation to FVC changes; and (f) the importance of LCC to FVC changes.
Remotesensing 13 00496 g005
Figure 6. Spatial patterns of p-value. (a) p-value of CO2; (b) p-value of precipitation; (c) p-value of temperature; (d) p-value of shortwave radiation; and (e) p-value of land cover data.
Remotesensing 13 00496 g006
Figure 7. The yearly mean precipitation (green bar chart), temperature (pink bar chart), and shortwave radiation (blue bar chart), and their trends from 2001 to 2018 in four regions (a: Qinghai–Tibet, b: Northwest, c: Northern, d: Southern).
Remotesensing 13 00496 g007
Figure 8. The red dot represents the annual mean value of CO2, and the red line represents the change trend of annual mean CO2. The black curve connects the monthly mean CO2 value, and the black straight line represents the monthly mean CO2 trend.
Remotesensing 13 00496 g008
Figure 9. Statistics of FVC changes and its attribution at one point. (a) FVC of eight-day and annual. The red dot represents the annual mean value of FVC, and the red line represents the change trend of annual mean FVC. The black curve connects the eight -day FVC value, and the black straight line represents the FVC trend of eight -day. (b) importance of driving factors to FVC in spring, summer, autumn, winter, growing season and inter-annual. C, P, T, S, and R refer to CO2, precipitation, temperature, shortwave radiation, and residual, respectively.
Remotesensing 13 00496 g009
Table 1. Correspondence between 17 classes and 6 classes.
Names of 6 ClassesNames of 17 Classes
CroplandCroplands
Cropland/Vegetation mosaic
ForestEvergreen Needleleaf Forests
Evergreen Broadleaf Forests
Deciduous Needleleaf Forests
Deciduous Broadleaf Forests
Mixed Forests
Closed Shrublands
Open Shrublands
Woody Savannas
GrasslandSavannas
Grasslands
WaterPermanent Wetlands
Water
Snow and Ice
Built-up landUrban and Built-up
Bare landBarren or Sparsely Vegetated
Table 2. Importance of driving factors to FVC changes in four regions, where the red color represents a higher importance, and the blue color represents a lower importance (Unit: %).
Regions
Qinghai–TibetNorthwestNorthernSouthernChina
Drivers
CO22324384031
Precipitation2436211524
Temperature1815161817
Shortwave radiation1613141214
Land cover21242
Sum8289908988
Table 3. Statistics on the regional importance of land cover change (LCC), where the red color represents a higher importance, and the blue color represents a lower importance (Unit: %).
Regions
Qinghai–TibetNorthwestNorthernSouthernChina
Drivers
CO22231403933
Precipitation1520161416
Temperature1716141616
Shortwave radiation1513131113
Land cover1511101112
Sum8491929190
Publisher’s Note: MDPI stays neutral with regard to jurisdictional claims in published maps and institutional affiliations.

