Article

NOAA-20 and S-NPP VIIRS Thermal Emissive Bands On-Orbit Calibration Algorithm Update and Long-Term Performance Inter-Comparison

1
CISESS/ESSIC, University of Maryland, College Park, MD 20740, USA
2
NOAA/NESDIS/Center for Satellite Applications and Research, College Park, MD 20740, USA
*
Author to whom correspondence should be addressed.
Remote Sens. 2021, 13(3), 448; https://doi.org/10.3390/rs13030448
Submission received: 24 December 2020 / Revised: 21 January 2021 / Accepted: 25 January 2021 / Published: 27 January 2021

Abstract

:
The Visible Infrared Imaging Radiometer Suite (VIIRS) on board the National Oceanic and Atmospheric Administration-20 (NOAA-20) and the Suomi National Polar-orbiting Partnership Program (S-NPP) satellites were launched in late 2017 and 2011, respectively. This paper presents a recent update in the VIIRS thermal emissive bands (TEB) on-orbit calibration algorithm and inter-compares long-term instrument and TEB sensor data records (SDR) performances of the two VIIRS, to support user communities. The VIIRS TEB calibration algorithm was improved to mitigate calibration biases during the blackbody warm-up/cool-down (WUCD) events. Four WUCD bias correction methods were implemented in the NOAA operational processing in 2019: (1) the Nominal-F method, (2) the WUCD-C method, (3) the Ltrace method, and (4) the Ltrace-2 method. Our evaluation results indicate that the on-orbit performances of the two VIIRS instruments have been generally stable and comparable with each other, except that NOAA-20 VIIRS blackbody and instrument temperatures are lower than those of the S-NPP VIIRS. The degradations in the S-NPP TEB detector responsivities remain small after 9 years on-orbit. NOAA-20 detector responsivities have been generally stable after the longwave infrared degradation during its early mission was resolved by the mid-mission outgassing. NOAA-20 and S-NPP VIIRS TEB SDRs agree with co-located Cross-track Infrared Sounder observations, with daily averaged biases within 0.1 K at nadir. After the implementation of operational WUCD bias correction, residual TEB WUCD biases are similar for NOAA-20 and S-NPP, with daily averaged biases ~0.01 K in all bands.

Graphical Abstract

1. Introduction

The Visible Infrared Imaging Radiometer Suite (VIIRS), onboard the National Oceanic and Atmospheric Administration-20 (NOAA-20) satellite, was launched on 18 November 2017, following 6 years of successful operations of its predecessor on the Suomi National Polar-orbiting Partnership (S-NPP) satellite that was launched on 28 October 2011 [1,2,3]. Both VIIRS instruments are equipped with 5 imaging bands (I-bands, 375 m at nadir), 16 moderate resolution radiometric bands (M-bands, 750 m at nadir), and one day/night Band (DNB, 750 m). VIIRS has 7 thermal emissive bands (TEB), including three mid-wave infrared (MWIR, I4 and M12-M13) and four longwave infrared (LWIR, I5 and M14-M16) bands. Table 1 summarizes the spectral, spatial, and radiometric characteristics of NOAA-20 and S-NPP VIIRS TEB spectral bands.
NOAA-20 and S-NPP VIIRS TEB sensor data record (SDR) products are valuable for monitoring severe weather events and deriving a wide variety of environmental data records (EDR), such as sea surface temperature (SST), land/ice surface temperature, active fires, and cloud properties. Assimilation of VIIRS clear-sky SST channel top of atmospheric radiances to the numerical weather prediction models is being experimented at NOAA. NOAA-20 operates in the same orbital plane as S-NPP, with NOAA-20 ~50 min (half orbit) ahead of S-NPP. NOAA-20 VIIRS observations, together with those from S-NPP VIIRS, enable users to develop blended EDR products with fewer data gaps and/or improved temporal resolution. It is important to characterize and monitor the on-orbit calibration performance of the operational NOAA-20 and S-NPP VIIRS SDR products to support user communities.
The purpose of this study is to present a recent update in the VIIRS TEB on-orbit calibration algorithm and to compare long-term instrument and SDR performances of the two VIIRS in the NOAA operational processing. VIIRS TEB calibration algorithm was updated to improve TEB calibration during the on-board calibrator blackbody (OBCBB) warm-up/cool-down (WUCD) events. Improvements in the NOAA-20 and S-NPP TEB SDRs were evaluated. Moreover, NOAA-20 and S-NPP long-term instrument and SDR performances were inter-compared to support user communities. Previous studies analyzed VIIRS TEB early on-orbit instrument performances for S-NPP [4] and NOAA-20 [5] only.
This paper is organized as follows. The VIIRS TEB on-orbit calibration algorithm update is given in Section 2. Section 3 inter-compares NOAA-20 and S-NPP long-term instrument performance. Section 4 focuses on inter-comparison of NOAA-20 and S-NPP VIIRS TEB SDRs. Section 5 summarizes this study.

2. VIIRS TEB On-Orbit Calibration Algorithm Update in the NOAA Operational Processing

VIIRS is a scanning radiometer with a rotating telescope assembly (RTA) that rotates 360° to collect signals from the Earth View (EV) port and the onboard calibrators including the Solar Diffuser, OBCBB, and Space View (SV) port. VIIRS TEB prelaunch and on-orbit calibrations are traceable to the standards maintained by the National Institute of Standards and Technology (NIST) [2]. During the prelaunch tests, calibration parameters, such as relative spectral response (RSR) functions, C-Coefficients ( c 0 , c 1 and c 2 ), and response versus scan (RVS), were carefully characterized. On-orbit, VIIRS TEB is calibrated on a scan-by-scan basis. Temperature controlled OBCBB is the primary on-orbit TEB calibration source and provides absolute calibration traceable to the NIST. SV provides the dark background reference. On-orbit detector response degradation factors (F-factor) are derived using OBCBB view, SV, C-coefficients and other prelaunch characterized parameters. Effects of instrument self-emission and RVS are accounted for during calibration. NOAA-20 and S-NPP VIIRS share the same design. In the NOAA operational processing, NOAA-20 and S-NPP VIIRS SDRs are produced using the same on-orbit calibration algorithm.

2.1. VIIRS TEB On-Orbit Calibration Algorithm during Nominal Operations

VIIRS TEB calibration algorithm has been presented in details in previous studies [6,7,8,9]. It is summarized here to provide the baseline for the recent algorithm update for WUCD bias correction. VIIRS TEB EV spectral radiance is derived using SV subtracted EV counts and prelaunch-derived calibration coefficients, and corrected for effects of on-orbit detector degradation, instrument self-emission, and the RVS effect. Equations (1) and (2) show how the EV radiances are calculated:
L e v = F · i = 0 2 c i · d n e v i ( R V S e v R V S s v ) · L m i r r o r R V S e v
L m i r r o r = ( 1 ρ R T A ) · L R T A L H A M ρ R T A
where L e v is EV spectral radiance entering the instrument aperture; c i represents 2nd order polynomial calibration coefficients derived from prelaunch test data; d n e v is the EV digital count with the SV count subtracted; R V S e v is the RVS at EV angle of incidence (AOI) on the half-angle mirror (HAM); R V S s v is RVS at SV AOI on the HAM; L m i r r o r is the instrument background emission term; ρ R T A is the RTA reflectivity; L R T A is RTA emitted radiance; L H A M is HAM emitted radiance. F is the on-orbit degradation factor (F-factor), which is calculated scan-by-scan using Equations (3)–(6) for each band, HAM-side, and detector:
F = F n o r m = L b b _ m o d e l / L b b _ p r e l a u n c h
L b b _ m o d e l = R V S b b · L b b _ e m i t t e d + r e f l e c t e d + ( R V S b b R V S S V ) · L m i r r o r
L b b _ p r e l a u n c h = i = 0 2 c i · d n b b i
L b b _ e m i t t e d + r e f l e c t e d = ε b b L b b + ( 1 ε b b ) · L b b r e f
where R V S b b is RVS at OBCBB AOI on the HAM; ε b b is OBCBB emissivity; d n b b is the OBCBB digital count with the SV count subtracted; L b b is OBCBB emitted radiance according to Planck’s function; ε b b L b b is OBCBB emitted radiance; ( 1 ε b b ) · L b b r e f is OBCBB shield, cavity, and telescope originated radiance reflected off the OBCBB; L b b _ e m i t t e d + r e f l e c t e d is OBCBB emitted and reflected radiance.

2.2. TEB On-Orbit Calibration Algorithm during Warm-Up/Cool-Down (WUCD)

Prior to July 25, 2019, Equation (3) had been used for the on-orbit calibration of VIIRS TEBs during both nominal (|Tbb − 292.5 K| <= 0.5 K, nominal operations) and non-nominal OBCBB temperatures (|Tbb − 292.5 K| > 0.5 K). This equation works well during normal operations for both NOAA-20 and S-NPP. However, small F-factor anomalies hence TEB calibration biases were observed during the OBCBB WUCD events [7,9], which are performed regularly to monitor the on-orbit changes of zero offsets ( c 0 ) and nonlinear calibration coefficients ( c 2 ).
The VIIRS TEB on-orbit calibration algorithm has been updated to mitigate the TEB calibration anomaly during the WUCD events since 25 July 2019. Note that the F-factor calculation remains unchanged during nominal operations. The updated TEB calibration algorithm supports three WUCD bias correction methods explicitly: the Nominal-F method, the Ltrace method, and the Ltrace-2 method. The VIIRS emissive look-up-table (LUT) was revised accordingly to configure the WUCD bias correction method used and to accommodate the correction coefficients required. Figure 1 illustrates the flowchart of the updated TEB calibration algorithm for operational WUCD bias correction. Note that a fourth WUCD bias correction method, the WUCD-C method [9], can also be used for WUCD bias correction in operational processing. The implementation of this method does not require a TEB calibration algorithm code change (see Section 2.2.2).

2.2.1. The Nominal-F Method

The Nominal-F method uses F-factor during nominal operation for TEB calibration during WUCD events. The normal F-factors are derived offline using Equation (3) during nominal operations. Nominal F-factors shortly before a WUCD event are preferred. Frequently Emissive LUT updates is required if on-orbit detector responsivity degradations over time.

2.2.2. The WUCD-C Method

On-orbit OBCBB WUCD events are performed regularly to characterize VIIRS TEB calibration offset ( c 0 ) and nonlinearity ( c 2 ) changes over time [4,7,9]. Data from WUCD provide a source of calibration radiance over the range from ~267 K to 315 K, independent of the prelaunch calibration source. Band, HAM-side and detector-dependent 2nd order polynomial calibration coefficients can be derived using WUCD data using Equation (7):
R V S b b · L b b _ e m i t t e d + r e f l e c t e d + ( R V S b b R V S s v ) · L m i r r o r = i = 0 2 c i , w u c d · d n b b i
where c i , w u c d represented WUCD-derived 2nd order polynomial C-coefficients.
The WUCD-C method uses C coefficients derived from on-orbit WUCD to replace the prelaunch C coefficients for TEB calibration. Different from the other three WUCD bias correction methods, the WUCD-C method is implemented by updating the C-coefficients LUT, and no code change is required. Wang et al. [9] indicates that this method works well for S-NPP TEB WUCD bias correction. In this study, we also analyzed its performance for NOAA-20. Results show that the method also works for NOAA-20 TEBs, with performance similar to that for S-NPP. However, the WUCD-C method is a global method, i.e., the calibration during nominal operations is also affected if this method is used.

2.2.3. The Ltrace Method

The Ltrace method [7,9] introduces an additive correction term, Ltrace, to the F-factor equation (see Equation (3)), to mitigate F-factor anomalies during WUCD and, hence reduce WUCD biases in TEB SDRs. Equations (8) and (9) show the modified F-factor equation and the definition of the Ltrace term:
F W U C D ,   L t r a c e = ( L m o d e l + L t r a c e ) / L p r e l a u n c h
L t r a c e = F n o r m · L p r e l a u n c h L m o d e l = i = 0 3 a i · d n b b i
where a i represents fitted Ltrace correction coefficients. Band, HAM-side, and detector dependent L t r a c e terms are derived numerically using d n b b , averaged F-factor during nominal operations ( F n o r m ), prelaunch C-coefficients, and the L m o d e l term during the WUCD. Details of the Ltrace method are given in [7,9].

2.2.4. The Ltrace-2 Method

Our previous studies indicate that the Ltrace method performs well for the S-NPP LWIR bands, while it does not work for most S-NPP MWIR bands [9]. The Ltrace-2 method is an analytical-based improved version of the Ltrace method that takes advantages of both the ideas of the Ltrace method and the WUCD-C method. It applies a scaling factor to the baseline F-factor (Equation (3)):
F W U C D ,   L t r a c e 2 = f L t r a c e 2 · L m o d e l / L p r e l a u n c h
f L t r a c e 2 = f r a t i o ,   N o m i n a l / f r a t i o ,   W U C D = i = 0 3 b i · d n b b i
f r a t i o = ( i = 0 2 c i , W U C D · d n b b i ) / ( i = 0 2 c i · d n b b i )
where c i , W U C D represent WUCD-derived C-coefficients; b i represents the fitted polynomial Ltrace-2 correction coefficients; f r a t i o is derived using d n b b and prelaunch/WUCD C-coefficients during normal operations ( f r a t i o ,   N o m i n a l ) or WUCD ( f r a t i o ,   W U C D ). The operational implementation of the Ltrace-2 method is similar to that of the Ltrace method.

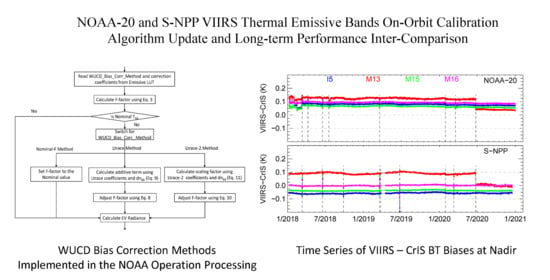
2.2.5. Comparison of WUCD Bias Correction Methods

The Ltrace and the WUCD-C methods were analyzed in-depth using S-NPP VIIRS data in previous studies [7,9]. The performance of the Nominal-F and the Ltrace-2 method were analyzed in this paper. Figure 2 compares residual WUCD biases for the Nominal-F, the WUCD-C, the Ltrace, and the Ltrace-2 methods for M15 and M13, using VIIRS–CrIS (Cross-track Infrared Sounder, also onboard NOAA-20 and S-NPP) brightness temperature (BT) difference time series [9]. Operational and reprocessed S-NPP VIIRS SDRs, as well as the operational CrIS normal resolution SDR, during the 19–21 September 2016 WUCD event were used. The calibration of CrIS is stable during this 3-day period. The calibration of VIIRS TEBs during nominal operations (19 September 2016 00:00–05:59 UTC and 21 September 2016 03:00–23:59 UTC) is also stable. Averaged VIIRS–CrIS BT biases during nominal operations were used as references to evaluate the performance of the 4 WUCD bias correction methods. The references BT biases were subtracted from the time series shown in Figure 2 to better present the VIIRS calibration biases before and after applying the WUCD bias correction methods.
For M15 (Figure 2a), all 4 bias correction methods work well, especially during the cool-down phase. The daily averaged residual WUCD biases are ~0.01 K and uncertainties (standard deviations) from 0.01–0.02 K. The Normal-F and the Ltrace-2 methods were slightly outperformed by the Ltrace and the WUCD-C methods during the warm-up phase. Residual WUCD biases patterns in other LWIR bands and during other S-NPP WUCD events are similar.
For M13 (Figure 2b), the WUCD-C method performs best among the 4 methods, with daily averaged bias less than 0.01 K and uncertainty ~0.02 K. The performance of the Ltrace-2 method is comparable to the Nominal-F method (with daily averaged biases ~0.01 K and uncertainty ~0.02 K), both outperforming the Ltrace method (not effective). Evaluation results using radiative transfer model simulated clear-sky radiance indicate that the WUCD biases in other MWIR bands can also effectively be mitigated using the Ltrace-2 and WUCD-C method.
WUCD biases were also observed in NOAA-20 TEBs. Before the operational implementation, we analyzed the NOAA-20 TEB WUCD biases using reprocessed TEB SDRs. Results show that 4 methods developed for S-NPP also works for NOAA-20, with performances similar to that of S-NPP. WUCD bias correction evaluation results using S-NPP and NOAA-20 on-orbit observations will be given in Section 3.3.2 and Section 4.1.2.
The Nominal-F, the Ltrace, and the Ltrace-2 methods apply localized corrections, i.e., during WUCD events or other non-nominal OBCBB temperature conditions only. The TEB on-orbit calibration during nominal operations are not affected. On the other hand, the WUCD-C method is a global method. TEB calibrations during both nominal and non-nominal operations will be affected if this method is used. Moreover, periodical calibration updates are required for the Nominal-F and the WUCD-C methods due to detector response degradations over time.
The updated VIIRS TEB calibration algorithm supports all 4 WUCD bias correction methods. The method actually used in the NOAA operational processing are configurable on a band-to-band basis using the Emissive LUT. To date, the Ltrace method is applied to S-NPP M12, M14-M16, I5 and NOAA-20 M14-M16 and I5; the Ltrace-2 method is applied to S-NPP band M13 and I4 and NOAA-20 M12-M13 and I4 (see Table 2). The Nominal-F and the WUCD-C methods are reserved. The updated VIIRS SDR algorithm was implemented in the operational processing on 25 July 2019.

3. Comparison of NOAA-20 and S-NPP VIIRS Long-Term Instrument Performances

NOAA-20 VIIRS nadir door was opened on 15 December 2017; cryo-radiator door was opened on 3 January 2018 and cold focal plane assemblies (FPA) reached nominal operating temperatures on 5 January 2018. S-NPP VIIRS nadir door was opened on 21 November 2011; cryo-radiator door was opened on 20 January 2012 and cold FPAs reached nominal operating temperatures on 22 January 2012. NOAA-20 and S-NPP VIIRS early on-orbit instrument performance, including OBCBB temperature and uniformity, instrument temperatures, detector responses, noise equivalent differential temperature (NEdT), and on-orbit changes of zero offset and non-linearity, were analyzed in previous studies [4,5]. In this section, NOAA-20 and S-NPP long-term instrument performances (from launch to 31 December 2020) were compared, focusing on the aspects that directly affect VIIRS TEB on-orbit calibration.

3.1. On-Board Calibrator Blackbody (OBCBB) Temperature and Uniformity

NOAA-20 and S-NPP VIIRS use an on-board V-groove OBCBB, characterized prelaunch using the NIST traceable blackbody calibration source, as a reference calibration source for the TEBs. It is controlled at selected constant temperatures and with known emissivity (very close to unity). Six thermistors are embedded in the OBCBB to provide accurate temperature measurements from its different parts at each scan. During nominal operations, OBCBB temperature is set to a nominal value of 292.5 K for both NOAA-20 and S-NPP. OBCBB uniformity is defined as standard deviation of six OBCBB thermistor temperatures. Methods for calculating OBCBB temperature and uniformity are given in [6].
Figure 3 compares long-term time series of NOAA-20 and S-NPP VIIRS OBCBB temperature anomalies (Tbb minus averaged value in the beginnging of the mission) and uniformity during nominal operations, using 2 granules from each orbit when spacecraft passage over the South Pole, i.e., over the sweet-spot for VIIRS reflective solar bands (RSB) solar calibration. The sweet-spot granules occur near the end of nighttime of an orbit when the thermal environment is stable, therefore can be used to generate reliable long-term trending results.
NOAA-20 and S-NPP OBCBB temperature and uniformity have both been stable over time and close to the nominal value (292.5 K). NOAA-20 VIIRS OBCBB temperature (~292.58 K) is ~0.1 K lower than that of S-NPP (~292.67 K, see Figure 3), consistent with previous studies [4,5]. For S-NPP, OBCBB temperature drifts only ~5 mK after 9 years on-orbit. Three short-term small jumps (~15 mK) were observed during its early mission. These small jumps are due to the slightly different OBCBB temperature setting tables used [4]. The impact of these jumps on TEB calibration can be ignored due to their small magnitude. NOAA-20 OBCBB temperature drifts ~10 mK after ~3 years on-orbit, which is faster than that of S-NPP. NOAA-20 OBCBB also shows higher non-uniformity compared to S-NPP, but still meets the 30 mK requirement [4] in general. VIIRS OBCBB is more uniform during nighttime, with uniformity ~10 mK or better for both instruments. OBCBB is less uniform during daytime. Occasionally, NOAA-20 OBCBB uniformity becomes slightly higher than 30 mK during daytime (not shown).

3.2. Instrument Temperatures

Figure 4 compares NOAA-20 and S-NPP VIIRS instrument component temperatures, including temperatures of electronics, opto-mechanical module (OMM), HAM, RTA, cavity, OBCBB shield, LWIR and short and mid-wave infrared (S/MWIR) cold FPA temperatures, and longwave cold FPA heater power. These instrument temperatures are directly used by the TEB calibration algorithm. It is worth noting that NOAA-20 VIIRS is currently on electronics side-A, with electronics temperatures ~13 K lower than that of S-NPP (currently on side-B). NOAA-20 VIIRS OMM, RTA, cavity, blackbody shield temperatures are also lower than that of S-NPP, while HAM temperatures are about 1 K warmer that of S-NPP. In addition, NOAA-20 and S-NPP electronics, RTA, HAM, cavities, and OBCBB shield temperatures have been increasing gradually over time. Small seasonal variations (~1–2 K) were observed in these instrument temperatures, with peaks occur when the Earth is around perihelion (January) and valleys occur when the Earth is around spring equinox (March) and/or aphelion (July).
NOAA-20 VIIRS cold FPA temperatures were set to a nominal value of 80.5 K during nominal operations, which is higher than S-NPP (80.0 K). NOAA-20 and S-NPP LWIR and S/MWIR FPA temperatures have been stable and close to the nominal values, except during short-term instrument maneuvers and anomalies. VIIRS LWIR FPA temperature is actively controlled, while S/MWIR FPA temperature is passively controlled and shows slightly more variations compared to the LWIR FPA temperature (see Figure 4g,h). NOAA-20 has a smaller margin in longwave heater power compared to that of S-NPP (see Figure 4i), indicating that S-NPP longwave heater power performs better than that of NOAA-20. NOAA-20 VIIRS longwave heater power is ~120 mW in the beginning of the mission, and about 20 mW lower than that of S-NPP during its early mission. NOAA-20 longwave heater power is ~100 mW after 3 years on-orbit; S-NPP longwave heater power is ~95 mW after 9 years of operations.

3.3. TEB F-Factors

3.3.1. F-Factors during Nominal Operations

VIIRS TEB F-factors were characterized and monitored since 5 January 2018 (for NOAA-20) and 22 January 2012 (for S-NPP), after the LWIR and S/MWIR FPAs reached nominal temperatures and stabilized. F-factors during nominal operations were derived using Equation (3) (see Section 2.1) and the two sweet-spot granules for solar band calibration. Figure 5 shows NOAA-20 and S-NPP VIIRS normalized band-averaged time series of TEB gains (1/F-factor) during nominal operations since the beginning of the missions.
The degradations of S-NPP VIIRS TEBs have been small after 9 years on-orbit (see Figure 5a). I5 exhibits the most degradation, but only ~2.5%; the degradations in other LWIR bands are less than 1%. The changes of the S-NPP MWIR detector responsivities are also less than 1% after 9 years’ operations. Seasonal variations in I5, M14, and M16 F-factors were observed.
In contrast, during the early mission, NOAA-20 LWIR bands I5 and M15-M16 show larger than expected degradations in the responsivity (see Figure 5b), most likely caused by the ice accumulation inside the cold FPA dewar assembly [3,10,11]. A mid-mission outgassing (MMOG) was performed on 12 March 2018 to warm up the cold FPA dewar assembly to remove ice. After the MMOG, the LWIR responsivity returning to levels similar to the beginning of January 2018. M14-M15 F-Factors have remained stable at the time of this study. Gradual degradations in I5 and M16 were observed after the MMOG, but are similar to S-NPP. Different from S-NPP LWIR bands, no significant seasonal variations were observed in the NOAA-20 LWIR F-factors. NOAA-20 MWIR F-factors have been very stable during nominal operation since the beginning of the mission, and more stable than S-NPP.
It is worth noting that the NOAA-20 LWIR degradation has been accounted for by the TEB calibration algorithm, therefore it has little impacts on the NOAA-20 TEB SDRs. Nevertheless, the on-orbit tests conducted to support the investigation of the root cause of LWIR degradation, such as the elevated OBCBB temperature (16 February–9 March 2018, Tbb = 307.5 K), the telescope stow (21 February 2018), and the MMOG [5], introduced short-term calibration biases or data gaps in the TEB SDRs (see Section 4.1.1).

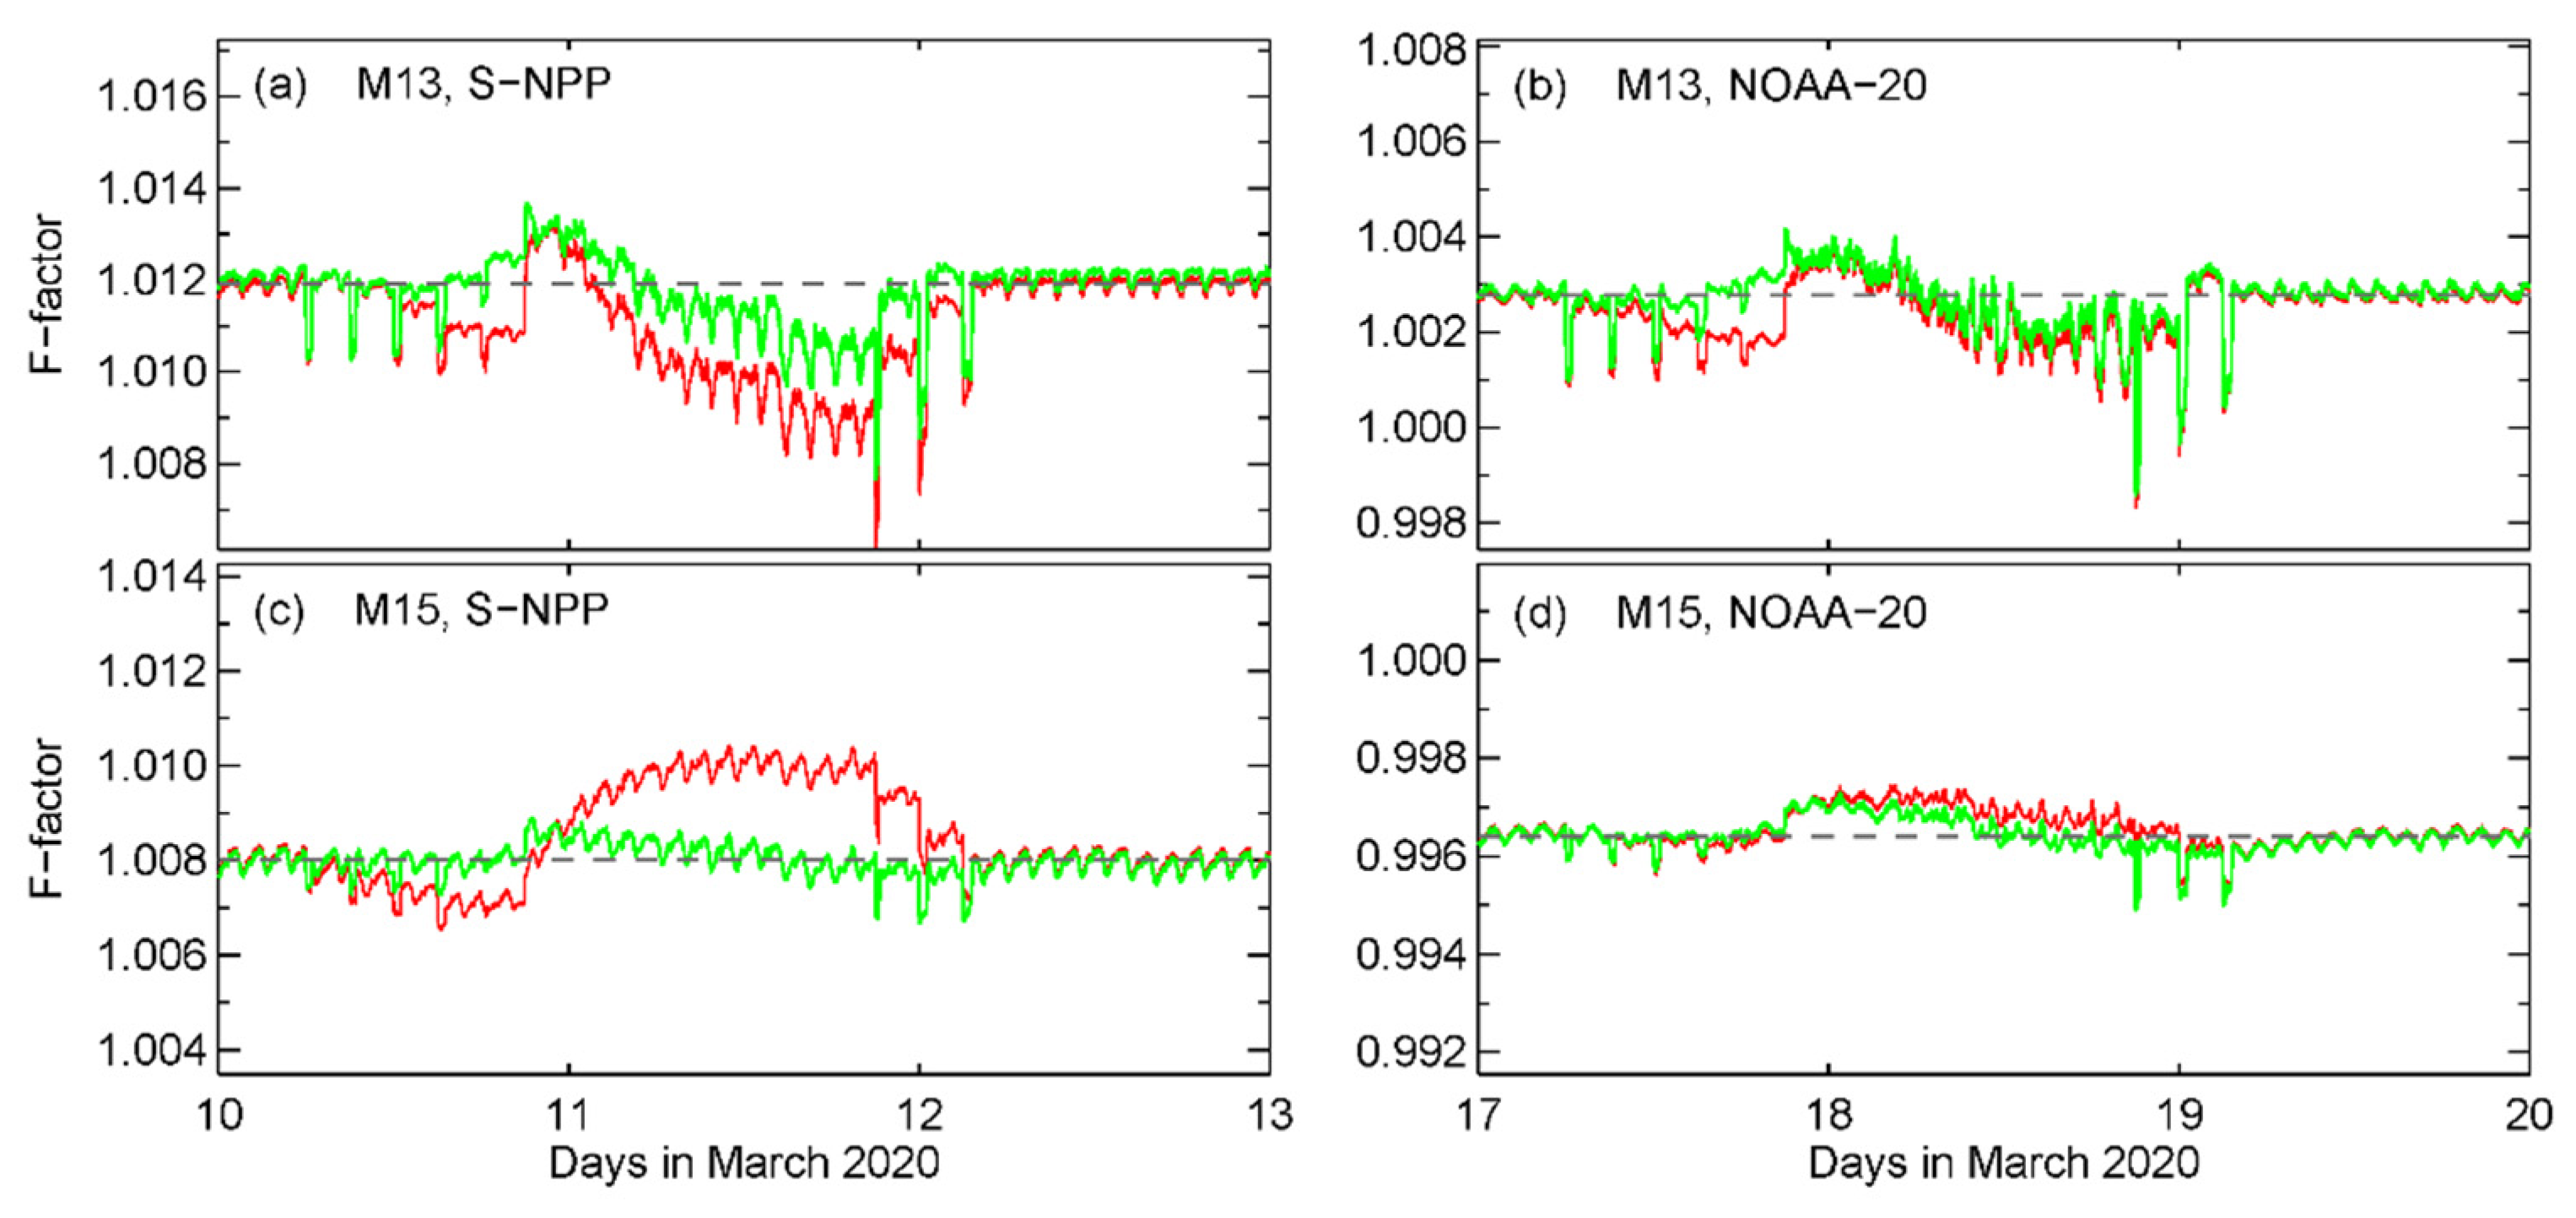
3.3.2. F-Factors during WUCD Events

NOAA-20 TEB F-factor anomalies during WUCD are generally smaller than those observed in S-NPP. NOAA-20 M14-M16 WUCD anomalies are about 30% of that in S-NPP; I4-I5 and M13 anomalies are comparable to S-NPP. F-factor anomaly analysis indicates that NOAA-20 M12 has little WUCD anomaly. Figure 6 compares NOAA-20 and S-NPP bands M13 and M15 F-factors (green color) during the March 2020 WUCD events, after the updated TEB calibration algorithms were applied in the operational processing. The F-factor time series without WUCD bias correction (red color) were also shown for comparison purposes. The estimated WUCD anomaly in the daytime SST product is on the order of 0.05 K for NOAA-20, much smaller than the 0.2 K anomaly observed in the S-NPP SST product. However, WUCD anomaly is still visible in the NOAA-20 daily averaged daytime SST–in situ time series (Dr. Alexander Ignatov, NOAA Center for Satellite Applications and Research (STAR) SST team, personal communication, June 2018) and needs to be corrected. Our analysis results indicate that the bias correction methods developed for S-NPP are also effective for NOAA-20.
The implementation of the WUCD bias correction effectively reduces the F-factor anomalies for both NOAA-20 and S-NPP. For M15, the daily averaged F-factor anomalies were reduced from 0.18% to 0.02% for S-NPP (see Figure 6c) and from 0.05% to 0.02% for NOAA-20 (see Figure 6d) during the cool-down phase. For M13, the F-factor anomalies were reduced from −0.17% to −0.05% for S-NPP (see Figure 6a) and from −0.12% to −0.03% for NOAA-20 (see Figure 6b). F-factor anomalies for other TEBs were also effectively mitigated.

3.4. On-Orbit Characterization of TEB Calibration Coefficients Using WUCD Data

Data from WUCD provide a source of calibration radiance over the range from about 267 K to 315 K, independent of the prelaunch calibration source. Band, HAM-side and detector-specific 2nd order polynomial calibration coefficients can be derived using Equation (7) [9]. WUCD derived C-coefficients can not only be used for characterizing VIIRS TEB on-orbit calibration offset and nonlinearity changes over time, they may also be used in the operational processing to mitigate TEB WUCD biases.
Figure 7 shows band-averaged WUCD-derived C-coefficients for NOAA-20 and S-NPP LWIR bands. Band-averaged prelaunch C-coefficients were also plotted for comparison purpose. Compared to S-NPP, the NOAA-20 WUCD-derived calibration offsets and non-linearity coefficients are generally more consistent with prelaunch values. Note that the C-coefficients derived using the NOAA-20 22–24 January 2018 WUCD data may be affected by LWIR degradation. In addition, slow degradation was observed in I5 after the MMOG (see Figure 5), which contributes to the larger WUCD-derived linear calibration coefficients compared to prelaunch values.
Band-averaged WUCD-derived C-coefficients for the MWIR bands (I4 and M12-M13) are compared in Figure 8. NOAA-20 WUCD derived C-coefficients are stable over time, co-incident with the fact that little responsivity change was observed in MWIR bands (see Figure 5). For S-NPP MWIR bands, the WUCD derived zero offsets and nonlinear coefficients are stable over time, while linear coefficients show small upward trends, consistent with the gradual degradations shown in the F-factors time series (see Figure 5).

4. Evaluation of NOAA-20 and S-NPP VIIRS TEB Sensor Data Records (SDR) Performances

4.1. VIIRS-CrIS (Cross-Track Infrared Sounder) Inter-Comparison

Errors exist in the prelaunch characterized calibration parameters and during on-orbit calibration, and these errors propagate to the SDR products. The on-orbit calibration performance of NOAA-20 and S-NPP VIIRS TEB SDRs were first evaluated using independent co-located CrIS observations. The methodology for VIIRS-CrIS inter-comparison can be found in [9]. For the long-term calibration stability monitoring and WUCD bias characterization, only nadir observations (CrIS FOV 15-16) were used. In this section, CrIS normal spectral resolution and full spectral resolution SDRs were used before and after 24 June 2020, respectively. The CrIS normal spectral resolution SDR was decommissioned in the NOAA operational processing on this date. Only M13 VIIRS–CrIS BT bias time series were affected by this event.

4.1.1. TEB SDR Long-Term Stability

Figure 9 shows NOAA-20 and S-NPP daily averaged VIIRS–CrIS BT difference time series for bands I5, M13, and M15-M16 from 6 January 2018 to 31 December 2020. Major VIIRS and CrIS on-orbit calibration events were also labeled. After the 12 March 2018 MMOG, NOAA-20 VIIRS–CrIS BT differences (see Figure 9a) have been generally stable during nominal operations. Bands I5, M13, M15-M16 show good agreements with CrIS at nadir, with daily averaged biases within 0.1 K and uncertainties (standard deviations) ~0.1 K. Note that the NOAA-20 VIIRS LWIR degradation was accounted for by the on-orbit calibration, therefore, it has little impact on the TEB SDRs. For NOAA-20, the small VIIRS-CrIS bias variations before the MMOG are mainly due to VIIRS or CrIS calibration updates and activities for supporting the LWIR degradation investigation, such as VIIRS C-coefficients LUT update, safe mode [12], elevated OBCBB temperatures, and CrIS calibration update. For S-NPP (see Figure 9b), VIIRS M13, M15-M16 and I5 also agree with CrIS at nadir, with daily averaged biases within 0.1 K and uncertainties ~0.1 K. Evaluation results for S-NPP are generally consistent with those reported in previous studies, which show that S-NPP VIIRS TEBs agree with the Aqua Moderate Resolution Imaging Spectroradiometer (MODIS) and the Advanced Very High Resolution Radiometer (AVHRR) over simultaneous over passes within 0.2 K and uncertainty ~0.3 K [1,2]. VIIRS and CrIS are onboard the same satellites. Therefore, there are abundant of co-located VIIRS–CrIS observations available, which may contribute to the smaller uncertainty in the VIIRS–CrIS inter-comparison results, compared to the results of VIIRS–MODIS or VIIRS–AVHRR inter-comparisons.
VIIRS–CrIS BT biases for M13 is relative larger than the other three bands before 24 June 2020, mainly due to coarser spectral resolution of the CrIS normal spectra. It can be observed that the biases decrease by ~0.09 K after switching to the full spectra resolution CrIS SDRs since 24 June, for both NOAA-20 and S-NPP. S-NPP M13 bias shows relatively larger annual variations compared to that of NOAA-20. Note that the spectral resolution of CrIS LWIR spectra (covering VIIRS I5, andM15-M16) remain unchanged during this period. The implementation of CrIS polarization correction on 29 January 2020 slightly changed the NOAA-20 and S-NPP VIIRS–CrIS bias for M13, M15-M16, and I5. NOAA-20 and S-NPP TEB calibration biases during WUCD events before the implementation of the operational WUCD correction (see Section 2.2) are clearly shown in the time series prior to March 2020.

4.1.2. Verification of the Operational WUCD Bias Correction

The operational WUCD bias correction was implemented on 25 July 2019 in the NOAA operational processing. We also verified the performance of the operational WUCD bias correction using on-orbit observations. Figure 10 shows the VIIRS–CrIS BT bias time series during 17–19 March 2020 (for NOAA-20, see Figure 10a) and 10–12 March 2020 (for S-NPP, see Figure 10b), the first WUCD events with operational WUCD bias correction applied. Similar to Figure 2, averaged VIIRS–CrIS BT biases during nominal operations were used as the references and subtracted from the time series. It can be observed that the WUCD bias correction works as expected for S-NPP, with residual daily averaged biases ~0.01 K for all bands and uncertainties (standard deviations) ~0.02 K (for M13 and M15-M16) and 0.03 K for I5. The results for the on-orbit observations are generally consistent with the results reported by our previous study using reprocessed data [9].
The updated TEB calibration algorithm during WUCD also works well for NOAA-20 (see Figure 10a), with residual daily averaged WUCD biases also about 0.01 K and uncertainties of 0.02 K (for M15-M15 and I5) and ~0.05 K (for M13). Moreover, the NOAA-20 residual biases during the warm-up phase are smaller than that of S-NPP. NOAA-20 M13 and S-NPP I5 show larger orbital variations compared to other bands, which contribute to the larger uncertainties in the daily average biases estimated. Our analysis indicates that these residual biases would not have significant impacts on the daytime daily SST–in situ time series. We will closely monitor the residual WUCD biases in the NOAA operational processing and adjust the bias correction method and/or coefficients used if it is necessary.

4.1.3. NOAA-20 VIIRS TEB Scan Angle and Scene Temperature Dependent Biases

VIIRS-CrIS inter-comparison results indicate that larger than expected scan angle and scene temperature dependent biases (relative to CrIS) were observed in the NOAA-20 VIIRS LWIR bands since the beginning of the mission, different from S-NPP VIIRS [13,14,15]. More significant scan angle and scene temperature-dependent biases were observed at the beginning of scan. Wang et al. [13] indicates that the NOAA-20 scan angle and scene temperature dependent biases are mainly caused by errors in the prelaunch RVS and zero offsets ( c 0 ) used in the NOAA operational processing. Moreover, the biases can be significantly reduced by applying the on-orbit pitch maneuver data-derived RVS. The NOAA-20 scan angle and scene temperature dependent biases will be corrected in the operational processing in the future, after further analysis.

4.2. Inter-Comparison of NOAA-20 and S-NPP VIIRS TEBs over the Dome-C Site

NOAA-20 and S-NPP inter-satellite biases for TEBs were also assessed over the Antarctica Dome-C validation site, especially for bands that are not covered by the CrIS spectra. Figure 11 compares NOAA-20 and S-NPP BT time series for M12 and M14. Observations with sensor view zenith angle less than 35° were used. BT biases due to NOAA-20 and S-NPP RSR differences were corrected. It was observed that NOAA-20 M12 is ~2 K warmer than S-NPP at 205 K scene temperatures, while no significant bias was observed at warmer scene temperatures (see Figure 11a). The inter-satellite biases for M12 may be caused by the scene temperature-dependent bias in NOAA-20 M12 [13]. This inconsistency will be further studied in the future. On the other hand, NOAA-20 M14 BTs match well with its S-NPP counterpart at all scene temperatures at near nadir locations (see Figure 11b). Moreover, no obvious inter-satellite bias was observed in other TEBs over this site, similar to that of M14.

5. Conclusions

This paper presents a recent VIIRS TEB on-orbit calibration algorithm update and inter-compares NOAA-20 and S-NPP on-orbit long-term instrument and SDR performances. Four WUCD bias correction methods were developed and implemented in the NOAA operational processing to mitigate TEB calibration biases during WUCD events: (1) the Nominal-F method, (2) the WUCD-C method, (3) the Ltrace method, and (4) the Ltrace-2 method. Inter-comparison results of NOAA-20 and S-NPP VIIRS long-term instrument performances show that both VIIRS have been performing generally well. During nominal operations, OBCBB temperatures have been stable and uniformity is better than the requirement. NOAA-20 exhibits relatively larger OBCBB temperature drift (~10 mK after 3 years on orbit) than that of S-NPP (~5 mK after 9 years on orbit). NOAA-20 longwave heater power margin is lower than that of S-NPP. NOAA-20 VIIRS instrument temperatures are generally stable over time, although lower than S-NPP. The NOAA-20 March 2018 MMOG was very successful and LWIR responsivity returned to the levels similar to the beginning of the mission. Slow degradations were observed in I5 and M16 after the MMOG, but similar to S-NPP. NOAA-20 MWIR bands F-factors have been stable since the beginning of the mission; S-NPP MWIR bands show small degradations over time. Before the implementation of WUCD bias correction, NOAA-20 TEB F-factor anomalies during WUCD are smaller than that of S-NPP. Nevertheless, the magnitudes of F-factor anomaly for the two VIIRS become similar after the operational WUCD bias correction was applied on 25 July 2019.
NOAA-20 and S-NPP VIIRS TEB SDR performances were also evaluated in this study. VIIRS–CrIS inter-comparison results show that VIIRS bands I5, M13, and M15-M16 agree with CrIS ~0.1 K during nominal operations and at nadir locations, comparable to S-NPP. After the implementation of operational WUCD bias correction, daily averaged residual WUCD biases are ~0.01 K for both NOAA-20 and S-NPP. VIIRS BT time series over the Dome-C site were analyzed to evaluate inter-satellite biases between NOAA-20 and S-NPP. Results show that NOAA-20 M12 is ~2 K warmer than S-NPP at cold scene temperatures, while no significant inter-satellite bias was observed in other TEBs. The inconsistency in M12 needs to be further studied.

Author Contributions

Conceptualization, W.W.; methodology, W.W. and C.C.; software, W.W.; validation, W.W.; formal analysis, W.W.; investigation, W.W.; resources, C.C. and W.W.; data curation, W.W.; writing—original draft preparation, W.W.; writing—review and editing, W.W. and C.C.; visualization, W.W.; supervision, C.C.; project administration, W.W.; funding acquisition, W.W. All authors have read and agreed to the published version of the manuscript.

Funding

This study was supported by NOAA grant NA19NES4320002 (Cooperative Institute for Satellite Earth System Studies—CISESS) at the University of Maryland/ESSIC.

Institutional Review Board Statement

Not applicable.

Informed Consent Statement

Not applicable.

Data Availability Statement

The NOAA operational VIIRS and CrIS products for NOAA-20 and S-NPP are openly available from the Comprehensive Large Array-data Stewardship System (CLASS, www.class.noaa.gov). The reprocessed VIIRS SDRs are available on request from the corresponding author.

Conflicts of Interest

The authors declare no conflict of interest. The funders had no role in the design of the study; in the collection, analyses, or interpretation of data; in the writing of the manuscript, or in the decision to publish the results.

Disclaimer

The scientific results and conclusions, as well as any views or opinions expressed herein, are those of the author(s) and do not necessarily reflect those of NOAA or the Department of Commerce.

References

  1. Cao, C.; Xiong, J.; Blonski, S.; Liu, Q.; Uprety, S.; Shao, X.; Bai, Y.; Weng, F. Suomi NPP VIIRS sensor data record verification, validation, and long-term performance monitoring. J. Geophys. Res. Atmos. 2013, 118, 11664–11678. [Google Scholar] [CrossRef]
  2. Cao, C.; De Luccia, F.J.; Xiong, X.; Wolfe, R.; Weng, F. Early on-orbit performance of the Visible Infrared Imaging Radiometer Suite onboard the Suomi National Polar-Orbiting Partnership (S-NPP) satellite. IEEE Trans. Geosci. Remote Sens. 2014, 52, 1142–1156. [Google Scholar] [CrossRef] [Green Version]
  3. Cao, C.; Blonski, S.; Wang, W.; Uprety, S.; Shao, X.; Choi, J.; Lynch, E.; Kalluri, S. NOAA-20 VIIRS on-orbit performance, data quality, and operational Cal/Val support. In Proceedings of the SPIE Asia-Pacific Remote Sensing, Honolulu, HI, USA, 24–26 September 2018; Volume 107810K. [Google Scholar]
  4. Efremova, B.; McIntire, J.; Moyer, D.; Wu, A.; Xiong, X. S-NPP VIIRS thermal emissive bands on-orbit calibration and performance. J. Geophys. Res. Atmos. 2014, 119, 10859–10875. [Google Scholar] [CrossRef] [Green Version]
  5. Li, Y.; Xiong, X.; McIntire, J.; Angal, A.; Gusev, S.; Chiang, K. Early Calibration and Performance Assessments of NOAA-20 VIIRS Thermal Emissive Bands. IEEE Trans. Geosci. Remote Sens. 2019, 57, 9242–9251. [Google Scholar] [CrossRef]
  6. VIIRS Radiometric Calibration ATBD. Joint Polar Satellite System (JPSS) VIIRS Radiometric Calibration Algorithm Theoretical Basis Document (ATBD). NOAA/NESDIS/STAR: 2017. Available online: https://www.star.nesdis.noaa.gov/JPSS/documents/ATBD/D0001-M01-S01-003_JPSS_ATBD_VIIRS-SDR_D.pdf (accessed on 23 December 2020).
  7. Cao, C.; Wang, W.; Blonski, S.; Zhang, B. Radiometric traceability diagnosis and bias correction for the Suomi NPP VIIRS long-wave infrared channels during blackbody unsteady states. J. Geophys. Res. Atmos. 2017, 122, 5286–5297. [Google Scholar] [CrossRef]
  8. Datla, R.; Shao, X.; Cao, C.; Wu, X. Comparison of the Calibration Algorithms and SI Traceability of MODIS, VIIRS, GOES, and GOES-R ABI Sensors. Remote Sens. 2016, 8, 126. [Google Scholar] [CrossRef] [Green Version]
  9. Wang, W.; Cao, C.; Ignatov, A.; Liang, X.; Li, Z.; Wang, L.; Zhang, B.; Blonski, S.; Li, J. Improving the Calibration of Suomi NPP VIIRS Thermal Emissive Bands during Blackbody Warm-Up/Cool-Down. IEEE Trans. Geosci. Remote Sens. 2019, 57, 1977–1994. [Google Scholar] [CrossRef]
  10. Xiong, X.; Cao, C.; Lei, N.; Chiang, K.; Angal, A.; Li, Y.; Blonski, S.; Wang, W.; Choi, T. Early Results from NOAA-20 (JPSS-1) VIIRS On-Orbit Calibration and Characterization. In Proceedings of the 2018 IEEE International Geoscience and Remote Sensing Symposium, Valencia, Spain, 22–27 July 2018. [Google Scholar] [CrossRef] [Green Version]
  11. Xiong, X.; Angal, A.; Butler, J.; Chen, H.; Chiang, K.; Lei, N.; Li, Y.; Twedt, K. Performance assessments and comparisons of S-NPP and NOAA-20 (JPSS-1) VIIRS on-orbit calibration. In Proceedings of the SPIE 10785, the Sensors, Systems, and Next-Generation Satellites XXII, 10785514, Berlin, Germany, 11 October 2018; Volume 10785. [Google Scholar] [CrossRef]
  12. Jennings, T. Joint Polar Satellite System (JPSS) Common Data Format Control Book–External Volume VII—Part I JPSS Downlink Data Formats. JPSS Ground Project. 2011. Available online: https://www.star.nesdis.noaa.gov/jpss/documents/CDFCB/GSFC_474-00001-07-01_CDFCB_External_Vol.7-1_JPSS_Downlink_Data_Formats__D34862-07-01_.pdf (accessed on 23 December 2020).
  13. Wang, W.; Cao, C.; Blonski, S. A New Method for Characterizing NOAA-20/S-NPP VIIRS Thermal Emissive Bands Response Versus Scan Using On-Orbit Pitch Maneuver Data. Remote Sens. 2019, 11, 1624. [Google Scholar] [CrossRef] [Green Version]
  14. Wang, L.; Chen, Y. Inter-Comparing SNPP and NOAA-20 CrIS Toward Measurement Consistency and Climate Data Records. IEEE J. Sel. Top. Appl. Earth Obs. Remote Sens. 2019, 12, 2024–2031. [Google Scholar] [CrossRef]
  15. Moyer, D.; Moeller, C.; Luccia, F.D. NOAA-20 VIIRS thermal emissive band calibration error comparison with heritage VIIRS sensors. In Proceedings of the SPIE 10785, the Sensors, Systems, and Next-Generation Satellites XXII, 10785U, Berlin, Germany, 25 September 2018; Volume 10785. [Google Scholar] [CrossRef]
Figure 1. Flowchart of the VIIRS operational warm-up/cool-down (WUCD) bias correction in the NOAA operational processing. TEB calibration precedures that are not changed are omitted.
Remotesensing 13 00448 g001
Figure 2. S-NPP VIIRS TEB WUCD biases for M15 (a) and M13 (b): no correction (NOAA operational or OPR, red color), after the Nominal-F correction (yellow), the Ltrace correction (green), the Ltrace-2 correction (blue), and the WUCD-C correction (magenta). VIIRS operational and reprocessed sensor data records (SDRs) during the 19–21 September 2006 WUCD events were used.
Remotesensing 13 00448 g002
Figure 3. Time series of granual averaged on-board calibrator blackbody (OBCBB) temperature anomalies (a) (TbbTbb_avg) and uniformity (b) during nominal operations since the beginning of the NOAA-20 and S-NPP missions. Two nighttime granules from each orbit, used for VIIRS reflective solar bands (RSB) solar calibration, were used for long-term trending.
Remotesensing 13 00448 g003
Figure 4. Time series of NOAA-20 (blue) and S-NPP (black) VIIRS instrument temperatures: (a) electronics (Telec), (b) OMM (Tomm), (c) half-angle mirror (HAM) (Tham), (d) rotating telescope assembly (RTA) (Trta), (e) cavity (Tcav), (f) OBCBB shield (Tsh), (g) LWIR cold focal plane assemblies (FPA) (Tlwcfpa), and (h) S/MWIR cold FPA (Tsmcfpa), as well as (i) longwave heater power (lwHtrPwr).
Remotesensing 13 00448 g004
Figure 5. Time series of normalized band-averaged TEB gains (1/F-factors) during nominal operations for S-NPP (a) and NOAA-20 (b). Each data point represents an orbital averaged value, using sweet-spot granules. The vertical dash lines mark 1000 days since launch.
Remotesensing 13 00448 g005
Figure 6. F-factor time series during the March 2020 WUCD events: (a) S-NPP M13, (b) NOAA-20 M13, (c) S-NPP M15, and (d) NOAA-20 M15. F-factors without WUCD bias correction are shown in red color, and F-factors with WUCD bias correction (applied in the operational processing) are shown in green color.
Remotesensing 13 00448 g006
Figure 7. Comparison of WUCD derived LWIR band-averaged C-coefficients ( c 0 , c 1 and c 2 ) for NOAA-20 (red) and S-NPP (blue): (ac) I5, (df) M14, (gi) M15, (jl) M16. Prelaunch C-coefficients are shown in dash lines (NOAA-20: orange color; S-NPP: cyan color).
Remotesensing 13 00448 g007
Figure 8. Comparison of WUCD derived MWIR band-averaged C-coefficients ( c 0 , c 1 and c 2 ) for NOAA-20 (red) and S-NPP (blue): (ac) I4, (df) M12, and (gi) M13. Prelaunch C-coefficients are also shown in dash lines (NOAA-20: orange color; S-NPP: cyan color).
Remotesensing 13 00448 g008
Figure 9. NOAA-20 (a) and S-NPP (b) daily averaged VIIRS–CrIS BT difference time series. Major on-orbit events were labeled.
Remotesensing 13 00448 g009
Figure 10. NOAA-20 (a) and S-NPP (b) M13, M15-M16, and I5 VIIRS–CrIS BT difference time series during the March 2020 WUCD events, after the implementation of the operational TEB WUCD bias correction. OBCBB temperatures (Tbb) were plotted in the background (gray color).
Remotesensing 13 00448 g010
Figure 11. Comparison of NOAA-20 (red) and S-NPP (blue) bands M12 (a) and M14 (b) BTs over the Dome-C site.
Remotesensing 13 00448 g011
Table 1. Spectral, spatial, and radiometric characteristics of National Oceanic and Atmospheric Administration-20 (NOAA-20, N20) and Suomi National Polar-orbiting Partnership (S-NPP, NPP) Visible Infrared Imaging Radiometer Suite (VIIRS) mid-wave infrared (MWIR) and longwave infrared (LWIR) bands. I4-I5, M12, M14-M16 are single gain (S) bands. M13 is a dual gain band (H: high gain; L: low gain). Ttyp stands for typical scene temperature; NEdT stands for noise equivalent differential temperature; NEdT Spec stands for NEdT specification at Ttyp.
Spatial Resolution
at Nadir (m)
Center Wavelength (µm)GainTtyp
(K)
Tmin
(K)
Tmax
(K)
NEdT Spec (K)On-Orbit NEdT
NPPN20NPPN20
MWIRM127503.6973.700S2702303530.3960.120.12
I43753.7533.753S2702303532.50.400.42
M137504.0674.070H
L
300 (HG)
380 (LG)
210
343
343
634
0.107
0.423
0.04
-
0.04
-
LWIRM147508.5788.583S2701903360.0910.060.05
M1575010.72910.703S3001903430.070.030.02
I537511.46911.450S2101903401.50.400.42
M1675011.84511.869S3001903400.0720.030.03
Table 2. WUCD bias correction method applied for individual NOAA-20 and S-NPP TEB bands in the NOAA operational processing since 25 July 2019. The Nominal-F and the WUCD-C methods are reserved for future usage.
VIIRS TEBNOAA-20S-NPP
LtraceLtrace-2LtraceLtrace-2
M12 XX
M13 X X
I4 X X
M14X X
M15X X
M16X X
I5X X
Publisher’s Note: MDPI stays neutral with regard to jurisdictional claims in published maps and institutional affiliations.

