
Proportional Trends of Continuous Rainfall in Indian Summer Monsoon


Abstract
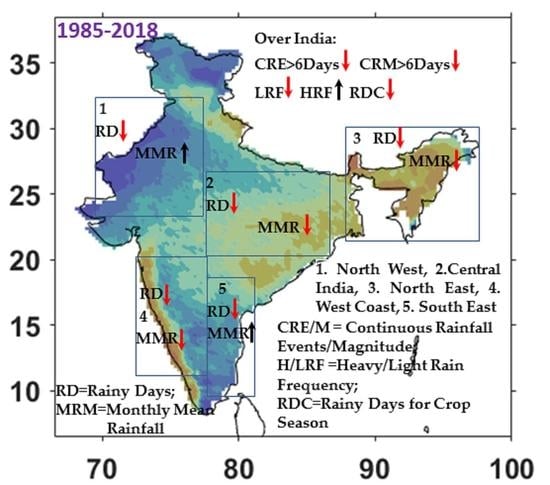
:
1. Introduction
2. Dataset and Methods
2.1. Datasets
2.2. Study Region
2.3. Methodology
3. Results
3.1. Trends in Number of Rainy Days and Rainfall
3.2. Frequency of Continuous Rain Events and Their Magnitude
3.3. Variability of Light and Heavy Rainfall
3.4. Spatial Variability of Rainfall Frequency and Fraction for Continuous Rainfall Days
3.5. Decadal Analysis of Continuous Rainfall Days
4. Hydrological and Agricultural Aspects of Surface Rainfall
5. Conclusions and Discussions
- The 1-day rainfall frequency and variability dominate over drought-prone regions such as North West (NW) and South East (SE) parts of India.
- There is a decrease in the number of rainfall days (Table 1) over central India (CI) and the Western Coast (WC) during recent years (1985–2018, L-period). However, the southern region of WC (Southern Karnataka, the boundary of Kerala and Tamil Nadu) shows a decrease in rainy days in recent years, which is an abnormality in the rainfall over the Western Ghats range.
- In July and September, the number of rainfall days and monthly mean rainfall show a decreasing and increasing trend respectively during the L-period over all climatic regions of India. There are few exceptions in monthly rainfall such as an increase in trend over NW in July and a decrease in trend over CI in September.
- The number of rainfall days and monthly mean rainfall decreased over NE in L-period for the summer season. Further, the number of rainfall days decreased in all the months over NE. The monthly mean rainfall shows a decreasing trend in June and July while increasing in August (at 95% significant) and September. On a regional scale, the number of rainfall days are decreased by ~0.1 days/yr and ~0.3 days/yr over CI and NE, respectively, in L-period as compared to E-period.
- The continuous rain events escalated from 1 to 4DAY, while de-escalated for higher number of days (≥6DAY) during L-period as compared to E-period. The de-escalation of rainfall events for higher continuous days show that continuous rainfall shower for a fewer number of rainfall days in L-period than E-period. The magnitude of ≥6DAY continuous rainfall decreased by 10 mm in L-period.
- The trends of light rainfall frequency (LRF) in two periods (E and L) are almost the same, except for the opposite sign, while light rainfall frequency shows a drastic decrease in recent decades, which may have implications associated with ground discharge and agriculture.
- The rainfall for continuous day 11 is most dominant over the regions of maximum rainfall, e.g., WC, NE, and a region of low-pressure-systems. The spatial pattern of rainfall frequency for 1DAY rainfall is almost opposite to the 11DAY over most parts of India. Rainfall fraction for continuous 11DAY is similar to climatological rainfall, where WC, CI, and NE regions receive more rainfall than other regions of India in the summer monsoon season.
- In the 10 years from 2009–2018, ~60% of rainfall is contributed from 2DAY to 6DAY of continuous rainfall, which is 20% more than the rainfall contributed during 1951–1960 from the same number of continuous rainfall days. The rainfall contributed from a large number of continuous rainfall days (>8DAY) decreased in recent years. For 1–5 continuous rainy days, the rainfall amount is increased by 0.9% from 1951–1972 to 1995–2016, while the rainfall is decreased by 0.05% for 6–10 continuous rainfall days.
- The rainfall is shifted towards a lesser number of continuous rainfall days with higher magnitudes. A continuous rainfall of >5DAY decreased in the recent years.
- The rainfall trend from 1951 to 2018 displays a declining trend for the first 45 days (1 June to 15 July) from the onset of monsoon. The total number of rainy days in rice crops season (i.e., first 45 days, crop season, from the onset of monsoon) is decreased by half days during L-period than E-period over India.
- On a daily scale, the rainfall and soil moisture correlation varies from 0.50 to 0.87, while rainfall and evaporation correlate at the range of −0.46 to 0.87 over selected parts of Indian regions. Continuous light/moderate rainfall seems to be a controlling factor for replenishing the soil moisture in upper layer.
Supplementary Materials
Author Contributions
Funding
Institutional Review Board Statement
Informed Consent Statement
Acknowledgments
Conflicts of Interest
References
- Gadgil, S.; Gadgil, S. The Indian Monsoon, GDP and Agriculture. Econ. Political Wkly. 2006, 41, 4887–4995. [Google Scholar]
- Dhar, O.N.; Nandargi, S. Hydrometeorological aspects of floods in India. Nat. Hazards 2003, 28, 1–33. [Google Scholar] [CrossRef]
- Kumar, V.; Jana, S.; Bhardwaj, A.; Deepa, R.; Sahu, S.K.; Pradhan, P.K.; Sirdas, S.A. Greenhouse gas emission, rainfall and crop production over North-Western India. Open Ecol. J. 2018, 11, 47–61. [Google Scholar] [CrossRef]
- Mahajan, G.; Kumar, V.; Chauhan, B.S. Rice Production in India. In Rice Production Worldwide; Chauhan, B., Jabran, K., Mahajan, G., Eds.; Springer: Cham, Switzerland, 2017. [Google Scholar] [CrossRef]
- RoyBhowmik, S.K.; Durai, V.R. Application of multi-model ensemble techniques for real time district-level rainfall forecasts in short range time scale over Indian region. Metorol. Atmos. Phy. 2010, 106, 19–35. [Google Scholar] [CrossRef]
- Wang, B.; Xiang, B.; Li, J.; Webster, P.J.; Rajeevan, M.N.; Liu, J.; Ha, K.-J. Rethinking Indian monsoon rainfall prediction in the context of recent global warming. Nat. Commun. 2015, 6, 7154. [Google Scholar] [CrossRef]
- Parthasarathy, B.; Munot, A.A.; Kothawale, D.R. Monthly Monthly and Seasonal Rainfall Series for All India, Homogeneous Regions and Meteorological Subdivisions: 1871–1994; Research Report No. RR-065; Indian Institute of Tropical Meteorology: Pune, India, 1995. [Google Scholar]
- Rajeevan, M. Prediction of Indian summer monsoon: Status, Problems and prospects. Curr. Sci. 2001, 81, 101–107. [Google Scholar]
- Ramamurthy, K. Monsoon of India: Some aspects of the ‘break’ in the Indian southwest monsoon during July and August. Forecast. Man. 1969, 1, 1–57. [Google Scholar]
- Goswami, B.N.; Venugopal, V.; Sengupta, V.D.; Madhusoodanan, M.S.; Xavier, P.K. Increasing trend of extreme rain events over India in a warming environment. Science 2006, 314, 1442. [Google Scholar] [CrossRef] [Green Version]
- Roxy, M.K.; Ritika, K.; Terray, P.; Murutugudde, R.; Ashok, K.; Goswami, B.N. Drying of Indian subcontinent by rapid Indian Ocean warming and a weakening land-sea thermal gradient. Nat. Commun. 2015, 6, 7423. [Google Scholar] [CrossRef] [Green Version]
- Krishnamurti, T.N.; Kumar, V.; Simon, A.; Thomas, A.; Bhardwaj, A.; Das, S. March of buoyancy elements during extreme rainfall over India. Clim. Dyn. 2016, 48, 1931–1951. [Google Scholar] [CrossRef]
- Sunilkumar, K.; Kumar, V.; Martins, S.V.; Pandithurai, G. Performance of precipitation climate indices over Monsoon Asia (MA) and remotely associated teleconnections using APHRODITE. Remote Sens. 2020. (under review). [Google Scholar]
- Goswami, B.N.; Xavier, P.K. Dynamics of ‘‘internal’’ interannual variability of the Indian summer monsoonin a GCM. J. Geophys. Res. 2005, 110, D24104. [Google Scholar] [CrossRef] [Green Version]
- Dash, S.K.; Kulkarni, M.A.; Mohanty, U.C.; Prasad, K. Changes in the characteristics of rain events in India. J. Geophys. Res. 2009, 114. [Google Scholar] [CrossRef]
- Krishnakumar, K.; Kamala, K.; Balaji, R.; Hoerling, M.P.; Eischeid, J.K.; Patwardhan, S.K.; Srinivasan, G.; Goswami, B.N.; Nemani, R. The once and future pulse of Indian monsoonal climate. Clim. Dyn. 2011, 36, 2159–2170. [Google Scholar]
- Roxy, M.K.; Ghosh, S.; Pathak, A.; Athulya, R.; Mujumdar, M.; Murtugudde, R.; Terray, P.; Rajeevan, M. A threefold rise in widespread extreme rain events over central India. Nat. Commun. 2017, 8, 708. [Google Scholar] [CrossRef] [PubMed]
- Duhan, D.; Pandey, A. Statistical analysis of long term spatial and temporal trends of precipitation during 1901–2002 at Madhya Pradesh. Atmos. Res. 2013, 122, 136–149. [Google Scholar] [CrossRef]
- Nandargi, S.; Mulye, S.S. Relationships between rainy days, mean daily intensity, and seasonal rainfall over the Koyna catchment during 1961–2005. Sci. World. J. 2012, 2012, 894313. [Google Scholar] [CrossRef] [Green Version]
- Pai, D.S.; Sridhar, L.; Rajeevan, M.; Sreejith, O.P.; Satbhai, N.S.; Mukhopadhyay, B. Development of a new high spatial resolution (0.25°×0.25°) long period (1901–2010) daily gridded rainfall data set over India and its comparison with existing data sets over the region. Mausam 2014, 65, 1–18. [Google Scholar]
- Mooley, D.A.; Parthasarathy, B. Fluctuations in All-India summer monsoon rainfall during 1871-1978. Clim. Chang. 1984, 6, 287–301. [Google Scholar] [CrossRef]
- Zhao, K.; Wulder, M.A.; Hu, T.; Bright, R.; Wu, Q.; Qin, H.; Li, Y.; Toman, E.; Mallick, B.; Zhang, X.; et al. Detecting change-point, trend, and seasonality in satellite time series data to track abrupt changes and nonlinear dynamics: A Bayesian ensemble algorithm. Remote Sens. Environ. 2019, 232, 111181. [Google Scholar] [CrossRef]
- Dee, D.P.; Uppala, S.M.; Simmons, A.J.; Berrisford, P.; Poli, P.; Kobayashi, S.; Andrae, U.; Balmaseda, M.A.; Balsamo, G.; Bauer, D.P.; et al. The ERA-Interim reanalysis: Configuration and performance of the data assimilation system. Q. J Royal Met. Soc. 2011, 137, 553–597. [Google Scholar] [CrossRef]
- Kummerow, C.; Barnes, W.; Kozu, T.; Shiue, J.; Simpson, J. The Tropical Rainfall Measuring Mission (TRMM) sensor package. J. Atmos Oceanic Technol. 1998, 15, 808–816. [Google Scholar] [CrossRef]
- Sunilkumar, K.; NarayanaRao, T.; Saikranthi, K.; Purnachandra Rao, M. Comprehensive evaluation of multisatellite precipitation estimates over India using gridded rainfall data. J. Geophys. Res. Atmos. 2015, 120, 8987–9005. [Google Scholar] [CrossRef] [Green Version]
- Sinha, T.; Cherkauer, K.A. Time series analysis of soil freeze-thaw processes in Indiana. J. Hydromet. 2008, 9, 936–950. [Google Scholar] [CrossRef] [Green Version]
- Sunilkumar, K.; NarayanaRao, T.; Satheeshkumar, S. Assessment of small-scale variability of rainfall and multi-satellite precipitation estimates using measurements from a dense rain gauge network in Southeast India. Hydrol. Earth Syst. Sci. 2016, 20, 1719–1735. [Google Scholar] [CrossRef] [Green Version]
- Yadav, S.K.; Gautam, S.; Rawat, S. Rainfall Variability Estimation for Western Rajasthan, India. Int. J. Curr. Microbiol. Appl. Sci. 2018, 7, 4344–4348. [Google Scholar] [CrossRef]
- Kumar, M.D.; Ghosh, S.; Patel, A.; Singh, O.P.; Ravindranath, R. Rainwater harvesting in India: Some critical issues for basin planning and research. Land Use Water Resour. Res. 2006, 6, 1–17. [Google Scholar]
- Guhathakurta, P.; Rajeevan, M. Trends in the rainfall pattern over India. NCC Res. 2006, 2, 1–23. [Google Scholar] [CrossRef]
- Parthasarathy, B.; Dhar, O.N. Secular variations of regional rainfall over India. Q. J. R. Meteorol. Soc. 1974, 100, 245–257. [Google Scholar] [CrossRef]
- Krishnakumar, K.; Rajagopalan, B.; Martin, H.; Gary, B.; Mark, C. Unraveling the mystery of Indian monsoon failure during El-Niño. Science 2006, 314, 115–119. [Google Scholar]
- Koteswaram, P.; Alvi, S.M.A. Trends and Periodicities in Rainfall at West Coast Stations in India. Curr. Sci. 1969, 38, 229–231. [Google Scholar]
- Alvi, S.M.A.; Koteswaram, P. Time series analysis of annual rainfall over India. Mausam 1985, 36, 479–490. [Google Scholar]
- Singh, P.; Haritashya, U.K.; Kumar, N.; Singh, Y. Hydrological characteristics of the Gangotri glacier, central Himalayas, India. J. Hydrol. 2005, 327, 55–67. [Google Scholar] [CrossRef]
- Schumacher, C.; Houze, R.A. Stratiform Rain in the Tropics as Seen by the TRMM Precipitation Radar. J. Clim. 2003, 16, 1739–1756. [Google Scholar] [CrossRef]
- Krishnamurti, T.N.; Martin, A.; Krishnamurti, R.; Simon, A.; Thomas, A.; Kumar, V. Impacts of enhanced CCN on the organization of convection and recent reduced counts of Monsoon Depressions. Clim. Dyn. 2013, 41, 117–134. [Google Scholar] [CrossRef]
- Pendergrass, G.A.; Knutti, R.; Lehner, F.; Deser, C.; Sanderson, B.M. Precipitation variability increases in a warmer climate. Sci. Rep. 2017, 7, 17966. [Google Scholar] [CrossRef] [Green Version]
- Coumou, D.; Rahmstorf, S. A decade of weather extremes. Nat. Clim. Chang. 2012, 2, 491–496. [Google Scholar] [CrossRef]
- Singh, D.; Ghosh, S.; Roxy, M.K.; McDermid, S. Indian summer monsoon: Extreme events, historical changes, and role of anthropogenic forcings. WIREs Clim. Chnag. 2019, 10, e571. [Google Scholar] [CrossRef]
- Deshpande, N.; Kothawale, D.R.; Kulkarni, A. Changes in climate extremes over major river basins of India. Int. J. Clim. 2016, 36, 4548–4559. [Google Scholar] [CrossRef]
- Krishnamurthy, C.K.B.; Lall, U.; Kwon, H.-H. Changing frequency and intensity of rainfall extremes over India from 1951 to 2003. J. Clim. 2009, 22, 4737–4746. [Google Scholar] [CrossRef] [Green Version]
- Ghosh, S.; Das, D.; Kao, S.-C.; Ganguly, A.R. Lack of uniform trends but increasing spatial variability in observed Indian rainfall extremes. Nat. Clim. Chang. 2012, 2, 86–91. [Google Scholar] [CrossRef]
- Mondal, A.; Mujumdar, P.P. Modeling non-stationarity in intensity, duration and frequency of extreme rainfall over India. J. Hydrol. 2015, 521, 217–231. [Google Scholar] [CrossRef]
- Kumar, V.; Krishnamurti, T.N. Mesoscale modeling for the rapid movement of monsoonal isochrones. Atmos. Sci. Lett. 2015, 17, 78–86. [Google Scholar] [CrossRef] [Green Version]
- Asada, H.; Matsumoto, J. Effects of rainfall variation on rice production in the Ganges-Brahmaputra Basin. Clim. Res. 2009, 38, 249–260. [Google Scholar] [CrossRef] [Green Version]
- Prasanna, V. Impact of monsoon rainfall on the total foodgrain yield over India. J. Earth Syst. Sci. 2014, 123, 1129–1145. [Google Scholar] [CrossRef]
- Jena, S. A Prediction on Rice Production in India through Multivariate Regression Analysis. J. Bus. Manag. Sci. 2015, 3, 26–31. [Google Scholar]
- Entekhabi, D.; Asrar, G.R.; Betts, A.K.; Beven, K.J.; Bras, R.L.; Duffy, C.J.; Dunne, T.; Koster, R.D.; Lettenmaier, D.P.; McLaughlin, D.B.; et al. An agenda for land surface hydrology research and a call for the second international hydrological decade. Bull. Am. Meteor. Soc. 1999, 80, 2043–2058. [Google Scholar] [CrossRef] [Green Version]
- Knapp, A.K.; Beier, C.; Briske, D.D.; Classen, A.T.; Luo, Y.; Reichstein, M.; Smith, M.D.; Smith, S.D.; Bell, J.E.; Fay, P.A.; et al. Consequences of more extreme precipitation regimes for terrestrial ecosystems. Bioscience 2008, 58, 811–821. [Google Scholar] [CrossRef]
- Kumar, V.; Jain, S.K.; Singh, Y. Analysis of long-term rainfall trends in India. Hydrol. Sci. J. 2010, 55, 484–496. [Google Scholar] [CrossRef]
- Ray, D.K.; Gerber, J.S.; MacDonald, G.K.; West, P.C. Climate variation explains a third of global crop yield variability. Nat. Commun. 2015, 6, 5989. [Google Scholar] [CrossRef] [Green Version]
- Auffhammer, M.; Ramanathan, V.; Vincent, J. Climate change, the monsoon, and rice yield in India. Clim. Chang. 2012, 111, 411–424. [Google Scholar] [CrossRef]


| Number of Rainy Days | |||||
|---|---|---|---|---|---|
| June | July | August | September | JJAS | |
| Northwest | ↑ | ↓ | ↓ | ↓ | ↓ |
| Central India | ↓ | ↓ | ↓ | ↓ | ↓ |
| Northeast | ↓ | ↓ | ↓ | ↓ | ↓ |
| West coast | ↑ | ↓ | ↓ | ↑ | ↓ * |
| Southeast | ↑ | ↓ | ↑ * | ↑ | ↓ |
| All India | ↑ | ↓ | ↓ | ↓ | ↓ |
| Monthly Mean | |||||
|---|---|---|---|---|---|
| June | July | August | September | JJAS | |
| Northwest | ↑ | ↑ | ↓ | ↑ | ↑ |
| Central India | ↑ | ↓ * | ↓ | ↓ | ↓ |
| Northeast | ↓ | ↓ | ↑ * | ↑ | ↓ |
| West coast | ↑ | ↓ | ↓ | ↑ | ↓ * |
| Southeast | ↑ | ↓ | ↑ | ↑ | ↑ |
| All India | ↓ | ↓ | ↓ | ↑ | ↓ |
| LCLU types and Regions | Soil Moisture | Evaporation | Runoff |
|---|---|---|---|
| Agricultural land–Punjab (75.15°E–76°E, 30.1°N–30.4°N) | 0.60 | 0.44 | −0.36 |
| Crop land–Utter Pradesh (78°E–79°E, 27°N–29.5°N) | 0.67 | 0.51 | −0.07 |
| Forest–Goa–Karnataka (74°E–75°E, 14°N–15°N) | 0.61 | 0.87 | 0.56 |
| Deciduous forest–Assam (92.9°E–93.4°E, 26°N–27°N) | 0.72 | 0.40 | 0.08 |
| Urban area–Lucknow (80.8°E–81.25°E, 26.65°N–27°N) | 0.50 | 0.66 | −0.48 |
| Scrub land–Rajasthan (70°E–70.75°E, 26.75°N–27.25°N) | 0.87 | −0.46 | −0.08 |
Publisher’s Note: MDPI stays neutral with regard to jurisdictional claims in published maps and institutional affiliations. |
© 2021 by the authors. Licensee MDPI, Basel, Switzerland. This article is an open access article distributed under the terms and conditions of the Creative Commons Attribution (CC BY) license (http://creativecommons.org/licenses/by/4.0/).
Share and Cite
Kumar, V.; Sunilkumar, K.; Sinha, T. Proportional Trends of Continuous Rainfall in Indian Summer Monsoon. Remote Sens. 2021, 13, 398. https://doi.org/10.3390/rs13030398
Kumar V, Sunilkumar K, Sinha T. Proportional Trends of Continuous Rainfall in Indian Summer Monsoon. Remote Sensing. 2021; 13(3):398. https://doi.org/10.3390/rs13030398
Chicago/Turabian StyleKumar, Vinay, K. Sunilkumar, and Tushar Sinha. 2021. "Proportional Trends of Continuous Rainfall in Indian Summer Monsoon" Remote Sensing 13, no. 3: 398. https://doi.org/10.3390/rs13030398