1. Introduction
After nearly half a century of development, Earth observation technology has played an increasingly important role in environmental monitoring, resource exploration, urban planning, forestry investigation, and other fields [
1,
2,
3,
4,
5,
6,
7]. As the core method of Earth observation, remote sensing has gradually developed into a comprehensive technical system that covers passive multispectral imaging, hyperspectral imaging, active and passive microwave remote sensing, LiDAR remote sensing, and other methods of information acquisition. Remote sensing can be performed for aviation and Earth observation on multiple platforms, such as aerospace and ground [
8,
9]. Realizing full-time, full-band, high-resolution Earth observation is important in the development of remote sensing technology because it can address many problems in environmental monitoring, urban construction, and military applications. In the process of Earth observation, the simultaneous acquisition and identification of spatial elevation and spectral information is a frontier scientific issue for the development of Earth observation technology in the future [
10,
11,
12].
Among the main remote sensing technology methods available at present, active LiDAR ranging can acquire the elevation information of ground objects, and passive hyperspectral imaging can obtain rich spectral information [
13,
14]. The two technical methods show unique advantages in the acquisition of ground target information, but neither can achieve the simultaneous acquisition of elevation and spectral information [
15,
16]. Moreover, the acquisition of the spectral information of ground objects is limited due to the principle of active single-wavelength LiDAR ranging. Passive hyperspectral imaging is greatly affected by light intensity and weather changes during the acquisition of ground object information, and its capability to acquire spatial elevation information is limited. To combine the technical advantages of active and passive detection, domestic and foreign researchers have conducted extensive work and have made many attempts [
17,
18,
19,
20], all of which have achieved good results. Relevant research has also fully verified that increasing the detection bands is crucial to improve the capability of LiDAR spectral information acquisition, especially in vegetation remote sensing monitoring, and thus shows great application potential [
21,
22,
23]. However, for the detection requirements of different ground targets and different growth states of the same plant, other characteristic wavelengths that characterize physical properties need to be added to achieve enhanced spectral detection effects. However, when the wavelength that characterizes the properties of the ground object is increased, the corresponding wavelength band of the supercontinuum laser and the detection channel of the hyperspectral LiDAR system also need to be increased, thereby increasing the complexity and cost of the hyperspectral LiDAR system. The next step of related research should be to incorporate the radar detection effect when conducting a comprehensive evaluation to determine when to increase the number of optimal detection bands and to identify the best characteristic wavelength.
Hyperspectral LiDAR technology for Earth observation was introduced to address these issues. Researchers agree that the spectral band of Earth observation LiDAR ranges from a single wavelength to multiple spectra, which is the development direction of hyperspectral imaging [
24,
25,
26,
27]. The capability to obtain elevation and spectral information can be improved by increasing the detection spectral band of hyperspectral LiDAR. Compared with the traditional passive hyperspectral imaging technology, the active hyperspectral imaging LiDAR can obtain spectral information and elevation information at the same time with one laser pulse, realizing the perfect matching of information. However, due to the energy limitation of supercontinuum lasers and technical bottlenecks, such as the simultaneous detection and acquisition of multi-channel weak echo signals, the development of hyperspectral imaging LiDAR has been limited to a certain extent [
28,
29].
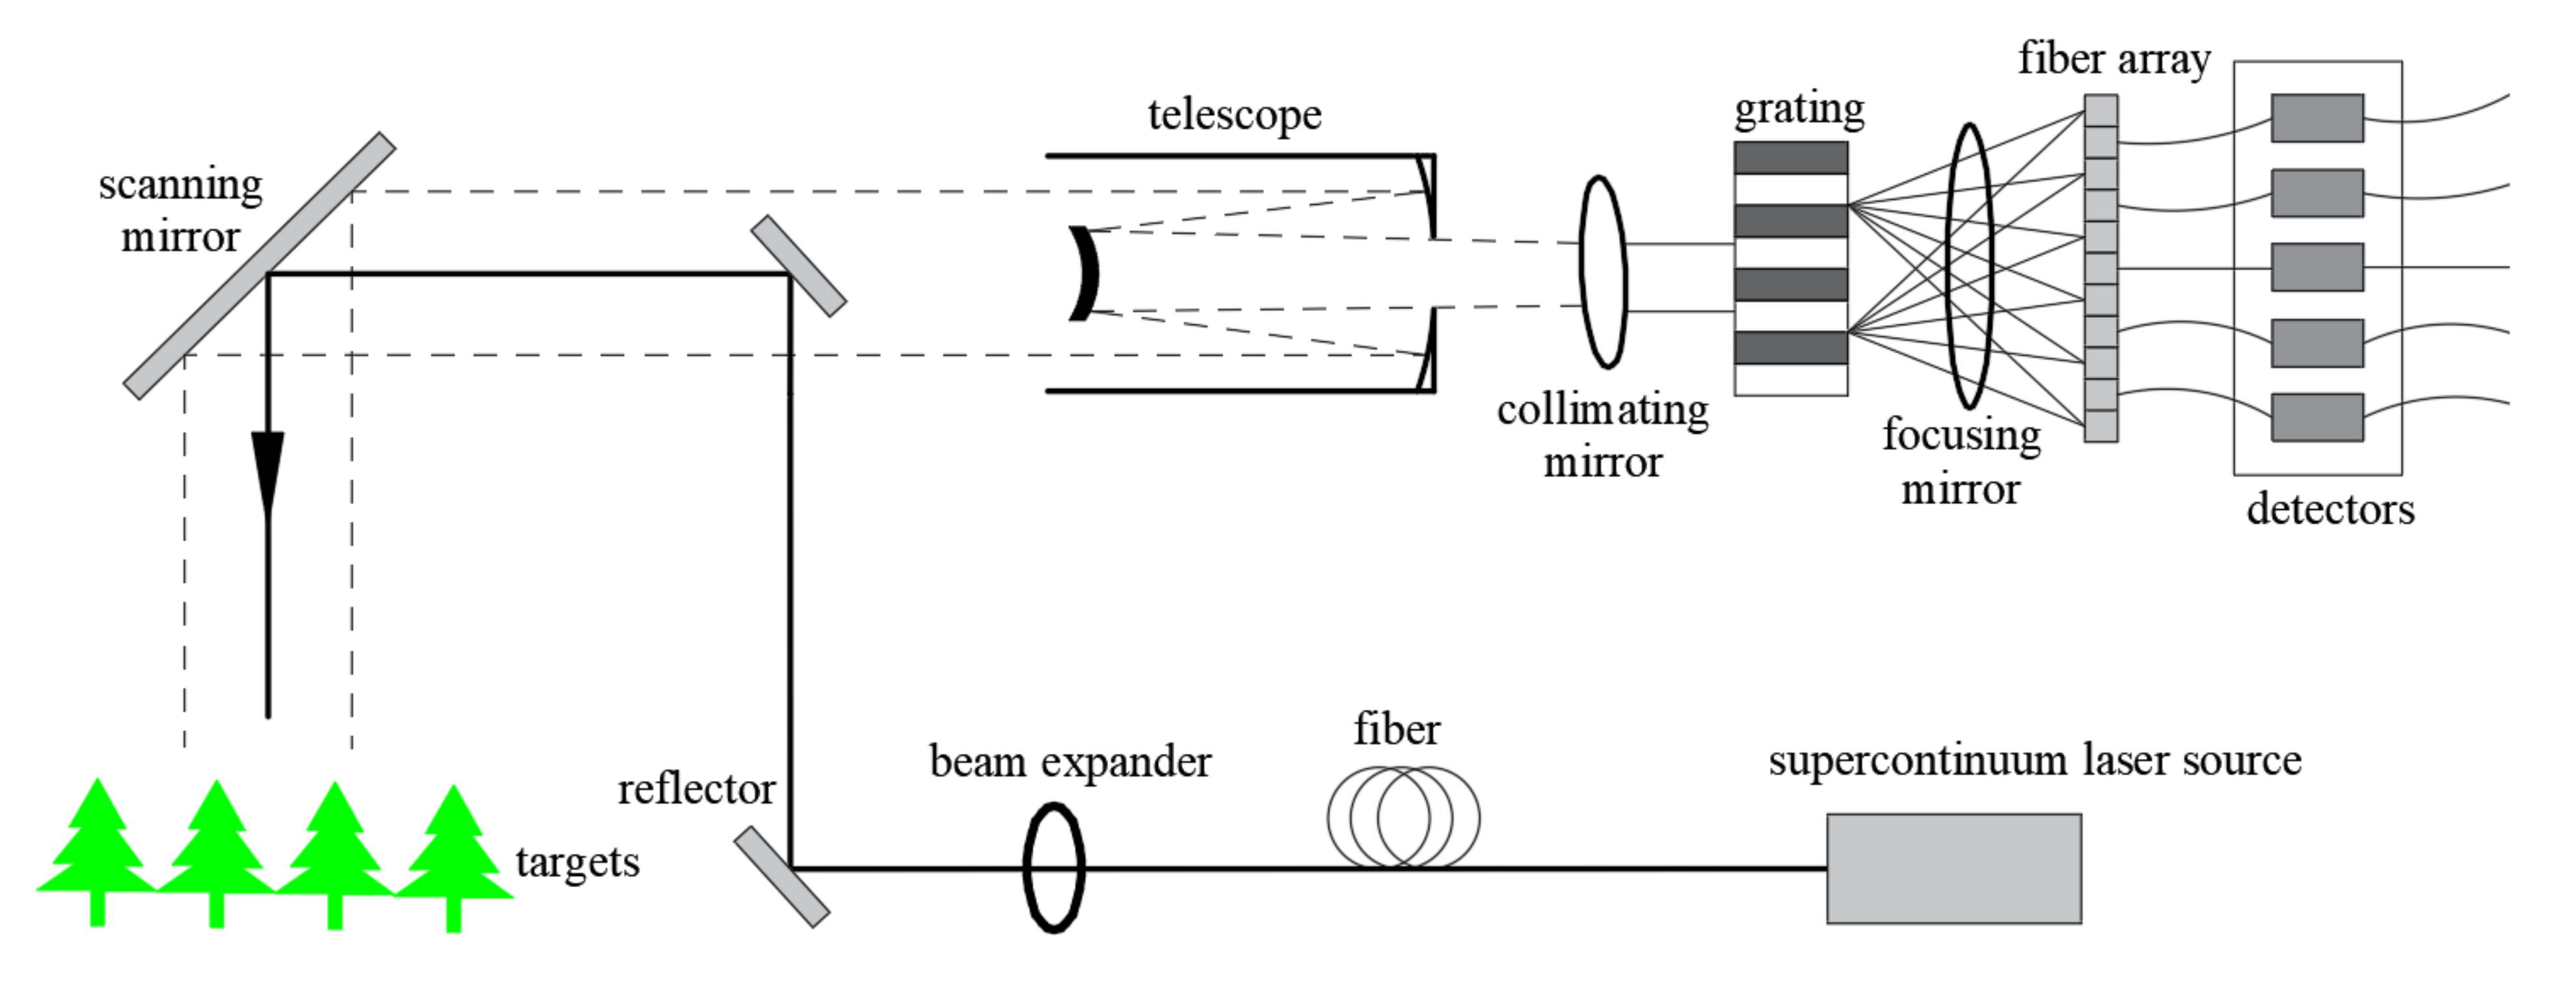
This study introduces the structure of an airborne hyperspectral imaging LiDAR system. The spectrum range of the system is 400–900 nm, and it can realize 50+ channels of synchronous detection and acquisition. The hyperspectral LiDAR system adopts the optical fiber array focal plane splitting method to realize the efficient coupling of the echo signals of all channels. At the same time, the weak energy of the supercontinuum laser in the shortwave band leads to a poor signal-to-noise ratio (SNR) of the echo signal. Thus, the system uses single-tube detectors. Compared with traditional line and area array detectors, the advantage of single-tube detectors is that the responsivity and gain of each channel can be adjusted independently. This study simulates the parameters of the system before it is built and examines the effects of the power of the supercontinuum laser and the design parameters of the LiDAR system on the SNR of the echo signal. The main theoretical basis of this research work is carried out around the LiDAR equation. We combined the principles of optical design and finally determined the design parameters of the system components and the transmitting power spectrum of the supercontinuum laser.
3. Materials and Methods
The parameter simulation of the hyperspectral imaging LiDAR system is based on the theoretical model established with the traditional LiDAR system and combined with the hyperspectral imaging LiDAR equation. Then, the simulation model of the hyperspectral imaging LiDAR system is constructed. Using the design parameters of the hyperspectral imaging LiDAR system and the performance parameters of the laser and in combination with the characteristic spectrum of the ground object, the detection results of LiDAR are simulated under various conditions. The obtained results can enable LiDAR system workers to select the optimized design approach when examining the system, and they can have a complete understanding of system performance before the system prototype is completed. Therefore, simulation of the LiDAR system is an indispensable part of current LiDAR system design and research. A complete theory is available for the simulation of radar systems [
31]. Regarding the simulation of the LiDAR system, current domestic and foreign scholars have also carried out extensive research and established a complete theoretical system [
32,
33].
Figure 2 shows a parametric simulation model of hyperspectral LiDAR. Before designing the airborne hyperspectral imaging LiDAR, we must preliminarily determine the theoretical parameters of each part of the optical components. On the basis of the traditional LiDAR model and the SNR results, the system design parameters are further determined and optimized, and the performance of the supercontinuum laser is evaluated. In the simulation of the design parameters of the hyperspectral LiDAR system, the ground object is assumed to be soil and red leaves, and the echo signal intensity after the laser pulse signal transmitted by the hyperspectral lidar passes through the ground object is studied. At the same time, the influence of the atmosphere and sky background light on SNR is considered.
The theoretical model of hyperspectral LiDAR is similar to the traditional single-wavelength LiDAR, so the feasibility demonstration of the hyperspectral LiDAR design scheme is similar to that of single-wavelength LiDAR. In the simulation process, we use the SNR of hyperspectral LiDAR as the basis to demonstrate the feasibility of the design parameters. On the basis of the simulation results of SNR, we derive the performance indicators of the laser and further optimize the design parameters of hyperspectral LiDAR.
3.1. Hyperspectral Waveform Modeling
Airborne hyperspectral imaging LiDAR uses a supercontinuum laser as a light source to transmit laser pulse signals in a wide spectrum to the measured target. An optical receiving and detecting system is adopted to receive and detect laser echo signals in a wide spectrum scattered by the target before obtaining the elevation and spectral information of the target. Generally, the intensity of the echo signal received by hyperspectral LiDAR is mainly affected by three aspects. First, the echo signal strength of LiDAR is determined by the interaction between the laser beam and the ground target. For hyperspectral imaging LiDAR, the reflectivity of the ground target affects the strength of the echo signal. The second aspect is the influence of the medium between hyperspectral LiDAR and the ground target on the echo signal, such as the attenuation of the echo signal by the atmosphere. Lastly, the strength of the echo signal of hyperspectral LiDAR is related to the configuration of the LiDAR system and the technical factors of the system, such as the influence of the transmittance of the LiDAR system on the strength of the echo signal. The strength of the echo signal directly determines whether hyperspectral LiDAR can detect ground objects effectively.
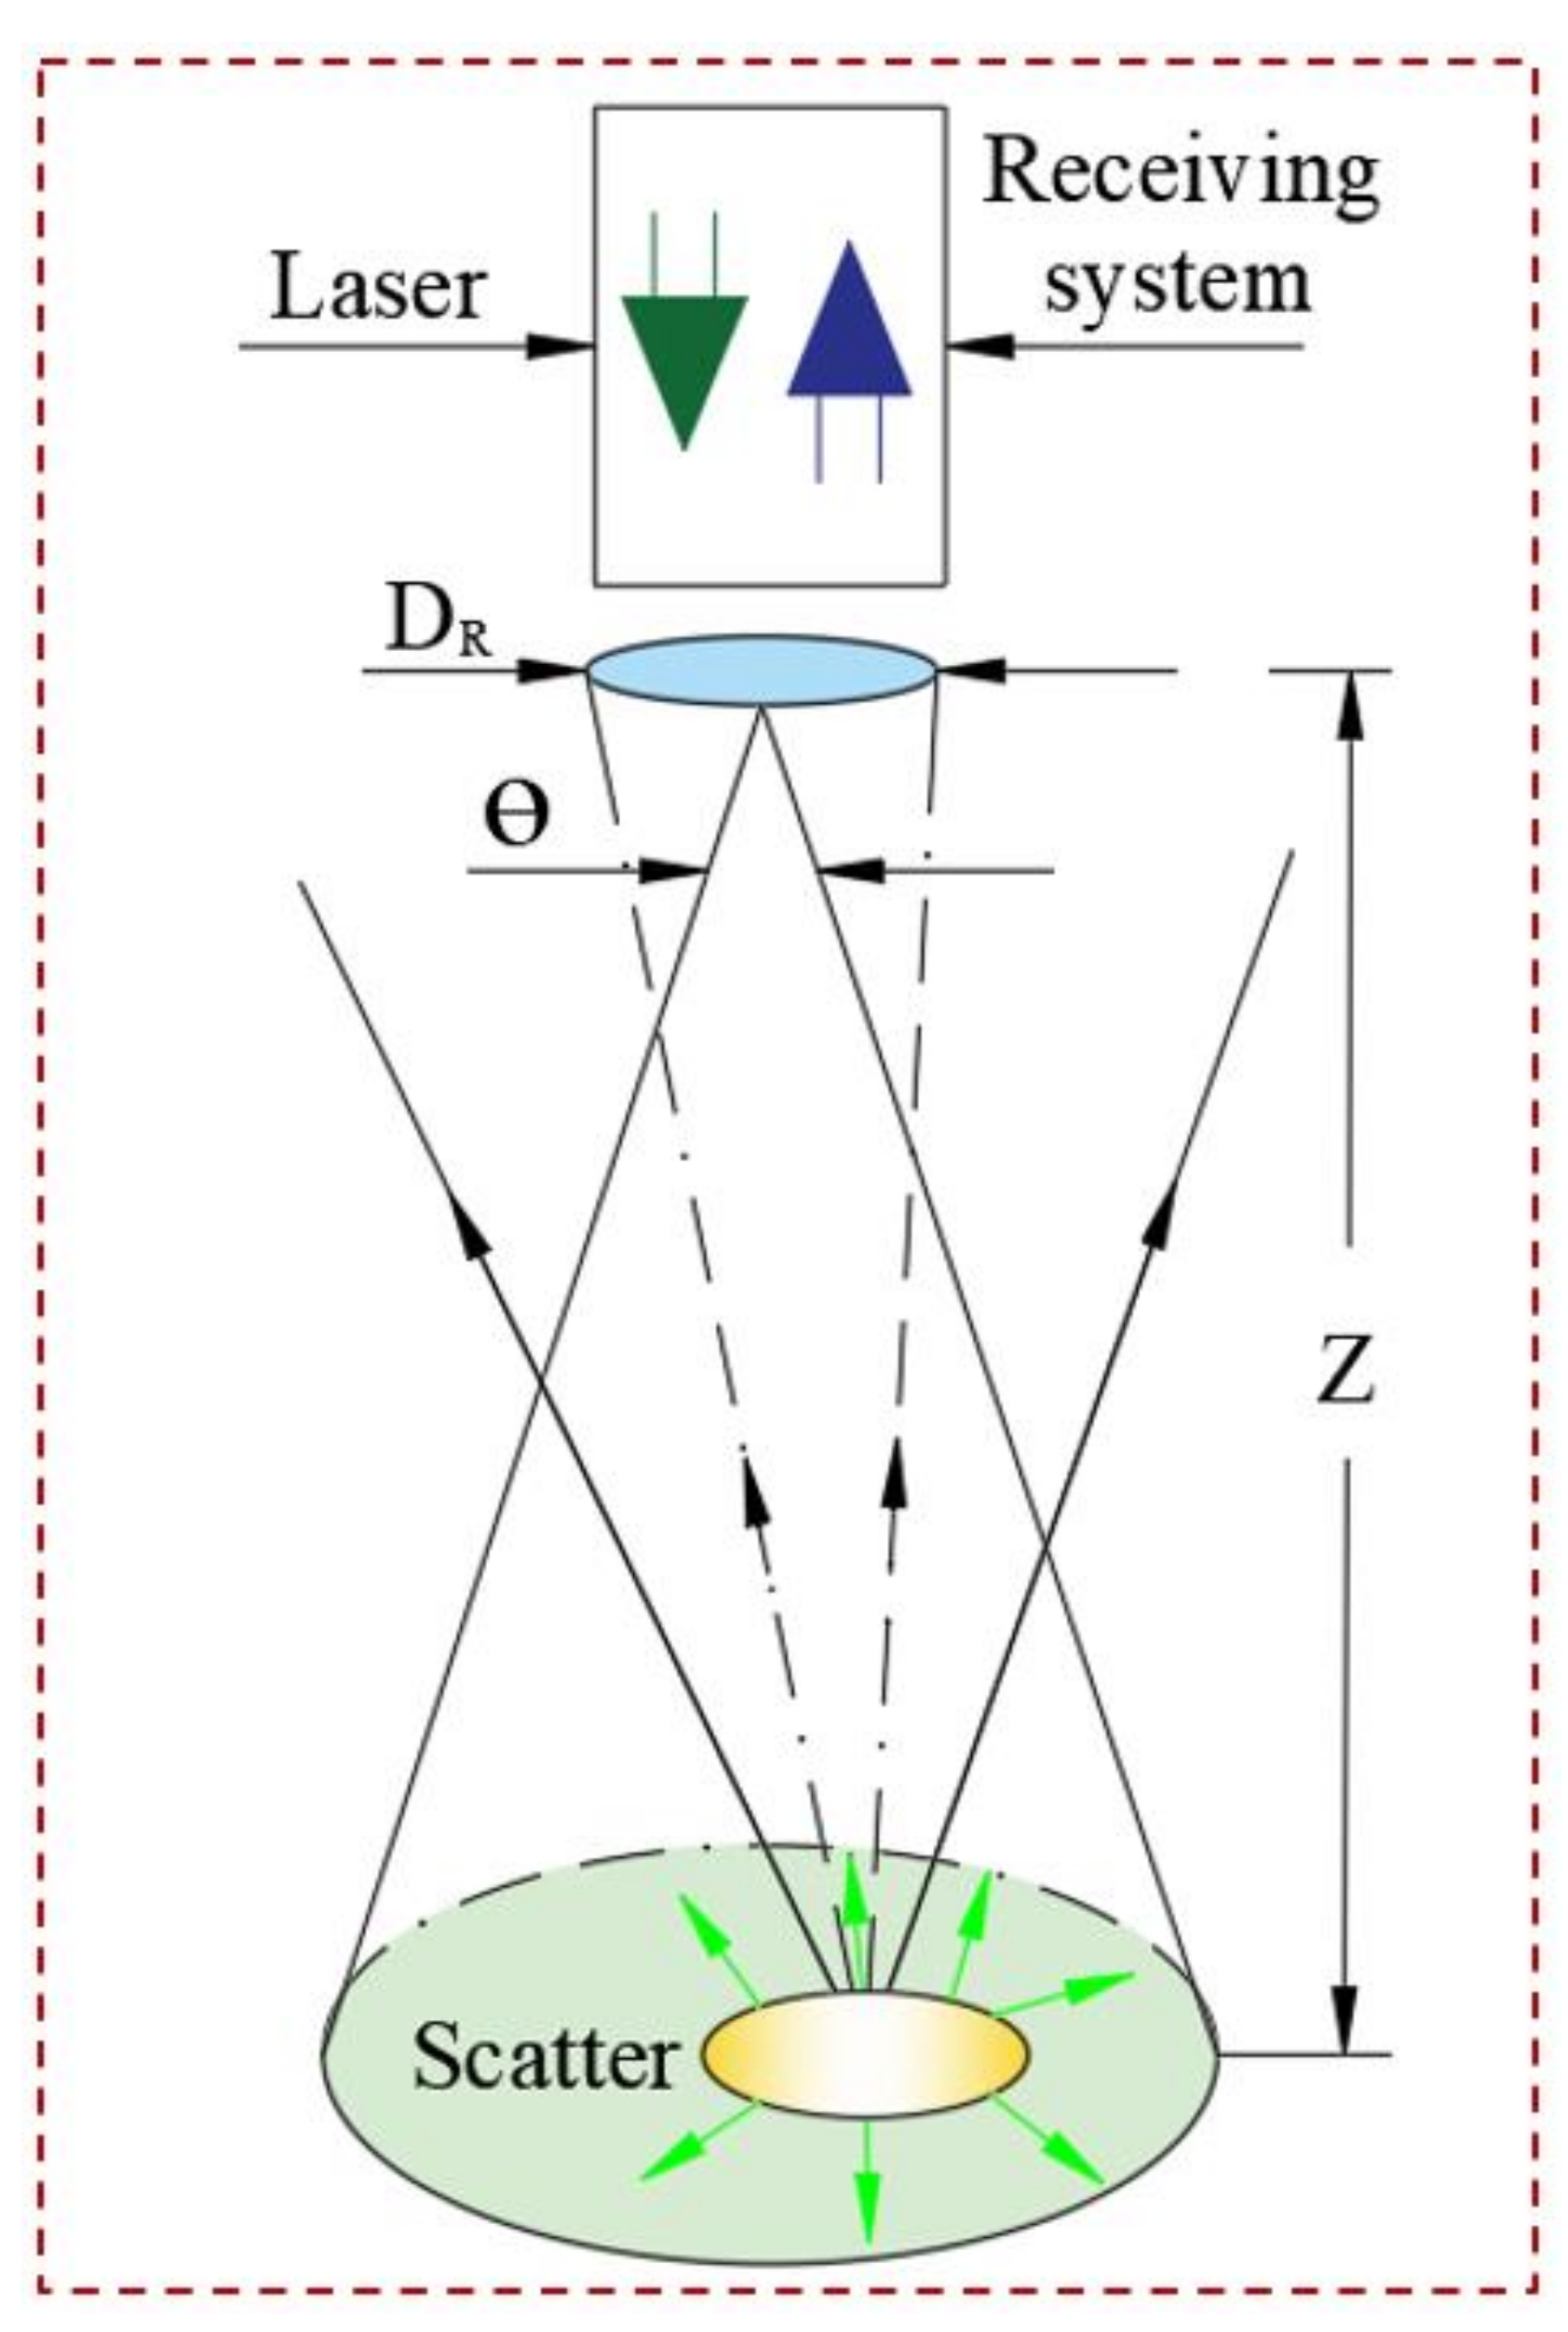
As shown in
Figure 3, the single-pulse energy emitted by the laser is
, and the distance between the receiving system and the ground target is
. The laser emits a pulse signal that is incident on the surface of the ground target, and the pulse signal uniformly scatters in the hemispherical space in a Lambertian form. Without considering the laser energy loss, the energy density of the scattered laser pulse is defined as
.
The intensity of the echo signal received by the hyperspectral LiDAR system is defined as
, the reflectivity of the ground target is
, and the receiving aperture of the telescope is
.
During the airborne LiDAR flight test, the optical components of the LiDAR system experience a certain loss of laser pulse energy. The coupling efficiency among various parts of the optical components is also important. In the process of data processing, the attenuation effect of the laser pulse energy by the atmosphere needs to be considered. In the theoretical derivation process of the LiDAR equation, the system attenuation coefficient is recorded as
, and the atmospheric transmission factor is recorded as
. Equation (3) is then obtained.
In the design process of airborne multi-channel hyperspectral imaging LiDAR, the working mechanism of single-shot laser pulse emission and multi-channel synchronous acquisition of echo signals is usually adopted. First, after the single pulse emitted by the laser is scattered by the ground object, the LiDAR receiving system splits the wide-spectrum echo signal through the beam splitter element. The beam splitter element is generally a grating or a Fabry–Perot interferometer. Then, the echo signal is coupled to the corresponding detection channel through light transmission. In the hyperspectral LiDAR system discussed in this article, we use optical fiber as a light transmission device to couple the echo signals of different spectral bands to the corresponding single-tube detectors.
In accordance with the actual working mode of the hyperspectral imaging LiDAR system discussed in this article and in combination with Equation (3), we obtain the echo signal intensity of the multi-channel hyperspectral LiDAR equation, which can be further defined by Equation (4) [
34].
where
is the central wavelength of each channel obtained during spectral calibration (the determination of center wavelength
is one of the core contents of the calibration of the radar system),
is the optical power of the return signal received by the channel with a center wavelength of
,
is the average spectral power density produced by the laser,
is the spectral power density distribution function normalized by the average spectral power density of the laser,
is the spectral bandwidth corresponding to one channel, and
is the reflectivity of the target. Moreover,
is the effective aperture of the receiving telescope,
is the distance between the LiDAR and the measured object and can be measured in real time through the ranging channel,
is the optical efficiency of the LiDAR system, and
is the transmittance of the atmosphere between the LiDAR and the measured surface at wavelength
.
In the design process of the LiDAR system, SNR is an issue that cannot be ignored. Generally, the process includes sky background light noise, stray light noise of the LiDAR system itself, and dark current noise and thermal noise in the photoelectric detection system. If the noise cannot be effectively suppressed, the SNR of the echo signal will be reduced, which will greatly affect the measurement accuracy of the hyperspectral LiDAR system. We focus on the influence of sky background light noise on SNR.
When the LiDAR system is working, the detection performance at night is stronger than that in the day due to the influence of sky background light. To ensure that the hyperspectral LiDAR system can detect ground objects throughout the day, its design needs to ensure that the radar can work normally during the day. Assuming that sky background light is uniformly scattered in all directions in space, the actual sky background light intensity received by the LiDAR system can be understood as the sum of the sky background light intensity within the range of the telescope projected to the ground.
Therefore, the daytime background light power received by the LiDAR system can be defined by Equation (5).
where
is the sky background light power scattered by the ground surface and received by each channel of the hyperspectral LiDAR,
is the monochromatic sky background light radiance received by each detection channel, and
is the field of view of the receiving telescope.
By referring to the traditional LiDAR SNR calculation method [
35] combined with Equations (4) and (5), we can use Equation (6) to define the SNR of the echo signal received by the hyperspectral LiDAR from the surface target object scattering.
In the actual flight operation of hyperspectral LiDAR, when the flying altitude is Z from the ground target, the SNR of the surface-scattered echo signal received by the channel corresponding to the center wavelength of is defined as . is the cumulative laser pulse number.
3.2. Parameter Simulation of Hyperspectral LiDAR
In accordance with Equation (6), we can simulate the SNR of the hyperspectral LiDAR system, which can be used as an important theoretical basis for determining the design parameters of the LiDAR system.
Table 1 shows the design parameters to be determined for the hyperspectral LiDAR system. The spectral resolution of the hyperspectral LiDAR system is set to 2.5 nm, and the clear aperture of the telescope is set to 0.1 m. The working band of hyperspectral LiDAR is set to 400–900 nm. The optical efficiency of the hyperspectral LiDAR system is also an important design index. We expect the optical efficiency of the hyperspectral LiDAR system to be 0.3. We optimize and confirm the main technical parameters of the LiDAR system through simulation to ensure that the design parameters meet the pre-designed performance requirements of hyperspectral LiDAR.
The spectral power density in the 400–900 nm range is given in
Figure 4. The spectral power density distribution function is obtained by normalizing the power spectrum of the laser output. The power density spectrum of the laser is provided by the manufacturer, and the power density spectrum corresponding to different wavelengths in the simulation process is weaker than the power density spectrum of the actual laser.
Sky brightness usually refers to the part of solar radiation energy absorbed and scattered by the atmosphere and the spatial distribution of the radiance of scattered light formed within the atmosphere [
36]. The brightness of the sky is generally determined by the position of the sun and the characteristics of the scatterers in the atmosphere, and it usually involves atmospheric molecules and aerosol particles in the atmosphere. Sky brightness is the radiation caused by these factors. Sky brightness is an important direction of research on the detection and recognition of targets in space [
37], the tracking and imaging of targets in space [
38], and the inversion of the optical properties of aerosols and clouds [
39].
Figure 5 shows the spectral curve of sky background light radiance. The sky background light radiance mentioned in this article is based on the American ASTM G173-03 model [
40].
In the process of simulating the parameters of the LiDAR system to obtain SNR, vegetation and soil are used as the main ground objects for analysis, and vegetation is mainly represented by red leaves. As shown in
Figure 6, the reflectance of the ground targets in the 400–900 nm spectral band is selected. The reflectance spectrum curves of the red leaves and soil in
Figure 6 are all measured results provided by the State Key Laboratory of Information Engineering for Surveying, Mapping, and Remote Sensing. In actual flight operations, hyperspectral imaging LiDAR is mainly used for the remote sensing observation of soil and trees.
For airborne hyperspectral LiDAR, the influence of atmospheric transmittance on the measurement results of the LiDAR system is crucial. In the field of Earth observation and remote sensing measurement, the absorption of broad-spectrum laser energy by atmospheric molecules directly affects the final measurement results of the LiDAR system. As shown in
Figure 7, the atmospheric transmittance curve corresponding to 400–900 nm is selected during the simulation process. This curve is based on the CART mode provided by the Hefei Institute of Material Science, Chinese Academy of Sciences [
41].
4. Results and Discussion
We simulate the design parameters of the system on the basis of the hyperspectral LiDAR equation. For the measurement of the spectral data of each channel, only the total energy value received by each channel needs to be considered in the simulation process. The spectral range of the hyperspectral LiDAR system is 400–900 nm, the detection channel is set to 50+, and the spectral resolution of a single fiber is set to 2.5 nm.
According to Equation (5), without considering the influence of atmospheric transmittance on the measurement results, the brightness spectrum of the sky background light received by the hyperspectral LiDAR system is mainly affected by sky background light radiance and ground target reflectivity. As shown in
Figure 8, assuming that the ground objects are red leaves and soil, the background light intensity spectra of the red leaves and soil are obtained with Equation (5). In the shortwave direction, because the reflectivity of red leaves is lower than that of soil, the sky background light intensity obtained by the hyperspectral LiDAR system when the ground target is red leaves is lower than that of soil. In the long-wave direction, due to the sharp increase in the reflectivity of red leaves, the corresponding sky background light intensity is considerably higher than that of soil.
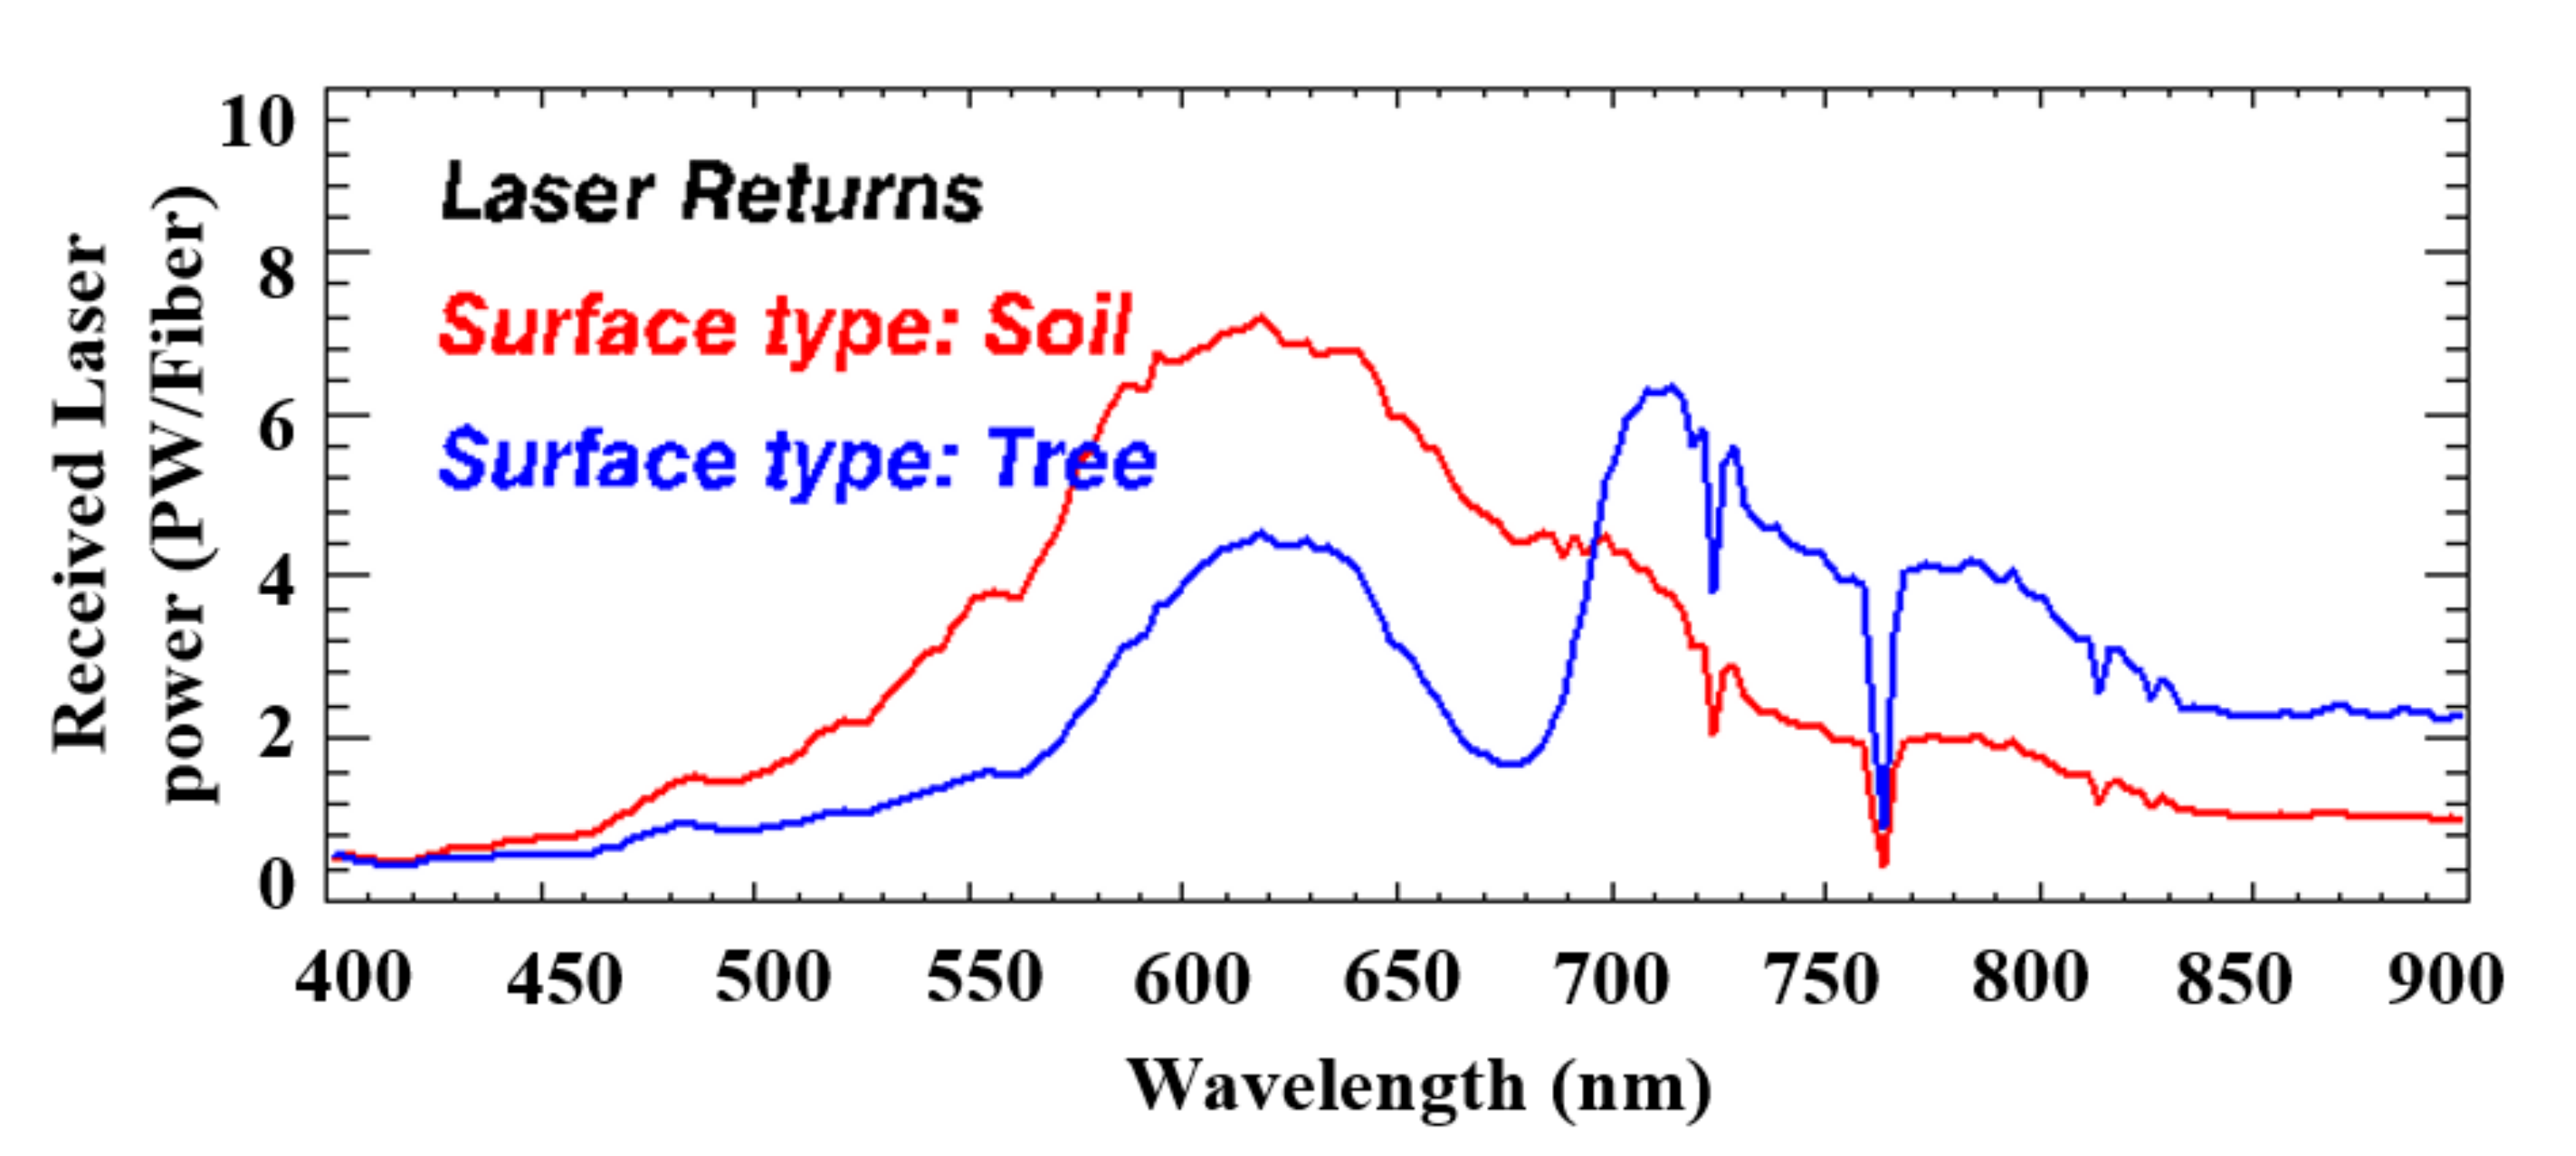
In accordance with Equation (4), we obtain the power spectrum of the echo signal received by the LiDAR system through simulation. As shown in
Figure 9, without considering the optical efficiency of the hyperspectral LiDAR system, the intensity of the echo signal is mainly affected by the laser power. Atmospheric transmittance is another influencing factor. Given that atmospheric transmittance has a sharply attenuated peak at 700–800 nm, the corresponding laser echo signal power also shows a tendency to decrease sharply in this spectral band. Comparison of the simulation results in
Figure 8 and
Figure 9 indicates that in the daytime, the intensity of the echo signal received by the LiDAR system is considerably weaker than the intensity of the sky background light.
Analysis of the simulation results in
Figure 8 shows that the theoretical calculation value of sky background light power is in the order of 10
−12 (PW). However, in actual operation, the suppression of daytime background light by the hyperspectral LiDAR prototype is generally in the order of 10
−9 (nW). It is a difficult problem that needs to be solved in the design process of the hyperspectral LiDAR system, and emphasis should be placed on the interference of background light during the day.
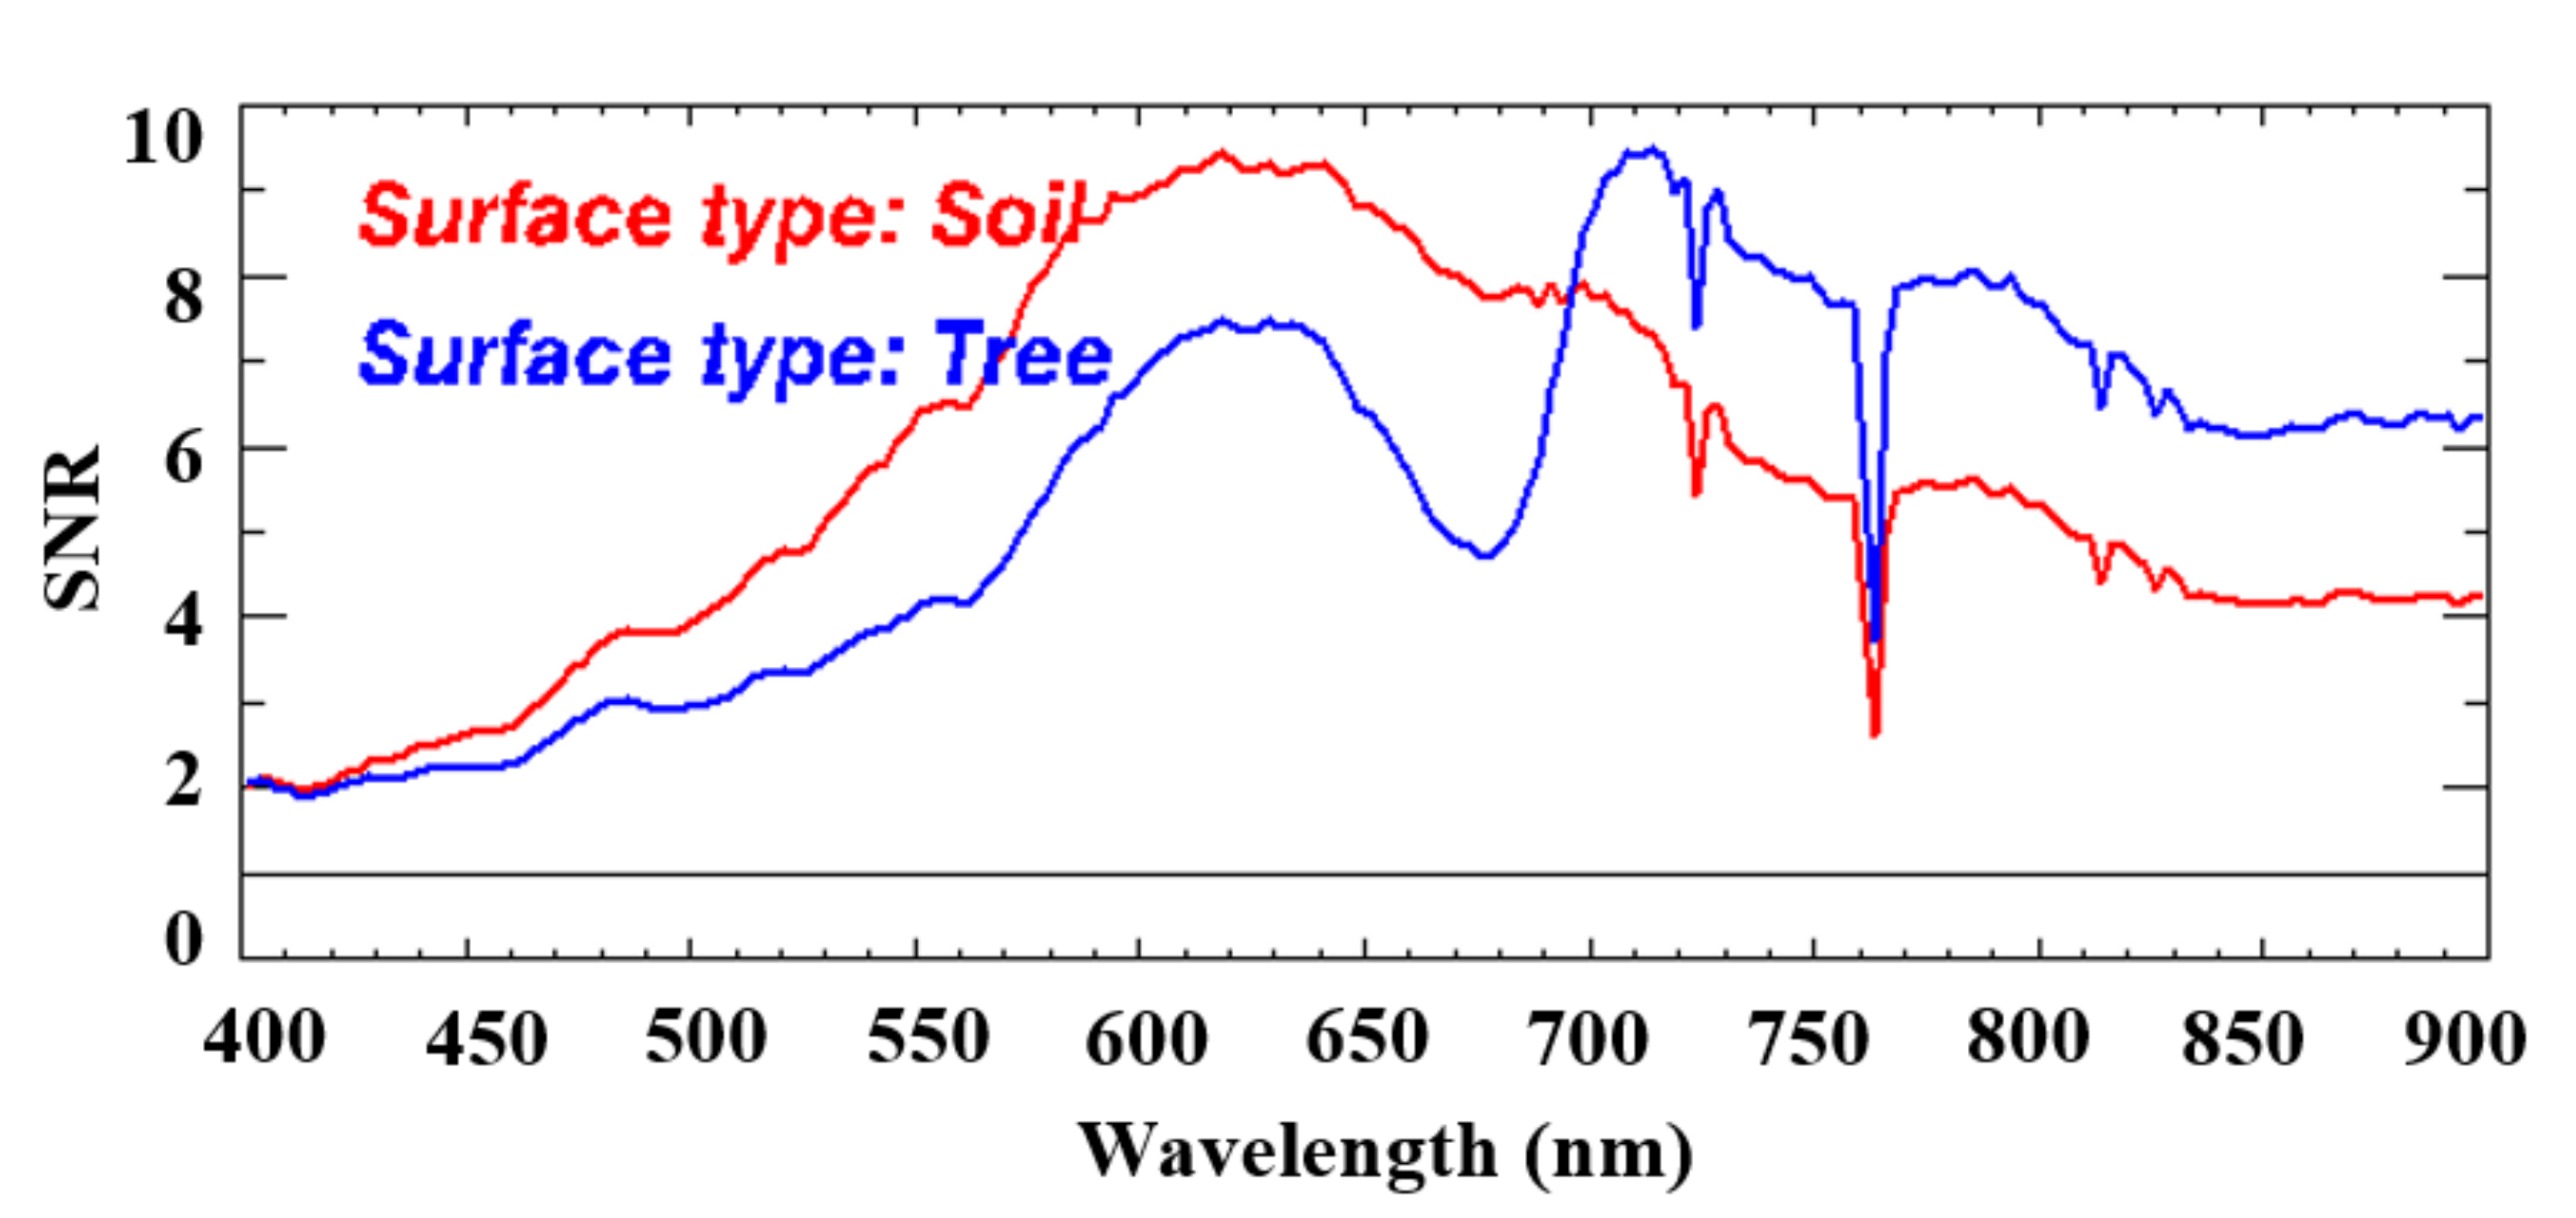
In accordance with Equation (6), the laser power received by the LiDAR system and the intensity of sky background light are considered comprehensively.
Figure 10 presents the numerical simulation results of the SNR of each channel when hyperspectral LiDAR works in the daytime. Under the influence of laser emission power, the SNR of the hyperspectral LiDAR system shows an upward trend in the shortwave direction and reaches a peak in the 600–650 nm spectral band. In the long-wave direction, the overall SNR of the hyperspectral LiDAR system shows a downward trend. The simulation results of the hyperspectral LiDAR system confirm that the design parameters are feasible. When the LiDAR system is flying at an airborne altitude of 500 m, the hyperspectral LiDAR system can complete the measurement of the spectral information of ground targets during daytime.
However, in the SNR simulation process of the hyperspectral LiDAR system, the influence of detector gains and electronic amplification on SNR is not considered. In the actual working process of the LiDAR system, the sky background light signal and the scattered echo signal undergo the same photoelectric conversion and signal amplification process. Therefore, the relationship between the root mean square of the scattered echo signal and its standard deviation must be the same as that of the sky background light signal. Moreover, when the LiDAR system is working at daytime, the strong sky background light signal should be one of the main considerations.
As presented in
Figure 8, the theoretically calculated value of the background light power received by LiDAR is in the order of 10
−12. In actual operation, the suppression of daytime background light is generally in the order of 10
−9. Therefore, in the SNR simulation process of the LiDAR system, the SNR must be calculated when the background light power received by the LiDAR is increased by 1000 times.
Figure 11 presents the numerical simulation results of the SNR of each channel of hyperspectral LiDAR after the sky background light signal is amplified by 1000 times. The SNR results of all channels show a significant downward trend. The SNR of several detection channels is lower than 1, and the maximum SNR of detection channels is close to 4. In the data processing of the echo signal, a too low SNR increases the difficulty of data processing. Therefore, improving the SNR of the LiDAR system is one of the problems that all scientific researchers need to solve in the process of designing and processing the LiDAR system.
During the preliminary design of the LiDAR system, the spectral resolution of a single optical fiber is set to 2.5 nm. A higher spectral resolution can enhance the LiDAR system’s capability to distinguish ground objects, but the SNR of each detection channel cannot be guaranteed. Therefore, to improve the SNR of the receiving system as much as possible while satisfying the requirements of the LiDAR system for spectral resolution, multiple optical fibers can be coupled into one detection channel in the production process of the LiDAR prototype system. The SNR of the echo signal is improved in the process of reducing the spectral resolution of the LiDAR system.
In the design process of the hyperspectral LiDAR prototype, three optical fibers are coupled into one detection channel under the precondition that the spectral resolution can be distinguished from the ground objects. Therefore, the simulation process of the SNR of a single detection channel can be regarded as the superposition of the echo signals of three laser pulses.
Figure 12 shows the power spectrum density of the laser emission obtained by simulation when the SNR of the echo optical signal of three laser pulses received by a single fiber is equal to 1. Under the premise of ensuring that the SNR of the LiDAR system meets the requirements, we need to increase the laser’s emission power, especially in the shortwave direction, and we need to ensure that the laser’s emission power spectral density is not less than 15 mW/nm.
The emission power of supercontinuum lasers is one of the important factors that determine the development of airborne hyperspectral imaging LiDAR. A laser with high emission power can make the structure of the hyperspectral LiDAR system compact, and a lightweight, compact LiDAR system is crucial for the airborne platform. If the emission power of a supercontinuum laser is not improved, then the receiving aperture of the hyperspectral LiDAR system must be increased. An extremely large receiving aperture increases the volume of the LiDAR system, which is unfavorable for the narrow space of the airborne platform. Moreover, an extremely large receiving aperture is not conducive to the suppression of sky background light by the hyperspectral LiDAR system, which has a negative impact on the SNR of the system. Therefore, when optimizing the optical–mechanical structure design of hyperspectral LiDAR, how to increase the emission power of the supercontinuum laser is another problem that researchers in this field have been trying to solve.
According to the simulation results of the SNR of the hyperspectral LiDAR system, the energy spectral distribution of the supercontinuum laser presents a nonlinear effect, especially in the shortwave direction that requires high laser energy. On the one hand, we need to increase the emission power of the supercontinuum laser. On the other hand, we need to improve the detection capabilities of LiDAR systems. In the design process of the LiDAR prototype, we refer to grating spectrometer technology and the high-efficiency coupling technology of optical fiber arrays. At the same time, high-sensitivity APD and PMT detectors are used to detect echo signals. Compared with traditional line and area array detectors, single-tube detectors present outstanding advantages. Single-tube detectors can independently control the bandwidth, sensitivity, and gain, thereby further improving the detection capability of the hyperspectral LiDAR system for wide-spectrum echo signals. In accordance with the spectral scattering characteristics of the ground target, the center wavelength and bandwidth of different detection channels can be optimized, and multiple optical fibers can be coupled into one detection channel to realize the flexible selection of the center wavelength and bandwidth of different detection channels.
Furthermore, under the premise of meeting the spectral resolution requirements of the hyperspectral LiDAR system, coupling multiple optical fibers into a detection channel can ensure that the hyperspectral LiDAR system can detect ground targets under harsh environmental conditions. In particular, it improves the detection capability of the hyperspectral LiDAR system for weak echo signals during daytime.
Background light suppression technology, including the narrow field of view receiving technology of the LiDAR system and the numerical aperture matching of the entire LiDAR system, must be adopted to further improve the detection capability of the hyperspectral LiDAR system in the daytime. In the LiDAR optical receiving system, all optical devices, such as telescopes, grating spectrometers, and optical fibers, have corresponding numerical apertures. The numerical aperture determines the size of the incident angle that the LiDAR system can receive. An extremely large numerical aperture causes excess background light signals to enter the LiDAR optical receiving system, and an extremely small numerical aperture causes part of the echo signals to not fully enter the LiDAR optical receiving system. Therefore, in the optical design of a hyperspectral LiDAR system, we need to ensure that the numerical apertures of all optical components match. At the same time, under the premise of ensuring the effective reception of laser echo signals, sky background light and stray light signals should be received as little as possible (or not at all) to improve the SNR of the hyperspectral LiDAR system for echo signal detection.


