Article

Variability and Formation Mechanism of Polynyas in Eastern Prydz Bay, Antarctica

1
Physical Oceanography Laboratory, Ocean University of China, Qingdao 266100, China
2
Pilot National Laboratory for Marine Science and Technology (Qingdao), Qingdao 266237, China
*
Author to whom correspondence should be addressed.
Remote Sens. 2021, 13(24), 5089; https://doi.org/10.3390/rs13245089
Submission received: 4 October 2021 / Revised: 8 December 2021 / Accepted: 13 December 2021 / Published: 15 December 2021

Abstract

:
Based on satellite remote sensing, several polynyas have been found in Prydz Bay, East Antarctica. Compared with the Mackenzie Bay Polynya, the only polynya in the west, the polynyas in eastern Prydz Bay have a larger area and higher ice production, but have never been studied individually. In this study, four recurrent polynyas were identified in eastern Prydz Bay from sea ice concentration data during 2002–2011. Their areas generally exhibit synchronous temporal variations and have good correlation with wind speed, which indicates that they are primarily wind-driven polynyas that need at least one stationary ice barrier to block the inflow of drifting sea ice. The components of the ice barriers of these four polynyas were identified through comparison of satellite remote sensing visible images and synthetic aperture radar images. All types of fast ice, including landfast ice, offshore fast ice and ice fingers serving as ice barriers for these polynyas are anchored by an assemblage of small icebergs and have an approximately year-round period of variations that also regulates the variability of polynyas. The movement and grounding of giant icebergs near the polynyas significantly affects the development of the polynyas. The results of this study illustrate the important impact of icebergs on Antarctic wind-driven polynyas and the formation of dense shelf water.

Graphical Abstract

1. Introduction

Polynyas are areas of open water and/or thin ice within pack ice in the polar oceans, where thicker ice cover would be expected [1]. Most polynyas in the Southern Ocean occur next to the coast of Antarctica and form via the continuous export of sea ice from the polynya region, driven by winds [2], which results in intense sea ice formation in polynyas [2,3,4,5].
Around 10% of the sea ice in the Southern Ocean is produced in the major coastal polynyas, although the total area of Antarctic coastal polynyas only accounts for about 1% of the maximum sea ice area [6]. Dense Shelf Water (DSW), a precursor of Antarctic Bottom Water (AABW), is produced by extensive brine rejection in coastal polynyas [7,8,9,10], and thus, Antarctic coastal polynyas influence the formation of AABW and subsequently climate change. In the Indian Ocean sector of the Southern Ocean, the total ice production in the polynyas in Prydz Bay is 30% greater than that in the Cape Darnley Polynya [10]. Although the latter has been identified as one of the source regions of AABW [8], the status of Prydz Bay is still controversial [10,11,12]. An in-depth study of the polynyas in Prydz Bay would deepen our understanding of the variability and formation of polynyas, which may help to uncover the features of and variations in the DSW in Prydz Bay, thereby contributing to the resolution of this debate.
As the third largest embayment in Antarctica, Prydz Bay contains an extensive continental shelf and the third largest ice shelf, i.e., the Amery Ice Shelf (AIS, Figure 1). The Fram Bank and Four Ladies Bank (FLB), which are the shallowest parts of the bay (depths of <200 m), define the northern boundary of the bay. Between these two banks is the Prydz Channel, which is more than 500 m deep. The Amery Depression, with depths of greater than 1000 m, is located in the southern part of the bay, close to the front of the AIS. Two small concave bays are located in Prydz Bay: the Mackenzie Bay between Cape Darnley and the western part of the AIS front, and the Barrier Bay to the west of giant grounded iceberg D15 and the West Ice Shelf (WIS).
By applying a 75% threshold to the Special Sensor Microwave/Imager (SSM/I) monthly sea ice concentration (SIC) data for 1987–1994, Massom et al. [14] mapped 28 polynyas in East Antarctica, which provided a detailed description of polynyas in Prydz Bay for the first time: the Barrier Bay Polynya (BaP), the Prydz Bay Polynya, the Amery Ice Shelf Polynya, and the Mackenzie Bay Polynya (MaP). More research results regarding polynyas in Prydz Bay became available in subsequent studies on Antarctic coastal polynyas, including those by Arrigo et al. [15], which used the Polynya Signature Simulation Method (PSSM) algorithm [16] with daily SSM/I brightness temperature data, Tamura et al. [6,17,18] which applied the thin ice thickness (TIT) algorithm to SSM/I brightness temperature data, and Nihashi et al. [19,20], which used the TIT algorithm with data from the Advanced Microwave Scanning Radiometer aboard the Earth Observing System (EOS) (AMSR-E) and Advanced Microwave Scanning Radiometer 2 (AMSR2) data. These studies all support that the MaP is the only polynya in western Prydz Bay, which had been demonstrated by Massom et al. [14], but identified a different number of polynyas in eastern Prydz Bay. In these studies of Antarctic coastal polynyas [6,19,21], only the BaP was quantificationally analysed as a significant polynya, but other smaller polynyas in eastern Prydz Bay were largely ignored. Because the area and sea ice production of BaP are slightly larger than those of MaP [6,19], the polynyas in eastern Prydz Bay are seen as more important for the DSW than the western one.
Therefore, polynyas in eastern Prydz Bay deserve further study. With remote sensing data, this paper analysed the variability and formation mechanism of the polynyas in eastern Prydz Bay individually, which could benefit our understanding of the variations of DSW and the possible formation of AABW in Prydz Bay.

2. Data and Methods

2.1. AMSR-E SIC Data

To identify and analyse the polynyas in eastern Prydz Bay, daily SIC data were selected for use. The SIC dataset obtained from the Integrated Climate Data Centre (ICDC), University of Hamburg, was chosen because it was the only one that was not processed using landmask, and thus the contamination caused by incorrect landmask processing in the proximity of the Antarctic continent is avoided. This dataset is a more finely resolved SIC dataset, by applying the Arctic Radiation and Turbulence Interaction Study (ARTIST) Sea Ice (ASI) algorithm to brightness temperatures measured using the 89 GHz AMSR-E channels [22,23]. The ASI SIC data were mapped onto the National Snow and Ice Data Centre (NSIDC) polar-stereographic grid with a 6.25 km grid resolution. The ASI SIC data cover a 9-year period from 19 June 2002 to 30 September 2011, but most of the SIC data for June–September 2002 are not available. Since the ice-free area in Prydz Bay is usually connected with the open water outside of the bay during the melting season (November to March) [24], the estimation of polynyas was only performed during the freezing period (April–October). The ASI SIC data for 63 months from October 2002 to September 2011 were used in this study, with only a negligible period of missing data during 30–31 October 2003 because the instrument was affected by a solar flare. Although these data only cover the period from 2002 to 2011, they meet the requirements of our study, focusing on mechanism of the formation and variation of polynyas.
The landmask for AMSR-E at a 6.25 km resolution provided by the NSIDC was corrected manually based on clear-sky Moderate Resolution Imaging Spectroradiometer (MODIS) visible images and was applied to the SIC data to attain an accurate estimation of the polynyas.
The polynyas were identified using the SIC data by applying a threshold of 75% [14]. The polynya occurrence frequency (POF) was derived from the 63 months of SIC data (Figure 2). The core area and extent of each polynya were defined using different POF values. Four polynyas were identified clearly when POF = 24%, while the maximum extents of these four polynyas were identified when POF = 6%. The polynya-masks were defined based on POF = 24% and POF = 6%, to illustrate the statistical extent of each polynya (inset in Figure 2). To estimate the daily polynya’s area, the areas of the pixels with SIC values of less than 75% inside the extent of the polynya were summed.

2.2. MODIS Visible Images

High resolution (up to 250 m) visible images from channels 1, 3, and 4 of the MODIS on Aqua and Terra were used in this study. The MODIS Level 1B swath data were downloaded from the National Aeronautics and Space Administration’s (NASA’s) Level 1 and Atmosphere Archive and Distribution System (LAADS). The MODIS Level 1B swath data were used for three purposes: (1) to enable comparison with the synchronous Advanced Synthetic Aperture Radar (ASAR) images in order to investigate the formation of ice barriers, (2) to investigate the activity of the giant tabular icebergs and their impacts on the polynyas in Prydz Bay, and (3) to manually modify the landmask provided by the NSIDC. The changes in the icescape, such as the ice shelves, ice glaciers, and giant grounded tabular icebergs, along the east coast of Prydz Bay, were negligible during the study period, based on a comparison of all the MODIS visible images. Ice-free and clear-sky MODIS visible images from the 74th day of 2010 and the 89th day of 2011 were used to modify the landmask. Giant tabular iceberg D15 calved from the WIS in July 1991 and moved north-westward for a short period before grounding in its current location for more than 20 years, based on AVHRR images. Iceberg D15 (Figure 1) was the key part of the landmask that was modified to fit the icescape.

2.3. EnviSat ASAR Images

The ASAR instrument is an active radar sensor on-board the Environmental Satellite (EnviSat). It is operated in the C-band (at a frequency of 5.3 GHz or a wavelength of 5.6 cm), and it acquired data about the Earth’s surface between October 2002 and April 2012. The standard available products include medium-resolution Wide Swath Mode images (ASA_WSM_1P, hereafter referred to as WSM) and high-resolution Image Mode Single Look Complex images (ASA_IMS_1P, hereafter referred to as IMS). The WSM uses the ScanSAR technique to acquire images with a spatial resolution of 150 m, a temporal resolution of 3–5 days for images acquired with different acquisition angles, and a swath width of approximately 400 km. The IMS acquires images with a nominal spatial resolution of 9 m along track and 6 m across track, a temporal resolution of 35 days for images acquired with the same geometry, and a swath width of about 100 km along track and 56–100 km across track. WSM data for the study area during the study period and four IMS images of the western FLB taken in 2010 were used in this study.

2.4. ECMWF Reanalysis Data

The wind speed data at 10 m of ERA5 [25], from the European Centre for Medium-Range Weather Forecasts (ECMWF) atmospheric reanalysis dataset, were used to investigate the relationship between this meteorological variable and the polynyas’ areas. The wind field was estimated hourly and was gridded to a regular 0.25 degree latitude-longitude grid. To make the wind field compatible with the polynyas’ areas, it was arithmetically averaged to daily data first. Then, the values inside each polynya were averaged.

2.5. Sea Ice Motion Vectors

To enable comparison with the wind vectors and determine the export direction of the new ice inside each polynya, the daily sea ice motion vectors with a 25 km grid resolution from the NSIDC were used [26]. To make the field compatible with the wind data, all the sea ice motion vectors inside the polynyas were averaged arithmetically.

3. Results

3.1. Locations of Polynyas in Eastern Prydz Bay

Four polynyas were identified in eastern Prydz Bay (Figure 2), based on the POF values described above. Two of these coastal polynyas (i.e., the BaP and the Davis Polynya, DaP) have been reported in previous studies [6,18,19,27,28]. The other two offshore polynyas were named the Four Ladies Bank Polynya (FLBP) and the Iceberg D15 Polynya (D15P), based on their locations. The BaP is located in Barrier Bay (around 80.5°E, 67°S), to the west of Iceberg D15 and the WIS. Similar to the position of the BaP, the DaP is located in the Svenner Channel and the Dubinin Trough (at about 77.5°E, 68.5°S) to the northwest of Davis Station, and it was referred to as the Prydz Bay Polynya by Massom et al. [14]. To the west of the BaP and the north of the DaP is an offshore polynya (FLBP), which is located in the western part of the FLB (at about 77.5°E, 67°S). The D15P is another offshore polynya, which is located in the northeast part of the FLB (at about 81°E, 66°S), to the northwest of Iceberg D15. These four polynyas act as one large polynya, which is surrounded by the POF = 6% contour line and the coastline. We refer to them collectively as the eastern Prydz Bay polynya system (EPBPS). One region with extremely low POF values exists in the middle of the four polynyas and serves as the partition of the four polynyas.

3.2. Variability of Polynya Area in Eastern Prydz Bay

The time series of the areas of the four polynyas in eastern Prydz Bay varied daily, without apparent periodic characteristics, except for variations on the synoptic scale (Figure 3). The areas of the polynyas peaked more than 5 times and less than 10 times each year. At most times, the areas of the different polynyas had synchronous variations, implying that the main driving factors of the opening of the four polynyas were the same. An obvious exception emerged after mid-September 2008, when the BaP remained closed while the other three polynyas reopened normally, after a long period of decline from mid-August to mid-September (Figure 3f). The abnormal close of the BaP from mid-September to October 2008 was caused by the grounding of a group of giant tabular icebergs, which will be discussed in Section 4.3.
Statistically (Table 1), the BaP had the largest yearly average area, followed by the FLBP and DaP, and the D15P had the smallest yearly average area, which was only about 1/4 that of the BaP and 1/3 that of the DaP. The yearly average area of the FLBP was close to that of the DaP, but it was greater than that of the DaP in most years. The yearly average areas of the four polynyas and their total area reached the maximum values in 2007 but reached their minimum values in different years: 2008 for BaP, 2009 for D15P, and 2010 for DaP, FLBP, and EPBPS.
In contrast to the average areas of the polynyas, the FLBP had the largest daily maximum area each year, except for in 2007 and 2008, when the DaP had the largest daily maximum area because of the grounding of the giant iceberg group. The largest daily maximum areas of the BaP, DaP, and FLBP were close to each other in most years, while the D15P always had the lowest daily maximum area. The largest area maxima during the study period occurred in 2007 and 2003, while the smallest area maxima occurred in 2009 and 2010. The minimum area usually reached 0, which means that the polynya was completely closed. The ratio of the maximum area to the yearly average area represents the instability of the polynya. The FLBP had the largest ratio (4.01), and the BaP was the most stable polynya (2.51) in eastern Prydz Bay. The DaP and D15P had similar ratios (3.48 and 3.41, respectively), which were much greater than that of the BaP. The ratio of the EPBPS was not large (2.82) and was close to the ratio of the BaP.

3.3. Relationship between Polynya Area and Wind Time Series

Because the variations of wind in a day only affect the diurnal variation of the polynya area that could not be resolved by the daily polynya area data, the daily averaged wind speed was used in our study, which reflects the integrated effect of wind on the polynya accumulated over a whole day. The directions of the daily wind during the study period were similar in the four polynyas in eastern Prydz Bay; that is, all the winds blew westward (upper row in Figure 4). The magnitudes were different, but the maximum velocities all exceeded 20 m/s. The BaP had the strongest wind field, with dominant velocities of 5 to 20 m/s. The FLBP and D15P had similar wind fields, with dominant velocities of 5 to 15 m/s and slightly larger direction frequencies than that of BaP, while the DaP had the weakest wind field, with dominant velocities of only 5 to 10 m/s.
In contrast to the predominant wind direction, the direction of the daily sea ice motion vectors in the polynyas in eastern Prydz Bay varied over a wide range, even though the sea ice mainly drifted westward (lower row in Figure 4), especially in the DaP and FLBP. The directions of sea ice motion in the DaP and FLBP were more diverse than those in the BaP and D15P, even though their speed maximums were similar and all were greater than 20 cm/s. The coincident directions of the wind and sea ice motion vectors indicate that the polynyas in eastern Prydz Bay were mainly driven by wind, and thus they can be classified as wind-driven polynyas.
Because of the short distances between the polynyas in eastern Prydz Bay and their sea ice motion vectors, there were interactions among them. The new ice formed in the BaP was exported to the DaP through the channel between the FLBP and the DaP (Figure 5), which restricted the development of the DaP. Most of the ice in the DaP was exported to the west and flowed beyond the Prydz Depression, but some of the ice entered the FLBP and influenced its development due to the northerly component of the sea ice motion vectors in the DaP. The ice in the FLBP was mainly exported westward and did not restrict the DaP because of its relative position. Although the new ice formed in the D15P was exported towards the FLBP, most of the ice did not enter the FLBP because it was blocked by the giant pack ice between the D15P and the FLBP.
The correlation coefficient for the area of the DaP and the absolute wind speed was very small (about 0–0.15 for each year) compared to those of the other three polynyas (about 0.2–0.4 for each year), because the development of the DaP was significantly limited by the new ice exported from the BaP. Although the FLBP was slightly restricted by the sea ice exported from the DaP, the correlation coefficient for the area of the FLBP and the absolute wind speed was close to those of the other two polynyas, which indicates that the sea ice from the DaP seldom entered the FLBP. The similar correlation coefficients for the EPBPS and the three polynyas (BaP, FLBP, and D15P) indicate that the EPBPS performs as an independent polynya system driven by the wind, and the interaction of the polynyas inside the EPBPS did not alter the relationship between the area of the EPBPS and the wind. The correlation coefficients of the BaP, FLBP, and D15P were not very large (about 0.2–0.4) because the wind direction is not considered when calculating the correlation coefficient.
The opening of wind-driven polynyas is forced by sustained blowing wind, but the opening of a wind-driven polynya in response to wind is characterized by hysteresis [19,29]. The wind conditions in the 5 days before and after the date of the polynya area measurement are considered. The largest correlation coefficient was derived for the situation when the wind occurred 1 day before the date of the polynya area measurement in most years. In addition, the component of the wind in a certain direction makes the largest contribution to the opening of a polynya, while the wind in the opposite direction promotes the closure of the polynya. Thus, the wind data were reprojected as 72 components with intervals of 5°. The correlation coefficients for the wind components and the polynya area when the wind is measured 1 day before the date of the polynya area measurement in the four polynyas and the EPBPS for each year are shown in Figure 6. The largest correlation coefficients range from 0.3 to 0.6 (except for the DaP in 2008), which are greater than the correlation coefficients for the polynya area and the absolute wind speed, especially for the DaP.
The correlation coefficient of the DaP was still the smallest (about 0.2 to 0.45 for each year) among the polynyas because of the restriction of the ice from the BaP. The directions of the wind components when the correlation coefficient reached its maximum for each polynya are distributed in different ranges (white dots). Those of the BaP and DaP were similar and were distributed in the range of 320–335°, while those of the FLBP and D15P had broader ranges of 290–325° and 320–345°, respectively. These broader ranges indicate that the barriers of these polynyas were more flexible and deformable due to the important regulatory role of the barrier.

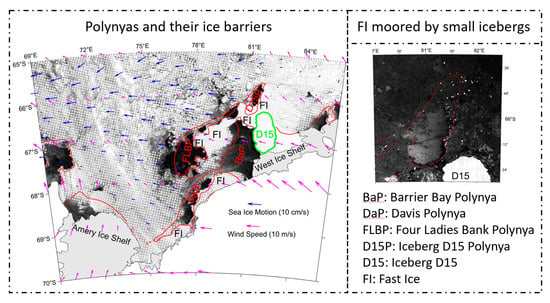
3.4. Ice Barriers of the Polynyas in Eastern Prydz Bay

Through a comparison of synchronous MODIS and ASAR images, the features of the polynyas and their surroundings were identified [30]. A polynya without ice cover appears dark in MODIS band 1 images, and the pixels in the image become whiter and brighter as the sea ice forms and accumulates. Thick ice, fast ice, icebergs, and ice shelves appear as white in MODIS band 1 images, but grey pixels may exist beyond icebergs or ice shelf regions because of the gullies they contain. Bare rock is another component observed on the Antarctic continent, and it appears dark in MODIS band 1 images. Some whiter and brighter pixels may appear if there is snow on the rock.
It is complicated to distinguish the features of polynyas from ASAR images because different targets may have similar characteristics; however, a comparison of synchronous MODIS and ASAR images may help to resolve this contradiction. Polynyas may appear as white streaked areas, since the wind blows the new ice away and waves occur inside polynyas. A calm polynya surface appears dark and has characteristics similar to those of first-year fast ice and thick ice because of the specular reflection, while multi-year fast ice appears as brighter areas with textures because of the deformation of fast ice and accumulation of snow. Icebergs and ice shelves appear as extremely bright areas and exhibit surface textures in ASAR images because of the roughness of the surfaces of icebergs and ice shelves. Bare rocks also appear as bright areas with texture due to their surface roughness.
The four polynyas investigated in this study are located in the shelf water region and have synchronous variations, so they are believed to have been formed primarily by wind. One of the necessary conditions for the formation of a wind-driven polynya is that sea ice is blocked from entering the polynya by an ice barrier located upwind of the polynya. To confirm the presence of ice barriers in the EPBPS, MODIS visible images and EnviSat ASAR WSM images taken on similar dates were analysed and compared. In November, less ice cover and weaker polynya activity occurred after the onset of the melting season in Prydz Bay, which made it easier to observe and identify sea ice in the MODIS and ASAR images under more the stable oceanic and atmospheric conditions. Therefore, MODIS visible images taken on 16 November 2010 and ASAR WSM images taken on 14–15 November 2010 were selected for the comparison (Figure 7).
As a typical coastal polynya, the ice barrier of the BaP was composed of Iceberg D15, the WIS, and the coastline from north to south (Figure 7a). Although one piece of land fast ice was located to the southwest of the BaP (around 80°E, 67°50′S), it did not act as an ice barrier for the BaP because of its position relative to the BaP. Two large tabular icebergs and numerous small icebergs were present on the north boundary of the BaP, which is shown as deep water in Figure 1 and has low POF values in Figure 2 (around 81°E, 66°40′S). A small region of high backscattering, with values between those of sea ice and icebergs, surrounded the small icebergs mentioned above in the WSM image. This is believed to be multi-year fast ice located adjacent to Iceberg D15. This fast ice survived through most of the summers during the study period and acted as the partition between the BaP and the D15P. In addition, two small groups of small grounded icebergs were present in the BaP (around 81°E, 67°S and 81°E, 67°30′S, yellow circles in Figure 7a). Occasionally, sea ice accumulated around them and reduced the area of the BaP, but most of the time, neither thick pack ice nor fast ice formed around these small icebergs.
The DaP is located close to the coastline, but there is a huge gap between the coastline and the DaP (dark area between the extremely white area of the coastline and the solid red polynya outline in the WSM image in Figure 7b). One island without snow cover (at about 78°E, 68°30′S, green box in Figure 7b) is the site of Davis Station, which is shown as a dark grainy textured triangle in the MODIS image and as a corresponding white grainy textured triangle in the ASAR image. One small ice shelf ran east to west next to the southern boundary of the island (78°E, 68°40′S, magenta box in Figure 7b). Through comparison of numerous images taken in the summers and winters during the study period, it was found that the gap to the north of the island was filled by first-year landfast ice in austral winter each year, while the gap to the south of the small ice shelf was filled by multi-year or first-year landfast ice at most times. The shapes of these two pieces of landfast ice never changed significantly, and they had similar shapes each year. In addition, numerous small icebergs were present inside these two pieces of landfast ice. A giant area of landfast ice and a small area of island and ice shelf served as the ice barrier of the DaP.
Although almost all the sea ice surrounding the FLBP disappeared, one or two huge pieces of pack ice persisted to the east of the FLBP, and the pack ice never moved until it melted down during the austral summer; for instance, two pieces of pack ice in November 2010 (around 78°E, 67°S and 79°E, 66°40′S in Figure 7c). The pack ice did not have a high backscatter value in the WSM images and had backscatter characteristics similar to those of the first-year fast ice, i.e., an extremely dark area (see corresponding locations of white pack ice in the MODIS image shown in Figure 7c). In addition, numerous small icebergs were identified inside the fast ice. Therefore, the ice barrier of the FLBP consisted of huge pieces of offshore fast ice.
The D15P is located to the northwest of Iceberg D15, and a gap exists between the D15P and Iceberg D15 (Figure 7d). One ice finger formed to the north of Iceberg D15 and connected to Iceberg D15 each year (around 81°30′E, 66°12′S). Numerous small icebergs were present inside the ice finger, which was usually first-year fast ice and blocked the upwind sea ice from entering. A large area of pack ice accumulated to the east of Iceberg D15 and the ice finger. Thus, the ice finger served as the ice barrier of the D15P and efficiently prevented the upwind sea ice from entering. A mass of floe ice drifted westward from the east of the D15P, but it could not pass the ice finger. Some of the floe ice bypassed the ice finger to the north and entered the northern part of the FLB.
In summary, the four polynyas in eastern Prydz Bay had their own ice barriers, but the types of ice that made up their ice barriers were different. The ice barrier of the BaP consisted of Iceberg D15, the WIS, and coastline, whereas the ice barrier of the DaP consisted of landfast ice, an island, and a small ice shelf. Unlike the ice barriers of the BaP and DaP, the ice barrier of the FLBP consisted of offshore fast ice, whereas the ice barrier of the D15P consisted of an ice finger connected to Iceberg D15.

4. Discussion

4.1. Relationship between Small Icebergs and Fast Ice

Numerous small icebergs were identified in eastern Prydz Bay, especially within the fast ice that served as part of the ice barriers of the polynyas. Taking the ice barrier of the FLBP as an example (Figure 7c), we sought to confirm whether the small icebergs inside the fast ice were grounded icebergs. Four ASAR IMS images taken from May to October 2010 (mentioned in Section 2.4) were processed and overlain. During the five-month period, numerous small icebergs remained inside the region of the fast ice and never moved, and only a few stationary small icebergs were found outside of the fast ice region during this period (Figure 8). Although the fast ice had not yet formed in May, a mass of floe ice accumulated around the assemblage of small icebergs. Thus, these small icebergs were grounded-like in the region of the fast ice at least from May to October, and the grounded-like behaviour occurred earlier than the formation of the fast ice.
In addition, the water depth under the offshore fast ice was greater than the thickness of the fast ice, so the motionless offshore fast ice must have been anchored by the grounded-like small icebergs, which played the role of anchor points for the fast ice. Although the small icebergs remained stationary in the ASAR IMS images during the five-month period, we cannot confirm the grounding of the small icebergs arbitrarily, since the movement of small icebergs would be restricted by the accumulated sea ice. Higher temporal resolution and wider swath WSM images could compensate for the disadvantages of the IMS images.
Numerous small icebergs were also identified inside the ice barrier of the D15P and the ice barrier adjoining Iceberg D15. The surface of Iceberg D15 has a rich texture (e.g., gullies) to provide more Ground Control Points (GCPs) for warping the ASAR WSM images. In addition, the distance of the northward movement of Iceberg D15 in one year was negligible. The ice barrier of the D15P would disintegrate at any time from November to March, but it did not disintegrate in some years, e.g., the summer of 2007–2008. The crashed ice did not drift away or disappear immediately after the strong disintegration of the ice barrier of the D15P, and it acted as a collection of crashed ice or floe ice. The floe ice crossed the D15P and entered the FLB directly, without being blocked by the ice finger. Therefore, a belt of floe ice was present on the northern boundary of the FLB when the ice finger was present, while the belt of floe ice was located farther south, beyond the FLB, when the ice finger was not present.
The assemblage of grounded-like small icebergs, which served as anchor points for the fast ice in the polynyas, was not a phenomenon that only occurred in the austral winter. The assemblage of grounded-like small icebergs occurred at all times during the year, mainly in the regions of extremely shallow water along the path of the drifting icebergs. According to the daily sea ice motion vector data and the daily MODIS visible images, these small icebergs drifted from upstream during seasons with no ice or less ice (Figure 5). Numerous small icebergs drifted from the east of the D15P towards Prydz Bay. Some of them were blocked by the seabed of the eastern part of the D15P and stopped when they encountered shallow water. The sea ice in eastern Prydz Bay mainly drifted from northeast to the southwest in the austral summer; the icebergs that were not stopped by the seabed drifted southwest into the FLB and stopped when they encountered shallow water. Therefore, the grounded-like icebergs followed a drift path from northeast to southwest, beyond the FLB (Figure 7c).
In addition, some of the small icebergs formed from Iceberg D15, and the ice shelf/ice sheet near the coast supplied the assemblage of small grounded-like icebergs in the FLBP and DaP. The drafts of the icebergs that were blocked in the eastern part of the D15P should have been greater than those of the icebergs that crossed the shallow water region. The blocked icebergs crossed the shallow water after a long period of bottom erosion and melting caused by the adjacent warm ocean water and supplied the assemblage of small grounded-like icebergs in the FLBP. In addition, giant icebergs usually drifted in the northern part of the D15P and occasionally encountered the shallow water region in the eastern part of the D15P. These giant icebergs were not stopped by the shallow water, and they rotated and moved slowly northward until they entered the deep-water region.
The assemblage of small grounded-like icebergs was not only observed in 2010 but was observed in similar locations each year. The locations were closely correlated with a seabed topography shallower than 200 m, which indicates that the assemblage of small grounded-like icebergs and the formation of fast ice are strongly regulated by the seabed topography.
However, the question of the relationship between the fast ice and small icebergs during the formation of the fast ice remains. Is the formation of the fast ice caused by the small grounded-like icebergs or is the movement of the small icebergs restricted by the formation of the fast ice? To confirm the relationship between the small icebergs and the formation of the fast ice, in this study, the theory of three primary colours was applied to WSM images. The pixels that had high backscattering in all the three single-color images were white pixels if the three different WSM images were input through three separate channels (the red, green, and blue channels).
Three WSM images taken in the middle of three consecutive months were input into the RGB channels, and the gradual change in the position of the small icebergs is shown in the consecutive composite images. Figure 9a,b show that many colourful small icebergs were located in the region of fast ice, illustrating that the positions of the icebergs were not fixed, the icebergs were not grounded, and they slowly moved within the region. Few small white icebergs were observed in the region of fast ice in Figure 9c, illustrating the beginning of the formation of the fast ice. Many small white icebergs were found in fixed positions in Figure 9d–j, illustrating the motionless nature of the small icebergs after the formation of the fast ice.
Thus, the numerous small icebergs assemble because they are blocked by the extremely shallow water region; however, these icebergs do not become firmly grounded during the austral summer. These icebergs are restricted to the shallow water region and move slowly back and forth. A mass of sea ice forms and accumulates around the small icebergs as the temperature decreases, the positions of the small icebergs become fixed, and it appears as though the small icebergs are grounded. Finally, the fast ice forms in the region of the small iceberg assemblage because of the continuous accumulation of sea ice and the decreasing temperature. The fast ice gradually disintegrates after the start of the melting season. The small icebergs, whose drafts have been sufficiently eroded or melted, drift downstream after they are free of the restriction of the fast ice, and the assemblage of small icebergs is resupplied by new small icebergs from upstream.
The renewal of the small icebergs occurred each year. The WSM images taken in mid-September from 2002 to 2011 were also processed to obtain composite images using the theory of three primary colours, and no obvious white small icebergs were identified in the composite images of any of the years. This further illustrates that the small icebergs that were restricted in the shallow water region were able to move when they were not trapped in the fast ice. In addition, the renewal of the assemblage of small icebergs occurred each year, but the renewal rate of the assemblage of small icebergs was not estimated and was not a part of this study.

4.2. Formation and Categories of Ice Barriers in the FLBP

The FLBP is an offshore wind-driven polynya that was mainly formed by wind and an ice barrier consisting of offshore first-year fast ice. By comparing the MODIS visible images with the ASAR images (e.g., Figure 7c) and viewing all MODIS visible images during the study period, we can make the following inference about the formation and development of the ice barrier. The fast ice is anchored by small grounded-like icebergs, and the shape of the fast ice is regulated by the positions of the small grounded-like icebergs and the local meteorological conditions. The margin of the fast ice was not anchored by the small grounded-like icebergs and sometimes broke down due to wind and/or current activity in the austral winter. Moreover, it always broke down starting with the disintegration of the fast ice in the early austral summer (late October or early November). Following the continuous disintegration of the fast ice, the part of the fast ice anchored by the small icebergs melted down and disintegrated under the effects of the sunlight and increasing temperature. The fast ice in the FLBP disappeared in late December or early January every year. As the austral winter began, new sea ice formed due to the colder atmospheric temperatures. New ice formed inside the assemblage of small grounded-like icebergs, and new ice from upwind, which was blocked by the assemblage of small icebergs, accelerated the formation of the pack ice in the region of the assemblage of small icebergs. The fast ice grew gradually due to the earlier formation of fast ice in the core region and the continuous accumulation of new ice from upwind.
The fast ice in FLBP reached its largest extent in mid-October, the early melting season (Figure 10). By its connecting situation with Iceberg D15, the fast ice in FLBP can be classified into two types, type A and type B, which are shown in the first and second rows in Figure 10, respectively. Type A was well-developed fast ice; that is, more sea ice formed around the two pieces of fast ice anchored by the small icebergs, creating one giant piece of fast ice that connected to Iceberg D15 via the fast ice between the northern boundary of the BaP and the southern boundary of the D15P. Type B was not as well developed as type A, so the fast ice was not connected to Iceberg D15.
The southern boundary of the fast ice in the FLBP never exceeded 67.5°S in the normal years during the study period. Although a few small grounded icebergs were present between 67.5–68°S, i.e., next to the eastern boundary of the FLBP (Figure 7c), their sporadic positions and small quantity did not allow for the formation of fast ice. The region between the area south of 68°S and the fast ice in the DaP is the Dubinin Trough (Figure 1), where is too deep for icebergs to ground. The channel for transferring new ice formed in the BaP remained open because of the lack of fast ice between 67.5°S and the fast ice in the DaP.
The fast ice in the FLBP occasionally extended past 67.5°S in some years, which resulted in serious consequences, i.e., the long-term closure of the BaP. A group of giant icebergs became grounded on the southwestern boundary of the fast ice in the FLBP in September 2007, which led to the gradual formation of fast ice south of 67.5°S. Accompanied by the formation of firm fast ice south of 67.5°S and a strong synoptic process, new ice formed inside the BaP but could not be exported from the BaP, resulting in long-term closure of the BaP in mid-September 2008, which will be explained further in the next section.
The complicated polynya system (i.e., the EPBPS) is composed of the four polynyas in eastern Prydz Bay, which influence and restrict each other. The interactions between the polynyas were affected by the variations in their ice barriers, especially that of the FLBP. When the ice barrier of the FLBP was composed of type A ice (first row in Figure 10), it was difficult for the D15P to connect with the other three polynyas. By contrast, when the ice barrier of the FLBP was composed of type B ice (second row in Figure 10), and the fast ice close to Iceberg D15 between the D15P and BaP was well-developed, the D15P was connected with the BaP, and the channel between the D15P and the BaP acted as a secondary channel for exporting sea ice from the BaP, thus the development of the D15P was restricted by the sea ice from the BaP to a certain extent. However, when the fast ice between the D15P and the BaP was not well-developed, the D15P was connected with the BaP, resulting in the export of sea ice from the D15P into the BaP. At times, a long, narrow part of the FLBP existed to the northwest of the fast ice in the FLBP. When this occurred, the D15P was connected with the FLBP, and sea ice was exported from the D15P into the FLBP. The D15P was far away from the DaP, and they were never connected.
The connections of and interactions between the three polynyas in eastern Prydz Bay, except for D15P, are important and regular in the polynya system. The connection of the three polynyas (DaP, BaP, and FLBP) can even be considered constant, because the only barrier between the three polynyas is the fast ice in the FLBP, which does explicitly divide these three polynyas. When the massive sea ice formed in the BaP was exported through the channel between the FLBP and the DaP, the concentrated thick floe ice occupying the channel divided the three polynyas explicitly, based on the identification of the polynyas from the sea ice concentration data. In 2008, the FLBP and the DaP merged into one polynya after the disappearance of the BaP, and no apparent thick sea ice was present between the FLBP and the DaP when those two polynyas were open.

4.3. Activity and Influence of the Group of Giant Icebergs

One group of giant icebergs drifted and became grounded for a long period of time in Prydz Bay during September 2007 and February 2009 (Figure 11). The giant iceberg group initially contained two icebergs (B15b and B15r). The iceberg group entered the eastern part of Prydz Bay and drifted westward along the slope current in mid-2006. The iceberg group entered the continental shelf in the eastern part of the Prydz Channel in October 2006 and drifted eastward due to the force of the Prydz Gyre. The iceberg group steadily became grounded in the southwestern part of the fast ice in the FLBP in mid-September 2007. Iceberg B15t broke off from Iceberg B15r in 2008. Iceberg B15t moved northward in January 2009 and turned eastward due to the topography of the shoal. Then, Iceberg B15t turned southward until it reached the channel between the FLBP and the DaP; it then drifted south-westward along the channel and finally gradually left Prydz Bay. Iceberg B15b began moving southward in February 2009 and collided with Iceberg B15r, causing Iceberg B15r to leave the grounding point. Then, they both moved southward. The three icebergs met in the DaP in mid-March before they moved westward and left Prydz Bay.
The giant iceberg group had a significant influence on the polynyas during its drift period in Prydz Bay. The area of the ice barrier of the FLBP increased remarkably because of the grounding of the giant iceberg group in mid-September 2007. The fast ice in the FLBP was not completely disintegrated/melted because of the existence of the giant iceberg group during the summer of 2007–2008, while the fast ice did completely disintegrate/melt during the summer in normal years during the study period. The fast ice developed earlier in the austral winter of 2008 due to the impact of the giant iceberg group, i.e., the fast ice did not completely disappear, and a larger and higher latitude (exceeds 67.5°S) ice barrier was finally formed in the eastern part of FLBP.
The narrow channel between the FLBP and the DaP for exporting ice from the BaP was narrowed by the higher latitude ice barrier. The BaP was closed starting in mid-September 2008 due to the limited export of sea ice from the BaP caused by the bottleneck effect, and peculiarly, a huge area of fast ice was formed from the FLB to the WIS in Prydz Bay (Figure 11b). This huge area of fast ice disintegrated starting in the FLB when the melting season began. The fast ice in the FLBP disappeared in January 2009, but the massive area of fast ice existed in the BaP until the end of February. A new cycle started with the formation of new sea ice in March 2009.
The FLBP and DaP easily merged into one polynya due to the lack of sea ice exported from the BaP when the BaP was closed in 2008, and the total area of the FLBP and the DaP increased due to the more flexible development. However, the variation in the polynya area exhibited a synoptic characteristic and was strongly associated with the atmospheric conditions. Thus, quantitative analysis of the impacts of the grounding of the giant icebergs on the polynya area could not be conducted in this study. The grounding of the giant icebergs did not have an impact on the D15P because of the larger distance between the giant iceberg group and the D15P.

4.4. Relationship between the Ice Barrier and Wind Direction with the Maximum Correlation Coefficient for the Wind and Polynya Area

The four polynyas can be classified into three types according to the simplified shape of their ice barriers (Figure 12): DaP with a linear ice barrier (Figure 12a), BaP and D15P with a concave corner ice barrier (Figure 12b), and FLBP with a convex corner ice barrier (Figure 12c). For the DaP with the simplest shape ice barrier, its area will increase most significantly when the direction of sea ice drift (shown by red arrows in Figure 12a) is perpendicular to the linear ice barrier. Because the direction of the sea ice movement is slightly (by 10° ± 5°) to the left of the direction of the surface wind within the polynya [31], the wind direction could be determined, as shown by the black arrows in Figure 12a. In this direction, wind promotes the most effective expansion of the polynya, so this wind direction is just the particular direction in which the polynya area and wind speed has the best correlation, which was discussed in Section 3.3. The other two types of ice barrier can be simplified to a linear ice barrier that is perpendicular to the direction of sea ice drift within the polynya, which is called the equivalent linear ice barrier of polynya, as shown by the orange line in Figure 12b,c. In an ideal coastal polynya, only driven by surface wind with a constant speed, the polynya reaches its maximum area when the sea ice drift direction is perpendicular to the equivalent linear ice barrier of the polynya, and the wind blows about 10° to the right of the direction of the sea ice motion. Most wind-driven polynyas in Antarctica can be classified into one of the three types of polynya shown in Figure 12, so its equivalent linear ice barrier can be derived and a particular wind direction that benefits winds to enlarge the polynya can be given.

5. Conclusions

In this study, remote sensing data were used to analyse the variability and formation mechanism of the polynyas in eastern Prydz Bay. Based on the results of this study, the following conclusions were drawn.
Four polynyas were identified in eastern Prydz Bay, including two coastal polynyas (BaP and DaP) and two offshore polynyas (FLBP and D15P), constituting a complicated polynya system. The four polynyas are close to each other, and their developments are limited and influenced by each other. A narrow channel located between the FLBP and the DaP is the main channel for the export of the sea ice formed in the BaP. The development of the DaP is always restricted by the sea ice exported from the BaP through this channel.
The four polynyas are mainly driven by wind, and three of them (the BaP, FLBP, and D15P) have similar correlation coefficients for polynya area and wind, except for DaP, which is restricted by the sea ice exported from the BaP. The correlation coefficients for the polynya area and wind speed in the BaP, FLBP, and D15P are between 0.2 and 0.4 but can reach 0.5 in a particular direction, while that in DaP can reach 0.45. The ranges of the particular wind directions with the maximum correlation coefficients are different for the different polynyas (320–335° for BaP and DaP, 290–325° for FLBP, and 320–345° for D15P). The different wind directions are regulated by the ice barriers of the polynyas, and the correlation coefficient is the largest when the wind blows about 10° to the right of the direction perpendicular to the equivalent linear ice barrier.
The ice barrier of the BaP is composed of giant tabular iceberg D15, the WIS, and the coastline; the ice barrier of the DaP is composed of a small island, a small ice shelf, and landfast ice anchored by an assemblage of small icebergs. The FLBP is a special wind-driven polynya, and its ice barrier is composed of offshore fast ice anchored by an assemblage of small icebergs. Similar to the FLBP, the ice barrier of the D15P is composed of an ice finger anchored by an assemblage of small icebergs close to the northern tip of Iceberg D15. Due to their different types of ice barriers, the polynyas have different degrees of instability. The FLBP is the most instable polynya, and its maximum area is about four times the mean area due to its changeable ice barrier, formed by first-year fast ice. The BaP is the most stable polynya, and its maximum area is only about 2.5 times the mean area due to its stable ice barrier consisting of the coastline, ice shelf and grounding giant iceberg. The ice barriers of all four polynyas were related to the grounding of icebergs, which indicates the importance of grounding icebergs for the formation and variability of polynyas in the shelf waters around Antarctica.
The assemblages of small icebergs that anchored fast ice as the ice barrier for polynyas in eastern Prydz Bay are located in water shallower than 200 m, which is just equal to the drafts of the small icebergs (long axis of <500 m) in Antarctica [32,33,34]. Most of the small icebergs come from the east of Iceberg D15. The icebergs tend to drift along the continental slope from east to west. Masses of small icebergs enter the continental shelf region, while large icebergs drift in the deeper side of the continental slope and occasionally enter the continental shelf region.
A group of giant icebergs drifting in eastern Prydz Bay during 2007–2009 changed the shape and area of the polynyas significantly. Influenced by the grounding of the giant icebergs, the FLBP and DaP merged into one polynya when BaP closed, starting in mid-September 2008. The intrusion and long-term grounding of giant icebergs in the polynyas have significant impacts on the formation and maintenance of the polynyas. However, the possibility of a giant iceberg entering a polynya is very small, as only one giant iceberg group entered the polynya region and became grounded during the 10-year study period.

Author Contributions

S.H. carried out the complete analysis and drafted the manuscript. J.S. supervised the study and revised the manuscript. All authors have read and agreed to the published version of the manuscript.

Funding

This study was supported by the National Natural Science Foundation of China (No. 41976217), the National Key R&D Program of China (No. 2018YFA0605701), and the Chinese Arctic and Antarctic Administration (IRASCC2020-2022).

Acknowledgments

We would like to thank the Integrated Climate Data Centre (ICDC), University of Hamburg, for providing the AMSR-E sea ice concentration dataset (cen.uni-hamburg.de, last access date: 1 December 2021), the National Aeronautics and Space Administration (NASA) for providing the MODIS visible images (ladsweb.modaps.eosdis.nasa.gov, last access date: 1 December 2021), the European Space Agency (ESA) for providing the Envisat ASAR data (earth.esa.int, last access date: 1 December 2021), the European Centre for Medium-Range Weather Forecast (ECMWF) for providing the wind speed at 10 m reanalysis dataset (cds.climate.copernicus.eu, last access date: 1 December 2021), and the National Snow and Ice Data Centre (NSIDC) for providing the daily sea ice motion vector dataset (nsidc.org, last access date: 1 December 2021).We are grateful to Stephen Rintoul, Robert Massom, Alexander Fraser, Kan Zeng, Yongming Sun, Guijun Guo, Qian Shi for their help in the study. We truly appreciate anonymous reviewers who have helped to improve the quality of the manuscript. This work is also supported in part by the Centre for Southern Hemisphere Oceans Research (CSHOR), a partnership between the Qingdao National Laboratory for Marine Science and Technology (QNLM, China) and the Commonwealth Scientific and Industrial Research Organization (CSIRO, Australia). Saisai Hou is also supported by the China Scholarship Council (201806330013).

Conflicts of Interest

The authors declare that there are no conflict of interest.

References

  1. Smith, S.D.; Muench, R.D.; Pease, C.H. Polynyas and Leads: An Overview of Physical Processes and Environment. J. Geophys. Res. 1990, 95, 9461. [Google Scholar] [CrossRef]
  2. Morales Maqueda, M.A.; Willmott, A.J.; Biggs, N.R.T. Polynya Dynamics: A Review of Observations and Modeling. Rev. Geophys. 2004, 42, RG1004. [Google Scholar] [CrossRef] [Green Version]
  3. Barber, D.G.; Massom, R.A. Chapter 1 The Role of Sea Ice in Arctic and Antarctic Polynyas. In Polynyas: Windows to the World; Elsevier: Amsterdam, The Netherlands, 2007; Volume 74, pp. 1–54. [Google Scholar]
  4. Markus, T.; Kottmeier, C.; Fahrbach, E. Ice Formation in Coastal Polynyas in the Weddell Sea and Their Impact on Oceanic Salinity. Antarct. Sea Ice Phys. Process. Interact. Var. 1998, 74, 273–292. [Google Scholar]
  5. Renfrew, I.A.; King, J.C. Coastal Polynyas in the Southern Weddell Sea: Variability of the Surface Energy Budget. J. Geophys. Res. 2002, 107, 16-1–16-22. [Google Scholar] [CrossRef] [Green Version]
  6. Tamura, T.; Ohshima, K.I.; Nihashi, S. Mapping of Sea Ice Production for Antarctic Coastal Polynyas. Geophys. Res. Lett. 2008, 35, L07606. [Google Scholar] [CrossRef]
  7. Williams, G.D.; Aoki, S.; Jacobs, S.S.; Rintoul, S.R.; Tamura, T.; Bindoff, N.L. Antarctic Bottom Water from the Adélie and George V Land Coast, East Antarctica (140–149° E). J. Geophys. Res. 2010, 115, C04027. [Google Scholar] [CrossRef]
  8. Ohshima, K.I.; Fukamachi, Y.; Williams, G.D.; Nihashi, S.; Roquet, F.; Kitade, Y.; Tamura, T.; Hirano, D.; Herraiz-Borreguero, L.; Field, I.; et al. Antarctic Bottom Water Production by Intense Sea-Ice Formation in the Cape Darnley Polynya. Nat. Geosci. 2013, 6, 235–240. [Google Scholar] [CrossRef]
  9. Rintoul, S.R. On the Origin and Influence of Adélie Land Bottom Water. In Ocean, Ice, and Atmosphere: Interactions at the Antarctic Continental Margin, Antarctic Research Series; 2013; Volume 75, pp. 151–171. Available online: https://agupubs.onlinelibrary.wiley.com/doi/10.1029/AR075p0151?__cf_chl_jschl_tk__=aQlZPFJJjGcwi5XD4DmzsYURfJctSBdl.Blfpiiwmw4-1639469933-0-gaNycGzNDz0 (accessed on 8 December 2021).
  10. Williams, G.D.; Herraiz-Borreguero, L.; Roquet, F.; Tamura, T.; Ohshima, K.I.; Fukamachi, Y.; Fraser, A.D.; Gao, L.; Chen, H.; McMahon, C.R.; et al. The Suppression of Antarctic Bottom Water Formation by Melting Ice Shelves in Prydz Bay. Nat. Commun. 2016, 7, 12577. [Google Scholar] [CrossRef] [PubMed]
  11. Smith, N.R.; Zhaoqian, D.; Kerry, K.R.; Wright, S. Water Masses and Circulation in the Region of Prydz Bay, Antarctica. Deep Sea Res. Part A Oceanogr. Res. Pap. 1984, 31, 1121–1147. [Google Scholar] [CrossRef]
  12. Yabuki, T.; Suga, T.; Hanawa, K.; Matsuoka, K.; Kiwada, H.; Watanabe, T. Possible Source of the Antarctic Bottom Water in the Prydz Bay Region. J. Oceanogr. 2006, 62, 649–655. [Google Scholar] [CrossRef]
  13. Schaffer, J.; Timmermann, R.; Arndt, J.E.; Kristensen, S.S.; Mayer, C.; Morlighem, M.; Steinhage, D. A Global, High-Resolution Data Set of Ice Sheet Topography, Cavity Geometry, and Ocean Bathymetry. Earth Syst. Sci. Data 2016, 8, 543–557. [Google Scholar] [CrossRef] [Green Version]
  14. Massom, R.A.; Harris, P.T.; Michael, K.J.; Potter, M.J. The Distribution and Formative Processes of Latent-Heat Polynyas in East Antarctica. Ann. Glaciol. 1998, 27, 420–426. [Google Scholar] [CrossRef] [Green Version]
  15. Arrigo, K.R. Phytoplankton Dynamics within 37 Antarctic Coastal Polynya Systems. J. Geophys. Res. 2003, 108, 3271. [Google Scholar] [CrossRef]
  16. Markus, T.; Burns, B.A. A Method to Estimate Subpixel-Scale Coastal Polynyas with Satellite Passive Microwave Data. J. Geophys. Res. 1995, 100, 4473. [Google Scholar] [CrossRef]
  17. Tamura, T.; Ohshima, K.I.; Markus, T.; Cavalieri, D.J.; Nihashi, S.; Hirasawa, N. Estimation of Thin Ice Thickness and Detection of Fast Ice from SSM/I Data in the Antarctic Ocean. J. Atmos. Ocean. Technol. 2007, 24, 1757–1772. [Google Scholar] [CrossRef]
  18. Tamura, T.; Ohshima, K.I.; Fraser, A.D.; Williams, G.D. Sea Ice Production Variability in Antarctic Coastal Polynyas. J. Geophys. Res. Ocean. 2016, 121, 2967–2979. [Google Scholar] [CrossRef] [Green Version]
  19. Nihashi, S.; Ohshima, K.I. Circumpolar Mapping of Antarctic Coastal Polynyas and Landfast Sea Ice: Relationship and Variability. J. Clim. 2015, 28, 3650–3670. [Google Scholar] [CrossRef]
  20. Nihashi, S.; Ohshima, K.I.; Tamura, T. Sea-Ice Production in Antarctic Coastal Polynyas Estimated From AMSR2 Data and Its Validation Using AMSR-E and SSM/I-SSMIS Data. IEEE J. Sel. Top. Appl. Earth Obs. Remote Sens. 2017, 10, 3912–3922. [Google Scholar] [CrossRef] [Green Version]
  21. Herraiz-Borreguero, L.; Church, J.A.; Allison, I.; Peña-Molino, B.; Coleman, R.; Tomczak, M.; Craven, M. Basal Melt, Seasonal Water Mass Transformation, Ocean Current Variability, and Deep Convection Processes along the Amery Ice Shelf Calving Front, East Antarctica. J. Geophys. Res. Ocean. 2016, 121, 4946–4965. [Google Scholar] [CrossRef] [Green Version]
  22. Kaleschke, L.; Lüpkes, C.; Vihma, T.; Haarpaintner, J.; Bochert, A.; Hartmann, J.; Heygster, G. SSM/I Sea Ice Remote Sensing for Mesoscale Ocean-Atmosphere Interaction Analysis. Can. J. Remote Sens. 2001, 27, 526–537. [Google Scholar] [CrossRef]
  23. Spreen, G.; Kaleschke, L.; Heygster, G. Sea Ice Remote Sensing Using AMSR-E 89-GHz Channels. J. Geophys. Res. 2008, 113, C02S03. [Google Scholar] [CrossRef] [Green Version]
  24. Cheng, Y.; Shi, J.; Zheng, S. Temporal and Spatial Variation of the Mackenzie Bay Polynya, Antarctica and Its Main Impact Factors. Period. Ocean Univ. China 2012, 42, 1–9. [Google Scholar]
  25. Hersbach, H.; Bell, B.; Berrisford, P.; Biavati, G.; Horányi, A.; Muñoz Sabater, J.; Nicolas, J.; Peubey, C.; Radu, R.; Rozum, I.; et al. ERA5 Hourly Data on Single Levels from 1979 to Present. Copernicus Climate Change Service (C3S) Climate Data Store (CDS). 2018. Available online: https://cds.climate.copernicus.eu/cdsapp#!/dataset/reanalysis-era5-single-levels?tab=overview (accessed on 29 September 2020).
  26. Tschudi, M.; Meier, W.N.; Stewart, J.S.; Fowler, C.; Maslanik, J. Polar Pathfinder Daily 25 Km EASE-Grid Sea Ice Motion Vectors, Version 4. [2002–2011]; NASA National Snow and Ice Data Center Distributed Active Archive Center: Boulder, CO, USA, 2019. [Google Scholar] [CrossRef]
  27. Guo, G.; Shi, J.; Gao, L.; Tamura, T.; Williams, G.D. Reduced Sea Ice Production Due to Upwelled Oceanic Heat Flux in Prydz Bay, East Antarctica. Geophys. Res. Lett. 2019, 46, 4782–4789. [Google Scholar] [CrossRef] [Green Version]
  28. Herraiz-Borreguero, L.; Coleman, R.; Allison, I.; Rintoul, S.R.; Craven, M.; Williams, G.D. Circulation of Modified Circumpolar Deep Water and Basal Melt beneath the Amery Ice Shelf, East Antarctica. J. Geophys. Res. Ocean. 2015, 120, 3098–3112. [Google Scholar] [CrossRef] [Green Version]
  29. Liang, M.; Shi, J. Variations In Coastal Polynyas In The Alaskan Chukchi Sea And Major Influencing Factors. Chin. J. Polar Res. 2015, 27, 379–391. [Google Scholar]
  30. Massom, R.A.; Hill, K.L.; Lytle, V.I.; Worby, A.P.; Paget, M.J.; Allison, I. Effects of Regional Fast-Ice and Iceberg Distributions on the Behaviour of the Mertz Glacier Polynya, East Antarctica. Ann. Glaciol. 2001, 33, 391–398. [Google Scholar] [CrossRef] [Green Version]
  31. Nakata, K.; Ohshima, K.I.; Nihashi, S.; Kimura, N.; Tamura, T. Variability and Ice Production Budget in the Ross Ice Shelf Polynya Based on a Simplified Polynya Model and Satellite Observations. J. Geophys. Res. Ocean. 2015, 120, 6234–6252. [Google Scholar] [CrossRef] [Green Version]
  32. Aoki, S. Seasonal and Spatial Variations of Iceberg Drift off Dronning Maud Land, Antarctica, Detected by Satellite Scatterometers. J. Oceanogr. 2003, 59, 629–635. [Google Scholar] [CrossRef]
  33. Mazur, A.K.; Wåhlin, A.K.; Kalén, O. The Life Cycle of Small-to Medium-Sized Icebergs in the Amundsen Sea Embayment. Polar Res. 2019, 38, 3313. [Google Scholar] [CrossRef] [Green Version]
  34. Rackow, T.; Wesche, C.; Timmermann, R.; Hellmer, H.H.; Juricke, S.; Jung, T. A Simulation of Small to Giant Antarctic Iceberg Evolution: Differential Impact on Climatology Estimates. J. Geophys. Res. Ocean. 2017, 122, 3170–3190. [Google Scholar] [CrossRef]
Figure 1. Bathymetry of Prydz Bay from Rtopo2 [13]. The thick green line is the outline of the giant grounded tabular iceberg D15. The red squares denote the research stations. The inset in the lower right corner shows the location of the study area.
Remotesensing 13 05089 g001
Figure 2. POF and polynya-masks (the inset in the lower right corner) of the four polynyas in eastern Prydz Bay.
Remotesensing 13 05089 g002
Figure 3. (ai) Daily areas of the four polynyas and the entire polynya system (EPBPS) in eastern Prydz Bay. The solid lines indicate the 10-day running mean, and the dashed yellow lines indicate the original data for the D15P. Note: the left vertical axis is the daily area of the four polynyas, and the right vertical axis is the daily area of the EPBPS.
Remotesensing 13 05089 g003
Figure 4. Rose diagrams of the daily wind (upper row) and sea ice motion vectors (lower row) for each polynya in eastern Prydz Bay. Each subfigure is labelled with the abbreviation of the polynya to which it refers. The legends of each row are presented on the right side of the row.
Remotesensing 13 05089 g004
Figure 5. An example of new ice exported from the BaP occupying the area of the DaP, shown in a MODIS image taken on 28 October 2005. The areas with sea ice concentrations >75% on the corresponding day are denoted by white points. The sea ice motion vectors on the same day of the MODIS image and wind vectors one day before are overlain as blue and magenta arrows, respectively. The red lines indicate a POF of 24%, and the green line is the outline of Iceberg D15.
Remotesensing 13 05089 g005
Figure 6. The correlation coefficients for the direction of the wind components and polynya area in different years. The directions of the wind components with the maximum correlation coefficient for each year are indicated by the white dots connected by the white lines. Each column is labelled with the abbreviation of the polynya it refers to.
Remotesensing 13 05089 g006
Figure 7. Comparison of MODIS visible images (band 1) and ASAR WSM images to show the construction of the ice barriers of (a) BaP, (b) DaP, (c) FLBP, and (d) D15P. The left image in each pair is the MODIS visible image, and the right image is the ASAR WSM image. Important features are labelled: fast ice (FI), ice finger (IF), Iceberg D15 (D15), and West Ice Shelf (WIS). Yellow circles indicate the assemblage of small icebergs inside BaP. The magenta and green boxes indicate a small ice shelf and the island where the Davis Station is located, respectively. The red lines indicate POF = 24%.
Remotesensing 13 05089 g007
Figure 8. Small icebergs inside the fast ice in the eastern part of the FLBP. (a) Northern fast ice in Figure 7c, and (b) southern fast ice in Figure 7c. The small icebergs that never moved during the five-month-long period in 2010 are shown as white pixels. The dark area surrounding the small white icebergs is the fast ice. The background image is an ASAR IMS image taken on 15 October 2010.
Remotesensing 13 05089 g008
Figure 9. Stacked layer composite images of ASAR WSM images taken from January to December 2010. Each image was synthesised using three WSM images in three consecutive months. For instance, (a) January, February and March, (b) February, March and April, and (j) October, November and December.
Remotesensing 13 05089 g009
Figure 10. Shapes of the two types of fast ice in the FLBP in different years from MODIS visible images. The shape of type A fast ice is shown in the images in the first row (ae), and the shape of type B fast ice is shown in the images in the second row (fj). The POF = 24% of the years from 2002 to 2011 is shown by the red lines, and the outline of Iceberg D15 is denoted by the green lines.
Remotesensing 13 05089 g010
Figure 11. (a) The tracks of icebergs B15b, B15r, and B15t in the giant iceberg group, shown by the purple, yellow, and light green circles, respectively. The red stars indicate the positions of iceberg B15b at certain times. The red lines indicate the POF = 24% contour line in the winters of 2002 to 2011, and the yellow line indicates the POF = 24% contour line in the winters from 2002 to 2011, except for 2007 and 2008. The green line indicates the outline of iceberg D15. (b) MODIS Visible image taken on 20 October 2008. The lines and symbols have the same meanings as in (a).
Remotesensing 13 05089 g011
Figure 12. Sketch maps of three ideal wind-driven polynyas. The black arrows indicate the wind direction; the red arrows indicate the direction of the sea ice’s motion; the blue area denotes the polynya; the green box denotes the ice barrier; and the orange line denotes the equivalent linear ice barrier. The red arrow is perpendicular to the ice barrier (in (a)) or the equivalent linear ice barrier (orange line of (b,c)), and the black arrows are slightly (about 10°) to the right of the red arrows.
Remotesensing 13 05089 g012
Table 1. Statistical information about the polynya area for each year in eastern Prydz Bay (Unit: km2). The maximum and minimum values are in bold and italics, respectively.
200320042005200620072008200920102011Mean
Yearly average area
BaP6009517253705521668134895362544963435488
DaP4872313940214957506836554873218441854106
FLBP4579375852854414629856575275266339314651
D15P154814391297126919421612867110713211378
EPBPS17,00813,50915,97216,16119,98914,41316,37711,40315,78015,624
Daily maximum area
BaP14,38413,57312,54113,27414,80812,27612,1621373014,46213,468
DaP15,72613,08113,19310,86518,42717,46612,899714517,30814,012
FLBP22,82816,97418,28116,37617,08316,66119,27914,51318,27817,808
D15P5586456238405132505749403304365254714616
EPBPS58,52539,04443,50338,73752,64640,39440,33829,53254,56044,142
Ratio of maximum daily area to yearly average area
BaP2.392.622.342.402.223.522.272.522.282.51
DaP3.234.173.282.193.644.782.653.274.143.48
FLBP4.994.523.463.712.712.953.655.454.654.01
D15P3.613.172.964.042.603.063.813.304.143.41
EPBPS3.442.892.722.402.632.802.462.593.462.82
Publisher’s Note: MDPI stays neutral with regard to jurisdictional claims in published maps and institutional affiliations.

