
Spatial and Temporal Analyses of Vegetation Changes at Multiple Time Scales in the Qilian Mountains

Abstract
:1. Introduction
2. Study Area and Data
2.1. Study Area
2.2. Data
3. Methods
3.1. Unary Linear Regression Trend Method
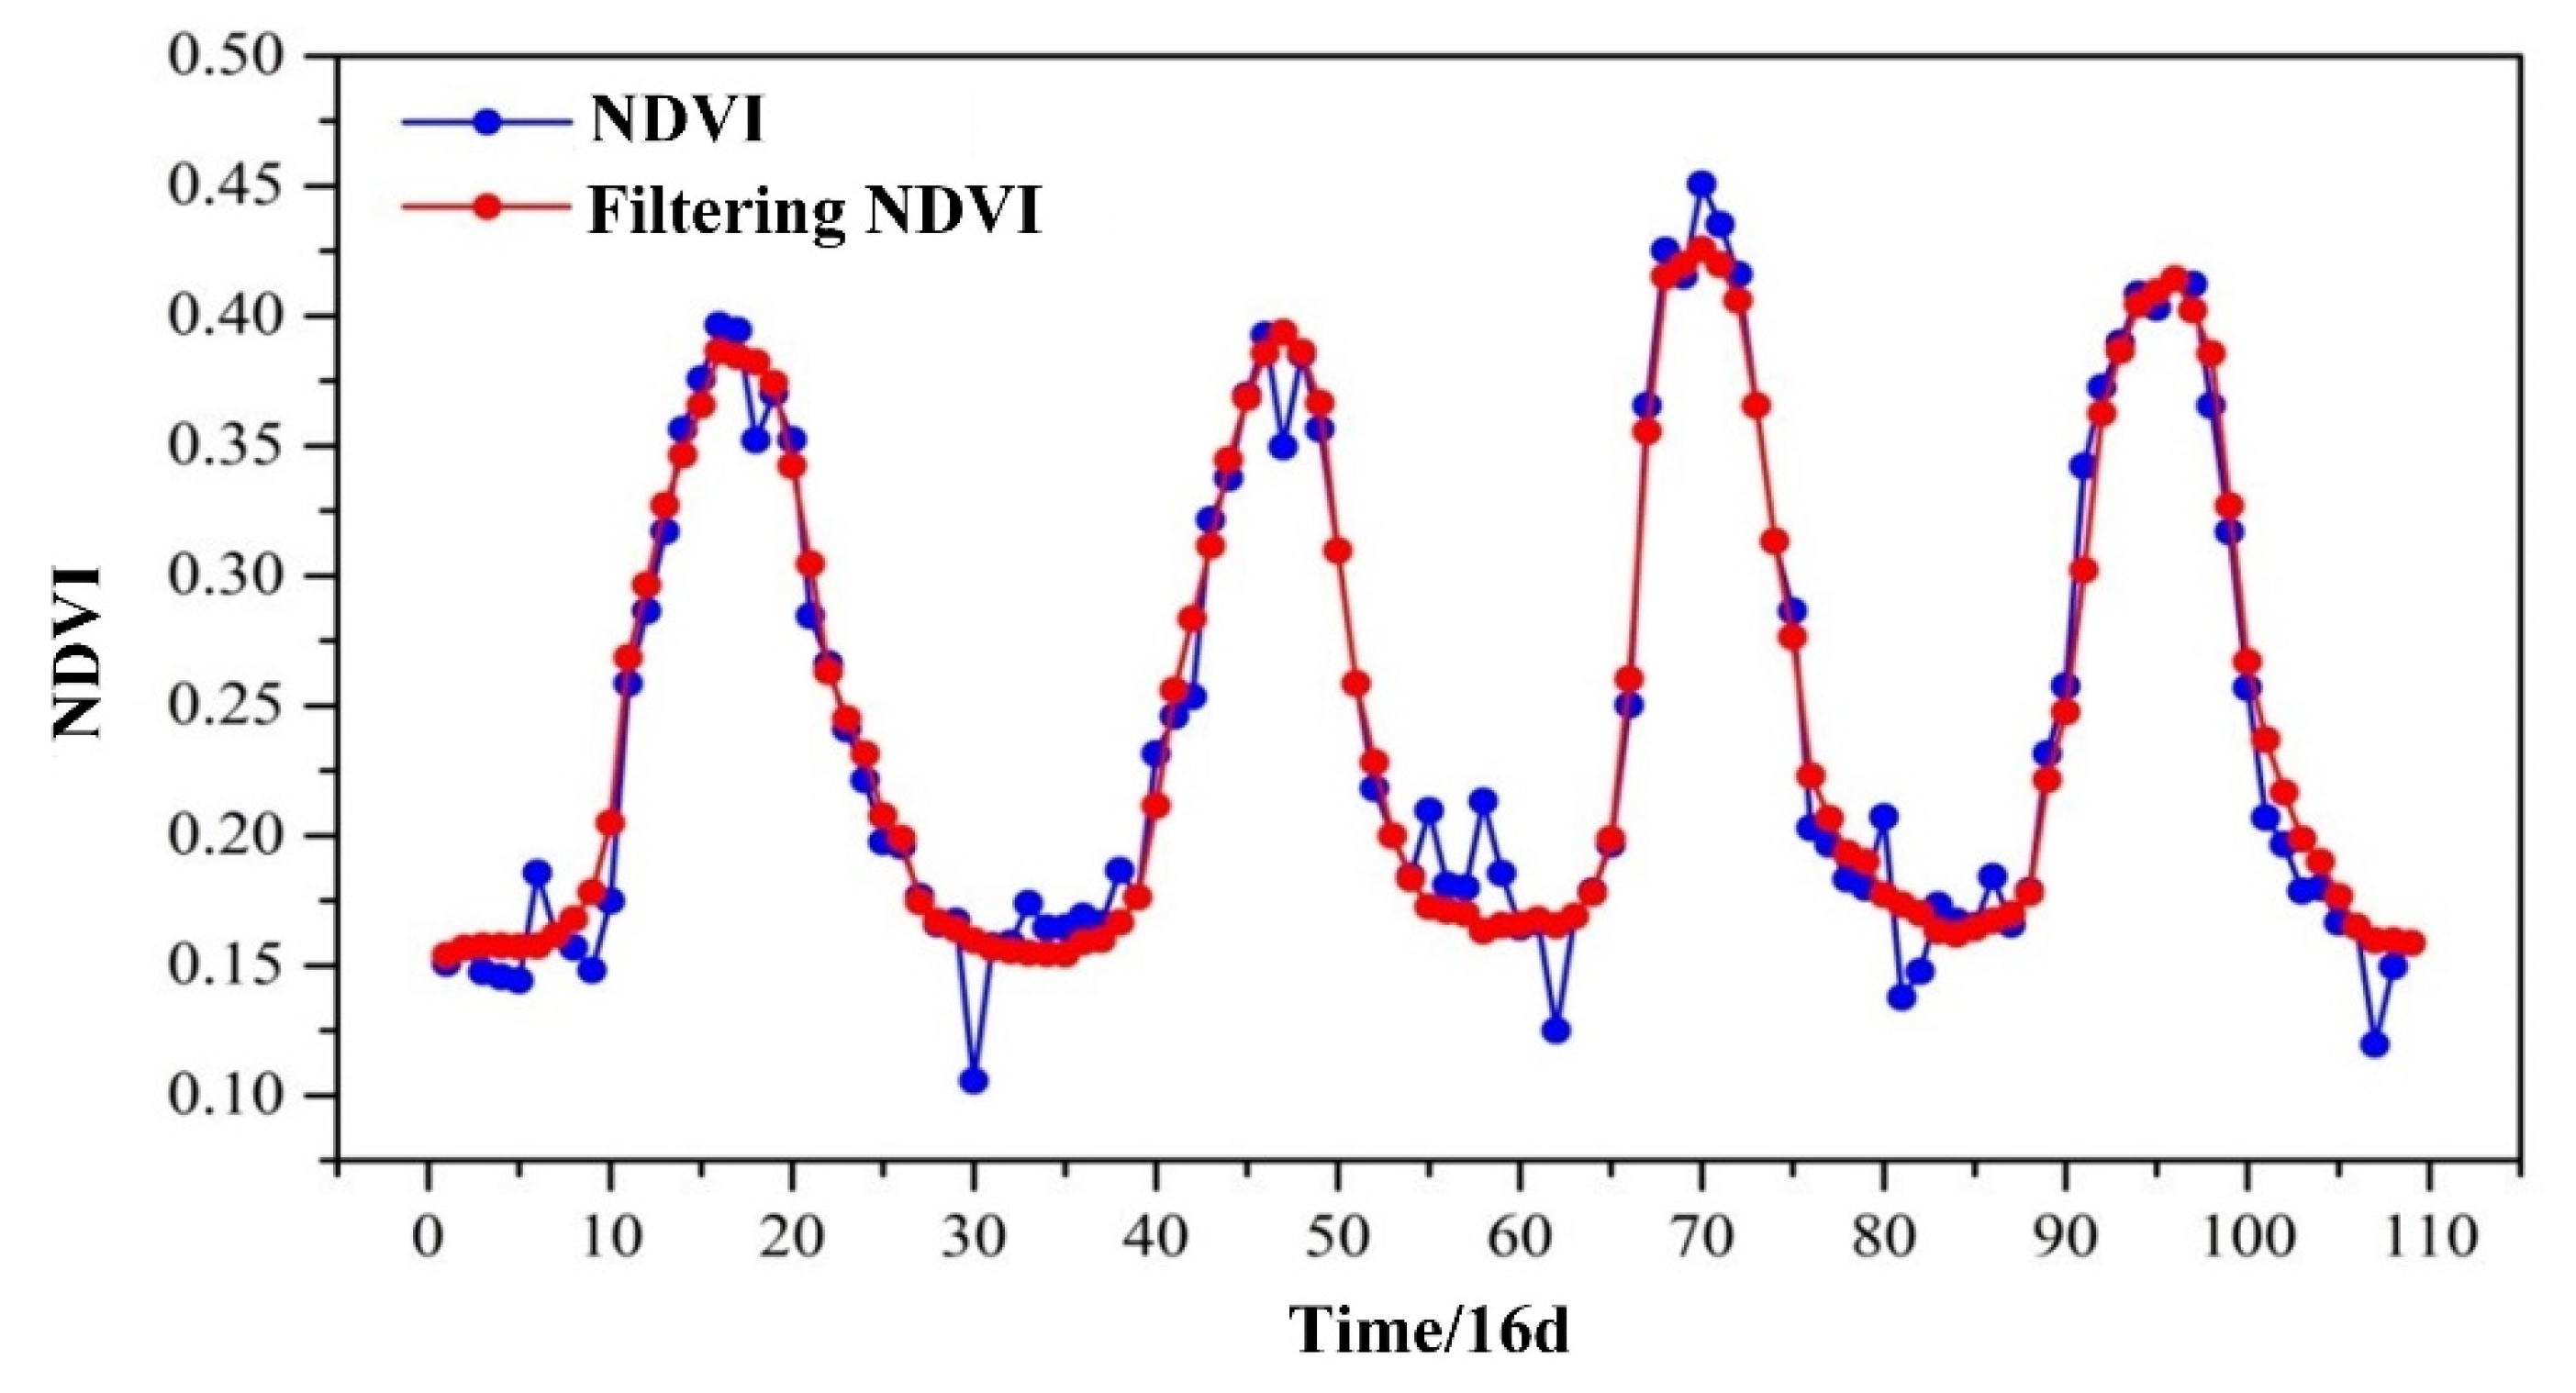
3.2. NDVI Data Fusion
3.3. Ensemble Empirical Mode Decomposition
- Add a certain number of Gaussian white noise to the signal x(t) to obtain a large number of noisy new signals .
- Decompose the new signal by EMD method to obtain the IMF component and the trend term :where and denote the IMF component and trend term, respectively.
- Repeat the above steps for np times; each time, a new white noise sequence with the same amplitude is added.
- The IMFs and obtained from each decomposition are pooled and averaged so that the added white noises cancel each other as follows.where is the ith IMF component obtained by decomposition of the initial signal, and is the trend term.
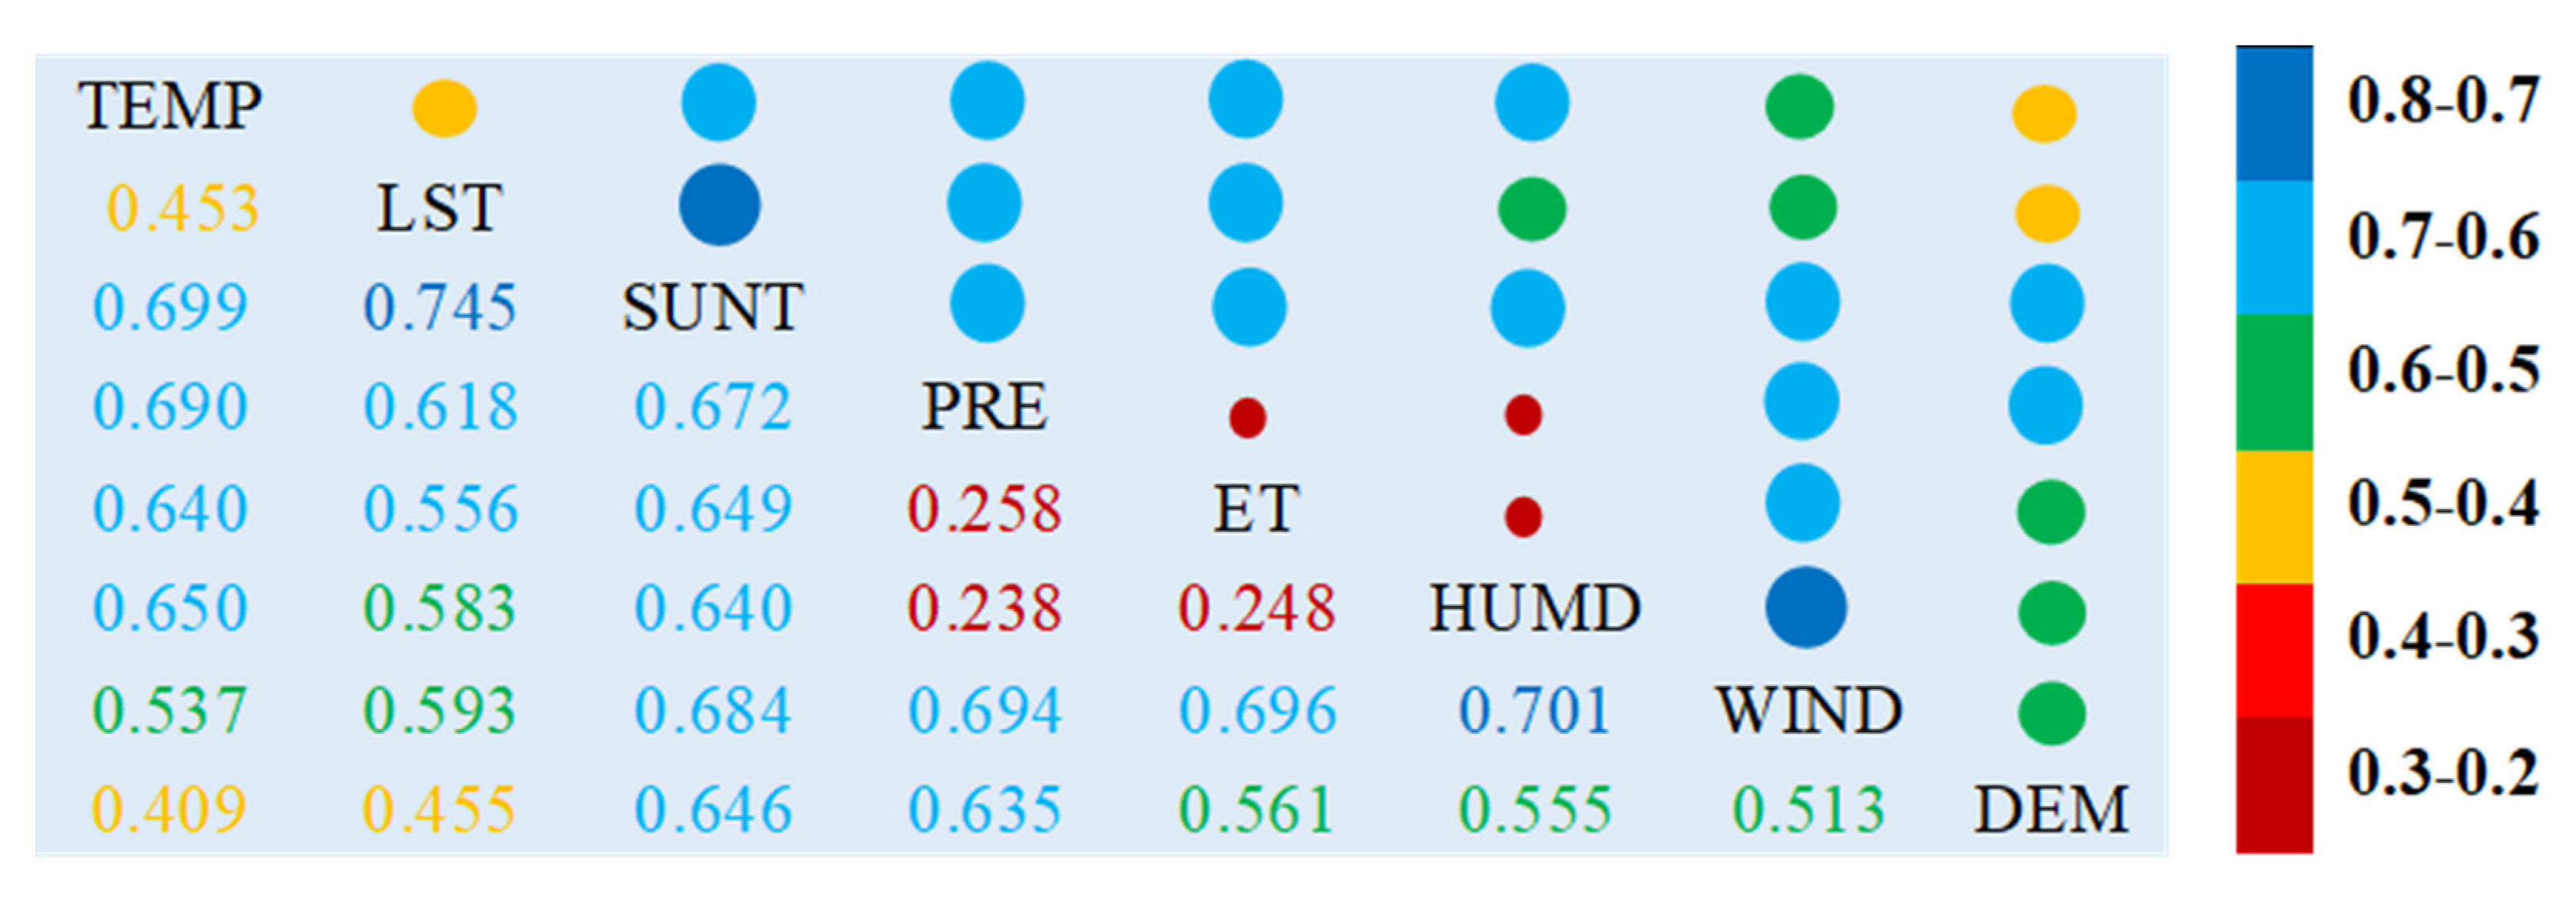
3.4. Geodetector
3.5. Correlation Analysis
4. Results
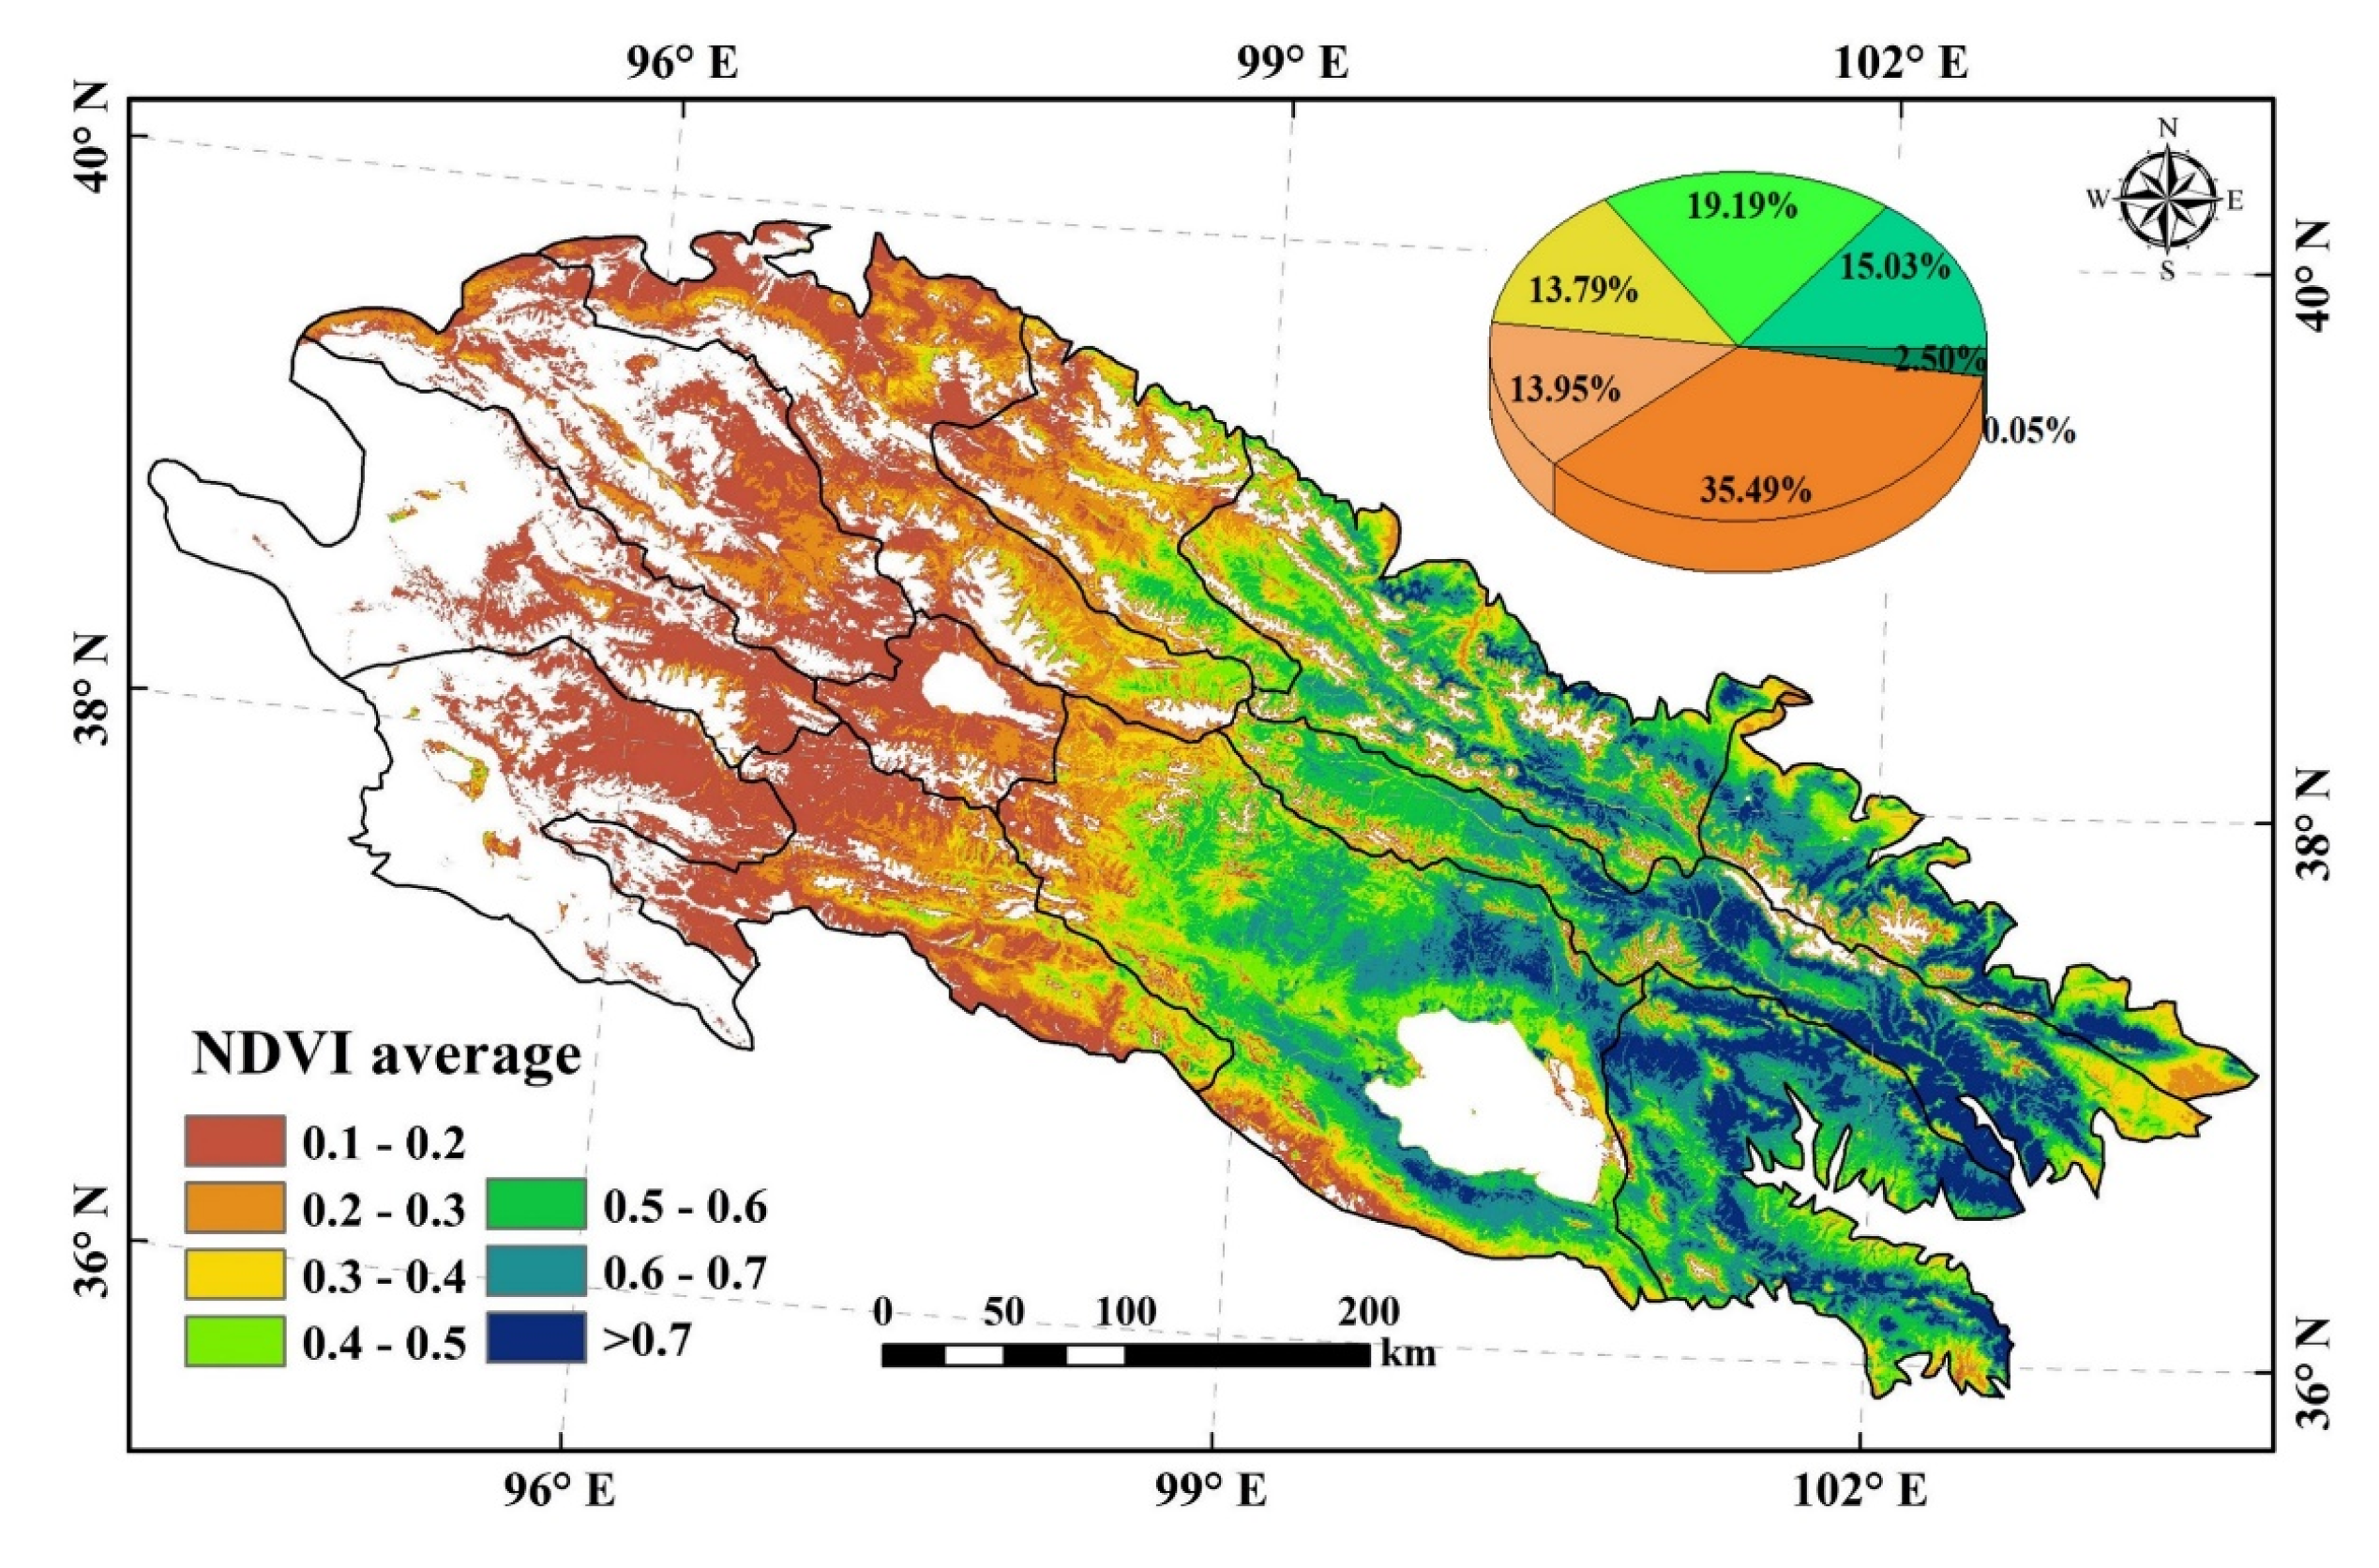
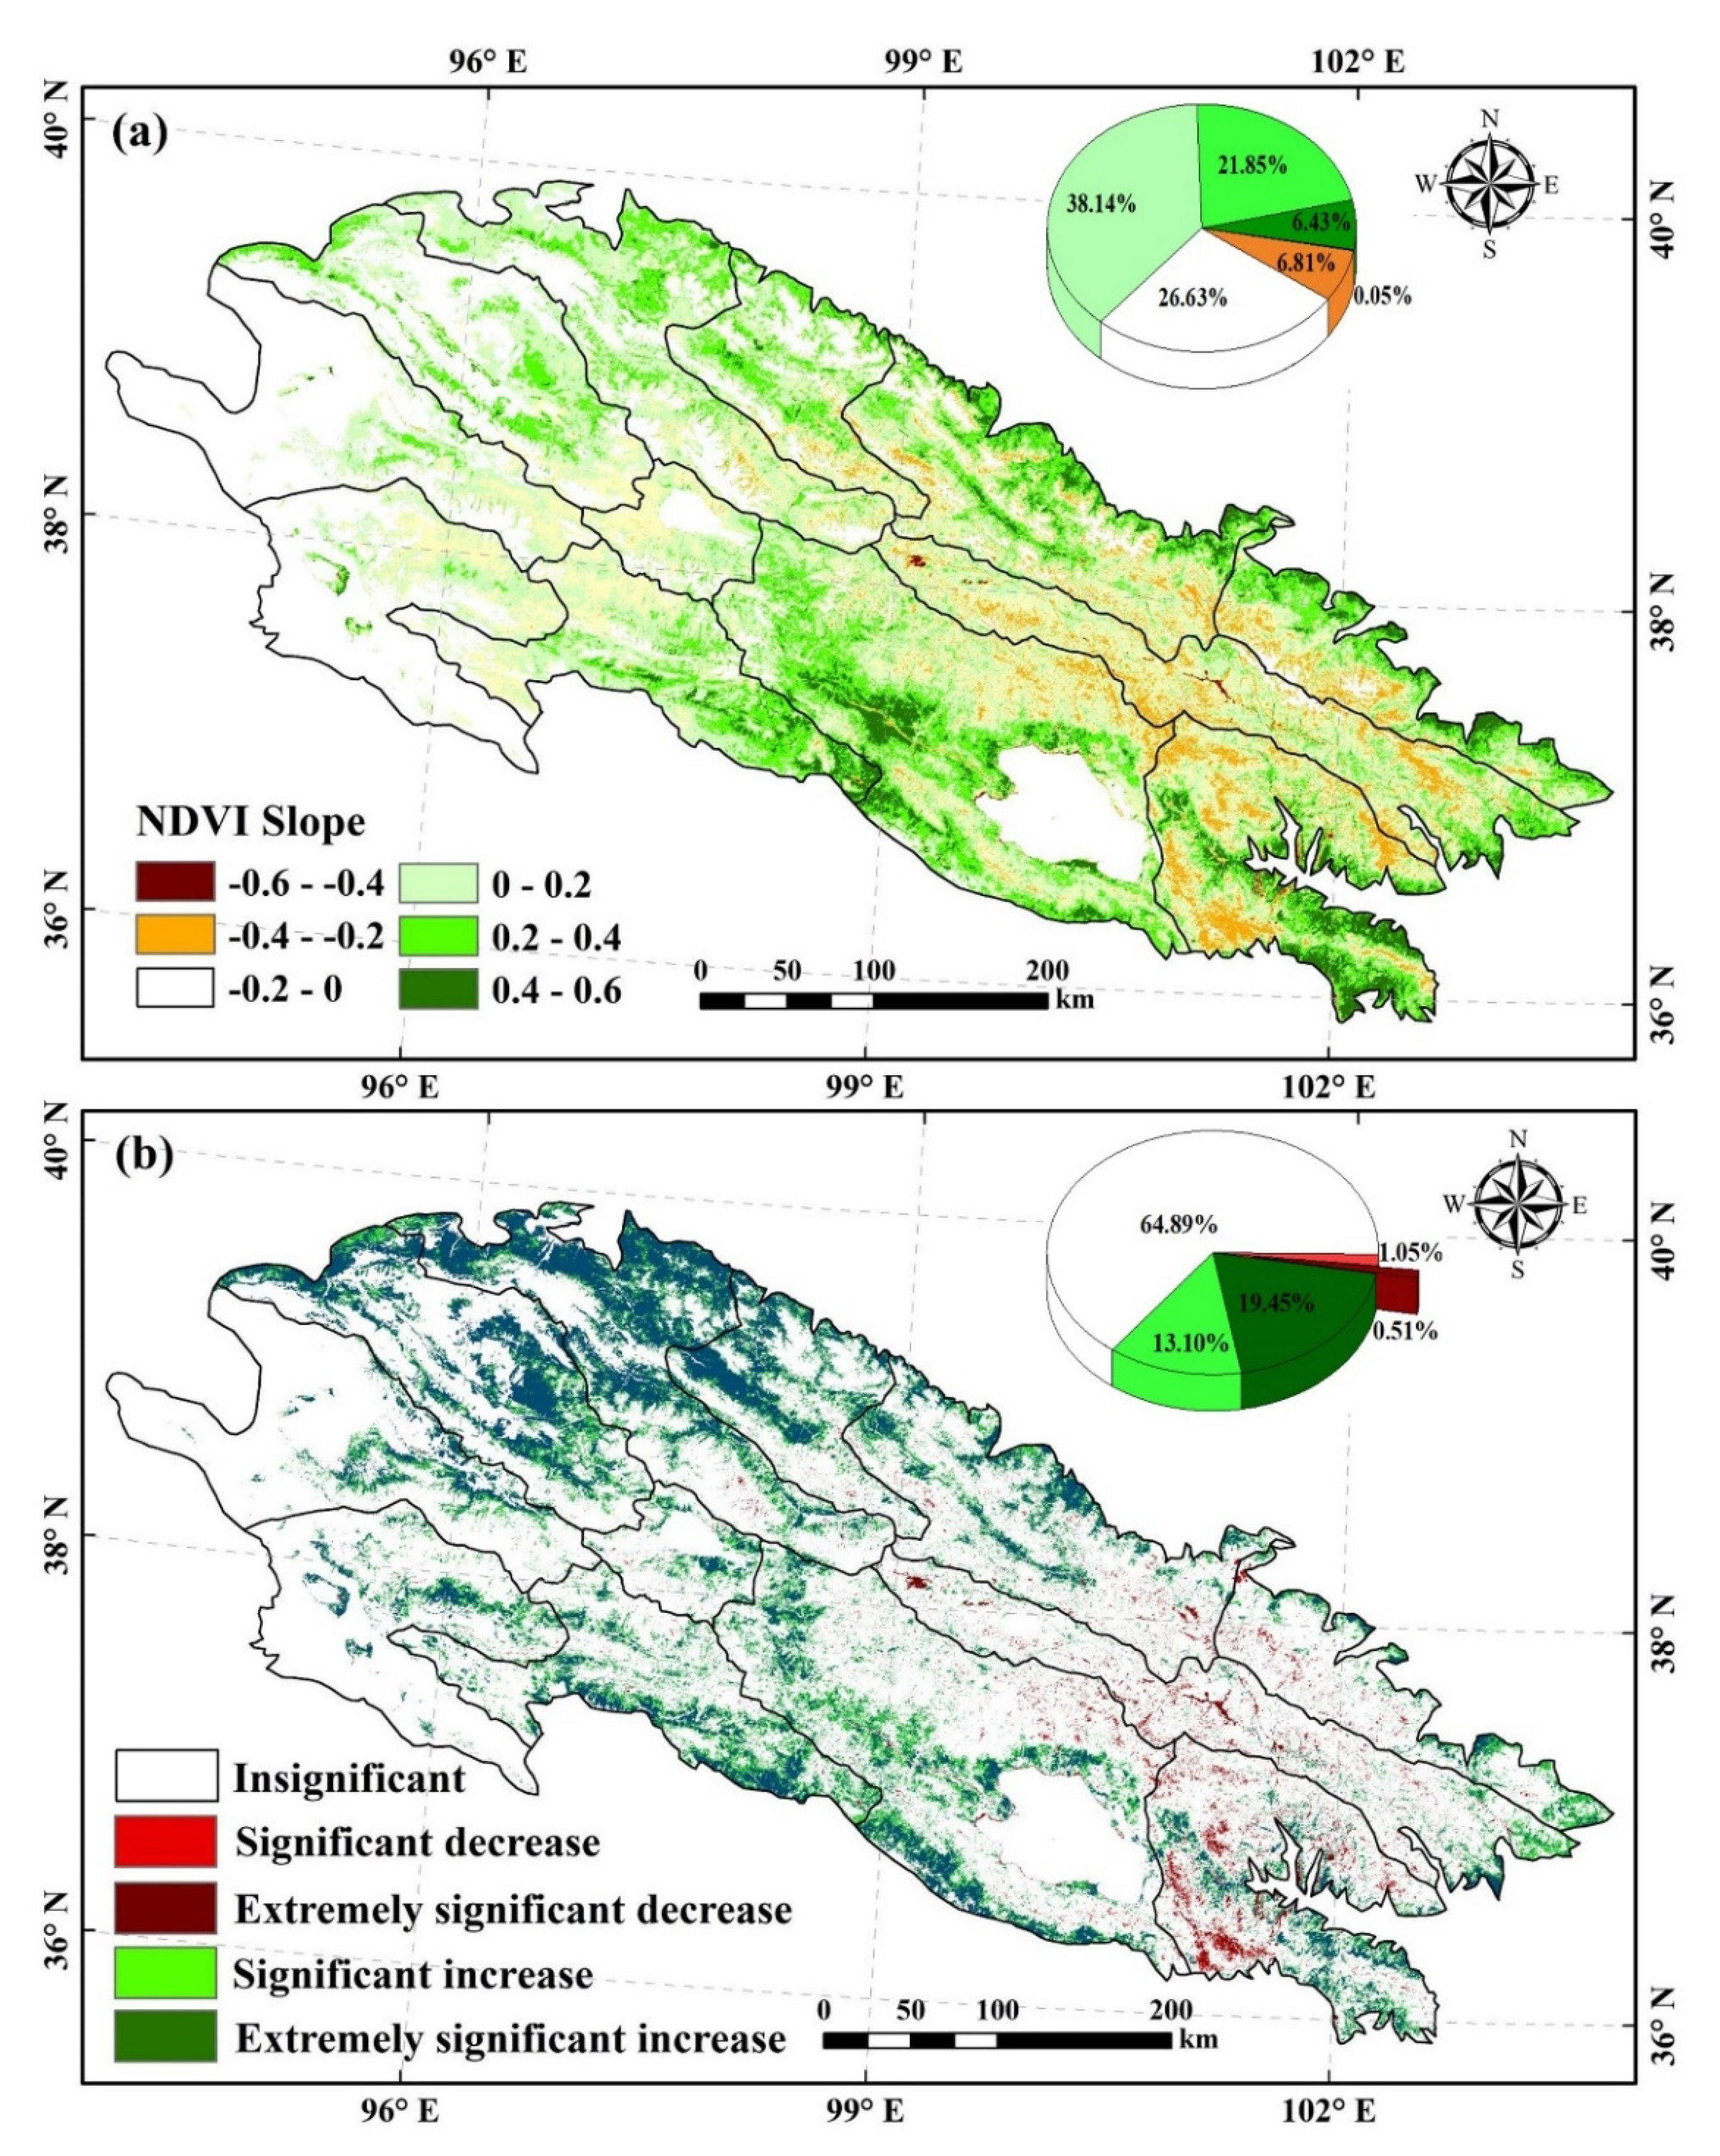
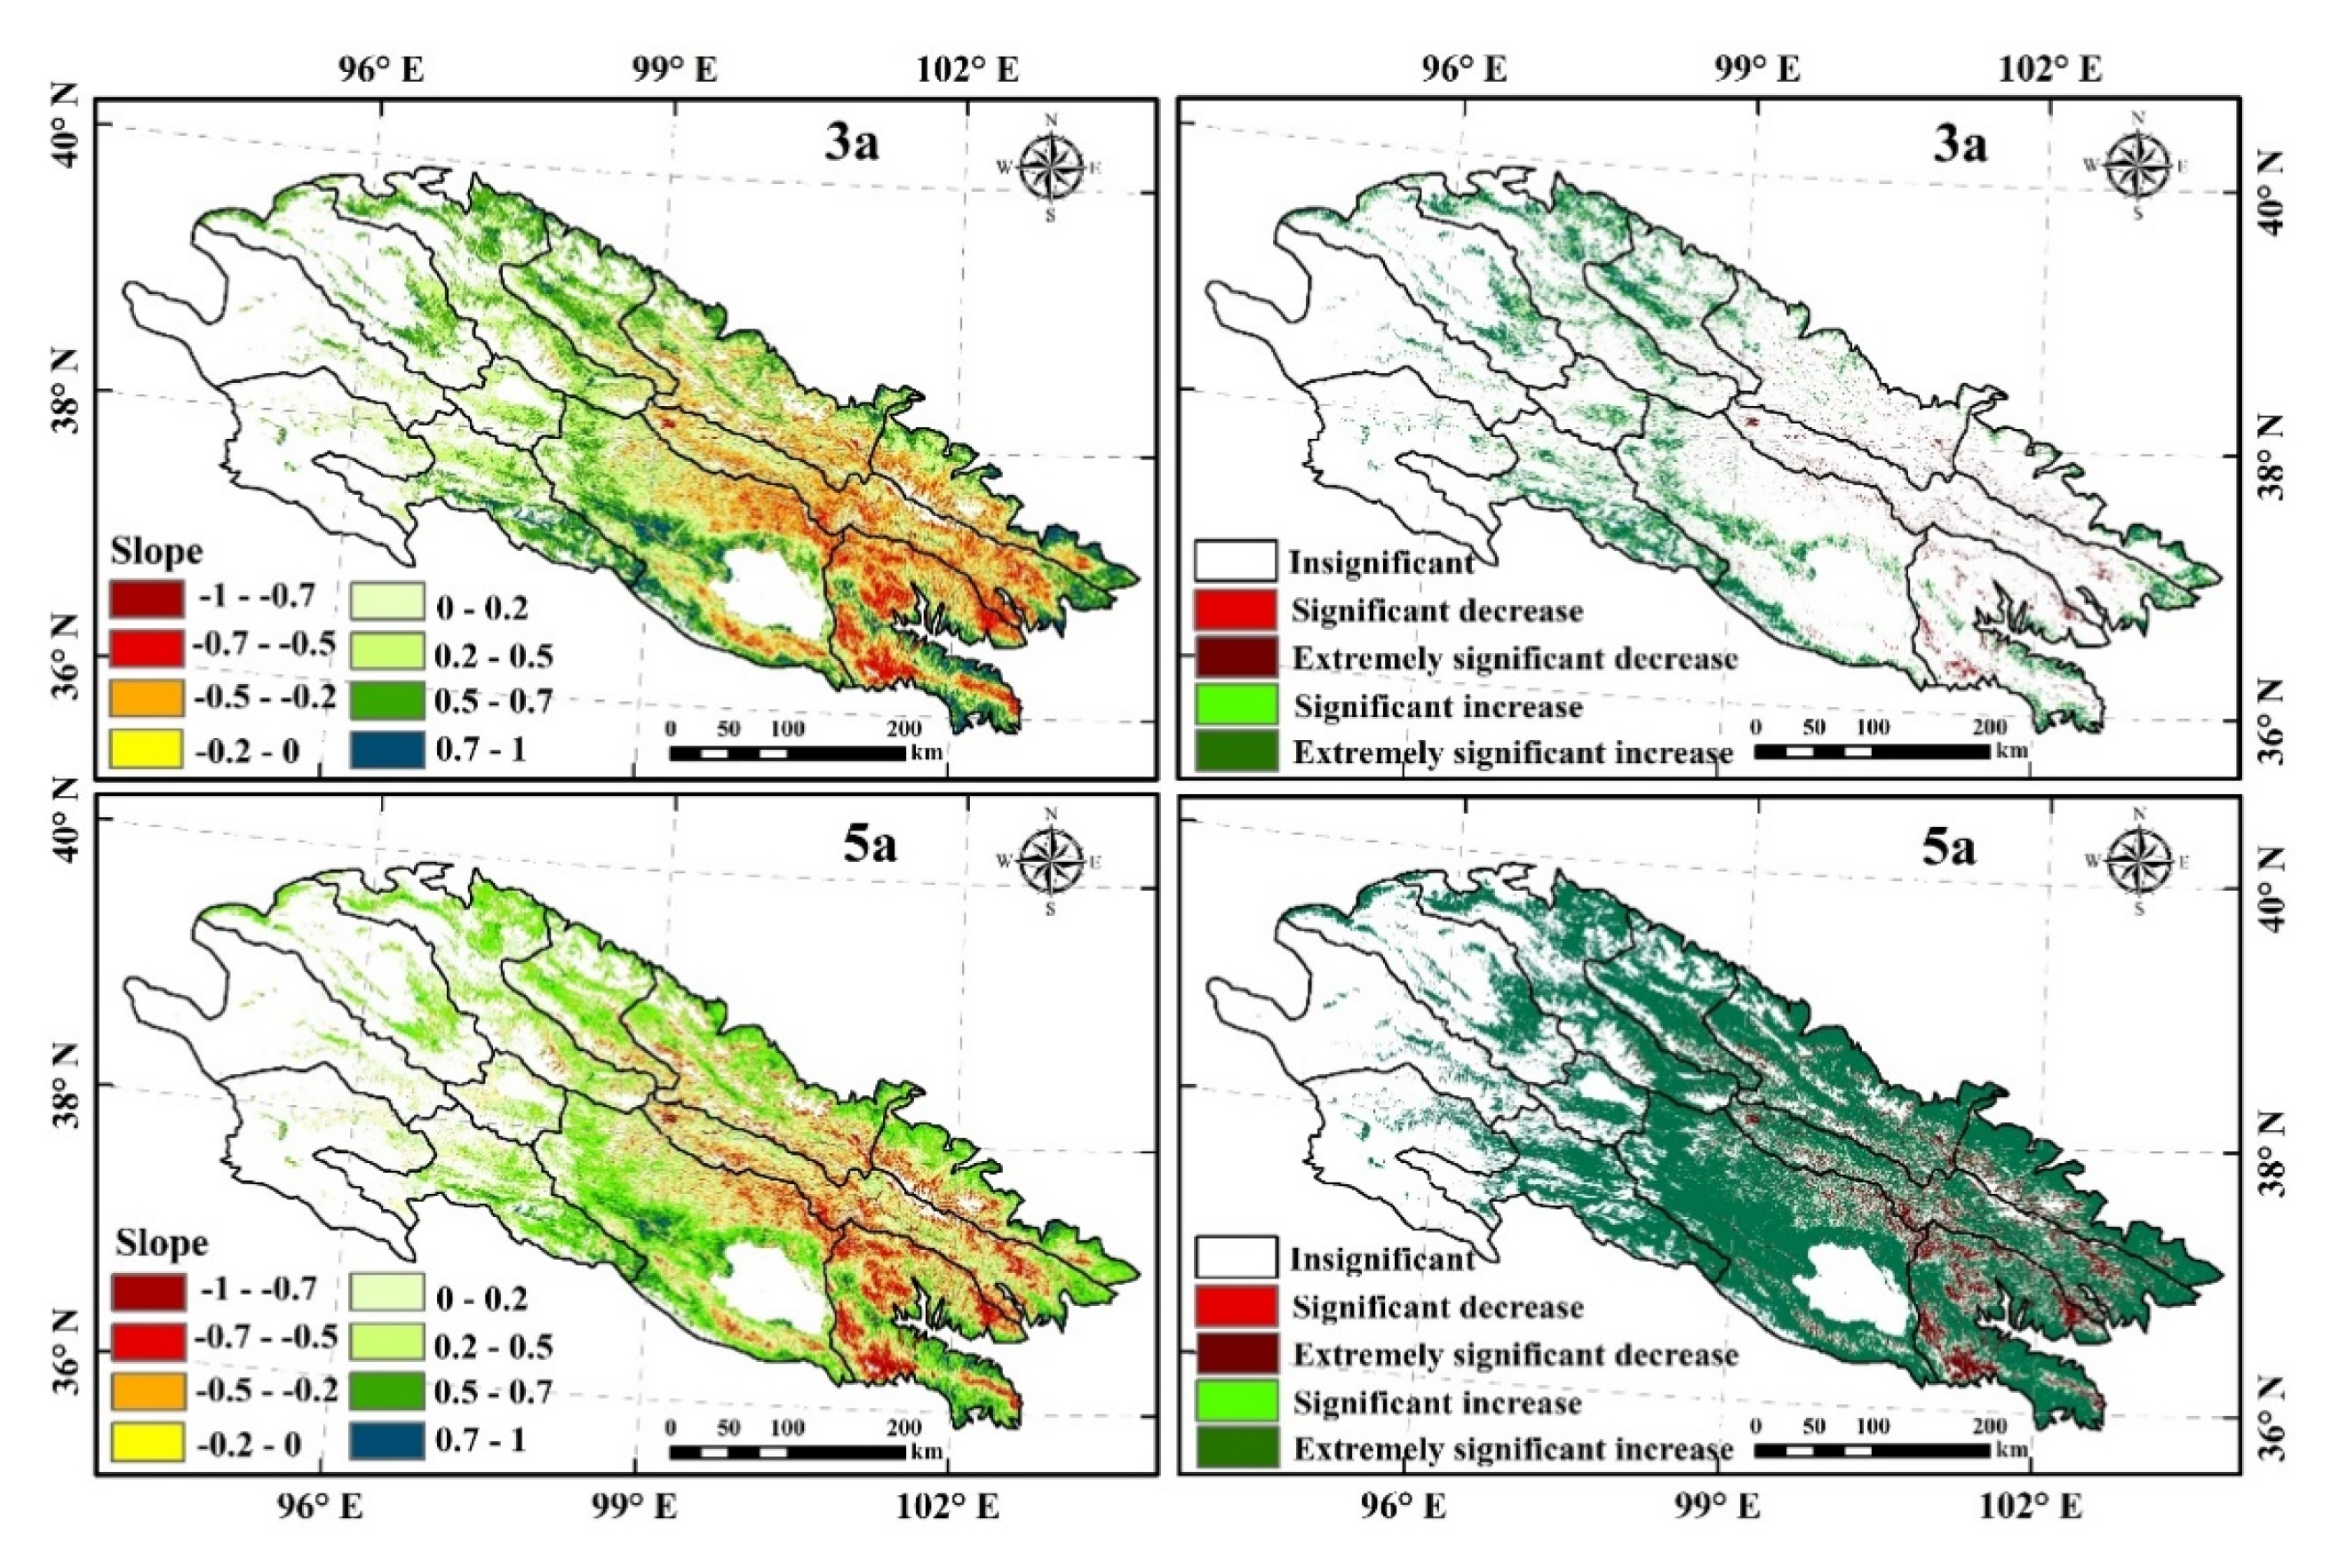
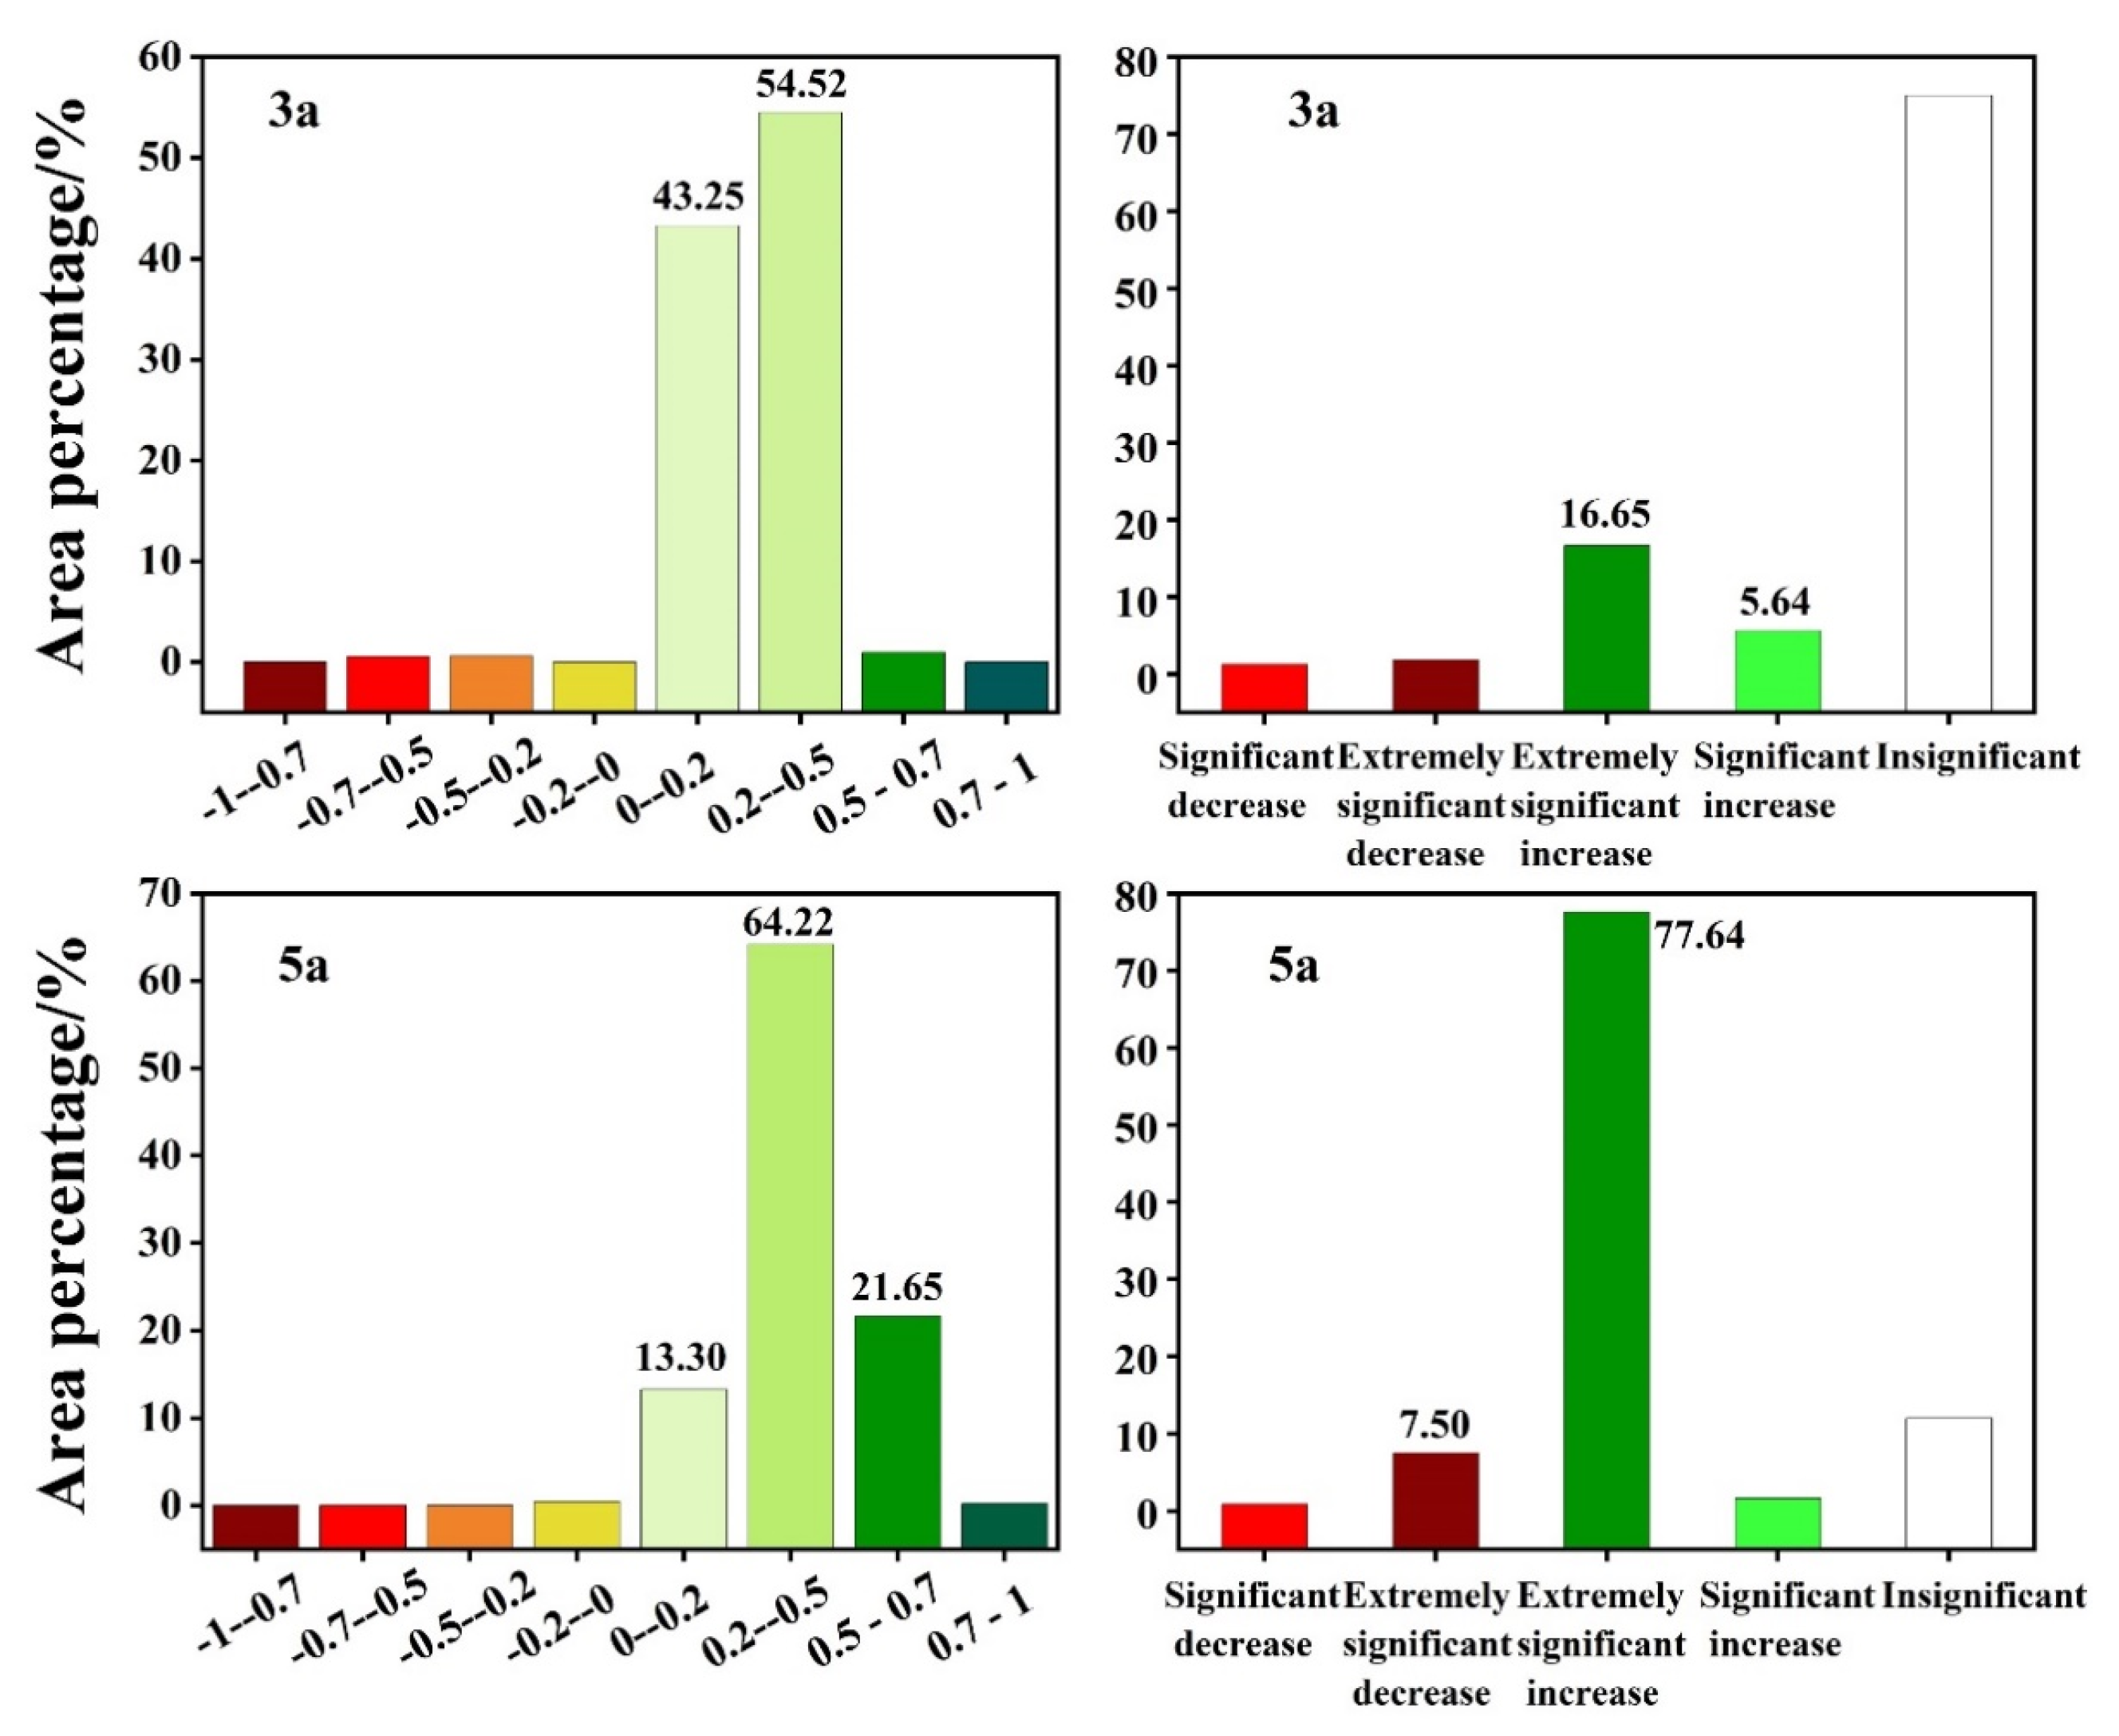
4.1. Spatial and Temporal Characteristics of the Vegetation Changes in the QLMs
4.2. Vegetation Change Characteristics of the QLMs at Different Time Scales
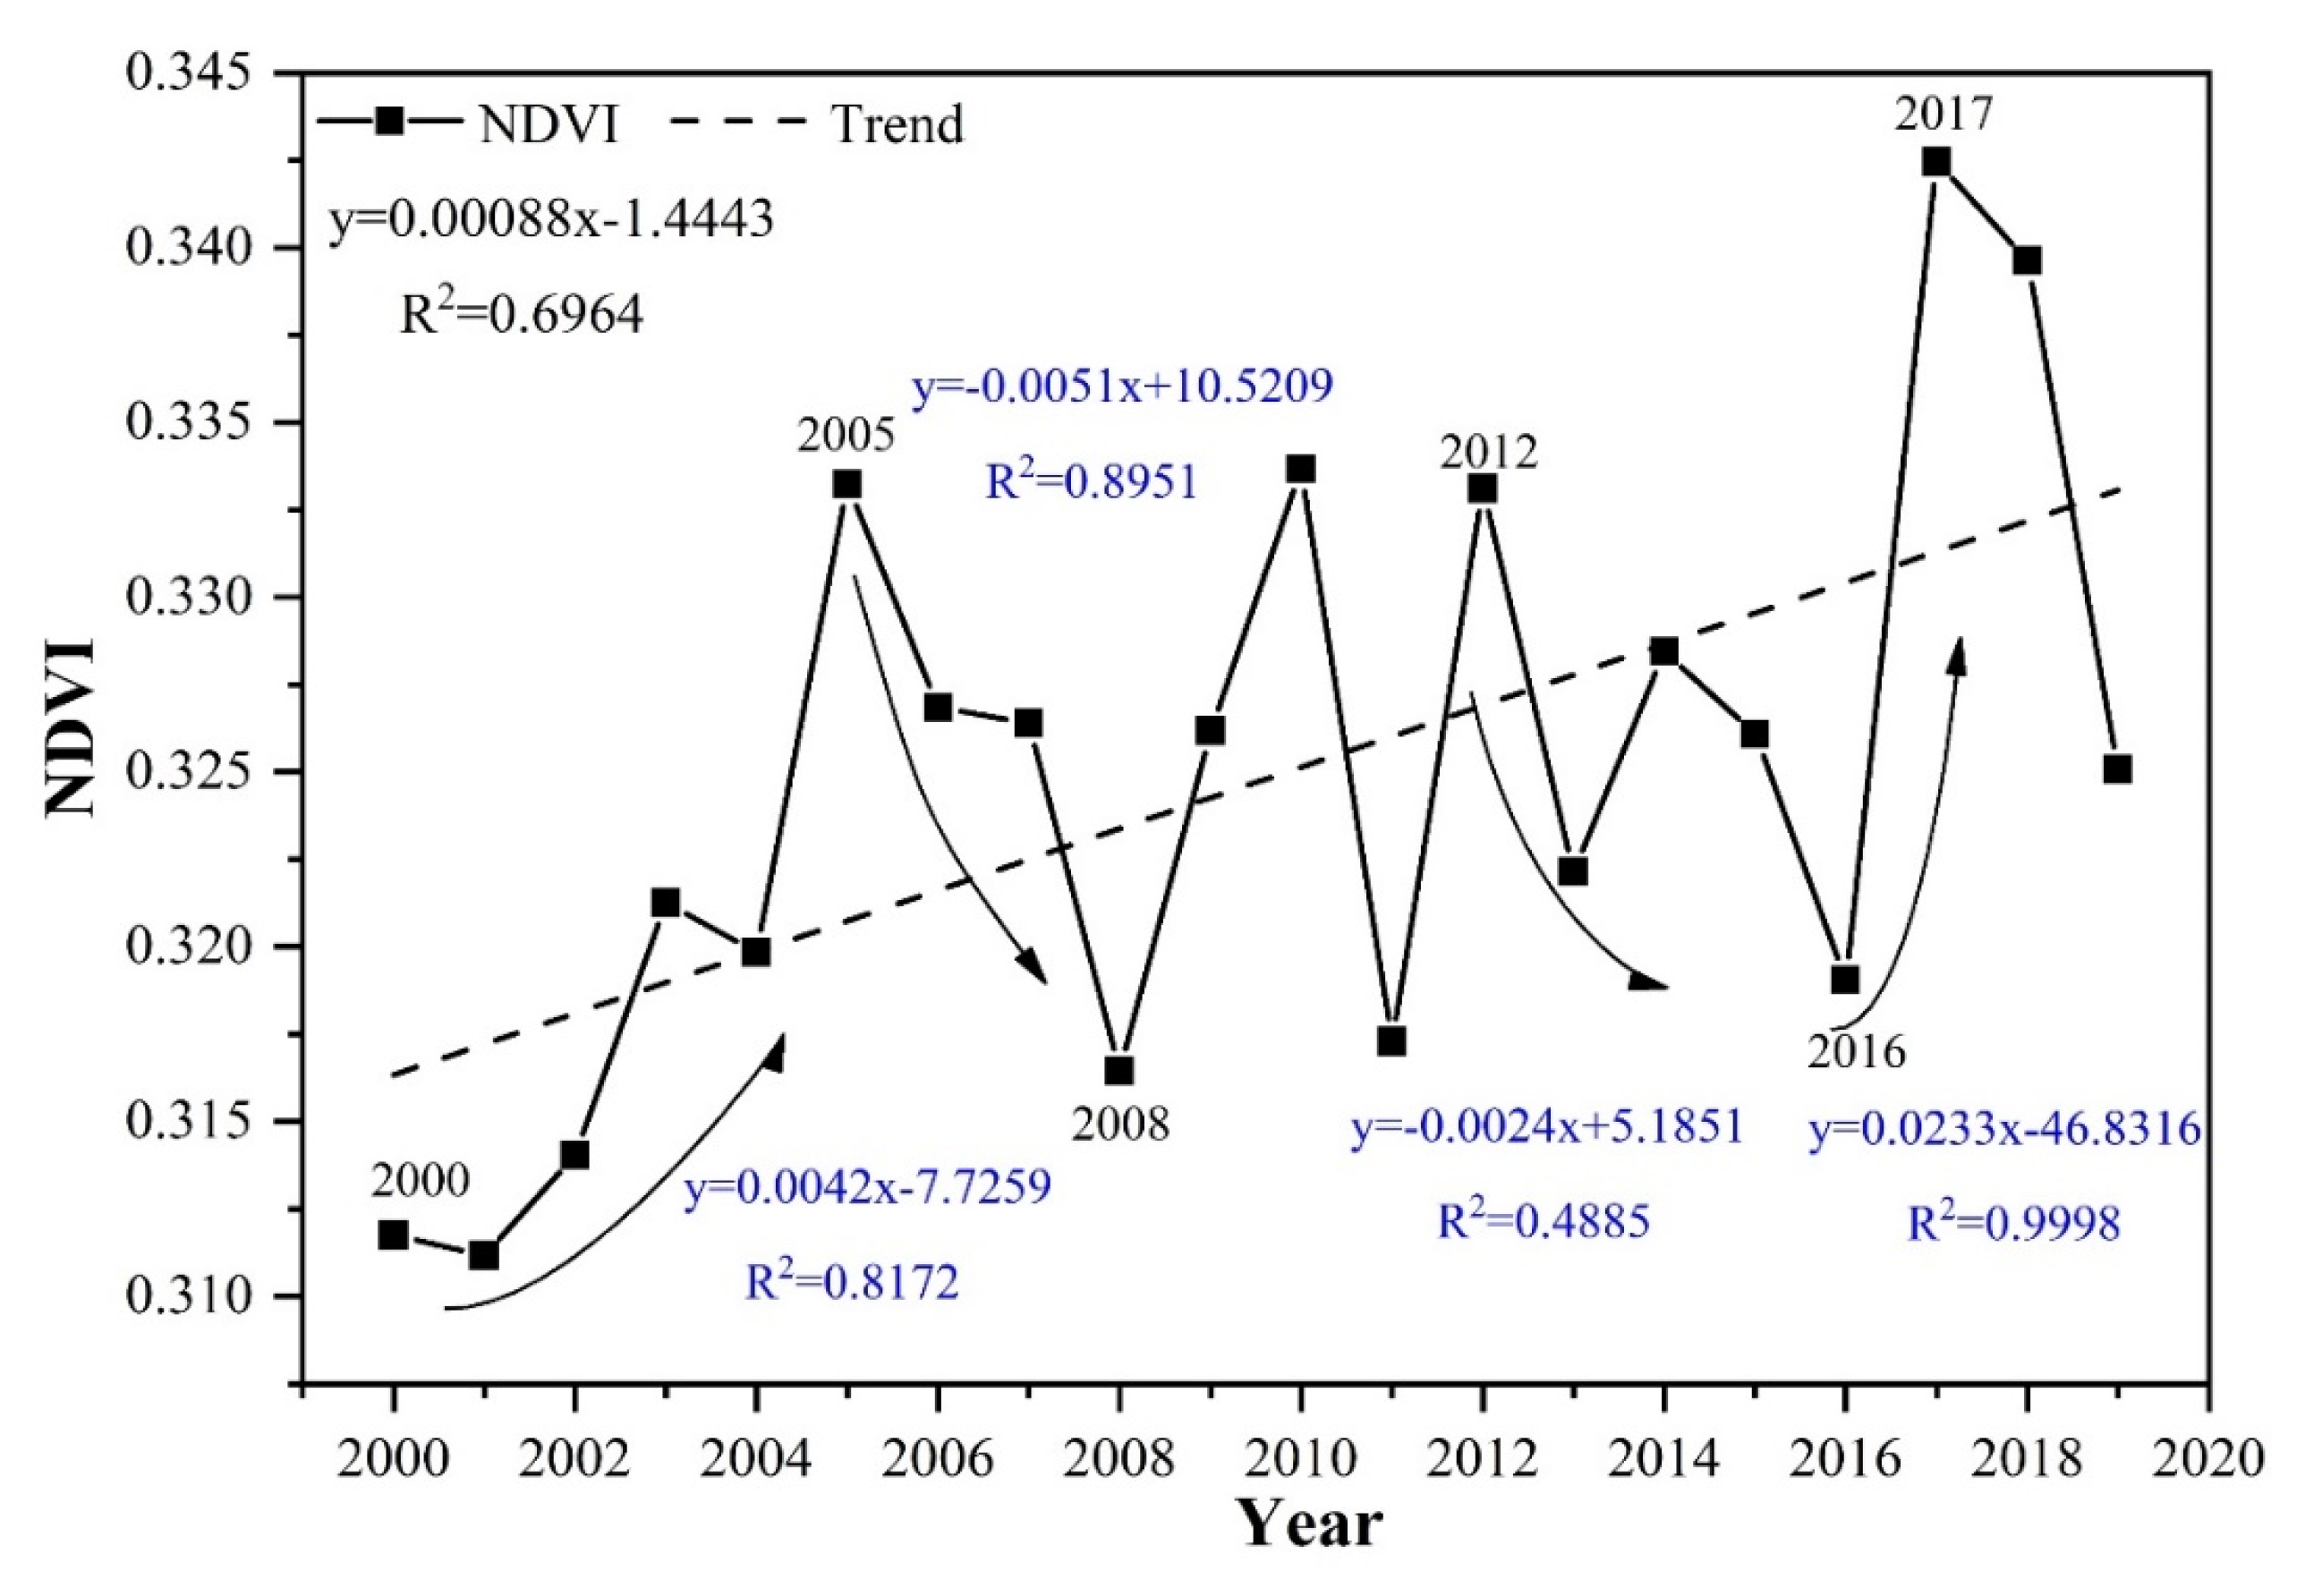
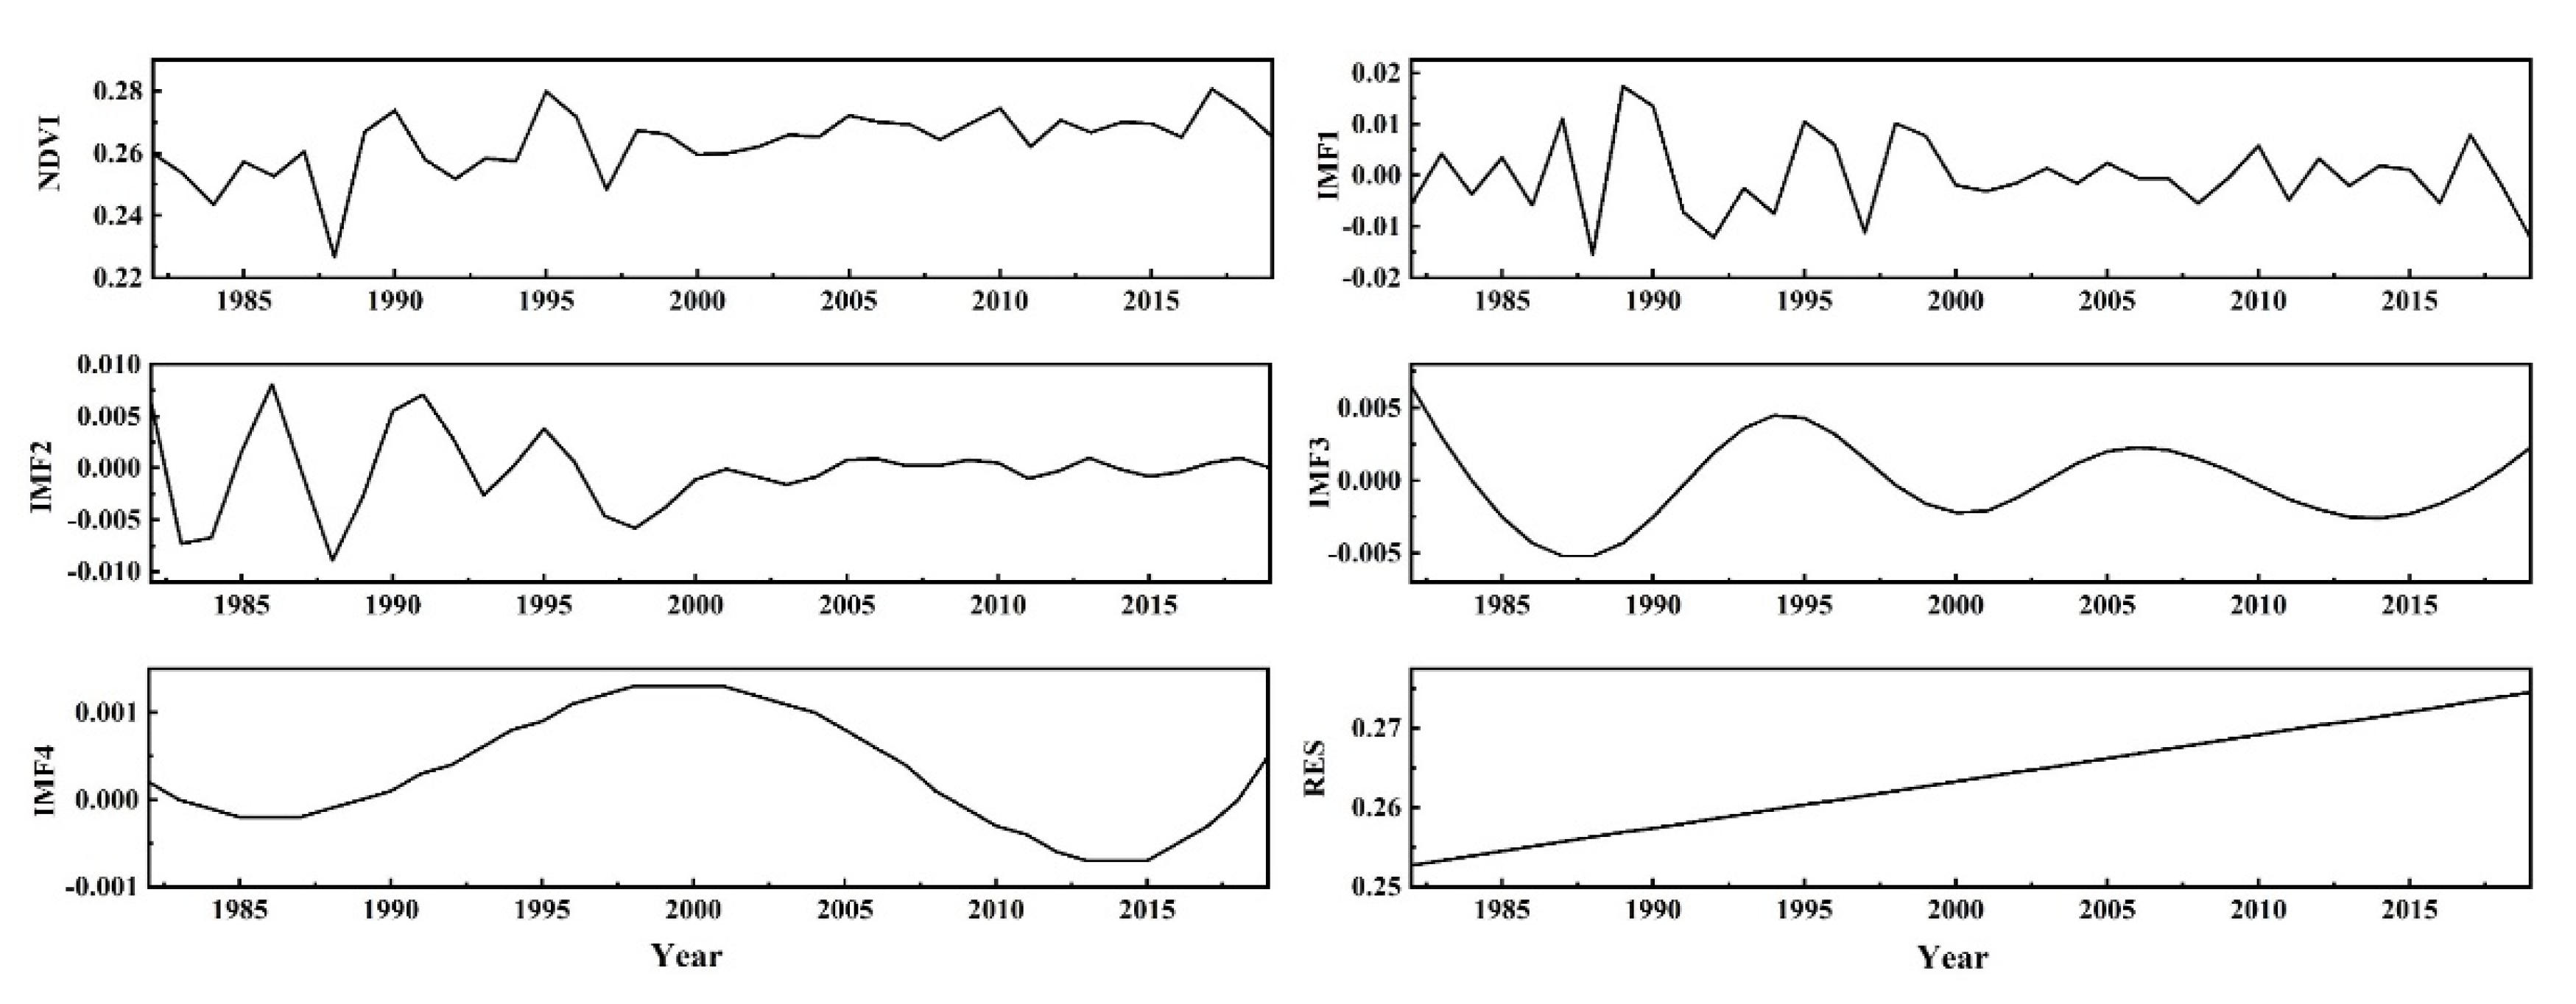
4.2.1. Periodicity Analysis
4.2.2. Analysis of Vegetation Change at Multiple Time Scales
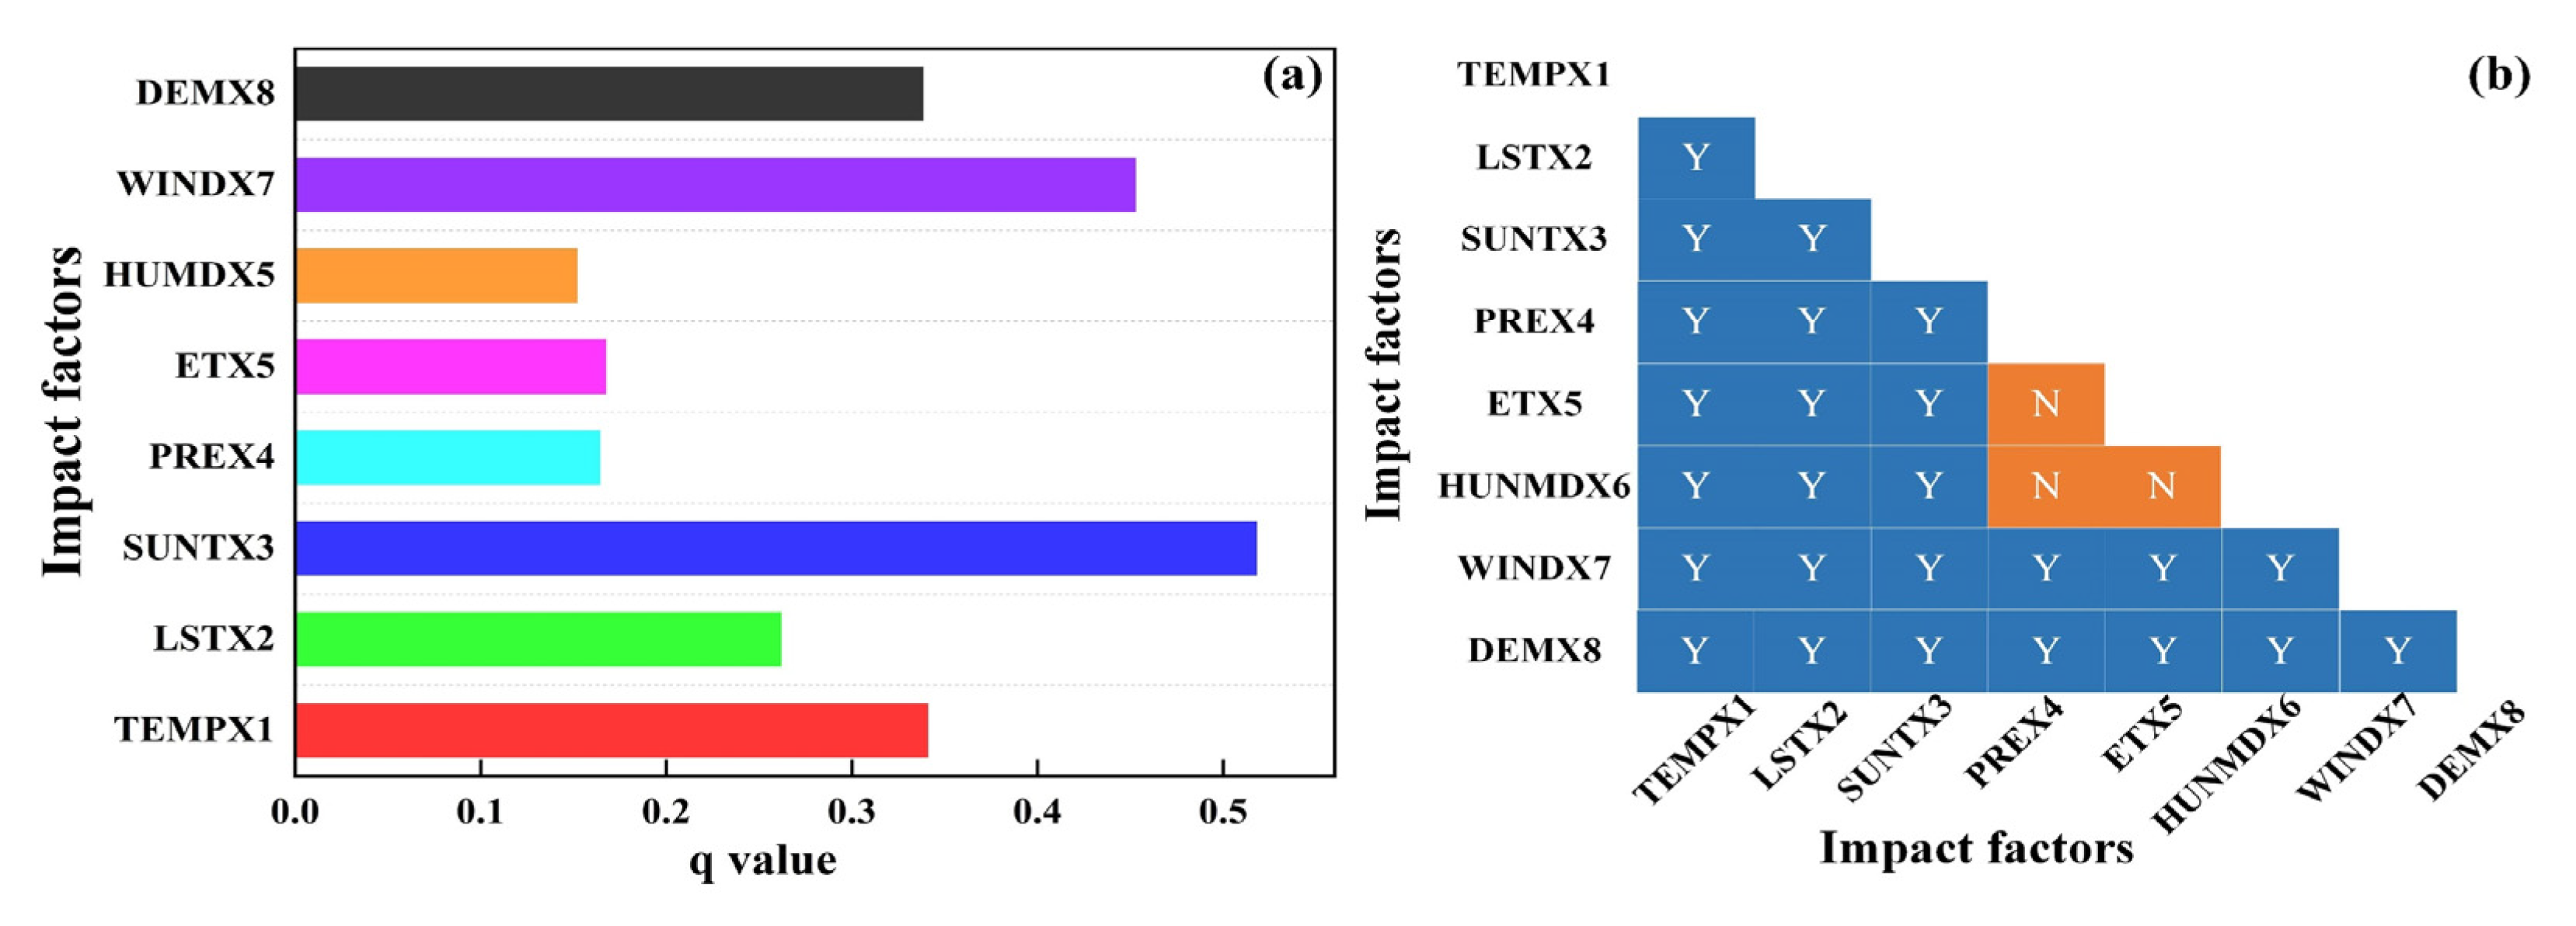
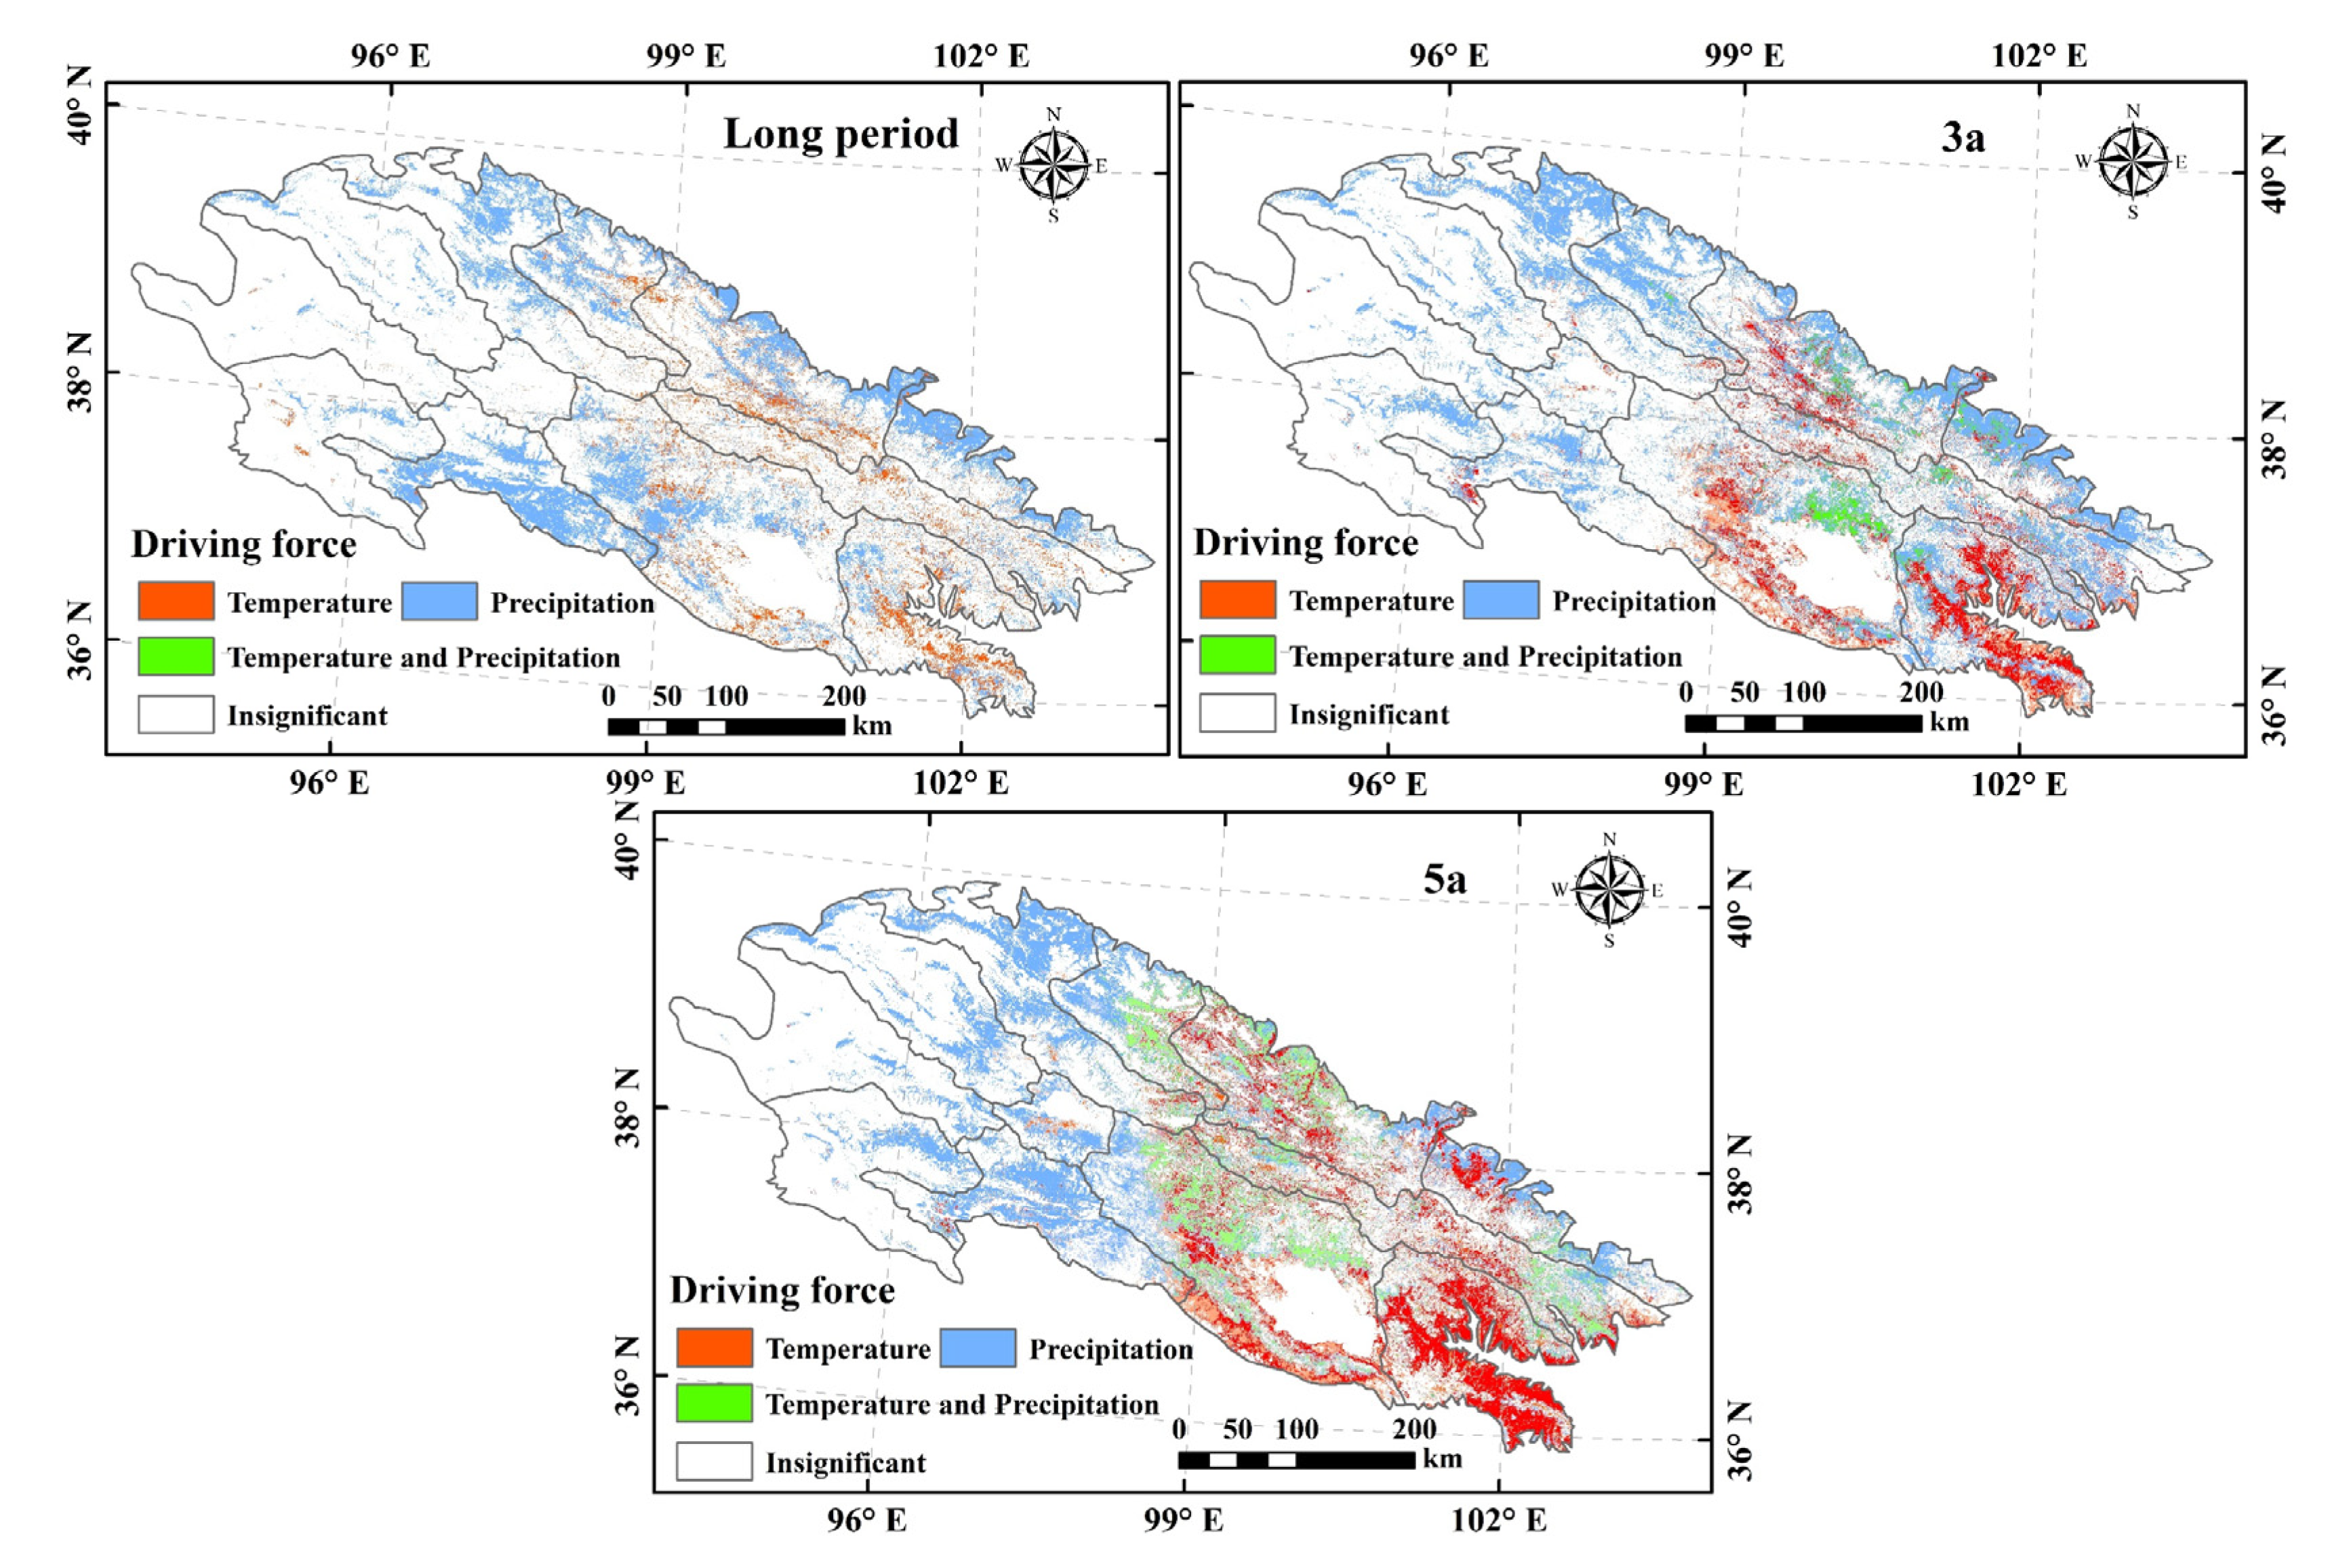
4.3. Drivers of Vegetation Change in the QLMs
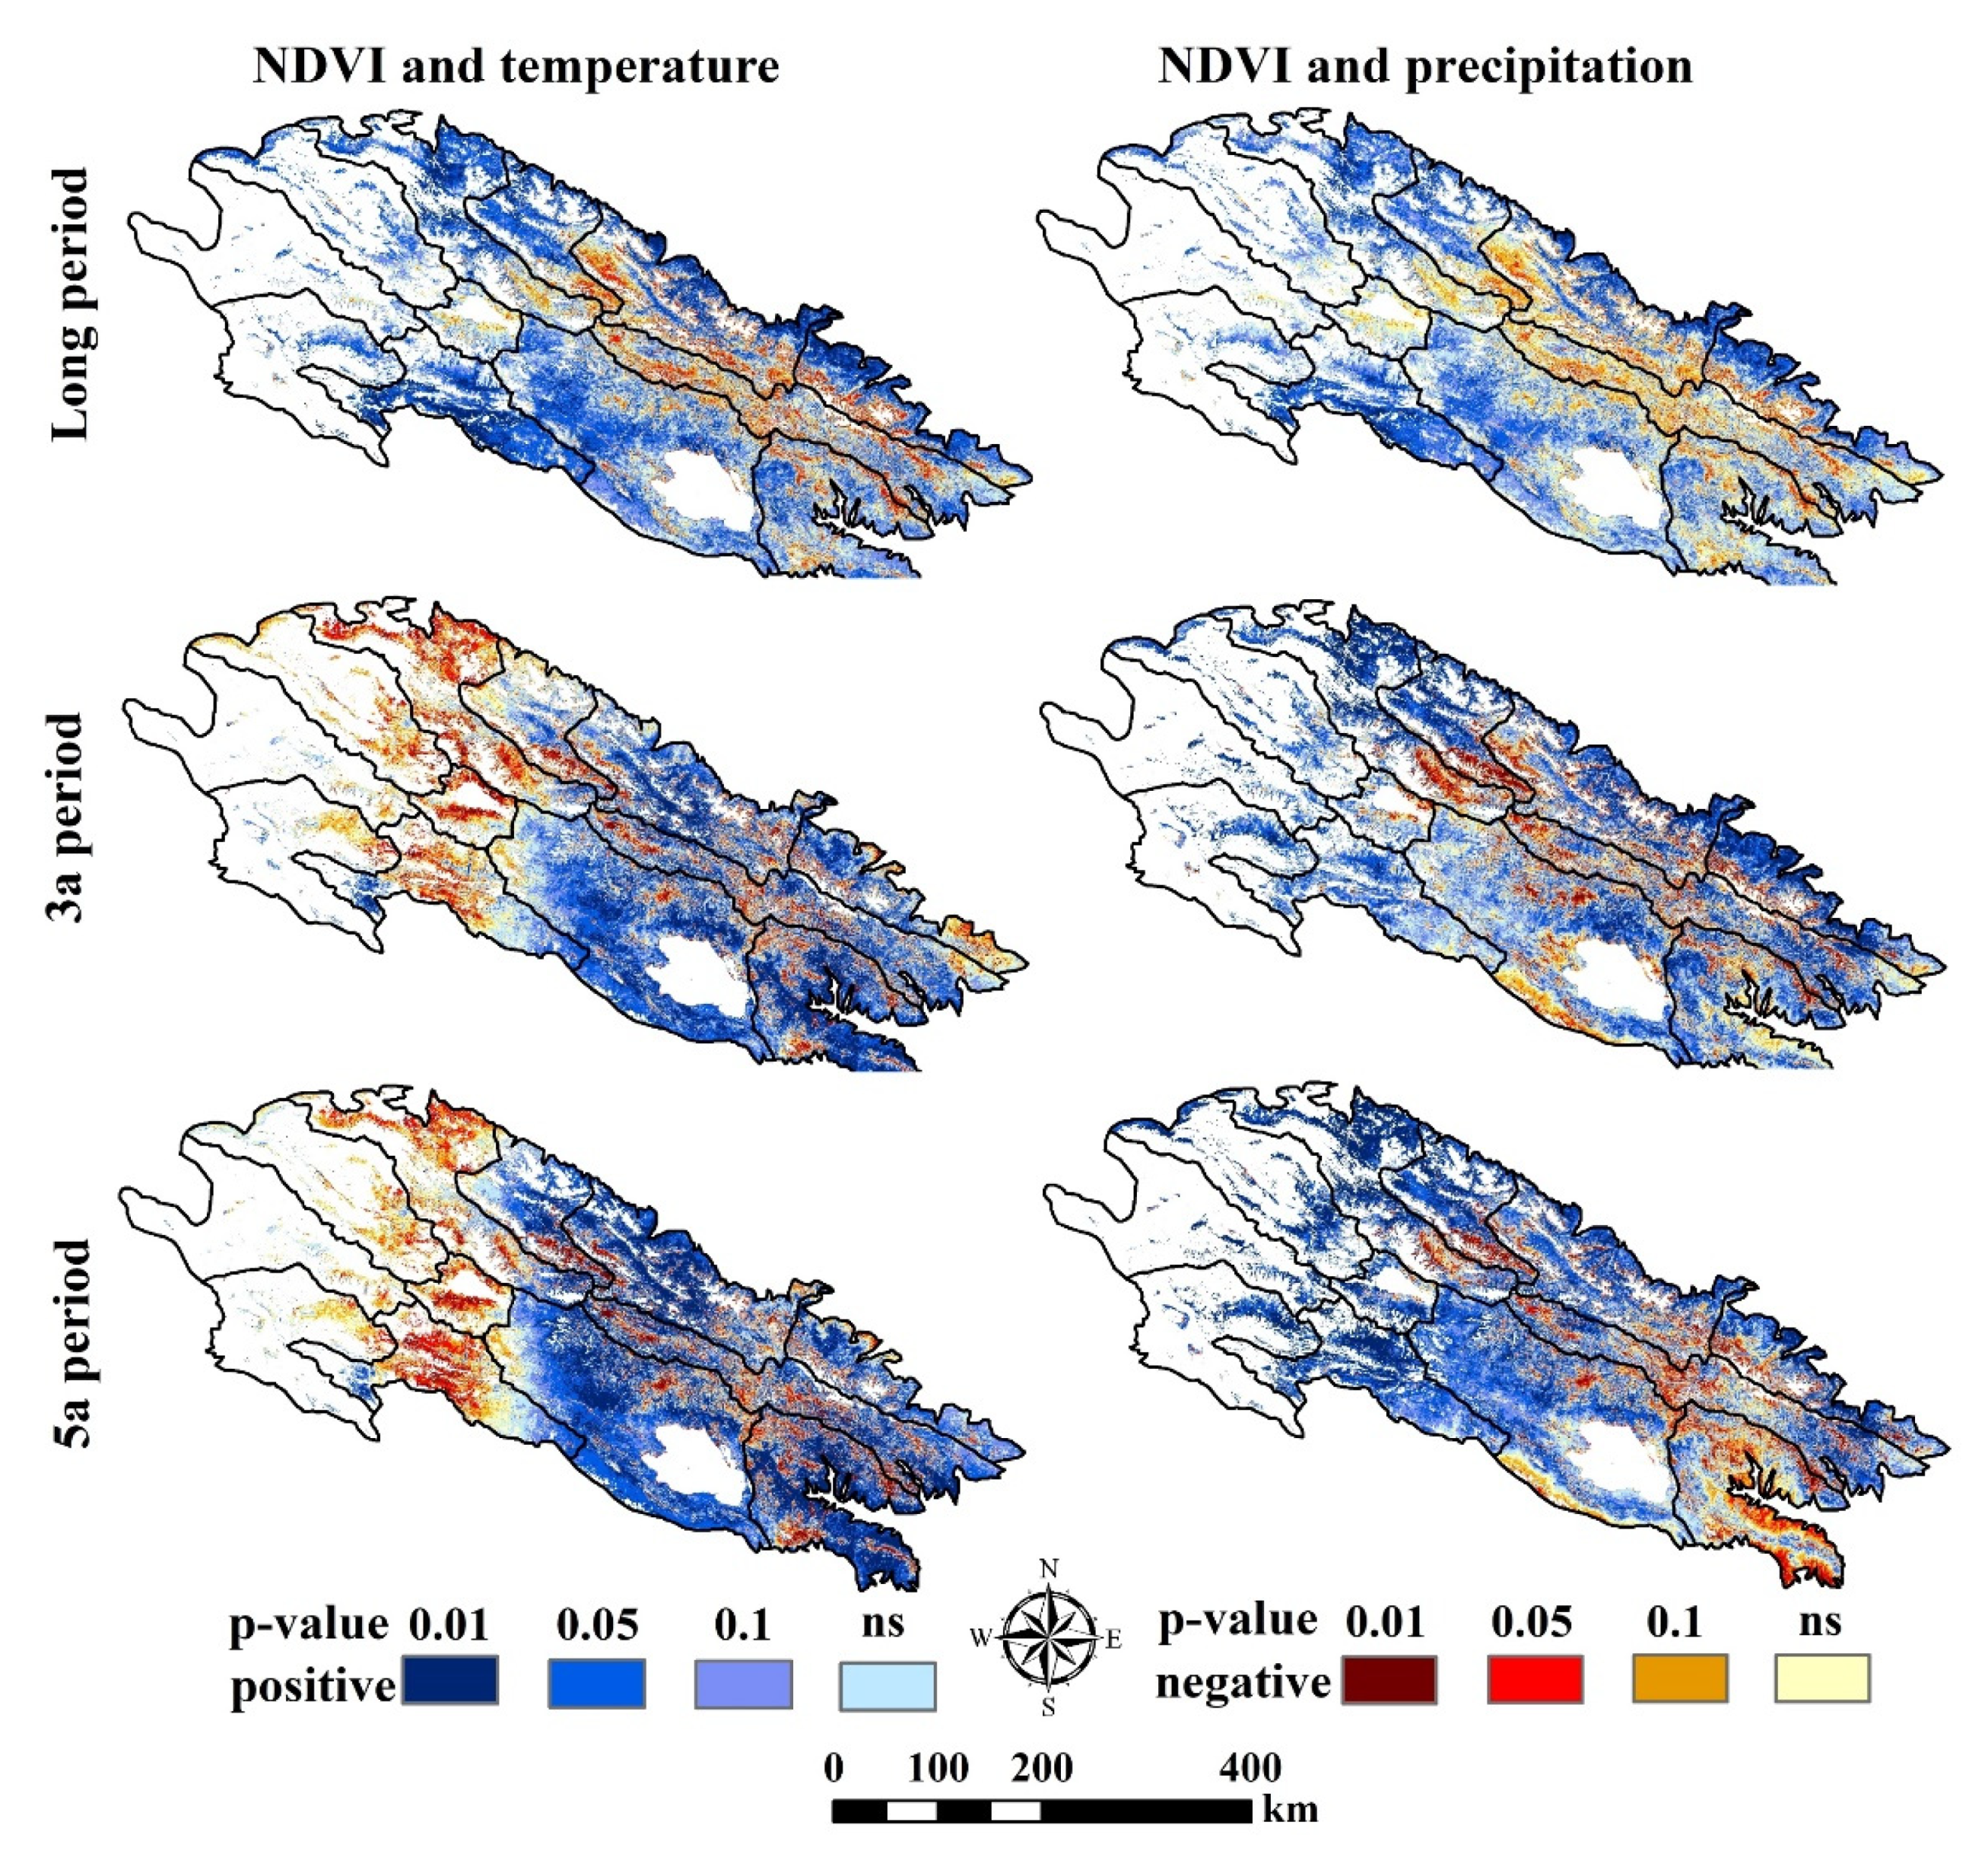
4.4. Correlation Analysis of Vegetation with Temperature and Precipitation in the QLMs
5. Discussion
5.1. Characteristics of Vegetation Change in the QLMs
5.2. Analysis of the Driving Forces of Vegetation Change in the QLMs
5.3. Limitations and Future Perspectives
6. Conclusions
- (1)
- The overall vegetation in the QLMs showed an increasing trend. The vegetation in the QLMs showed high northeast and low southwest distributions in 2000–2019, with slight decreases in the east and central parts and a significant increase in the northwest. The vegetation in the entire study area had 3- and 5-year cycles of change and a long-term increasing trend. On the short time scales, the vegetations in the central and eastern parts of the study area were influenced more by non-climatic factors such as human activities, whereas in long-term trends, the vegetation was mainly influenced by climatic factors.
- (2)
- The q values of the Geodetector results were ranked as follows: SUNT > WIND > TEMP > DEM > LST > ET > PRE > HUMD. SUNT and WIND had the strongest explanatory power for the spatial variation of vegetation in the QLMs. The explanatory powers of TEMP and PRE for the spatial variation of vegetation were greater and increased under certain elevation conditions, respectively. The explanatory powers of TEMP and PRE on the spatial variation of vegetation in the western part of the study area were greater than those in the eastern part, and the explanatory power of the interaction was greater.
- (3)
- Precipitation was the main driver of vegetation growth in the northern and southwestern regions of the QLMs on both the short and long time scales. The increases in temperature and precipitation contributed to the vegetation growth in the Qinghai Lake basin on the 3-year time scale. Short-term temperature increases contributed to the increase in vegetation in the northwestern area of the QLMs. By contrast, a long-term trend of combined increases in temperature and precipitation favoured the growth of vegetation in the eastern part of the study area.
Author Contributions
Funding
Institutional Review Board Statement
Informed Consent Statement
Data Availability Statement
Conflicts of Interest
References
- Li, X.; Li, X.B.; Wang, H.; Yu, F.; Yu, H.J.; Yang, H. Impact of climate change on temperate grassland in northern China. J. Beijing Norm. Univ. Nat. Sci. 2006, 42, 623–818. [Google Scholar]
- Song, Y.; Jin, L.; Wang, H. Vegetation Changes along the Qinghai-Tibet Plateau Engineering Corridor Since 2000 Induced by Climate Change and Human Activities. Remote Sens. 2018, 10, 95. [Google Scholar] [CrossRef] [Green Version]
- Deng, X.Y.; Yao, J.Q.; Liu, Z.H. Spatiotemporal dynamic change of vegetation coverage in central Asia based on GIMMS NDVI. Arid Zone Res. 2017, 1, 10–19. [Google Scholar]
- Chen, J.H.; Jia, W.X.; Zhao, Z.; Zhang, Y.S.; Liu, Y.R. Research on temporal and spatial variation characteristic of vegetation cover of Qilian Mountains from 1982 to 2006. Adv. Earth Sci. 2015, 30, 834–845. [Google Scholar]
- Duo, A.; Zhao, W.J.; Gong, Z.N.; Zhang, M.; Fan, Y.B. Temporal analysis of climate change and its relationship with vegetation cover on the north China plain from 1981 to 2013. Acta Ecol. Sin. 2017, 37, 576–592. [Google Scholar]
- Xie, B.N. Vegetation Dynamics and Climate Change on the Loess Plateau, China: 1982–2014; Northwest A & F University: Xianyang, China, 2016. [Google Scholar]
- Chao, Y.S. Principles and Methods of Remote Sensing Application Analysis; Science Press: Beijing, China, 2003. [Google Scholar]
- Pu, S.L.; Fang, J.Y. Seasonal differences in response of land vegetation activities to climate change in China from 1982 to 1999. Acta Geogr. Sin. 2003, 58, 119–125. [Google Scholar]
- Cao, M.; Woodward, F.L. Dynamic responses of terrestrial ecosystem carbon cycling to global climate change. Nature 1998, 393, 249–252. [Google Scholar] [CrossRef]
- Liu, M.X.; Zhao, R.D.; Shao, P. Temporal and spatial variation of vegetation coverage and its driving forces in the Loess Plateau from 2001 to 2015. Arid Land Geogr. 2018, 41, 99–108. [Google Scholar]
- Zhang, L.J.; Zhang, B.Y.; Li, W.L.; Li, X.X.; Sun, L.; Jiang, L.J.; Liu, X.X. Spatiotemporal changes and drivers of global land vegetation oxygen production between 2001 and 2010. Ecol. Indic. Integr. Monit. Assess. Manag. 2018, 90, 426–437. [Google Scholar] [CrossRef]
- Pan, N.Q.; Feng, X.M.; Fu, B.J.; Wang, S.; Pan, S.F. Increasing global vegetation browning hidden in overall vegetation greening: Insights from time-varying trends. Remote Sens. Environ. 2018, 214, 59–72. [Google Scholar] [CrossRef]
- Li, X.F.; Zhu, X.F.; Li, S.S.; Liu, Y.X.; Pan, Y.Z. Changes in Growing Season Vegetation and Their Associated Driving Forces in China during 2001–2012. Remote Sens. 2015, 7, 15517–15535. [Google Scholar] [CrossRef] [Green Version]
- Li, J.; Liu, H.B.; Li, C.Y.; Li, L. Changes of green-up day of vegetation season based on GIMMS 3g NDVI in northern China in recent 30 years. Sci. Geogr. Sin. 2017, 37, 143–152. [Google Scholar]
- Dai, S.P.; Zhang, B.; Wang, H.J.; Wang, Y.M.; Li, D.; Wang, X.M. Analysis on the spatio-temporal variation of grassland cover using SPOT NDVI in Qilian Mountains. Prog. Geogr. 2010, 29, 1075–1080. [Google Scholar]
- Wu, Z.L.; Jia, W.X.; Zhao, Z.; Zhang, S.Y.; Liu, Y.R.; Chen, J.H. Spatial-temporal variations of vegetation and its correlation with climatic factors in Qilian Mountains from 2000 to 2012. Arid Land Geogr. 2015, 38, 1241–1252. [Google Scholar]
- Xu, X.; Liu, H.; Lin, Z.; Jiao, F.; Gong, H. Relationship of Abrupt Vegetation Change to Climate Change and Ecological Engineering with Multi-Timescale Analysis in the Karst Region, Southwest China. Remote Sens. 2019, 11, 1564. [Google Scholar] [CrossRef] [Green Version]
- Xu, G.; Zhang, H.; Chen, B.; Zhang, H.; Innes, J.L.; Wang, G.; Yan, J.; Zheng, Y.; Zhu, Z.; Myneni, R.B. Changes in Vegetation Growth Dynamics and Relations with Climate over China’s Landmass from 1982 to 2011. Remote Sens. 2014, 6, 3263–3283. [Google Scholar] [CrossRef] [Green Version]
- Jung, M.; Reichstein, M.; Bondeau, A. Towards global empirical upscaling of FLUXNET eddy covariance observations: Validation of a model tree ensemble approach using a biosphere model. Biogeosciences 2009, 6, 2001–2013. [Google Scholar] [CrossRef] [Green Version]
- Meng, X.; Gao, X.; Li, S.; Lei, J. Spatial and Temporal Characteristics of Vegetation NDVI Changes and the Driving Forces in Mongolia during 1982–2015. Remote Sens. 2020, 12, 603. [Google Scholar] [CrossRef] [Green Version]
- Wang, W.H.; He, Y.; Zhang, L.F.; Chen, Y.D.; Tang, Y.W.; Qiu, L.S.; Zhang, X.X. Ground deformation monitoring and driving force analysis of the main city area in Lanzhou based on PS-InSAR and GeoDetector. J. Lanzhou Univ. Nat. Sci. Ed. 2021, 57, 382–388. [Google Scholar]
- He, Y.; Wang, W.; Chen, Y.; Yan, H. Assessing spatio-temporal patterns and driving force of ecosystem service value in the main urban area of guangzhou. Sci. Rep. 2021, 11, 3027. [Google Scholar] [CrossRef]
- Liu, Y.R.; Jia, W.X.; Huang, M.; Li, Y.Y.; Wu, Z.L.; Zhang, S.Y.; Li, Y.F. Response of vegetation net primary productivity to climate in the Qilian Mountains since recent 51 years. Acta Bot. Boreal. Occident. Sin. 2015, 35, 0601–0607. [Google Scholar]
- Zhao, S.M.; Cheng, W.M.; Zhou, C.H.; Chen, X.; Chen, J. Simulation of decadal alpine permafrost distributions in the Qilian Mountains over past 50 years by using Logistic Regression Model. Cold Reg. Sci. Technol. 2012, 73, 32–40. [Google Scholar] [CrossRef]
- Dong, L. The Freezing Level Height and Its Impact Variation of Water Resource in Qilian Mountains during 1979–2012; Northwest Normal University: Lanzhou, China, 2015. [Google Scholar]
- Zhang, F.G.; Zeng, B.; Yang, T.B. Spatiotemporal distribution changes in alphine desert belt in Qilian Mountains under climate changes in past 30 years. Chin. J. Plant Ecol. 2019, 43, 305. [Google Scholar] [CrossRef]
- Yu, M.; Cao, G.C.; Cao, S.K.; Zhang, H.; Yuan, J. Analysis of precipitation variation characteristics in the southern slope of Qilian Mountains in recent 30 years. Res. Soil Water Conserv. 2019, 26, 245–252. [Google Scholar]
- Jin, B.W.; Kang, E.S.; Song, K.C. Eco-hydrological function of mountain vegetation in the Hei River Basin, northwest China. J. Glaciol. Geocryol. 2003, 25, 580–584. [Google Scholar]
- Wang, Q.; Zhang, B.; Dai, S.P. Analysis of the vegetation cover change and its relationship with factors in the Three-North Shelter Forest Program. China Environ. Sci. 2012, 32, 1302–1308. [Google Scholar]
- Bi, C. Dynamics of Vegetation and Phenology and Their Response to Climate Change Based on Multisource Data in the Arid and Semiarid Region, China; Beijing Forestry University: Beijing, China, 2015. [Google Scholar]
- Zeng, B. Vegetation Responses to Climate Change on the Tibetan Plateau 1982–2003; Lanzhou University: Lanzhou, China, 2008. [Google Scholar]
- Felix, N.; Hao, G.; Anming, B. Understanding the Spatial Temporal Vegetation Dynamics in Rwanda. Remote Sens. 2016, 8, 129. [Google Scholar]
- Zhang, L.F.; Yan, H.W.; Yang, S.W.; Zhu, J.W.; Qiu, L.S. Variations of vegetation coverage and its response to terrain in Heihe River Basin. Remote Sens. Inf. 2018, 33, 46–52. [Google Scholar]
- Li, E.S.; Zhou, X.M.; Zhang, B.M. Study on the image noises elimination based on the wavelet transform and gauss function. Mar. Geod. Cartogr. 2008, 28, 41–44. [Google Scholar]
- Jia, J.H.; Liu, H.Y.; Lin, Z.S. Multi-time scale changes of vegetation NPP in six provinces of northwest China and their responses to climate change. Acta Ecol. Sin. 2018, 39, 5058–5069. [Google Scholar]
- Tang, L.; Zhao, Z.M.; Tang, P. A new method for detection “greening” or “browning” change trend in vegetation from NDVI sequences. Remote Sens. Land Resour. 2019, 31, 89–95. [Google Scholar]
- Tao, Y.; Liu, C.; Liu, C.; Zhao, X.W.; Hu, H.J. Empirical Wavelet Transform Method for GNSS Coordinate Series Denoising. J. Geovis. Spat. Anal. 2021, 5, 9. [Google Scholar] [CrossRef]
- Wang, J.F.; Xu, C.D. Geodetector: Principle and prospective. Acta Geogr. Sin. 2017, 72, 116–134. [Google Scholar]
- He, Y.; Yan, H.W.; Ma, L.; Zhang, L.F.; Qiu, L.S.; Yang, S.W. Spatiotemporal dynamics analysis of vegetation in Ningxia of China using MODIS imagery. Front. Earth Sci. 2020, 14, 221–235. [Google Scholar] [CrossRef]
- Pei, Z.L.; Yang, Q.K.; Wang, C.M.; Pang, G.W.; Yang, L.H. Spatial distribution of vegetation coverage and its affecting factors in the upper reaches of the Yellow River. Arid Zone Res. 2019, 3, 546–555. [Google Scholar]
- Liu, H.Y.; Zhang, M.Y.; Lin, Z.S.; Xu, X.J. Spatial heterogeneity of the relationship between vegetation dynamics and climate change and their driving forces at multiple time scales in Southwest China. Agric. For. Meteorol. 2018, 256, 10–21. [Google Scholar] [CrossRef]
- Yao, Z.Y.; Zhao, C.Y.; Yang, K.S.; Liu, W.C.; Li, Y.; You, J.D.; Xiao, J.H. Alpine grassland degradation in the Qilian Mountains, China-a case study in Damaying grassland. Catena 2016, 137, 494–500. [Google Scholar] [CrossRef]
- Chen, Y.; Xu, D.X.; Guo, N. Analysis on the vegetation change in Qilian Mountains since recent 22 years. Arid Zone Res. 2008, 6, 22–27. [Google Scholar]
- Zhang, Y.; Xu, G.; Li, P.; Li, Z.; Wang, Y.; Wang, B.; Jia, L.; Cheng, Y.; Zhang, J.; Zhuang, S.; et al. Vegetation Change and Its Relationship with Climate Factors and Elevation on the Tibetan Plateau. Int. J. Environ. Res. Public Health 2019, 16, 4709. [Google Scholar] [CrossRef] [Green Version]
- Qiu, L.S.; Zhang, L.F.; He, Y.; Diao, Z.Y.; Chen, Y.D. Remote sensing monitoring on vegetation dynamic change in Qilian Mountain from 2000 to 2017. Remote Sens. Inf. 2019, 34, 97–107. [Google Scholar]
- Geng, L.; Che, T.; Wang, X.; Wang, H. Detecting Spatiotemporal Changes in Vegetation with the BFAST Model in the Qilian Mountain Region during 2000–2017. Remote Sens. 2019, 11, 103. [Google Scholar] [CrossRef] [Green Version]
- Qiu, L.S. Study on Multiscale Variation Characteristics of Vegetation and Driving Forces in Qilian Mountains; Lanzhou Jiaotong University: Lanzhou, China, 2020. [Google Scholar]
- Niu, Z.G.; He, H.L.; Zhu, G.F.; Ren, X.L.; Zhang, L.; Zhang, K.; Yu, G.R.; Ge, R.; Li, P.; Zeng, N. An increasing trend in the ratio of transpiration to total terrestrial evapotranspiration in China from 1982 to 2015 caused by greening and warming. Agric. For. Meteorol. 2019, 279, 107701. [Google Scholar] [CrossRef]
- Wang, J.F. Analysis on runoff variation in the Beida River Basin under the influence of climate change and human actives. J. Arid Land Resour. Environ. 2019, 33, 88–93. [Google Scholar]
- Cheng, Y.S.; Cheng, Z.J. Studies on relationship between runoff characteristics of Danghe River Basin and climate change in recent 40 years. China Water Resour. 2015, 13, 60–63. [Google Scholar]
- Zhao, X.; Tan, K.; Zhao, S.; Fang, J. Changing climate affects vegetation growth in the arid region of the northwestern China. J. Arid Environ. 2011, 75, 946–952. [Google Scholar] [CrossRef]
- Wang, M.N.; Han, Z.; Zhang, Q.Y. Impact of land use and cover change in the semi-arid regions of China on the temperature in the early 21st century. Clim. Environ. Res. 2016, 21, 65–77. [Google Scholar]
- Jiang, Y.Y.; Du, W.T.; Huang, J.; Zhao, H.Z.; Wang, C.F. Analysis of vegetation changes in the Qilian Mountains during 2000–2015. J. Glaciol. Geocryol. 2017, 39, 1130–1136. [Google Scholar]
- Jia, W.X.; Chen, J.H. Variations of NDVI and its response to climate change in the growing season of vegetation in Qilian Mountains from 1982 to 2014. Res. Soil Water Conserv. 2018, 25, 264–268. [Google Scholar]


| Judgment Basis | Interaction |
|---|---|
| q(X1∩X2) < Min(q(X1), q(X2)) | Non-linear weakening |
| Min(q(X1), q(X2)) < q(X1∩X2) < Max(q(X1)), q(X2)) | Single-factor nonlinear attenuation |
| q(X1∩X2) > Max(q(X1), q(X2)) | Two-factor enhancement |
| q (X1∩X2) = q(X1) + q(X2) | Independent |
| q(X1∩X2) > q(X1) + q(X2) | Non-linear enhancement |
| IMF1 | IMF2 | IMF3 | IMF4 | Trend Term (RES) | |
|---|---|---|---|---|---|
| Periodicity | 3 | 5 | 13 | 24 | —— |
| Variance contribution (%) | 29.49 | 23.51 | 20.50 | 16.63 | 9.87 |
Publisher’s Note: MDPI stays neutral with regard to jurisdictional claims in published maps and institutional affiliations. |
© 2021 by the authors. Licensee MDPI, Basel, Switzerland. This article is an open access article distributed under the terms and conditions of the Creative Commons Attribution (CC BY) license (https://creativecommons.org/licenses/by/4.0/).
Share and Cite
Zhang, L.; Yan, H.; Qiu, L.; Cao, S.; He, Y.; Pang, G. Spatial and Temporal Analyses of Vegetation Changes at Multiple Time Scales in the Qilian Mountains. Remote Sens. 2021, 13, 5046. https://doi.org/10.3390/rs13245046
Zhang L, Yan H, Qiu L, Cao S, He Y, Pang G. Spatial and Temporal Analyses of Vegetation Changes at Multiple Time Scales in the Qilian Mountains. Remote Sensing. 2021; 13(24):5046. https://doi.org/10.3390/rs13245046
Chicago/Turabian StyleZhang, Lifeng, Haowen Yan, Lisha Qiu, Shengpeng Cao, Yi He, and Guojin Pang. 2021. "Spatial and Temporal Analyses of Vegetation Changes at Multiple Time Scales in the Qilian Mountains" Remote Sensing 13, no. 24: 5046. https://doi.org/10.3390/rs13245046