Article

Monitoring the Characteristics of Ecological Cumulative Effect Due to Mining Disturbance Utilizing Remote Sensing

State Key Laboratory of Water Resource Protection and Utilization in Coal Mining, Beijing 102209, China
*
Author to whom correspondence should be addressed.
Remote Sens. 2021, 13(24), 5034; https://doi.org/10.3390/rs13245034
Submission received: 15 November 2021 / Revised: 5 December 2021 / Accepted: 6 December 2021 / Published: 10 December 2021

Abstract

:
This study conducted land cover classification and inversion analysis to estimate land surface temperature, soil moisture, specific humidity, atmospheric water vapor density, and relative humidity using remote sensing and multi-source mining data. Using 1990–2020 data from the Shendong mining area in Inner Mongolia, China, the eco-environmental evolution and the ecological cumulative effects (ECE) of mining operations were characterized and analyzed at a long-term scale. The results show that while the eco-environment was generally stable, mining activities affected the eco-environment at the initial stage (1990–2000) to a certain degree. During the rapid development stage of coal mining, the eco-environment was severely damaged, and the ECE were significant at the temporal scale. The absolute value of the change rate of ecological parameters was increasing. Due to an increased focus on ecological restoration, starting in 2010, the environmental indicators gradually stabilized and the eco-environment improved considerably, ushering in a period of stability for coal mining activities. The absolute value of the change rate of ecological parameters became stable. Analysis of the change in eco-environmental indicators with distance and comparison to the contrast area showed the ECE characteristics from mining disturbance at the spatial scale. This study shows that remote sensing technology can be used to characterize the ECE from mining operations and analyze eco-environmental indicators, providing crucial information in support of ecological protection and restoration, particularly in coal mining areas.

1. Introduction

Ecological cumulative effect (ECE) refers to the cumulative impact on the eco-environment caused by activities from the past to the future. This metric is particularly useful for understanding that, while the individual effects of some operations may be small or subtle, the combined effects could be significant [1]. Characterized by long-term lagging, accumulation, and interaction [2], the ECE consists of temporal and spatial aspects. The temporal cumulative effect refers to the accumulation generated when the time interval between two disturbances is less than that required by environmental restoration. The spatial cumulative effect refers to the accumulative phenomenon generated when the distance between two disturbances is less than that required by the attenuation [3].
Understanding the cumulative effects on the environment of policies, industries, and other economic activities is extremely important when evaluating choices and addressing the long-term effects caused by various anthropogenic endeavors. One such industry where the holistic comprehension of environmental effects is crucial is coal mining. Although coal mining has brought huge economic benefits, it also has resulted in the continuous decline in the quality of soil, water, vegetation, and atmosphere in the mining area, and has caused long-term adverse effects on the ecological environment [4,5,6]. Given its small object and long-duration features, the eco-environmental change caused by coal mining activities shows typical cumulative effect characteristics, which could be reflected by the superposition of the damage degree at the temporal scale and the attenuation with distance at the spatial scale. The cumulative effect from coal mining activities has accelerated the degradation of eco-environmental quality. Therefore, analyzing the cumulative effect of coal mining would be extremely useful for ecological restoration and sustainable development.
The impact of mining and restoration activities in coal mining areas is a continuous and intense process. Environmental effects vary considerably at the different stages of mining (i.e., initial stage, intense phase, stable period, reduction phase, and closure stage), as well as before, during, and after ecological restoration. Generally speaking, there is a coupling relationship between mining and restoration activities and various eco-environmental factors. This means that monitoring and evaluating the eco-environment in coal mining areas require specialized observational techniques involving large-scale, high-frequency, continuous, long-term, and comprehensive observations and quantitative analyses. However, traditional approaches, such as field surveys, ground monitoring stations, and sensor networks are unable to meet these requirements.
In recent years, remote sensing has been used to monitor and evaluate the eco-environment in mining areas, given its ability to provide rapid synchronous observations in large areas [7,8,9,10,11]. The combination of remotely sensed images and ground data can generate land cover information and physical-chemical parameters of various ecological elements, which are essential in estimating the ECE of mining activities [12]. Numerous studies have employed and developed remote sensing techniques to measure ecological parameters in mining areas. For example, in terms of land cover, Balaniuk et al. [13] used Sentinel-2 satellite images to conduct nationwide automatic identification and classification of open-pit mines and tailings dams in Brazil, with an accuracy of more than 95%. A systematic image analysis method based on geographical objects (GEOBIA) was proposed by Nascimento et al. [14], and land-use changes of open-pit mines were quantified using high-resolution satellite images from different sensors, with an accuracy of more than 90%. In terms of ecological parameters, Wu et al. [15] adopted the BFAST algorithm to detect abrupt changes in vegetation cover from open-pit mining using Landsat time series. This algorithm can automatically detect the time of initial mining and evaluate the spatial distribution of vegetation destroyed by mining. Fu et al. [16] monitored NDVI (Normalized Difference Vegetation Index) in Xilinhot using the rate of change in greenness (RCG) and coefficient of variation (CV) as indicators. They used correlation analysis and stepwise regression to analyze the driving factors of vegetation and the impact of mining activities. Using SPOT 5/6 and WorldView-2 data, Liu et al. [17] analyzed soil moisture (SM) in the Dariuta Coal Mine through the Scaled SM Monitoring Index (S-SMMI). Cao et al. [18] analyzed land use, vegetation cover, and land surface temperature (LST) of the Jixi mining area in Heilongjiang with the Landsat 8 Operational Land Imager (OLI) data and used correlation analysis to explore the influence of land-use types, vegetation cover and coal mining activities on LST. García Millán et al. [19] detected water distribution change through multi-temporal analysis of multispectral data and extracted mine-related flood zones using high-resolution hyperspectral data. Using Hyperion hyperspectral data and Landsat data, Kayet et al. [20] conducted indirect monitoring of dust in opencast iron ore mines using eight vegetation indices. When analyzed and compared with field measurements, the remote sensing estimates were found to be reliable. In terms of cumulative effect [21,22,23,24], a pixel-based Ecosystem Service Value (ESV) time series model was proposed that quantified the ECE of the Yanzhou Coalfield over the past 30 years. However, to the best of our knowledge, there has been no study estimating the ECE of coal mining operations and analyzing its temporal and spatial dimensions using remote sensing.
Using long-term remote sensing and multi-source spatial data from 1990 to 2019, this study performed land cover classification and change detection and quantitatively estimated land surface (LST and SM) and atmospheric parameters (specific humidity, atmospheric water vapor density, and relative humidity). The characteristics of ECE due to coal mining disturbance were also analyzed temporally and spatially.

2. Study Area and Datasets

2.1. Study Area

The study area is located in the Ejin Horo Banner, Inner Mongolia Autonomous Region, and the Shenmu, Shaanxi Province, China (Figure 1).
Ejin Horo Banner is located in the southeastern part of Ordos, Inner Mongolia, China. The southern part comprises the northern edge of the Mu Us Desert. The area has an average annual temperature of ~6.9 °C, and the terrain is high in the northwest and low in the southeast. Having a typical temperate continental climate, the region is dry, experiences little rainfall, and has annual precipitation less than evaporation. The vegetation is mostly herbaceous and small shrubs. Ejin Horo Banner is rich in mineral resources, the third-largest coal-producing county in China, and is considered a critical national energy strategic base [25], with coal reserves of 56 billion tons and an annual output of about 200 million tons. Shenmu, found in Yulin, Shaanxi, is a transitional zone from grassland, forest, and hill to steppe and desert. The area has a typical temperate continental climate and has an annual average temperature of ~8.9 °C. Shenmu is located in the southeastern part of the Mu Us Desert and has proven coal reserves of over 50 billion tons, with stable coal occurrence and excellent mining conditions [26,27].
The Shendong mining area across the Ejin Horo Banner and Shenmu is one of the most famous coal fields and mining bases with the largest proven reserves in China. According to the statistical data of raw coal output in Ordos and Yulin, from 1990 to 2019 [28], the study area underwent three stages of development based on the intensity of coal mining activities: initial stage (1990–2000), rapid development stage (2001–2010) and stable operation stage (2011–2019). Ecological restoration efforts in the mining site have increased considerably since 2005.

2.2. Datasets

The Landsat data used in this paper have been processed by cloud removing, radiometric calibration, atmospheric correction, mosaicking and clipping. The time range from 1 July to 1 September during 1990–2020 was selected as the time range of the image. Images with less than 5% cloud cover were utilized. All of the steps were completed on Google Earth Engine’s remote sensing cloud computing platform. In this study, Landsat images were used for retrieving the ecological parameters (Figure 2).
In addition, ASTER-GDEM (Advanced Spaceborne Thermal Emission and Reflection Radiometer–Global Digital Elevation Model) images were used in land cover classification. FLDAS (Famine Early Warning Systems Network Land Data Assimilation System), Chinese farmland soil moisture ten-day dataset, and other soil moisture products were used for estimating soil moisture, while the Atmospheric reanalysis ERA5 dataset was used for determining the atmospheric parameters.

3. Methodology

The main methods used in the study are as follows: multi-source remote sensing data processing, remote sensing classification of land cover in mining areas, inversion of land surface ecological parameters, reanalysis of atmospheric parameters, and analysis of impacts on the ecological environment. The corresponding flowchart of the technology framework is presented in Figure 3.

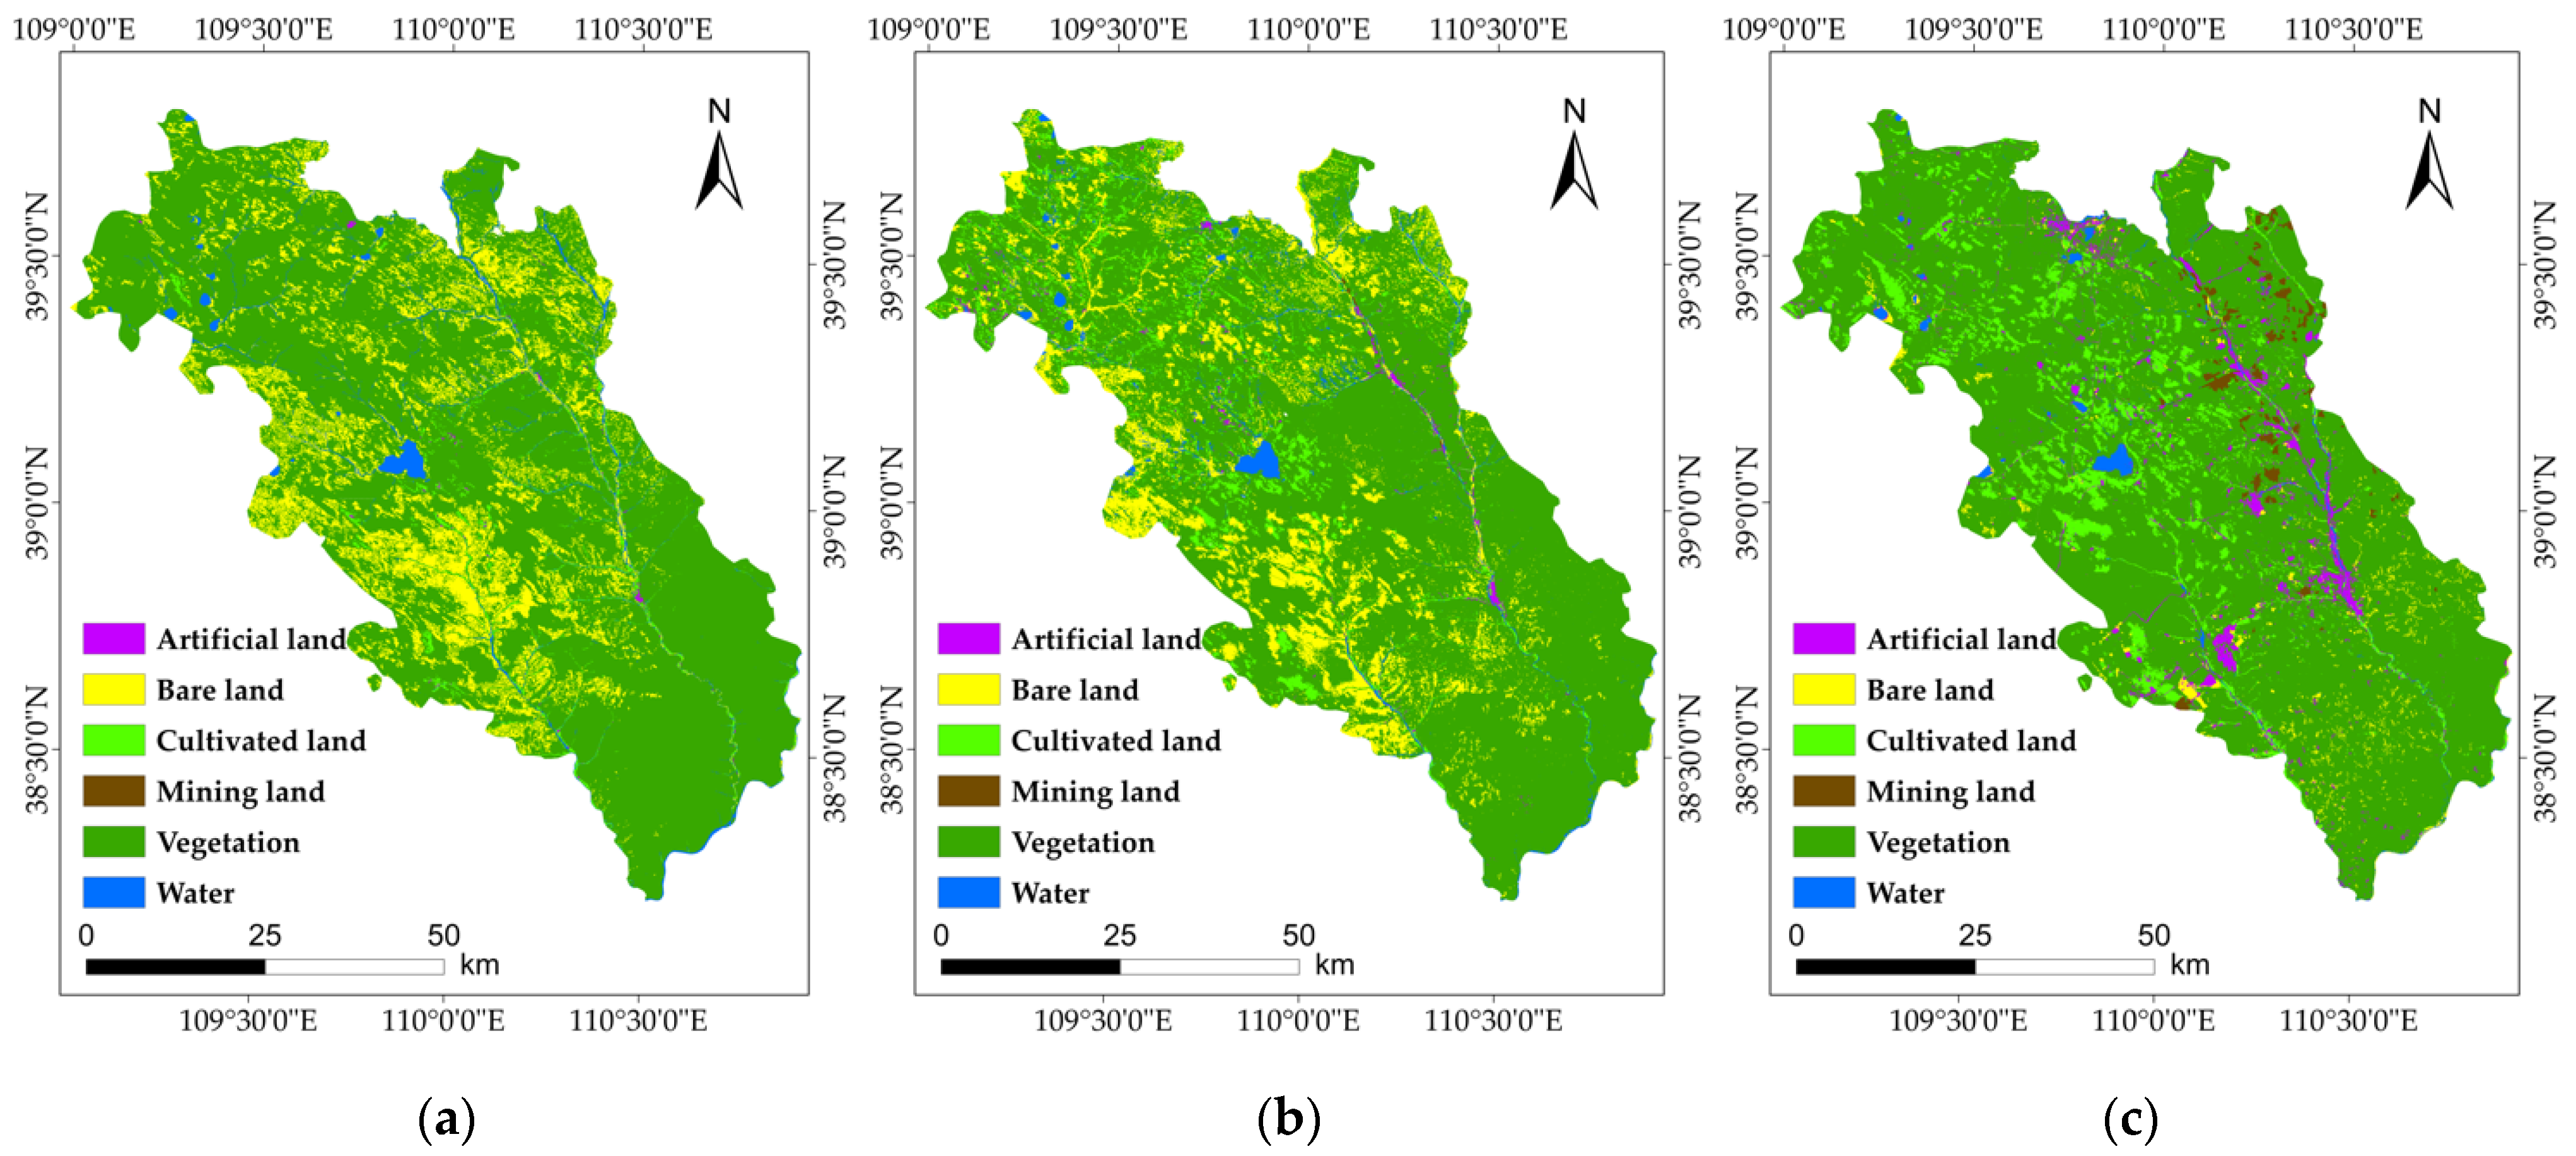
3.1. Land Cover Classification

The study area was classified into six land cover types: vegetation, water area, cultivated land, bare land, mining land, and artificial land (i.e., urban and construction lands). Using high spatial resolution historical images, samples for each land cover type were selected using manual interpretation and were then used for model training and result verification. The Random Forest (RF) [29] classification algorithm, an integrated learning algorithm based on multiple decision trees, was adopted to generate land cover classification for the mining areas using remote sensing images. Figure 4 presents the schematic diagram of the RF algorithm.

3.2. Inversion of Land Surface Ecological Parameters

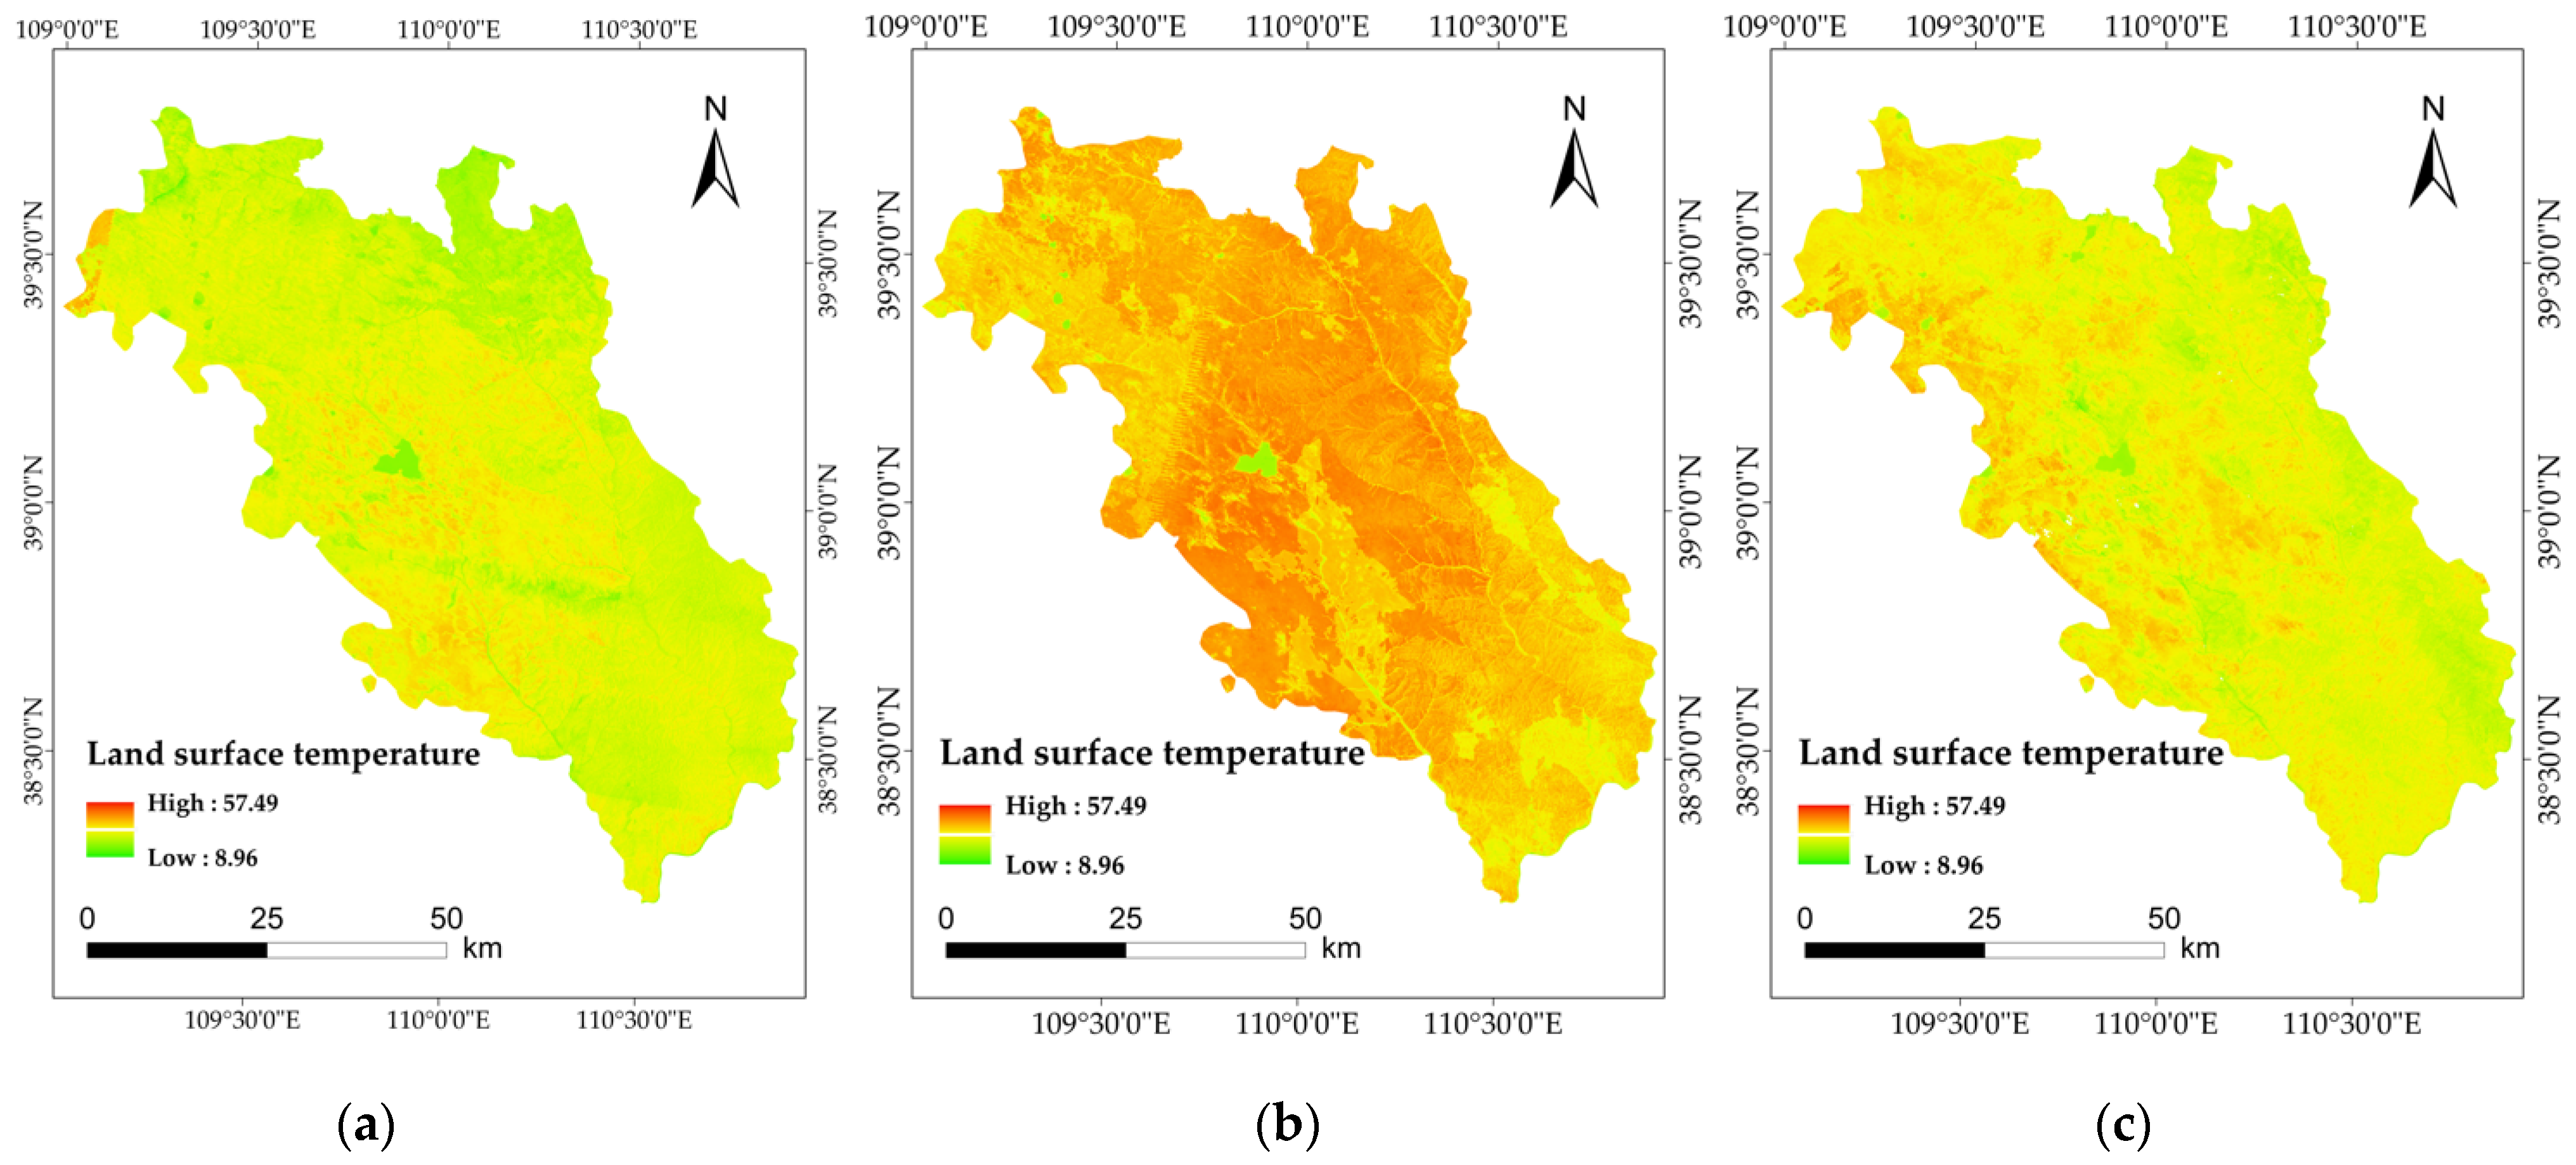
3.2.1. Inversion of LST

The method proposed by Xu [30] was used in the inversion analysis of the land surface temperature (LST). After acquiring the vegetation coverage using the pixel dichotomy method [31,32,33] and empirically determining the surface emissivity of different ground objects [34], LST can be obtained using the formula:
T S = T / [ 1 + ( λ T / ρ ) ln ε ]
where T is the temperature value at the sensor, which can be obtained by radiation calibration; λ is the center wavelength of the thermal infrared band of the sensor; ρ = 1.438 × 10⁻² mK; and ε is the emissivity of the surface.

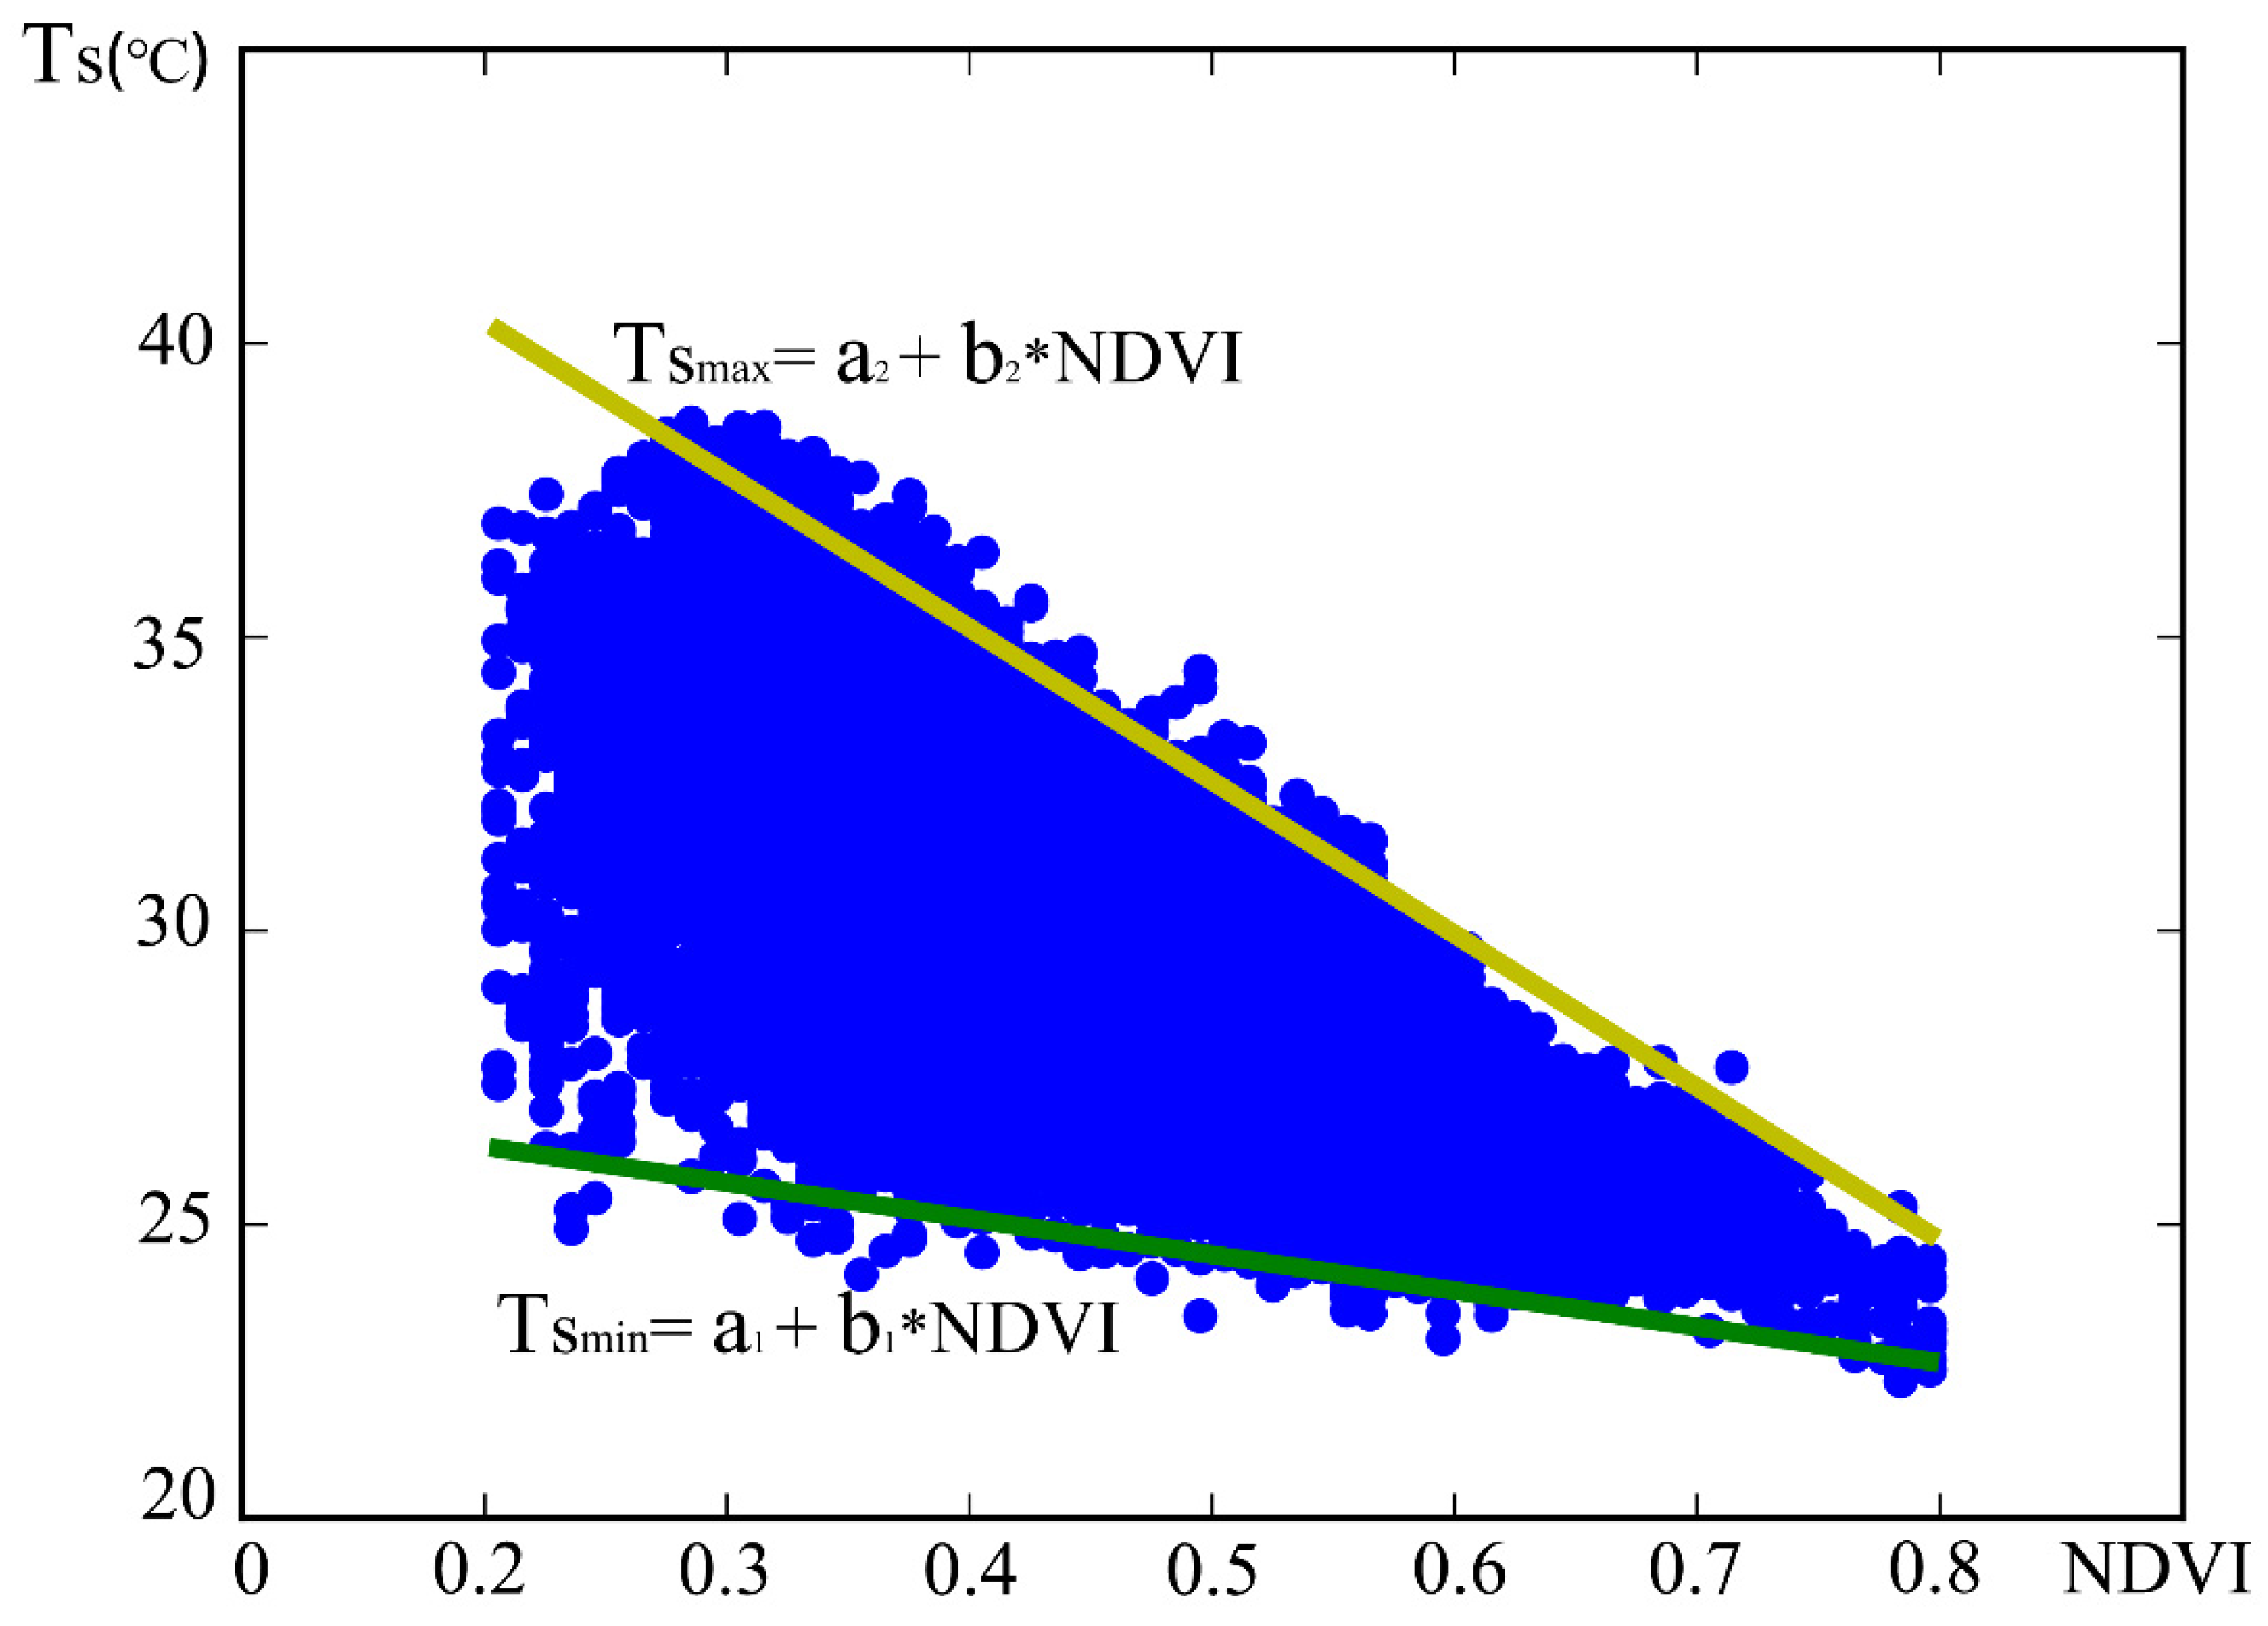
3.2.2. Inversion of SM

The Temperature Vegetation Dryness Index (TVDI) [35] was used for the inversion of soil volumetric moisture (unit: m3/m3). The Normalized Difference Vegetation Index (NDVI) is calculated by the formula:
NDVI = NIR R NIR + R
where NIR represents the reflectivity in the near-infrared waveband, and R represents the reflectivity in the red-light waveband.
The TVDI is determined by constructing the feature space of LST (Ts) and NDVI (Figure 5) and calculated using the following equations:
TVDI = T S T S min T S max T S min
T S min = a 1 + b 1 NDVI
T S max = a 2 + b 2 NDVI
where a1, b1, a2, and b2 are the undetermined coefficients of the dry-wet edge, obtained by fitting the dry-wet edge equations using the least square method [36]. Equation (6) is obtained by substituting Equations (4) and (5) into Equation (3).
TVDI = T S ( a 1 + b 1 NDVI ) ( a 2 + b 2 NDVI ) ( a 1 + b 1 NDVI )
After scale conversion, the FLDAS dataset and the Chinese farmland soil moisture ten-day dataset were used to construct the remote sensing regression model of SM with the TVDI.

3.3. Atmospheric Parameter Reanalysis

The ERA5 reanalysis data provide temperature, pressure, relative humidity, and specific humidity values using 37 pressure levels. Note that the geopotential height should be converted into geometric height using the formula [37]):
h = R e ( φ ) · H g ( φ ) / g 0 · R e ( φ ) H
where h is the ellipsoidal height (km), H is the geopotential height (km), φ is the latitude, g0 = 9.80665 ms−2, Re(φ) is the radius of curvature of the Earth at latitude φ, and g(φ) represents the gravity on the geoid.
The converted meteorological parameters were then interpolated to obtain the atmospheric relative humidity and the atmospheric specific humidity at the Earth’s surface. The atmospheric water vapor density ρv can be obtained using the atmospheric equation of state:
ρ v = e R v T
where T is the temperature in Kelvin; Rv is the gas constant of water vapor equal to 461.5 J/kg; and e is the water vapor pressure, calculated from the relative humidity and temperature provided by ERA5 using the Magnus formula [38].
The water vapor humidity factors (i.e., density, relative humidity, and specific humidity) at the Earth’s surface can then be obtained. Time series analysis for these factors was conducted for the different production periods, and the change rates in the different regions were fitted by the least square method.

4. Results and Discussion

4.1. Analysis of the Changes of Eco-Environmental Elements

4.1.1. Analysis of Land Cover Change

The land cover classification results using remote sensing are shown in Figure 6. To further explore the evolution of the land cover changes in the past 30 years, changes in each land cover type were calculated for the different time periods. The results are presented in Figure 7, and the land cover transfer matrix is presented in Table 1. The results show that the vegetation area remained stable in the first decade, showed rapid growth after 2000, and experienced steady growth since 2015. There were also three stages of change occurring on the water cover type, i.e., a sharp decline stage (1990–2005), a gentle decline stage starting (2005–2015), and a gradual growth stage (2015–2019). Mining land was almost zero in 1990 and increased slowly from 1990 to 2000. Rapid growth in mining lands occurred since 2000, gradually decelerating in recent years. Cultivated land exhibited a steady growth trend, while bare land declined continuously over 30 years. Growth in artificial land was observed from 1990 to 2019, increasing relatively more from 2005 to 2019. More lands were converted into vegetation land compared to vegetation lands converted into other cover types, increasing the extent of vegetation land in the study area. Many vegetation and bare lands were also transformed into mining and artificial lands over the years, resulting in a considerable increase in mining and artificial land extents.

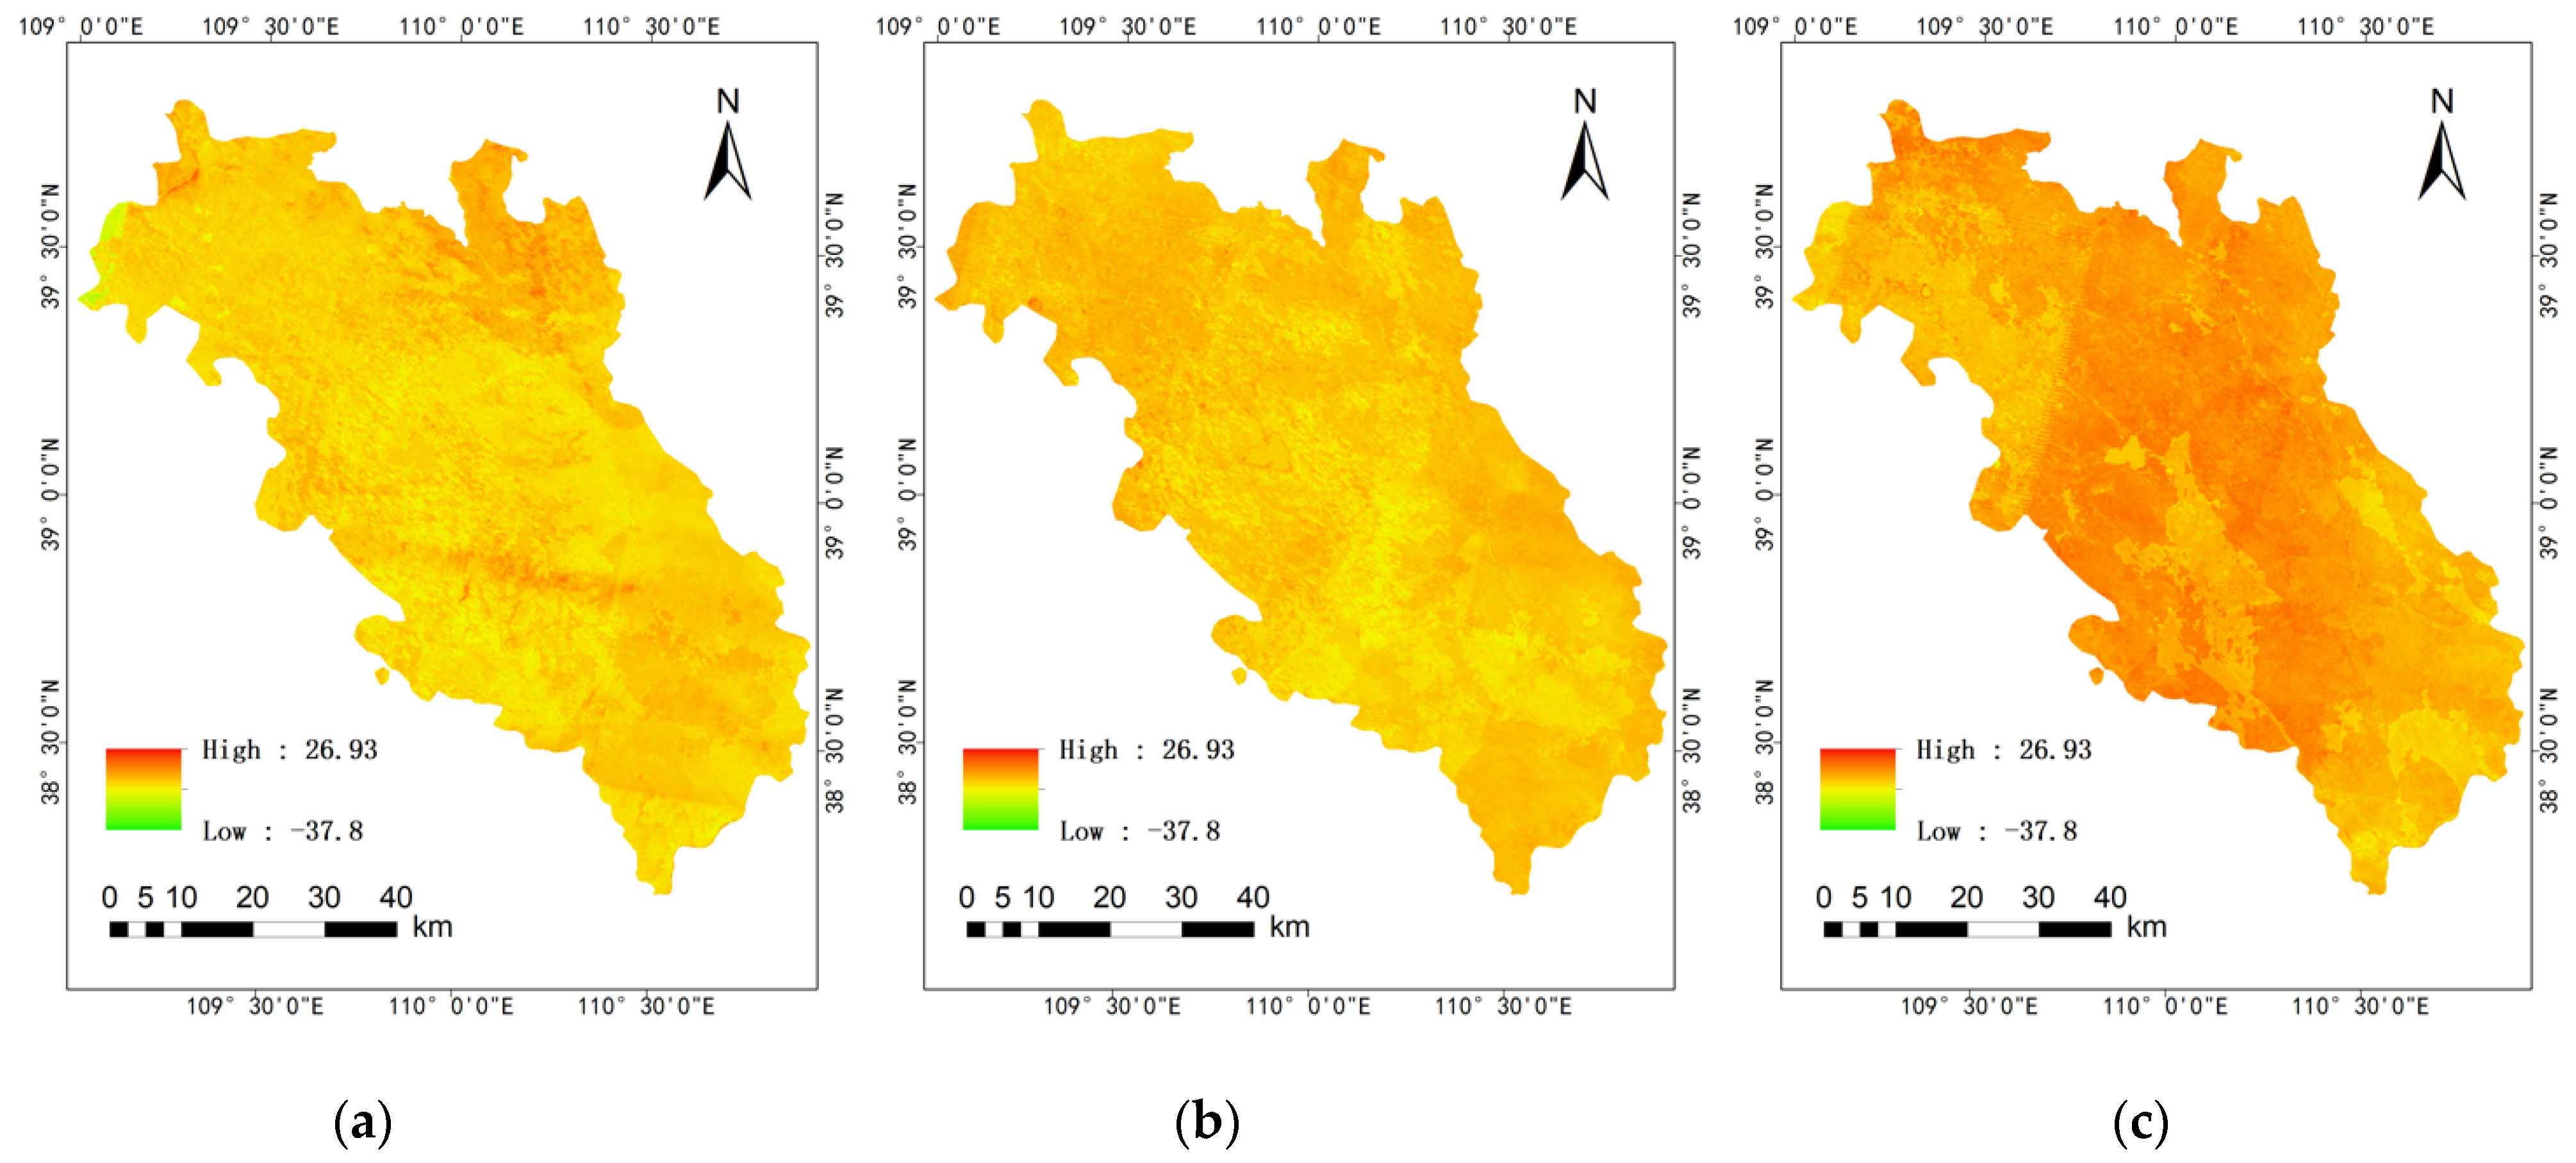
4.1.2. Analysis of the LST Inversion Results

The results of the LST inversion using remote sensing images (mean values from June to August in summer) are shown in Figure 8, while the mean LST values for summer at different years are presented in Figure 9. The results show the mean LST value increased annually from 1990, reaching its peak in 2005 with the value at over 40 °C. The LST decreased rapidly from 2005 to 2010, slightly increased in 2010–2015, and stabilized from 2015 to 2019. In particular, as shown in Figure 8, the LST has a more pronounced increase at the northeastern section of the central image from 1990 to 2005. This is because many coal mining areas are located in this region and have increased significantly over the years.
The LST change rates varied considerably during the 30-year study period. The increase in LST was accelerating from 1990 to 2005, which was the initial and rapid development stage of coal mining activities. The increased influence of mining activities accelerated the upsurge in LST, showing a significant ECE at the temporal scale. This was because more attention was given to ecological restoration and green mine construction, and the impacts caused by mining activities were artificially improved. When coal mining activities became stable after 2010, the LST change rate decelerated, and the impact of mining activities gradually stabilized.

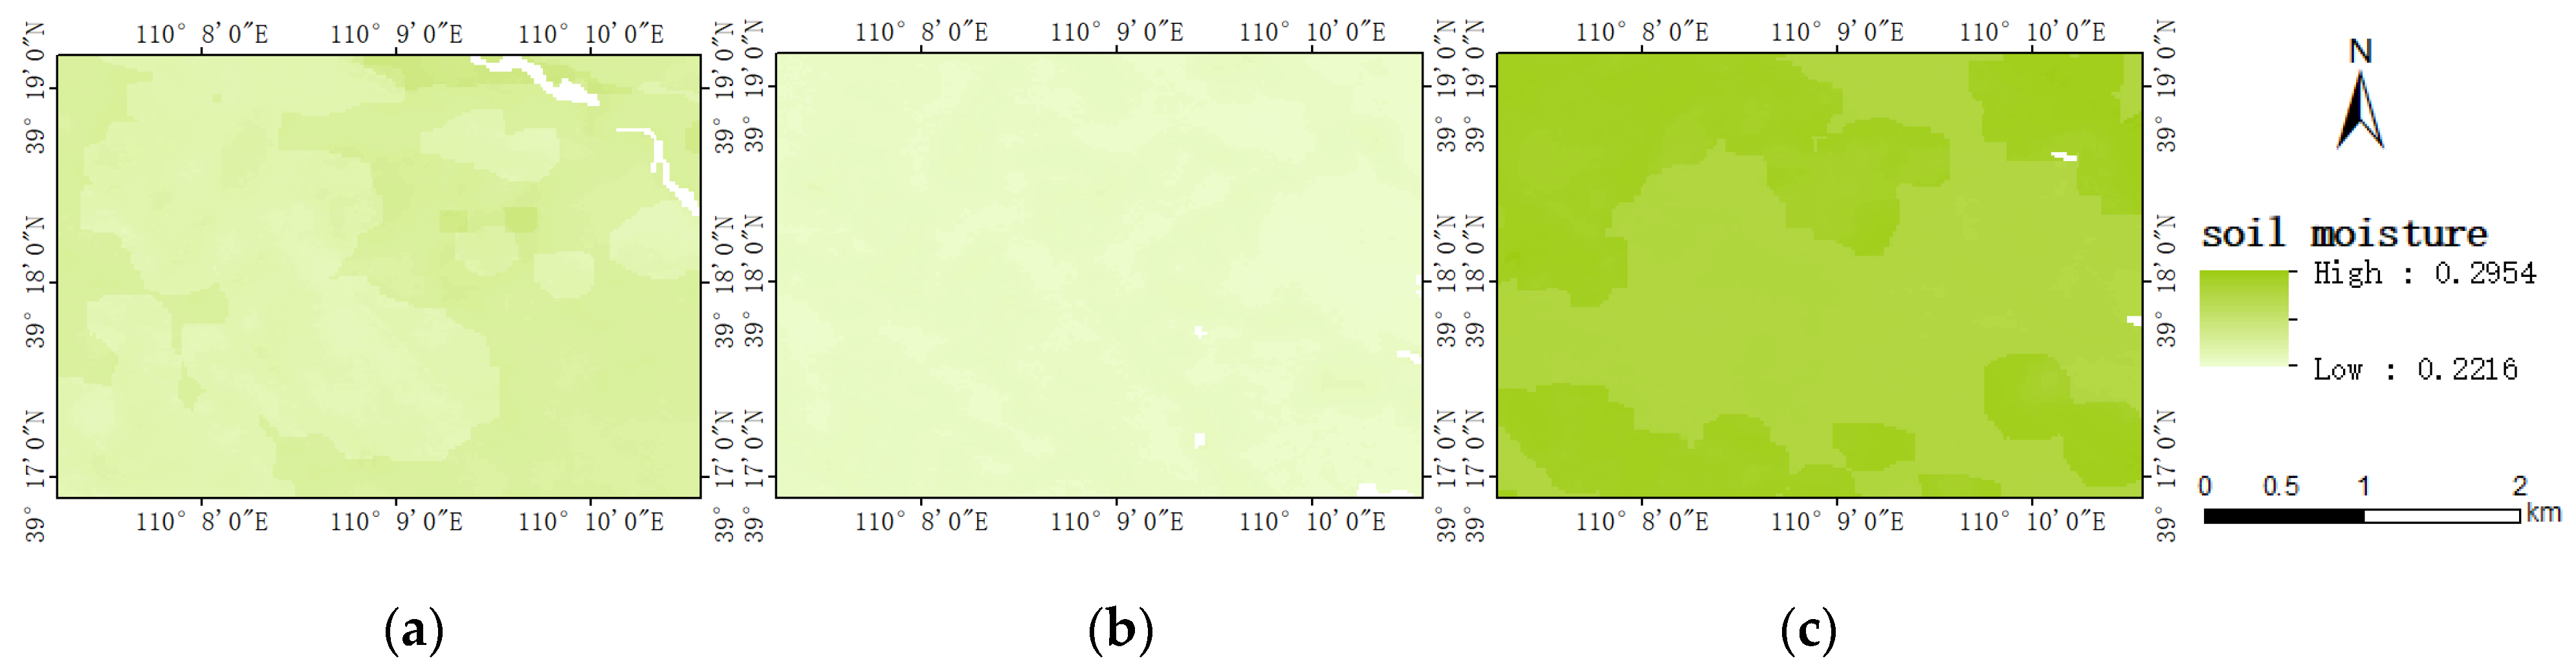
4.1.3. Analysis of the SM Inversion Results

The inversion results using remote sensing images (mean values from June to August in summer) are shown in Figure 10, while the mean SM values for summer (June–August) at different years are presented in Figure 11. As shown in the figures, SM experienced two different trends, i.e., a decreasing trend in 1990–2005 and the increasing trend in 2005–2019. The highest and lowest mean SM values were observed in 2005 and 2019, respectively.
The rate of increase in mean SM in 1990–1995 was comparable to its rate of decrease in 1995–2000. Note that the rate of decline in SM decelerated during the rapid development of coal mining activities (from 2000 to 2005). The reason may be that while there may have been increased mining activities during this period, people have started to pay greater attention to ecological restoration, environmental protection, and sustainability. Since 2005, the SM has gradually increased, particularly in 2015–2019, exhibiting apparent ecological cumulative effects related to progress in sustainable mining practices and focus on environmental protection.

4.1.4. Analysis of Atmospheric Parameters

ERA5 reanalysis data were used to obtain mean values for relative humidity, specific humidity, and atmospheric water vapor density (June to August). Figure 12, Figure 13 and Figure 14 show the spatial distribution of these parameters for 1990, 2005, and 2019. Specific humidity and atmospheric water vapor density exhibited pronounced spatial variations in each interval. In terms of spatial distribution, the parameter values were higher in the southern region than in the north. The three atmospheric parameters were also found to have similar trends in the time scale, showing a downward trend in 1990–2005 and a rising trend from 2005 to 2019. The three parameters reached their peak in 1990 and their minimum in 2005.
Figure 15 and Figure 16 show the interannual mean values (from June to August) for temperature and precipitation from 1990 to 2019. The mean temperature has been relatively stable for the past 30 years. The lowest temperature was recorded in 2003 at 19.9 °C, while the highest temperature occurred in 1999 and 2010 at 22.5 °C. The mean precipitation (June to August) changed significantly over the past 30 years. It reached its maximum value in 2016 at 65.8 mm and was relatively low in 2005, 2009, and 2010.

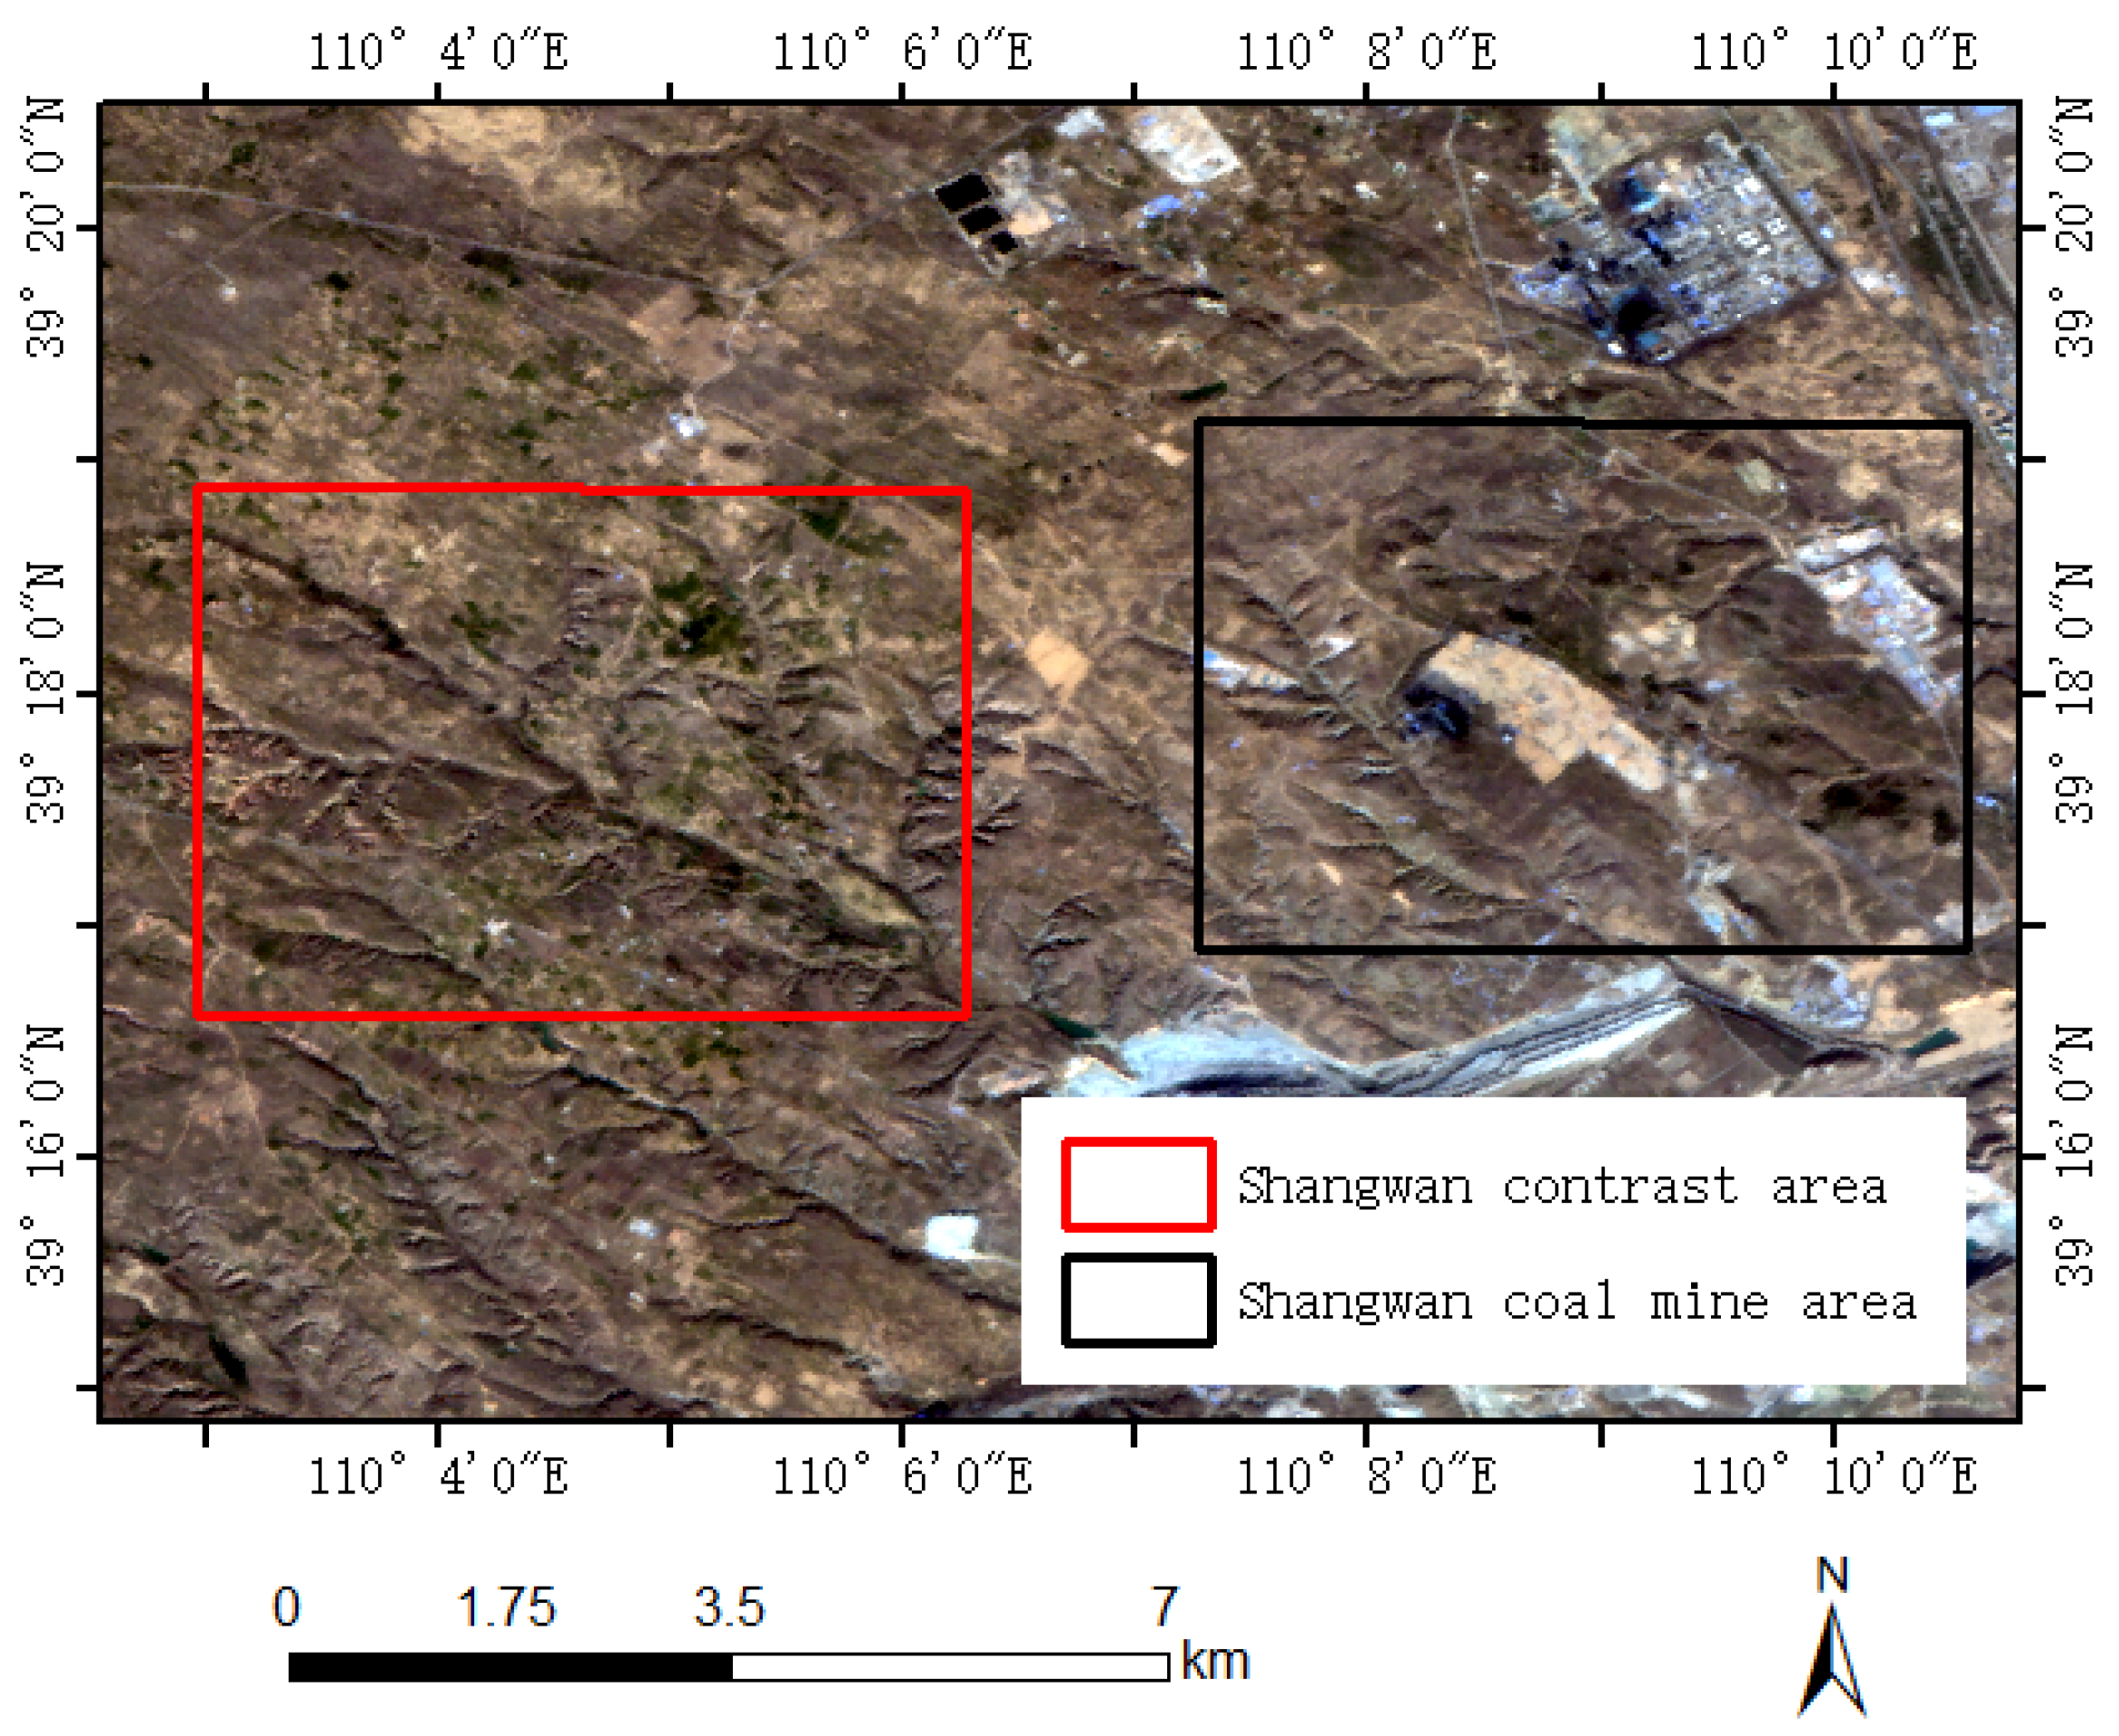
4.2. Monitoring of Key Mining Area—Shangwan Coal Mine

Shangwan coal mine (see Figure 17), located in Wulanmulun Town, Ejin Horo Banner, Ordos City, China, is one of the ultra-large modern backbone mines of Shenhua Shendong Coal Group Co., Ltd. [39]. The mine is a subterranean coal mine (pithead industry coal mine) with an area of 61.8 km2 and a geological reserve of 1.23 billion tons [40]. It started its operation in 2000, with an approved production capacity of 14 million tons per year.

4.2.1. Land Cover Classification of the Shangwan Coal Mine

The land cover classification results for the Shangwan coal mining area at different years are shown in Figure 18, and the tabulated results for each cover type are summarized in Table 2. In 1990, almost no mining land and artificial land was found in the Shangwan coal mining area; the main cover types were vegetation and bare lands. In 2005, the main cover types were still vegetation and bare land. Patches of cultivated land and mining land were observed, but there was still no artificial land. In 2019, most of the land had vegetation cover type; bare land decreased, while mining land and artificial land increased significantly. In the past 30 years, changes in the land cover types in the mining area have been pronounced. The primary land cover type was vegetation. Bare land and water had decreased considerably, while mining land and artificial land have increased year by year.
In Figure 19, the vegetation area in the Shangwan coal mining area showed an accelerated growth trend from 1990 to 2005. The effects of mining activities on the vegetation were minimal at this time, given that it was still the initial and early stages of development for mining activities. During the period of rapid development of coal mining activities (from 2005 to 2010), vegetation showed pronounced ECE, which gradually increased due to its cumulative effects year by year.
There was a slow decline in vegetation from 2010 to 2019. Compared with the previous period, vegetation in the Shangwan coal mine had increased overall, while water and bare lands had downward trends. In 2000, lands classified as water were more extensive than usual, possibly due to the heavy precipitation occurring in that year. The expansion of artificial lands accelerated in 2010–2015; coal mining processing plants (screening fields) and other artificial lands were built in the eastern part of the study area, given increased mining activities in the region. Cultivated lands had increased rapidly in 1990–2000 and fluctuated in the following decades. These changes are closely related to changes in human activities.

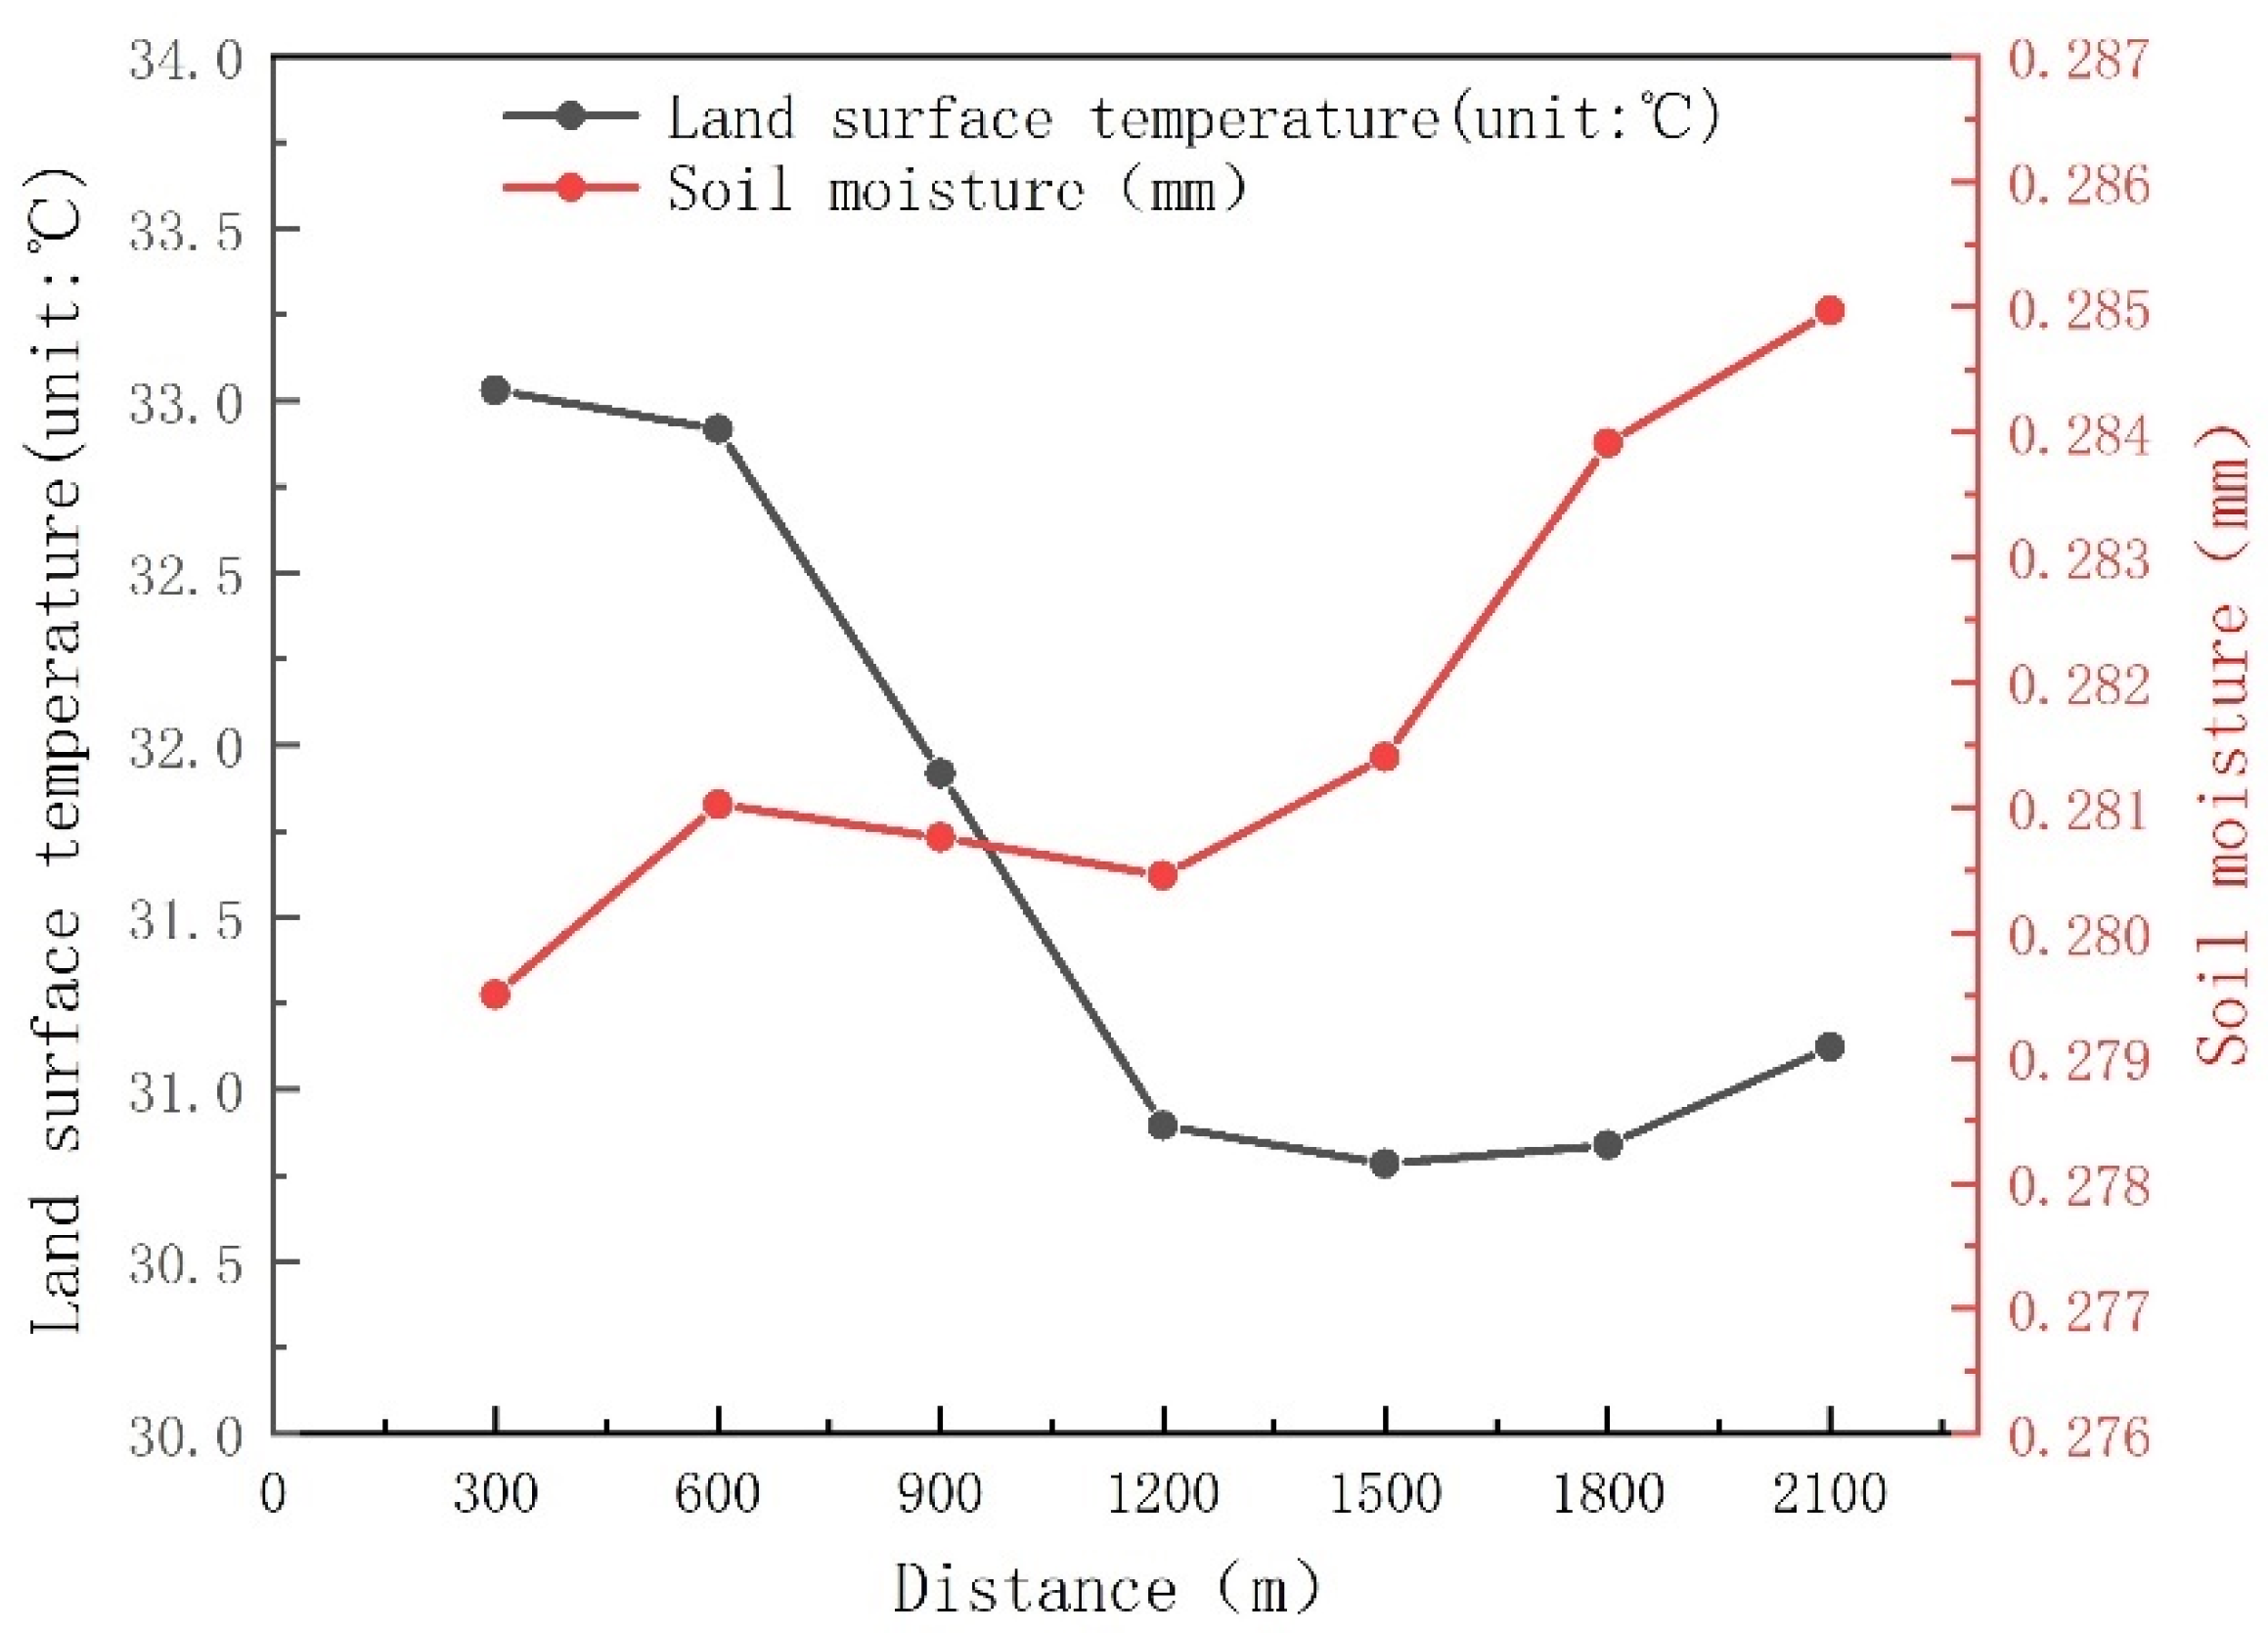
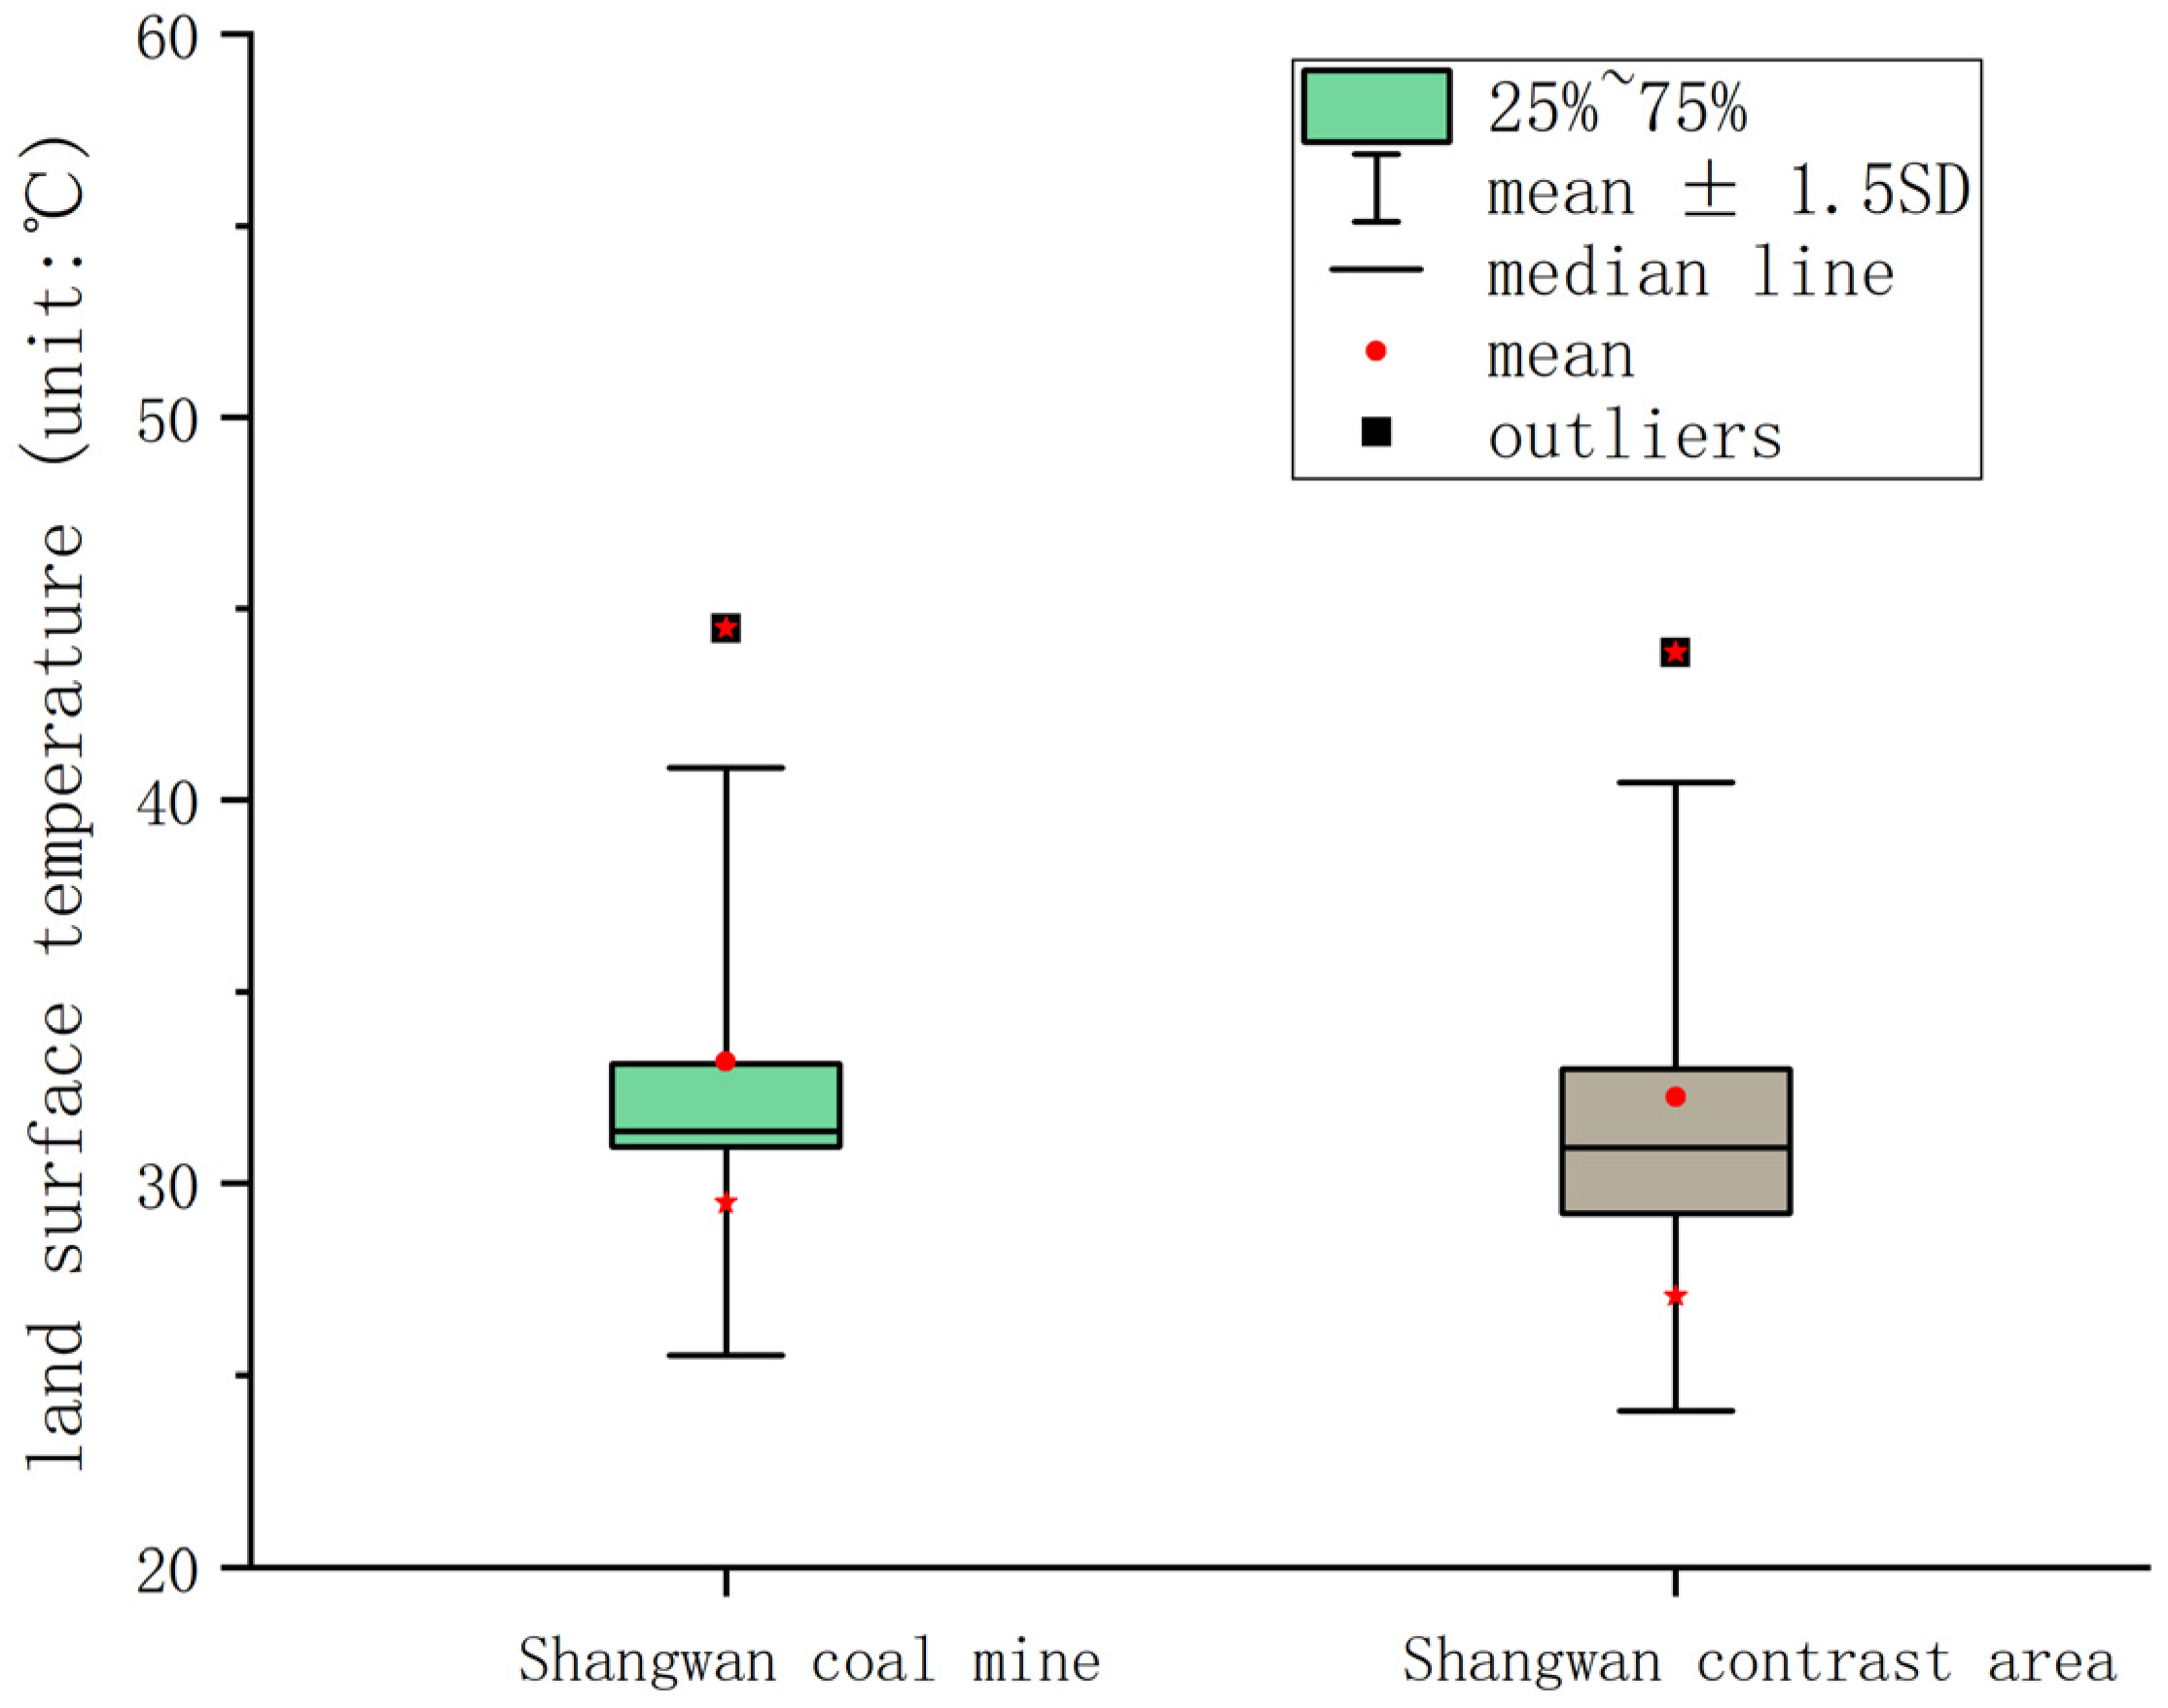
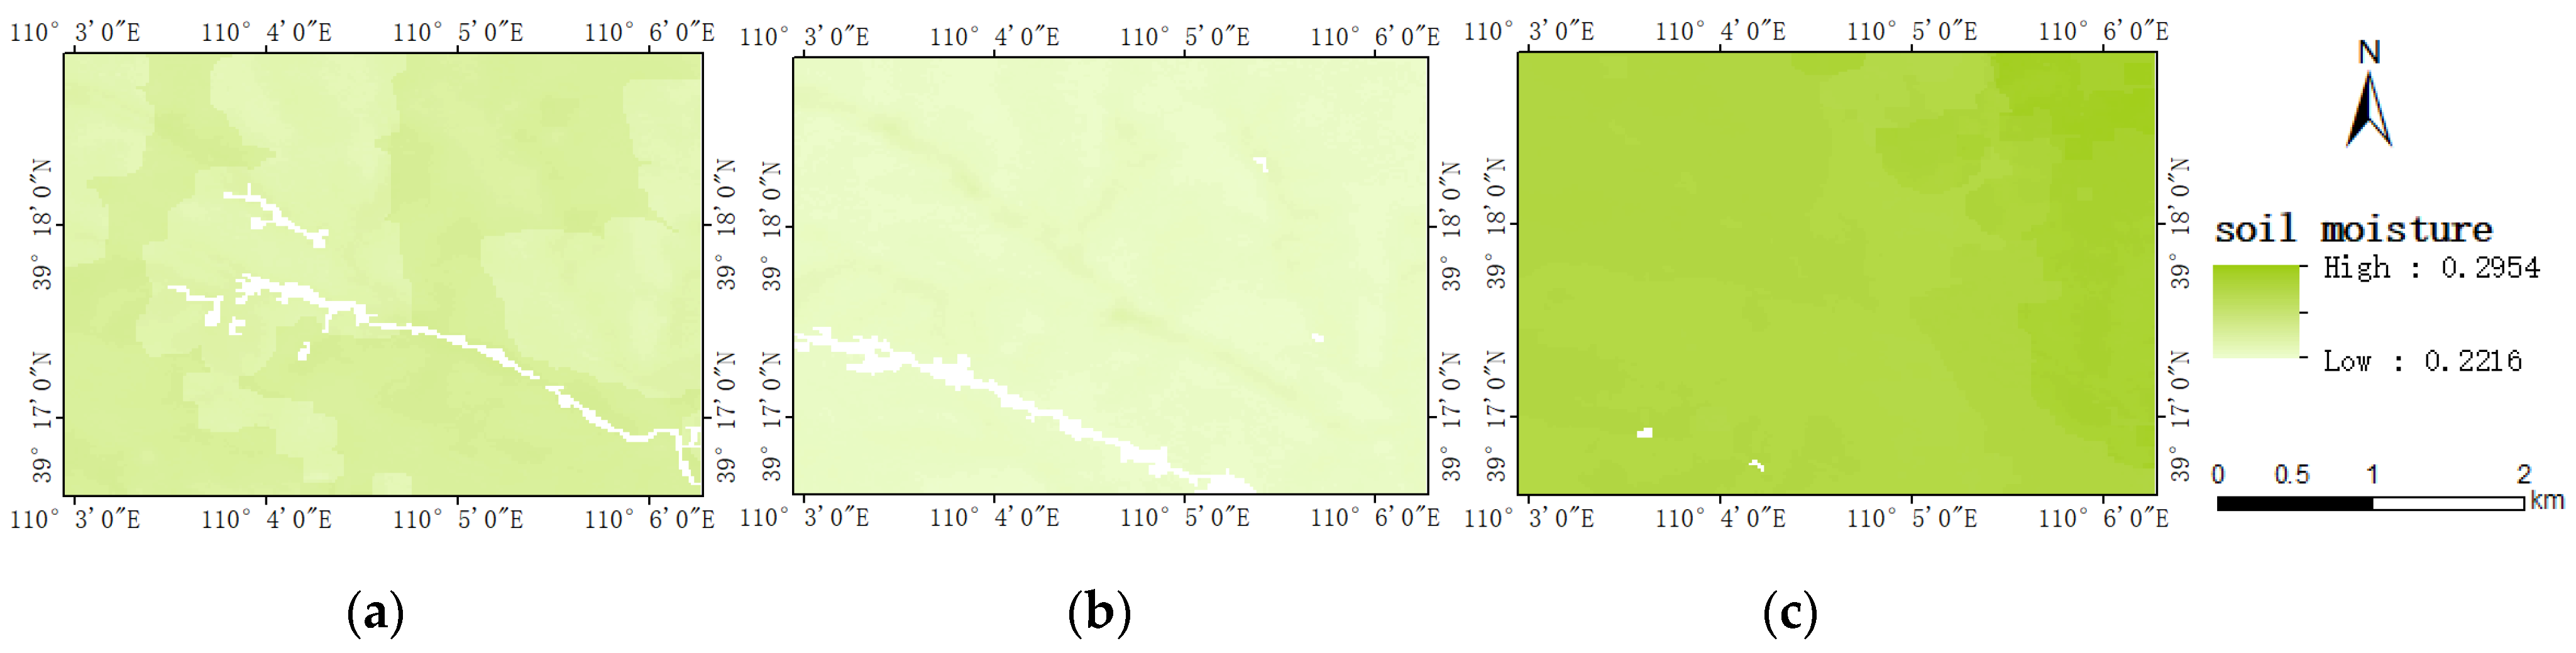
4.2.2. Analysis of LST and SM

The LST inversion results for the Shangwan coal mining area are shown in Figure 20, and the mean LST summer values (June to August) at different years are presented in Figure 21. The LST exhibited an overall upward trend in 1990–2005, reaching its peak in 2005 before declining in subsequent years. As shown in Figure 11 and Figure 21, the change trend in LST for the Shangwan coal mining area is comparable to that of the entire study area. The LST in the mining area gradually surged in 1990–2000 because the impact from mining on the surrounding environmental factors was weak at the initial stage of coal mining operations. From 2000 to 2010, the LST initially increased and then declined. To a certain extent, these changes were influenced by the cumulative effects of mining activities, showing particular ECE characteristics. The LST in the mining area increased gradually in 2010–2019, given the plateauing of coal mining activities, and the impact on the LST diminished.
The SM inversion results of the Shangwan coal mining area are shown in Figure 22, and the mean SM values for summer (June to August) at different years are presented in Figure 23. SM had an overall fluctuating trend, with the lowest value occurring in 2005 and the highest in 2019. SM was steady from 1990 to 2000. From 2000 to 2005, it dropped rapidly; this was caused mainly by long-term mining activities. From 2005 to 2020, SM was in an upward trajectory, surging particularly in 2015–2019. The pronounced SM changes in the Shangwan coal mining area are related, not only to the climate elements, but also to the ecological restoration measures being implemented at that time.

4.3. Characteristics of Ecological Cumulative Effect of Mining Disturbance

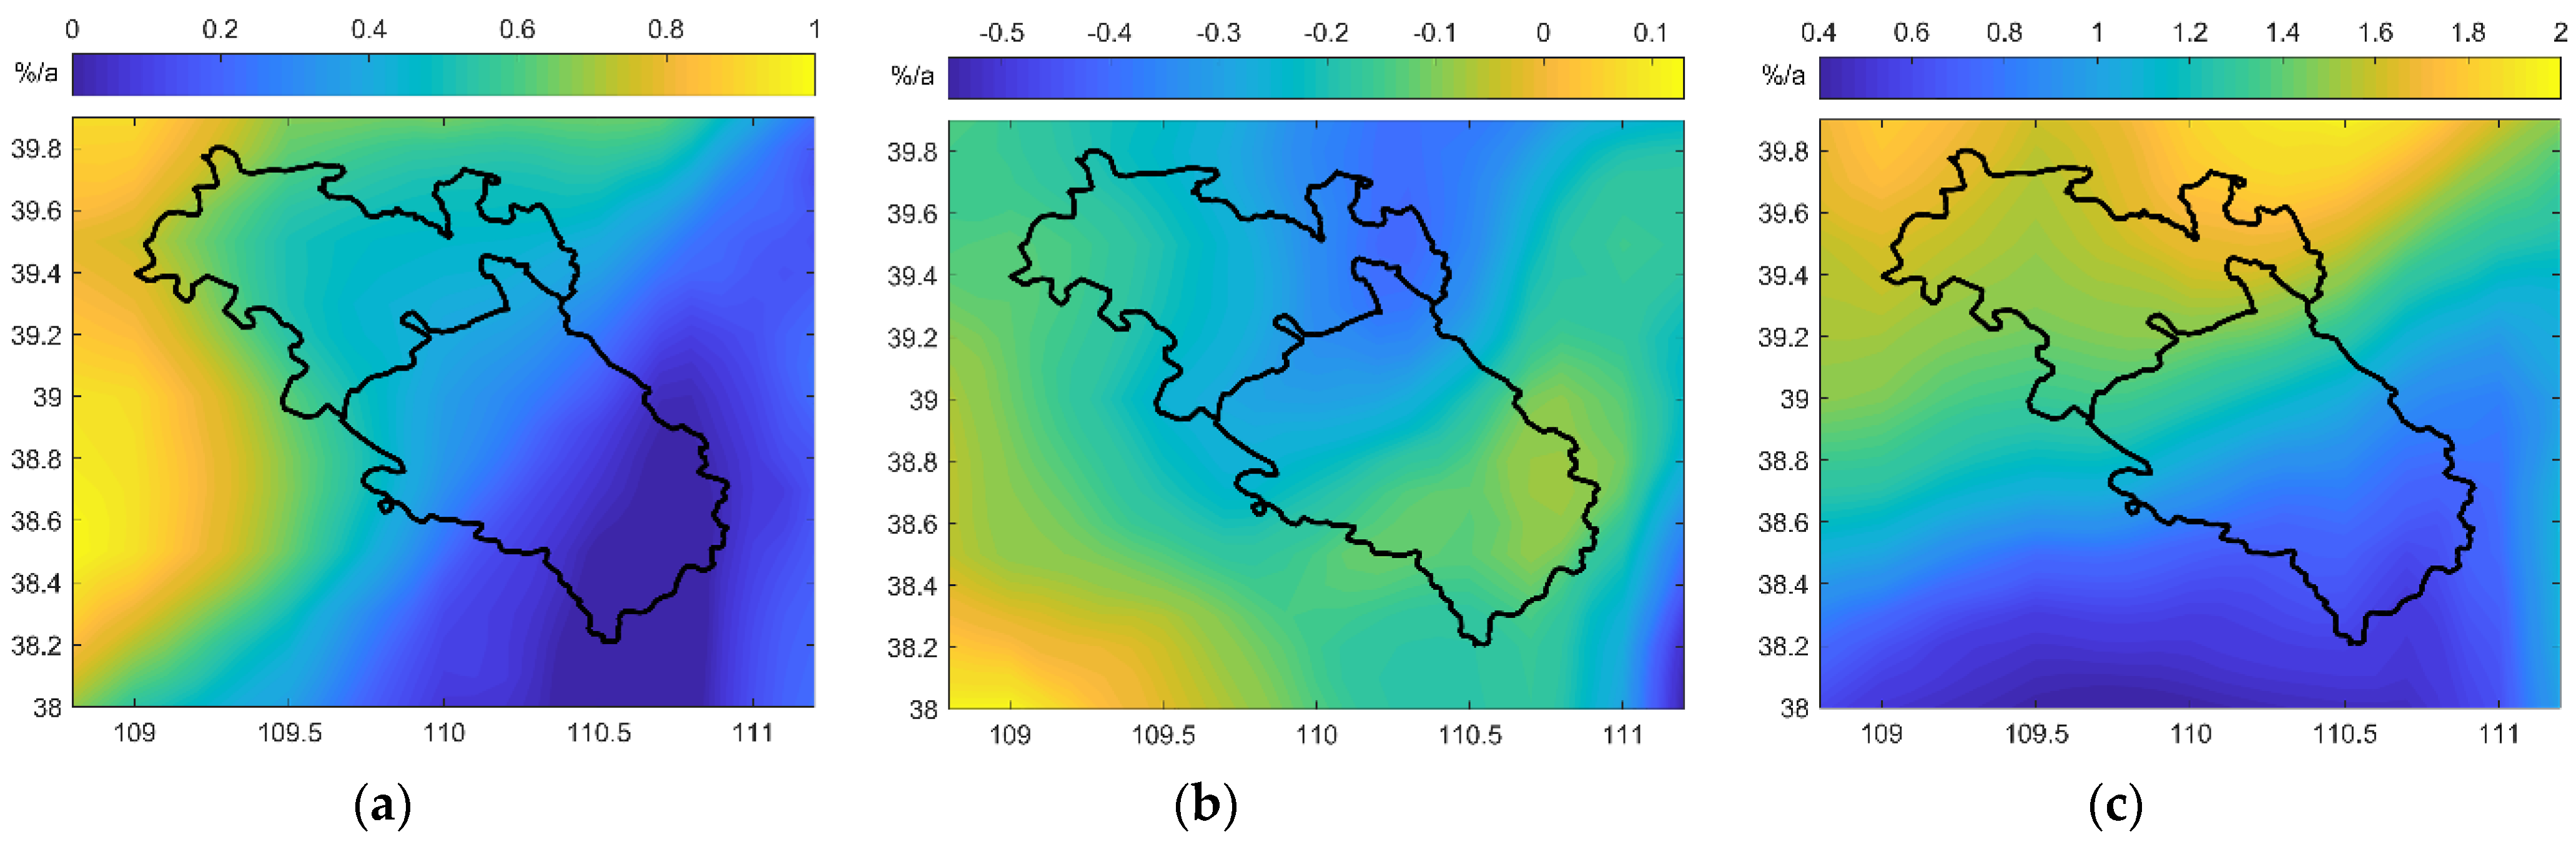
4.3.1. Features on the Time-Scale

The spatial distribution of change rates in LST and SM are shown in Figure 24 and Figure 25. The LST increased from 1990 to 2005, with the most pronounced surge occurring in 2000–2005. The LST in more than half of the study area decreased significantly in 2005–2010, especially in the eastern region. The LST increased from 2010 to 2019, comparable with the change in 1990–2000. A decrease in LST was observed in a small number of areas.
For 1990–2005, the SM in the study area decreased overall. SM mainly increased in 1990–1995 and then declined in the following decade. From 2005 to 2010, the SM increased considerably in the eastern part of the study area and slightly increased in other areas. From 2010 to 2015, the SM was comparable to the 2005–2010 levels, with the main difference being that in the east-central area, the SM decreased slightly. From 2015 to 2019, the SM of the entire study area had drastically changed.
Figure 26, Figure 27 and Figure 28 show the change rates in atmospheric specific humidity, atmospheric relative humidity, and atmospheric water vapor density. The atmospheric specific humidity increased from 1990 to 2000. However, the increase rate showed a decreasing trend from the northwest to the southeast, reflecting the variations in physical geography. The atmospheric specific humidity had a downward trend for 2000–2010, and the decrease rate near the mining area was significantly higher than that in other regions. From 2010 to 2020, the atmospheric specific humidity again surged, with a large increase rate and a significant ecological cumulative effect. The spatial and temporal distribution patterns of water vapor density and relative humidity change rate were consistent with that of atmospheric specific humidity.
The mean LST and SM change rates (in absolute value) at each time period are summarized in Figure 29. In the first four intervals (1990–1995, 1995–2000, 2000–2005, and 2005–2010), the mean LST change rate (in absolute value) showed an upward trend, indicating that the LST increase was accelerating. In 1990–2000, mining operations were still in the initial stage of development, and the succeeding decade (2000–2010) was the period for rapid development. During these years, with the gradual strengthening of mining activities, the influence of ecological factors also expanded, as indicated by the accelerated changes in LST. For 2010–2019, the values were in a downward trajectory, indicating a deceleration in LST change rates. At this period (2010–2019), coal mining activities were at the stage of steady development. Vigorous implementation of environmental protection and ecological restoration measures has gradually stabilized the ecological elements, as manifested by the decelerating changes in LST.
The change rate in mean SM (in absolute value) showed an upward trend in 1990–1995. From 1995 to 2010, the change rate of mean SM (in absolute value) decreased, indicating that it had weakened during this period. In 2015–2019, the slope showed an upward trend, indicating an accelerated change in mean SM.
Time accumulation is the cumulative phenomenon that occurs on the time scale when the time interval between two disturbances is less than the time required for environmental restoration. The external manifestation is an increase in the rate of change on the time scale. Therefore, the accelerated changes in LST and SM values show the ecological cumulative effect of mining disturbance on the time scale.

4.3.2. Features on Spatial Scale

As shown in Figure 30, seven buffer zones were set up, with the Shangwan Coal Mine as center and a 300 m interval between two adjacent buffers. The mean LST and SM values for each buffer zone in 2019 were then calculated, and the summary of results is presented in Figure 31.
The first buffer zone (>300 m) had the highest mean LST and the lowest average SM values. The mean LST gradually declines as the distance increases, while the mean SM exhibits a gradual upward trend. Spatial accumulation refers to the accumulative phenomenon generated on the spatial scale when the spatial proximity between adjacent disturbance factors is less than the distance required to remove each disturbance. Externally, the influence of disturbance on the spatial scale attenuates with the distance. Therefore, the variations in LST and SM with regard to distance show pronounced ECE characteristics on the spatial scale. Based on the temporal and spatial cumulative effect characteristics (Wang et al., 2010), the source of the cumulative effect may be attributed to mining disturbance by way of mining subsidence and the land-use change.
To better analyze the environmental evolution characteristics, we chose an area unaffected by human activities to compare with the Shangwan coal mining area. The contrast area is rectangular, located two kilometers from the western boundary of the Shangwan coal mining area, and is similarly sized as the study site. The high-resolution image of the contrast area is shown in Figure 32.
The land cover results of the contrast area at different years are shown in Figure 33, and the area statistics are summarized in Table 3. There was almost no mining or artificial land in the contrast area in 1990, and the main coverage types were vegetation (79%) and bare land (18%). In 2005, vegetation cover (90%) was still the primary coverage type, while barren land decreased to 8%. In 2019, vegetation (53%) decreased considerably, while bare land disappeared. Along with vegetation, cultivated land (47%) became a major land cover type, and new artificial lands (1%) were established. Results from the cover classification analysis reveal that the land cover in the contrast area has significantly changed; in particular, large portions of vegetation and bare lands were converted into cultivated land.
Figure 34 shows the various land cover changes in the Shangwan coal mining area and the contrast area for the last 30 years. The vegetation cover in these two areas exhibited a growing trend in the first 20 years but has since trended downwards in the last decade. Vegetation in the contrast area decreased further and faster than in the mining area. The change trends for water, bare land, and cultivated lands in the two areas are comparable, but cultivated lands have expanded more rapidly in the contrast area in the past five years. Both mining and artificial lands had increased in the mining zones.
The LST inversion results for the contrast area are shown in Figure 35. The overall LST increased from 1990 until its peak in 2005 and then declined. The SM values initially decreased, reached the lowest value in 2005, and then increased to the highest point in 2019.
Figure 36 shows the LST box plot for the Shangwan coal mining area and the contrast area. Comparing Figure 20 and Figure 35, the LST in the two regions showed a gradually increasing trend from 1990 to 2005. However, due to the emergence of mining land and artificial land in the Shangwan coal mining area in 2019, the coal mine processing plant and its surroundings yielded high LST values, while in other land cover types, the LST values were considerably lower. In the contrast area, the LST decreased overall. As shown in Figure 36, the Shangwan coal mining area had more concentrated LST values and a higher mean LST than the contrast area.
The SM inversion results for the contrast area are shown in Figure 37. The SM box plot between the Shangwan coal mining area and the contrast area is shown in Figure 38. Comparing Figure 22 and Figure 37, the two regions had similar SM change trends, decreasing initially and then increasing. As shown in Figure 38, the distribution of the SM value for the two regions is relatively consistent and concentrated. However, the mining area has lower mean SM than the contrast area, which indicates that mining activities affect SM and that the impact is highly concentrated.

5. Conclusions

Land cover classification and change analysis were carried out to retrieve land surface temperature, soil moisture, specific humidity, relative humidity, and atmospheric water vapor density using remote sensing and multi-source spatial data. The eco-environment change and the characteristics of ecological cumulative effect from coal mining operations were analyzed on a long-time scale. The Shangwan Coal mine was used as example in the comparative analysis between the mining zone and the contrast area. The main highlights of the study are as follows:
(1)
In the initial stage of coal mining activities (1990–2000), the eco-environment was generally stable, but mining activities had impacted the eco-environment to a certain degree.
(2)
During the rapid development stage of coal mining operations, the eco-environment was damaged severely, showing significant ECE, including temporal and spatial cumulative effects. The change rates for the eco-environmental parameters accelerated and showed pronounced ecological cumulative effects at the temporal scale. In 2010, coal mining activities entered a period of relative stability, and ecological restoration started to receive greater attention. The eco-environmental parameters gradually recovered, and the eco-environment generally improved. Results from the land surface temperature and soil moisture analyses and the spatial comparison with the contrast area show ECE characteristics due to mining disturbance at the spatial scale.
Future studies can comprehensively utilize remote sensing, ground investigation, and statistical data to conduct quantitative and high-frequency observations for more parameters at long-term scales in mining areas. The results would help support understanding the mechanisms and characteristics of the ecological cumulative effects caused by mining operations.

Author Contributions

Conceptualization, Q.L.; methodology, Q.L., J.G. and F.W.; software, J.G. and Z.S.; validation, F.W. and Z.S.; formal analysis, Q.L. and J.G.; investigation, Q.L. and J.G.; resources, Q.L. and J.G.; data curation, J.G. and F.W.; writing—original draft preparation, Q.L., J.G. and F.W.; writing—review and editing, Z.S.; visualization, F.W. and Z.S.; supervision, Q.L. and J.G.; project administration, Q.L. and J.G.; funding acquisition, Q.L. and J.G. All authors have read and agreed to the published version of the manuscript.

Funding

This research was funded by [Open Fund of State Key Laboratory of Water Resource Protection and Utilization in Coal Mining] grant number [GJNY-20-113-14], [State Key Laboratory of Coal Resources and Safe Mining] grant number [SKLCRSM19KFA04], [National Natural Science Foundation of China] grant number [41901291], and [Fundamental Research Funds for the Central Universities] grant number [2021YQDC02]. And The APC was funded by [GJNY-20-113-14].

Institutional Review Board Statement

Not applicable.

Informed Consent Statement

Not applicable.

Acknowledgments

The authors would like to thank the National Aeronautics and Space Administration for the open access to Landsat data and thank the European Centre for Medium-Range Weather Forecasts for the open access to ERA5 reanalysis data.

Conflicts of Interest

The authors declare no conflict of interest.

References

  1. Zhou, Q. A discussion on accumulation effect in environment effect appraisal. Energy Environ. Prot. 2013, 27, 60–62. [Google Scholar]
  2. Tollefson, C.; Wipond, K. Cumulative environmental impacts and aboriginal rights. Environ. Impact Assess. Rev. 1998, 18, 371–390. [Google Scholar] [CrossRef]
  3. Sun, J.; Bu, Q.; Wu, D.; Liu, Y.; Jiang, W. A review on evaluation of ecological cumulative effect in coal mining areas. Asian J. Ecotoxicol. 2019, 14, 74–82. [Google Scholar]
  4. Zhang, D.; Wen, P. The impact of coal mining on the ecological environment and its countermeasures. Energy Environ. 2019, 2, 74–75. [Google Scholar]
  5. Wang, B.; Zhao, N.; Gao, H. Environment problems and ecological restoration in coal mining areas. Shanxi For. Sci. Technol. 2020, 48, 104–106, 113. [Google Scholar]
  6. Hu, Z.; Xiao, W.; Zhao, Y. Re-discussion on coal mine eco-environment concurrent mining and reclamation. J. China Coal Soc. 2020, 45, 351–359. [Google Scholar]
  7. Li, J.; Pei, Y.; Zhao, S.; Xiao, R.; Sang, X.; Zhang, C. A review of remote sensing for environmental monitoring in China. Remote Sens. 2020, 12, 1130. [Google Scholar] [CrossRef] [Green Version]
  8. Liu, H.; Jiang, Y.; Xia, M.; Gao, J.; Jiang, Y. Ecological environment changes of mining area with 30 years’ remote sensing monitoring: A case study around Nansihu Lake, Shandong Province. Met. Mine 2021, 4, 197–206. [Google Scholar]
  9. Zhang, C.; Li, J.; Lei, S.; Yang, J.; Yang, N. Progress and prospect of the quantitative remote sensing for monitoring the eco-environment in mining areas. Met. Mine. in press.
  10. Werner, T.; Mudd, G.; Schipper, A.; Huijbregts, M.; Taneja, L. Global-scale remote sensing of mine areas and analysis of factors explaining their extent. Glob. Environ. Chang. 2020, 60, 102007. [Google Scholar] [CrossRef]
  11. Mezned, N.; Dkhala, B.; Abdeljaouad, S. Multitemporal and multisensory Landsat ETM+ and OLI 8 data for mine waste change detection in Northern Tunisia. J. Spat. Sci. 2018, 63, 135–153. [Google Scholar] [CrossRef]
  12. Zhang, H.; Zhang, K.; Liu, P.; Yu, Z.; Zhao, J. Ecological indexes extraction and safety assessment of coal mining area based on RS and GIS: Taking Jiaozuo Coal Mining Area as an example. Coal Sci. Technol. 2020, 48, 80–88. [Google Scholar]
  13. Balaniuk, R.; Isupova, O.; Reece, S. Mining and tailings dam detection in satellite imagery using deep learning. Sensors 2020, 20, 6936. [Google Scholar] [CrossRef]
  14. Nascimento, F.; Gastauer, M.; Souza-Filho, P.; Nascimento, W.; Santos, D.; Costa, M. Land cover changes in open-cast mining complexes based on high-resolution remote sensing data. Remote Sens. 2020, 12, 611. [Google Scholar] [CrossRef] [Green Version]
  15. Wu, Q.; Liu, K.; Song, C.; Wang, J.; Ke, L.; Ma, R.; Zhang, W.; Pan, H.; Deng, X. Remote sensing detection of vegetation and landform damages by coal mining on the Tibetan Plateau. Sustainability 2018, 10, 3851. [Google Scholar] [CrossRef] [Green Version]
  16. Fu, X.; Ma, M.; Jiang, P.; Quan, Y. Spatiotemporal vegetation dynamics and their influence factors at a large coal-fired power plant in Xilinhot, Inner Mongolia. Int. J. Sustain. Dev. World Ecol. 2016, 24, 433–438. [Google Scholar] [CrossRef]
  17. Liu, Y.; Yue, H. Remote sensing monitoring of soil moisture in the Daliuta Coal Mine based on SPOT 5/6 and Worldview-2. Open Geosci. 2019, 11, 866–876. [Google Scholar] [CrossRef]
  18. Cao, J.; Deng, Z.; Li, W.; Hu, Y. Remote sensing inversion and spatial variation of land surface temperature over mining areas of Jixi, Heilongjiang, China. Peerj 2020, 8, e10257. [Google Scholar] [CrossRef] [PubMed]
  19. García Millán, V.; Faude, U.; Bicsan, A.; Klink, A.; Teuwsen, S.; Pakzad, K.; Müterthies, A. Monitoring flooding damages in vegetation caused by mining activities using optical remote sensing. PFG—J. Photogramm. Remote Sens. Geoinf. Sci. 2018, 86, 1–13. [Google Scholar] [CrossRef]
  20. Kayet, N.; Pathak, K.; Chakrabarty, A.; Kumar, S.; Chowdary, V.; Singh, C.; Sahoo, S.; Basumatary, S. Assessment of foliar dust using Hyperion and Landsat satellite imagery for mine environmental monitoring in an open cast iron ore mining areas. J. Clean. Prod. 2019, 218, 993–1006. [Google Scholar] [CrossRef]
  21. Li, J.; Liang, J.; Wu, Y.; Yin, S.; Yang, Z.; Hu, Z. Quantitative evaluation of ecological cumulative effect in mining area using a pixel-based time series model of ecosystem service value. Ecol. Indic. 2021, 120, 106873. [Google Scholar] [CrossRef]
  22. Wan, X. Study on Eco-Environmental Cumulative Effects in Coal Mining Area—Case Studies in Lu’an Mining Area; China University of Mining Technology: Beijing, China, 2010. [Google Scholar]
  23. Hodgson, E.E.; Halpern, B.S. Investigating cumulative effects across ecological scales. Conserv. Biol. 2019, 33, 22–32. [Google Scholar] [CrossRef] [PubMed] [Green Version]
  24. Dong, J.; Ji, L.; Fang, A. Ecological cumulative effect of mining area in typical arid and semi-arid grassland. J. China Coal Soc. 2021, 46, 1945–1956. [Google Scholar]
  25. Shen, Q.; Zhuang, S.; Jia, R. The Pearl of the Grassland, Ejin Horo Banner, Ordos. Reg. Gov. 2019, 79–80. [Google Scholar]
  26. Peng, P. Analysis of LUCC and Driving Forces in Shenmu City; Gansu Agricultural University: Lanzhou, China, 2017; pp. 1–6. [Google Scholar]
  27. Zhou, Q.; Zhang, X.; Meng, Q.; Zhang, H.; Ma, B. Thoughts on the development of coal chemical industry in Shenmu. Coal Process. Compr. Util. 2017, 10, 10, 19–24. [Google Scholar]
  28. Statistical Yearbook Sharing Platform. Available online: https://www.yearbookchina.com/index.aspx (accessed on 17 January 2021).
  29. Breiman, L. Random forests. Mach. Learn. 2001, 45, 5–32. [Google Scholar] [CrossRef] [Green Version]
  30. Xu, H. A remote sensing urban ecological index and its application. Acta Ecol. Sin. 2013, 33, 7853–7862. [Google Scholar]
  31. Zhang, X.; Liao, C.; Li, J.; Sun, Q. Fractional vegetation cover estimation in arid and semi-arid environments using HJ-1 satellite hyperspectral data. Int. J. Appl. Earth Obs. Geoinf. 2013, 21, 506–512. [Google Scholar] [CrossRef]
  32. Li, M. The Method of Vegetation Fraction Estimation by Remote Sensing; Institute of Remote Sensing and Digital Earth, Chinese Academy of Sciences: Beijing, China, 2003; pp. 41–46. [Google Scholar]
  33. Jiapaer, G.; Chen, X.; Bao, A. A comparison of methods for estimating fractional vegetation cover in arid regions. Agric. For. Meteorol. 2011, 151, 1698–1710. [Google Scholar] [CrossRef]
  34. Sobrino, J.; Jiménez-Muñoz, J.; Paolini, L. Land surface temperature retrieval from LANDSAT TM 5. Remote Sens. Environ. 2004, 90, 434–440. [Google Scholar] [CrossRef]
  35. Sandholt, I.; Rasmussen, K.; Andersen, J. A simple interpretation of the surface temperature/vegetation index space for assessment of surface moisture status. Remote Sens. Environ. 2002, 79, 213–224. [Google Scholar] [CrossRef]
  36. Qin, Q.; You, L.; Zhao, Y.; Zhao, Y.; Zhao, S.; Yao, Y. Soil line automatic identification algorithm based on two-dimensional feature space. Trans. Chin. Soc. Agric. Eng. 2012, 28, 167–171. [Google Scholar]
  37. He, C.; Wu, S.; Wang, X.; Hu, A.; Wang, Q.; Zhang, K. A new voxel-based model for the determination of atmospheric weighted mean temperature in GPS atmospheric sounding. Atmos. Meas. Tech. 2017, 10, 2045–2060. [Google Scholar] [CrossRef] [Green Version]
  38. Kraus, H. Die Atmosphäre der Erde: Eine Einführung in die Meteorologie; Springer: Berlin/Heidelberg, Germany, 2004; pp. 34–39. [Google Scholar]
  39. Ji, Z.; Wang, X.; Hao, J.; Cui, D.; Wang, S. Study on the remarkable characteristics of mining in super high mining height working face of Shangwan coal mine. China Min. Mag. 2020, 29, 140–146. [Google Scholar]
  40. Shenhua Shendong Coal Group Shangwan Coal Mine; China Coal Industry Association. China’s Large-Scale Modern Coal Mine Construction-National Large-Scale Coal Mine Construction Site Meeting and Promotion of Coal Production Scale Modernization Development forum Data Compilation; China Coal Industry Association: Beijing, China, 2009; p. 2. [Google Scholar]
Figure 1. Map of the study area.
Remotesensing 13 05034 g001
Figure 2. Landsat satellite images in the study area: (a) 1990, (b) 2000, (c)2005, (d) 2010, (e) 2015, (f) 2019.
Remotesensing 13 05034 g002
Figure 3. Flowchart of the technology frame.
Remotesensing 13 05034 g003
Figure 4. Schematic diagram of the random forest algorithm.
Remotesensing 13 05034 g004
Figure 5. Schematic diagram of TVDI.
Remotesensing 13 05034 g005
Figure 6. The results of the land cover classification in the study area: (a) 1990, (b) 2005, (c) 2019.
Remotesensing 13 05034 g006
Figure 7. Changes of all kinds of land cover in the study area: (a) Vegetation, (b) Water, (c) Mining land, (d) Cultivated land, (e) Bare land, (f) Artificial land.
Remotesensing 13 05034 g007
Figure 8. Inversion results of LST in the study area (°C): (a) 1990, (b) 2005, (c) 2019.
Remotesensing 13 05034 g008
Figure 9. The mean value of LST in the study area.
Remotesensing 13 05034 g009
Figure 10. Inversion results of SM in the study area (m3/m3): (a) 1990, (b) 2005, (c) 2019.
Remotesensing 13 05034 g010
Figure 11. The mean value of SM in the study area.
Remotesensing 13 05034 g011
Figure 12. Inversion results of relative humidity in the study area (%): (a) 1990, (b) 2005, (c) 2019.
Remotesensing 13 05034 g012
Figure 13. Inversion results of atmospheric specific humidity in the study area (g/kg): (a) 1990, (b) 2005, (c) 2019.
Remotesensing 13 05034 g013
Figure 14. Inversion results of atmospheric water vapor density in the study area (g/cm3): (a) 1990, (b) 2005, (c) 2019.
Remotesensing 13 05034 g014
Figure 15. Average value of temperature in the study area.
Remotesensing 13 05034 g015
Figure 16. Average value of summer precipitation in the study area.
Remotesensing 13 05034 g016
Figure 17. Research area of Shangwan Coal Mine.
Remotesensing 13 05034 g017
Figure 18. Land cover classification in the Shangwan coal mining area for (a) 1990, (b) 2005, and (c)2019.
Remotesensing 13 05034 g018
Figure 19. Changes for all land cover types in the Shangwan coal mining area: (a) Vegetation, (b) Water, (c) Mining land, (d) Cultivated land, (e) Bare land, (f) Artificial land.
Remotesensing 13 05034 g019
Figure 20. LST inversion results of the Shangwan coal mining area (°C): (a) 1990, (b) 2005, (c) 2019.
Remotesensing 13 05034 g020
Figure 21. The mean LST value in the Shangwan coal mining area.
Remotesensing 13 05034 g021
Figure 22. SM inversion results of the Shangwan coal mining area (m3/m3): (a) 1990, (b) 2005, (c) 2019.
Remotesensing 13 05034 g022
Figure 23. The mean value of SM in the Shangwan coal mining area.
Remotesensing 13 05034 g023
Figure 24. Change rate of LST in the study area: (a) 1990–1995, (b) 1995–2000, (c) 2000–2005, (d) 2005–2010, (e) 2010–2015, (f) 2015–2019.
Remotesensing 13 05034 g024aRemotesensing 13 05034 g024b
Figure 25. Change rate of SM in the study area: (a) 1990–1995, (b) 1995–2000, (c) 2000–2005, (d) 2005–2010, (e) 2010–2015, (f) 2015–2019.
Remotesensing 13 05034 g025aRemotesensing 13 05034 g025b
Figure 26. Change rate of atmospheric specific humidity in the study area: (a) 1990–2000, (b) 2000–2010, (c) 2010–2019.
Remotesensing 13 05034 g026
Figure 27. Change rate of atmospheric relative humidity in the study area: (a) 1990–2000, (b)2000–2010, (c)2010–2019.
Remotesensing 13 05034 g027
Figure 28. Change rate of atmospheric water vapor density in the study area: (a) 1990–2000, (b)2000–2010, (c)2010–2019.
Remotesensing 13 05034 g028
Figure 29. The absolute value of the change rate of mean LST and SM in the study area.
Remotesensing 13 05034 g029
Figure 30. The buffer zones at the Shangwan coal mine.
Remotesensing 13 05034 g030
Figure 31. The relationship between the mean value of LST, SM, and the distance from the mine.
Remotesensing 13 05034 g031
Figure 32. The contrast study area.
Remotesensing 13 05034 g032
Figure 33. Results of land cover classification in the contrast area: (a) 1990, (b) 2005, (c) 2019.
Remotesensing 13 05034 g033
Figure 34. Changes of all kinds of land cover of the Shangwan coal mining area and contrast area: (a) Vegetation, (b) Water, (c) Mining land, (d) Cultivated land, (e) Bare land, (f) Artificial land.
Remotesensing 13 05034 g034
Figure 35. Inversion results of LST in the contrast area (°C): (a) 1990, (b) 2005, (c) 2019.
Remotesensing 13 05034 g035
Figure 36. Comparison of LST of Shangwan coal mining area and contrast area.
Remotesensing 13 05034 g036
Figure 37. Inversion results of SM in the contrast area (m3/m3): (a) 1990, (b) 2005, (c) 2019.
Remotesensing 13 05034 g037
Figure 38. Comparison of SM of Shangwan coal mining area and contrast area.
Remotesensing 13 05034 g038
Table 1. Land cover transfer matrix (1990–2019) (km2).
VegetationWaterMining LandCultivated LandBare LandArtificial LandTotal Transfer out
vegetation8811.2942.52130.82886.88178.79311.281550.28
water118.5491.365.5026.3713.5319.85183.79
mining land0.000.000.000.000.000.000.00
cultivated land70.842.212.2277.871.5916.2493.09
bare land1811.3914.5632.32122.1539.6174.572054.99
artificial land5.450.150.232.330.126.548.28
total transfer in2006.2159.44171.091037.74194.03421.93
Table 2. Statistics of various types of land coverage in different years in Shangwan coal mining area.
Coal MineYearClassVegetationWaterMining
Area
Cultivated LandBare LandArtificial Land
Shangwan coal mine1990area (km2)15.450.200.000.004.430.00
Percentage
%
77.001.000.000.0022.000.00
2005area (km2)18.520.080.040.061.380.00
Percentage
%
92.200.400.200.306.900.00
2019area (km2)17.700.021.410.080.240.63
Percentage
%
88.140.107.020.401.203.14
Table 3. Statistics of various types of land coverage in the contrast area.
Coal MineYearClassVegetationWaterMining
Area
Cultivated LandBare LandArtificial Land
Shangwan coal mine1990area (km2)15.920.480.000.003.680.00
percentage
%
79.282.390.000.0018.330.00
2005area (km2)17.980.520.000.001.580.00
percentage
%
89.542.590.000.007.870.00
2019area (km2)10.550.010.009.380.000.14
percentage
%
52.540.050.0046.710.000.70
Publisher’s Note: MDPI stays neutral with regard to jurisdictional claims in published maps and institutional affiliations.

