
Pseudorange Bias Analysis and Preliminary Service Performance Evaluation of BDSBAS

Abstract
:
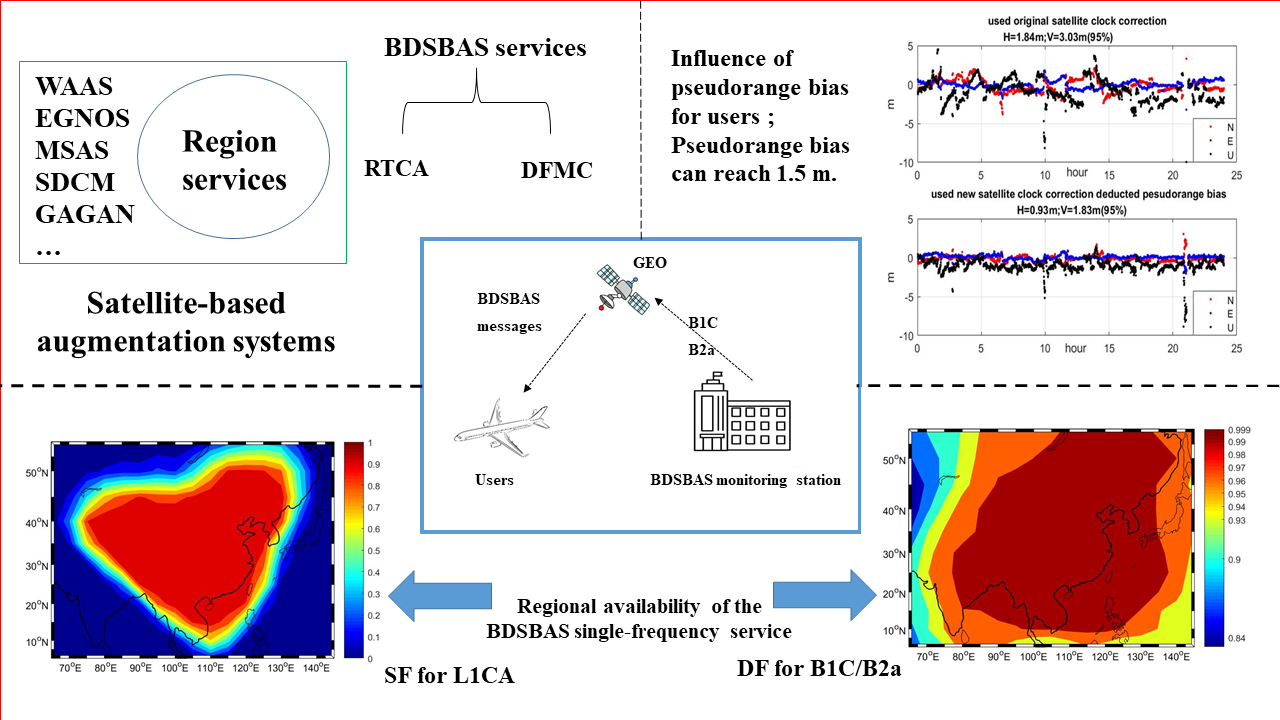
1. Introduction
2. Methods
2.1. Collocated Receiver Method
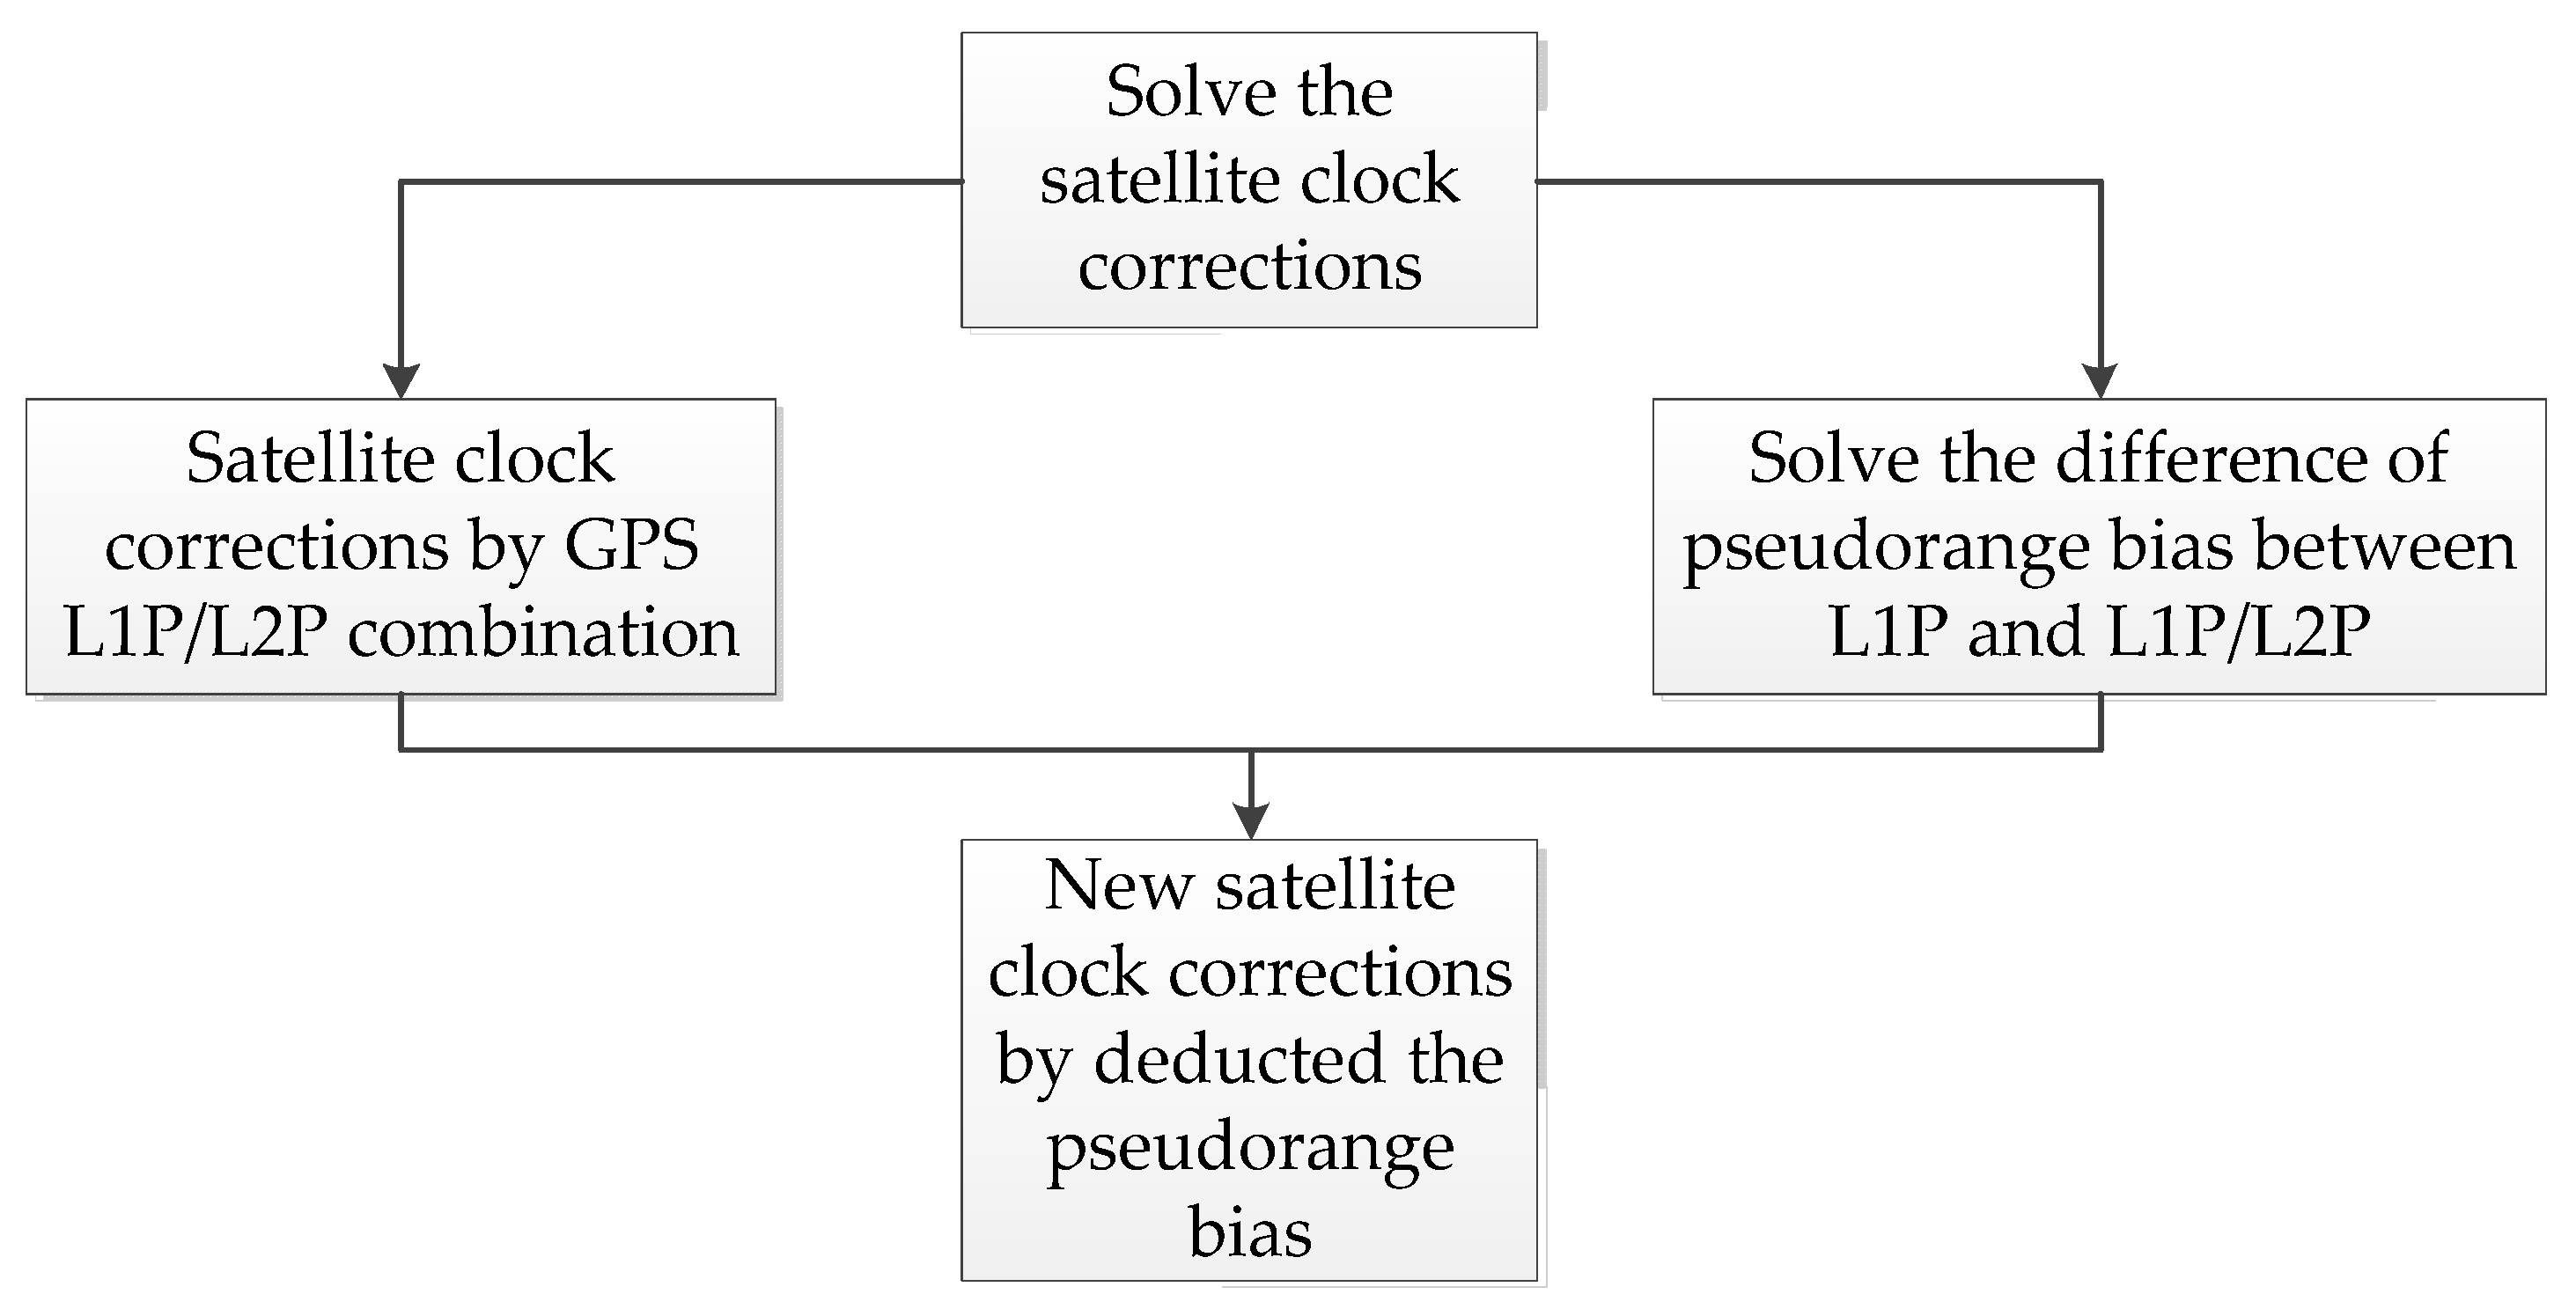
2.2. Calculation Method of Pseudorange Bias
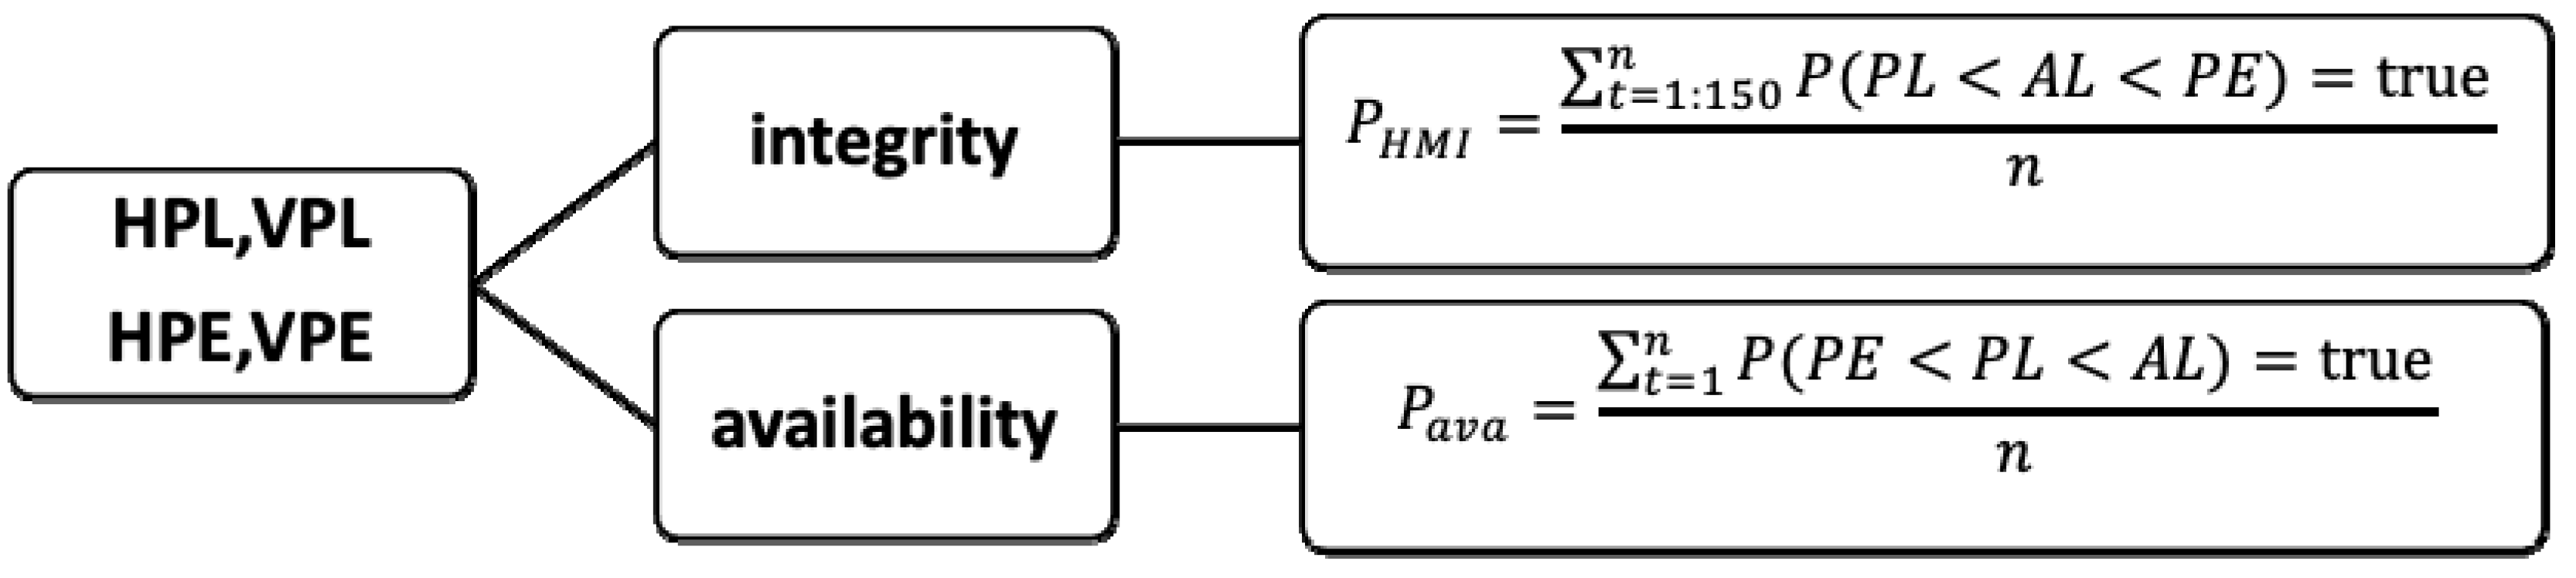
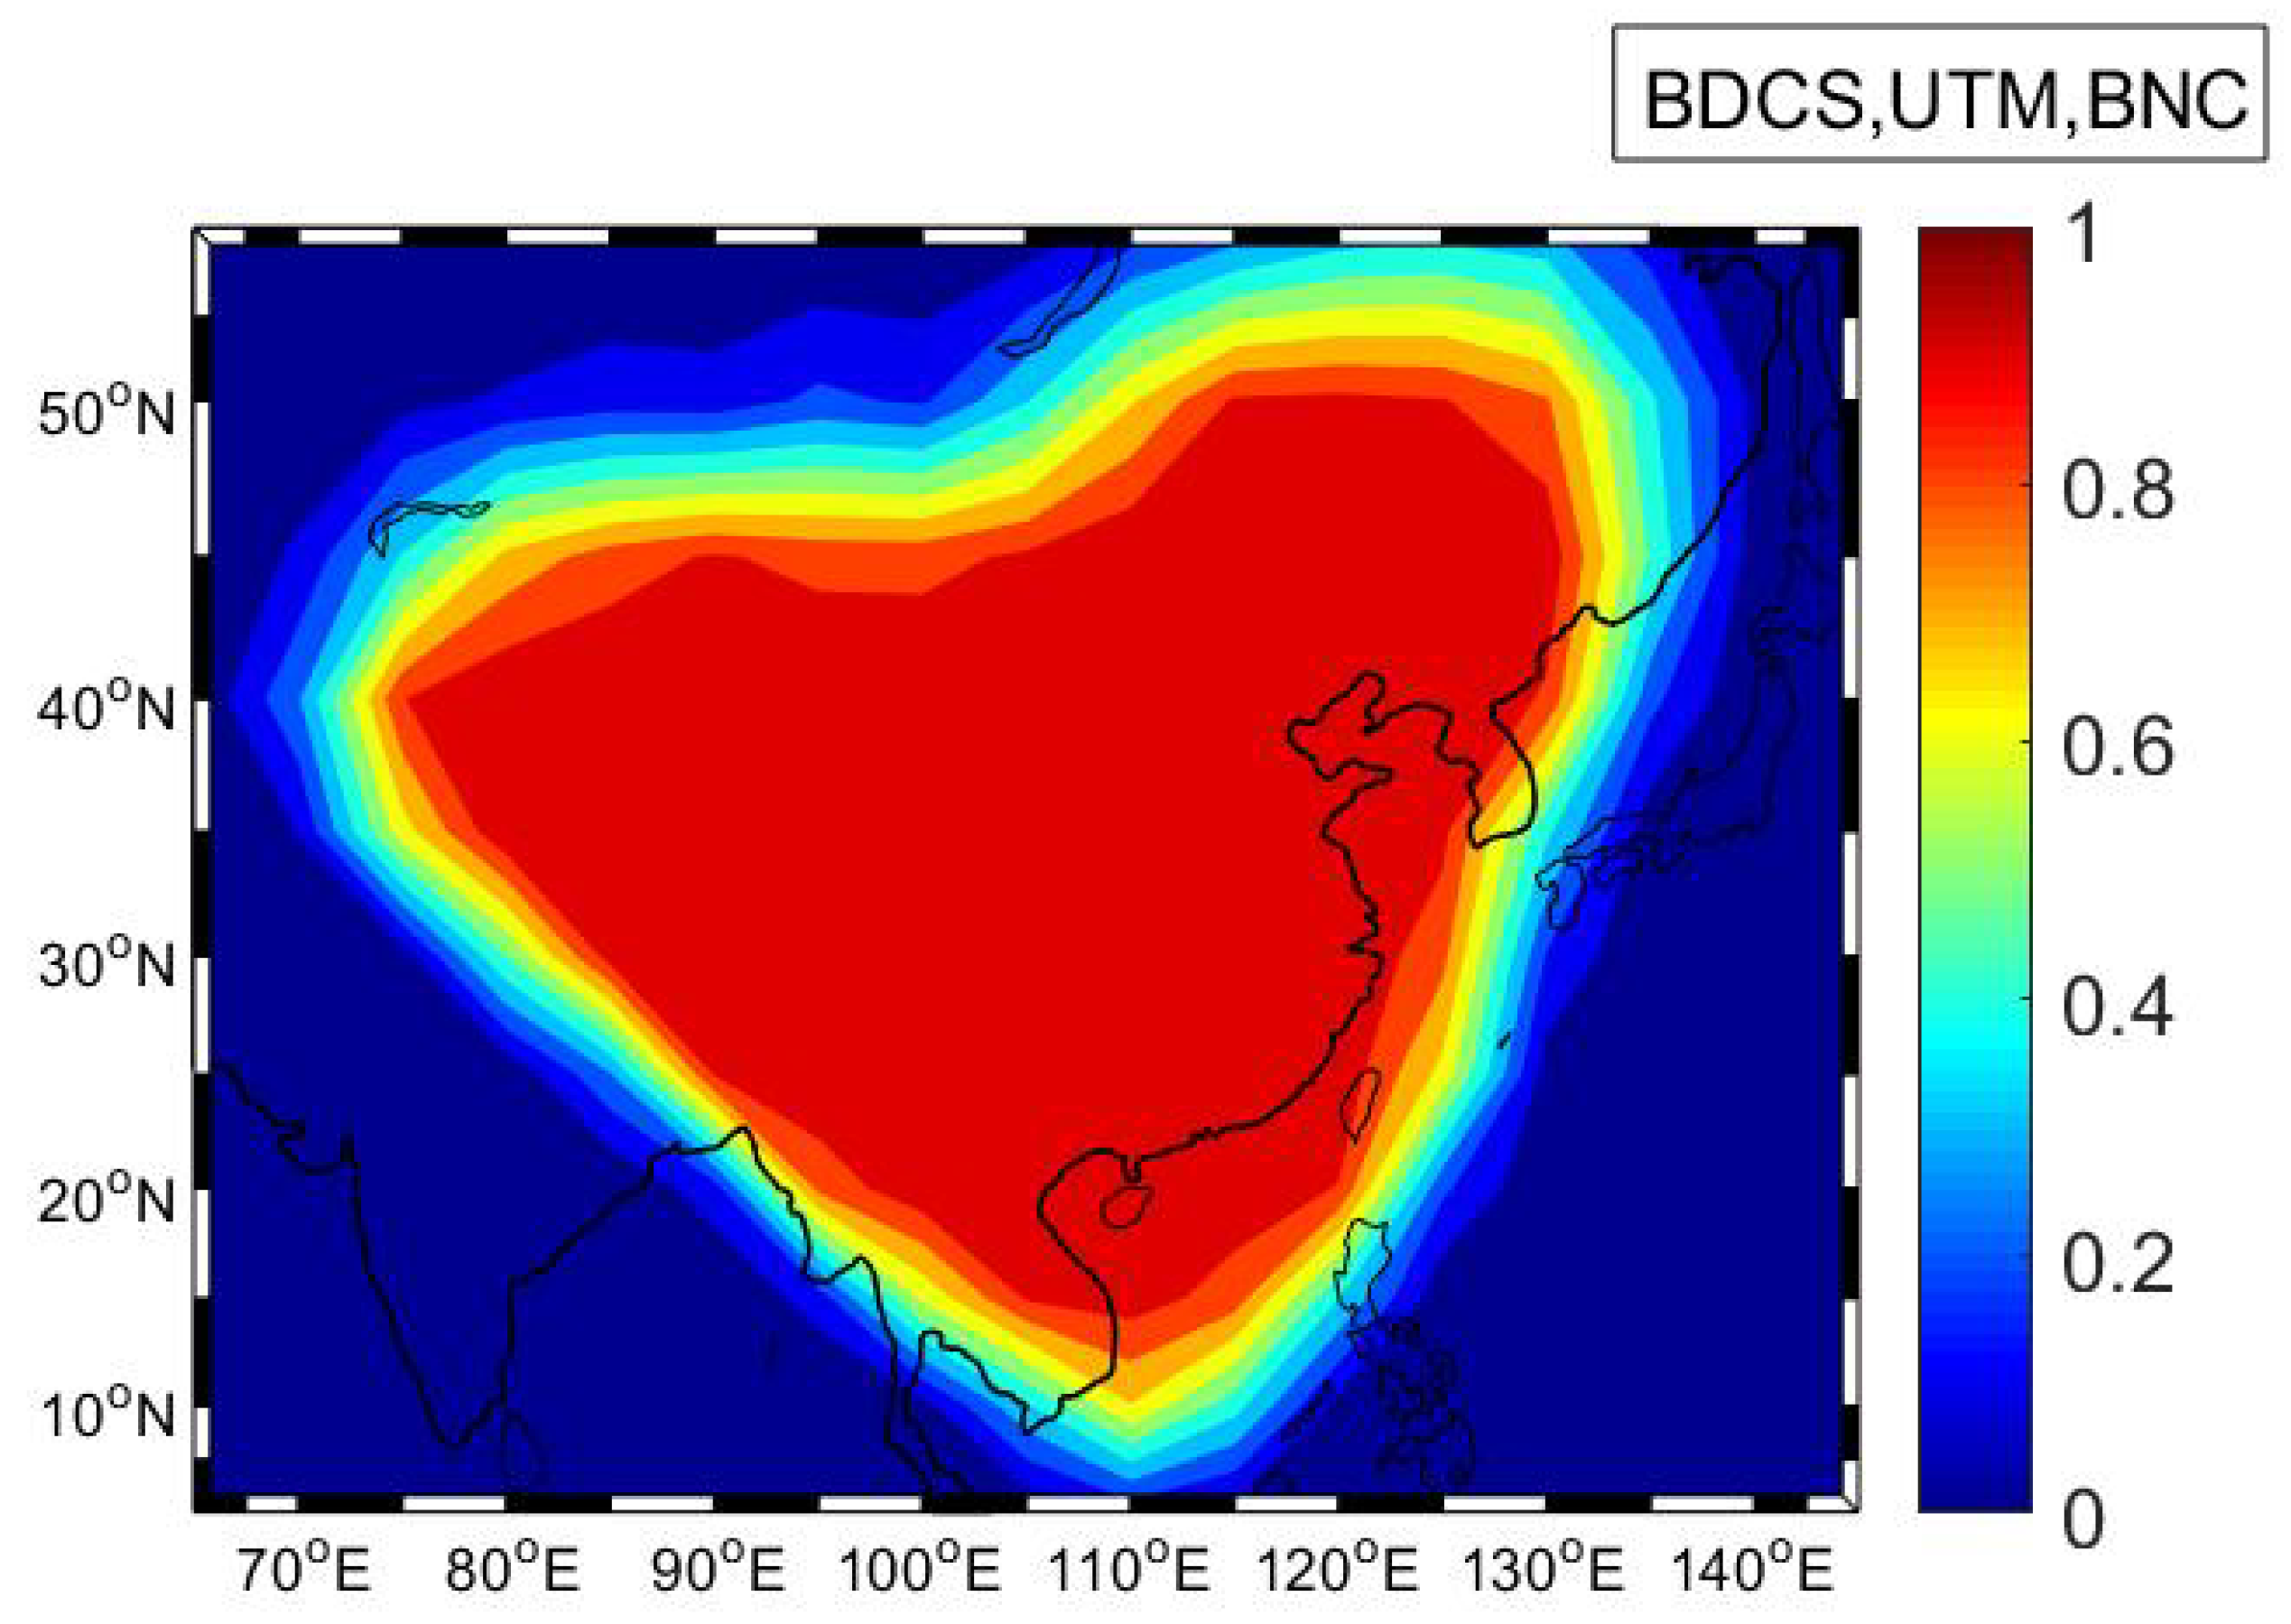
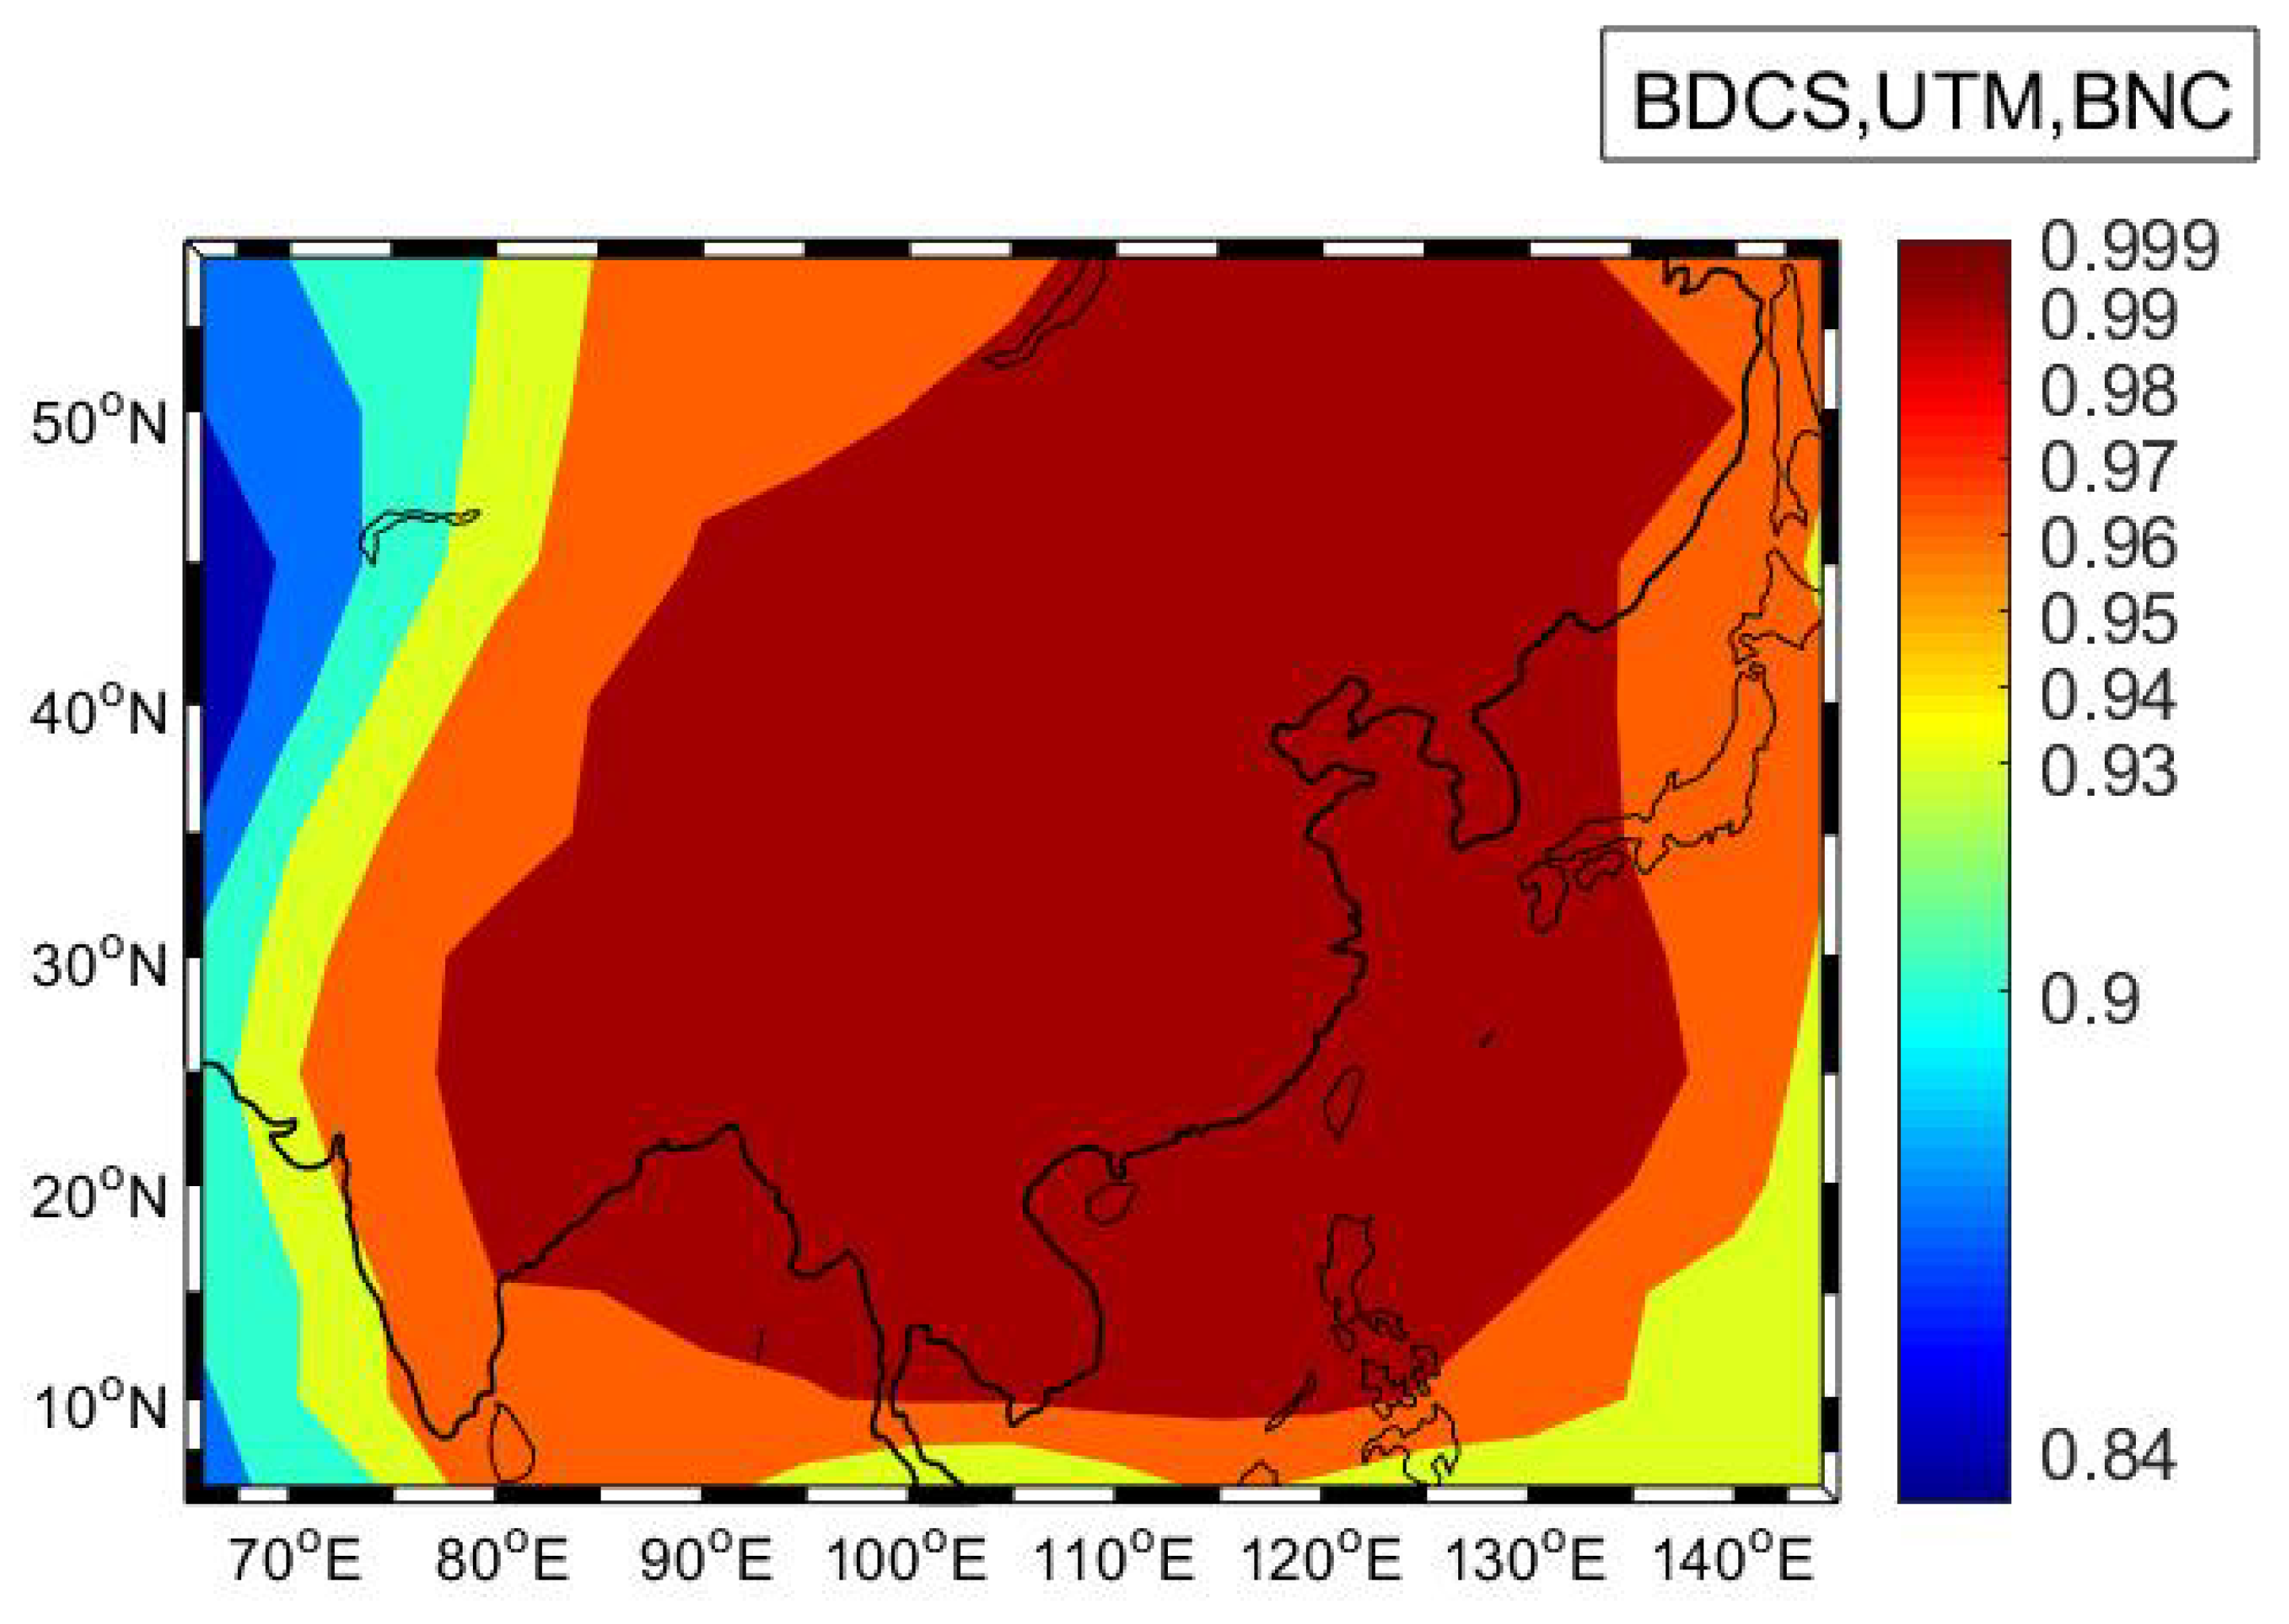
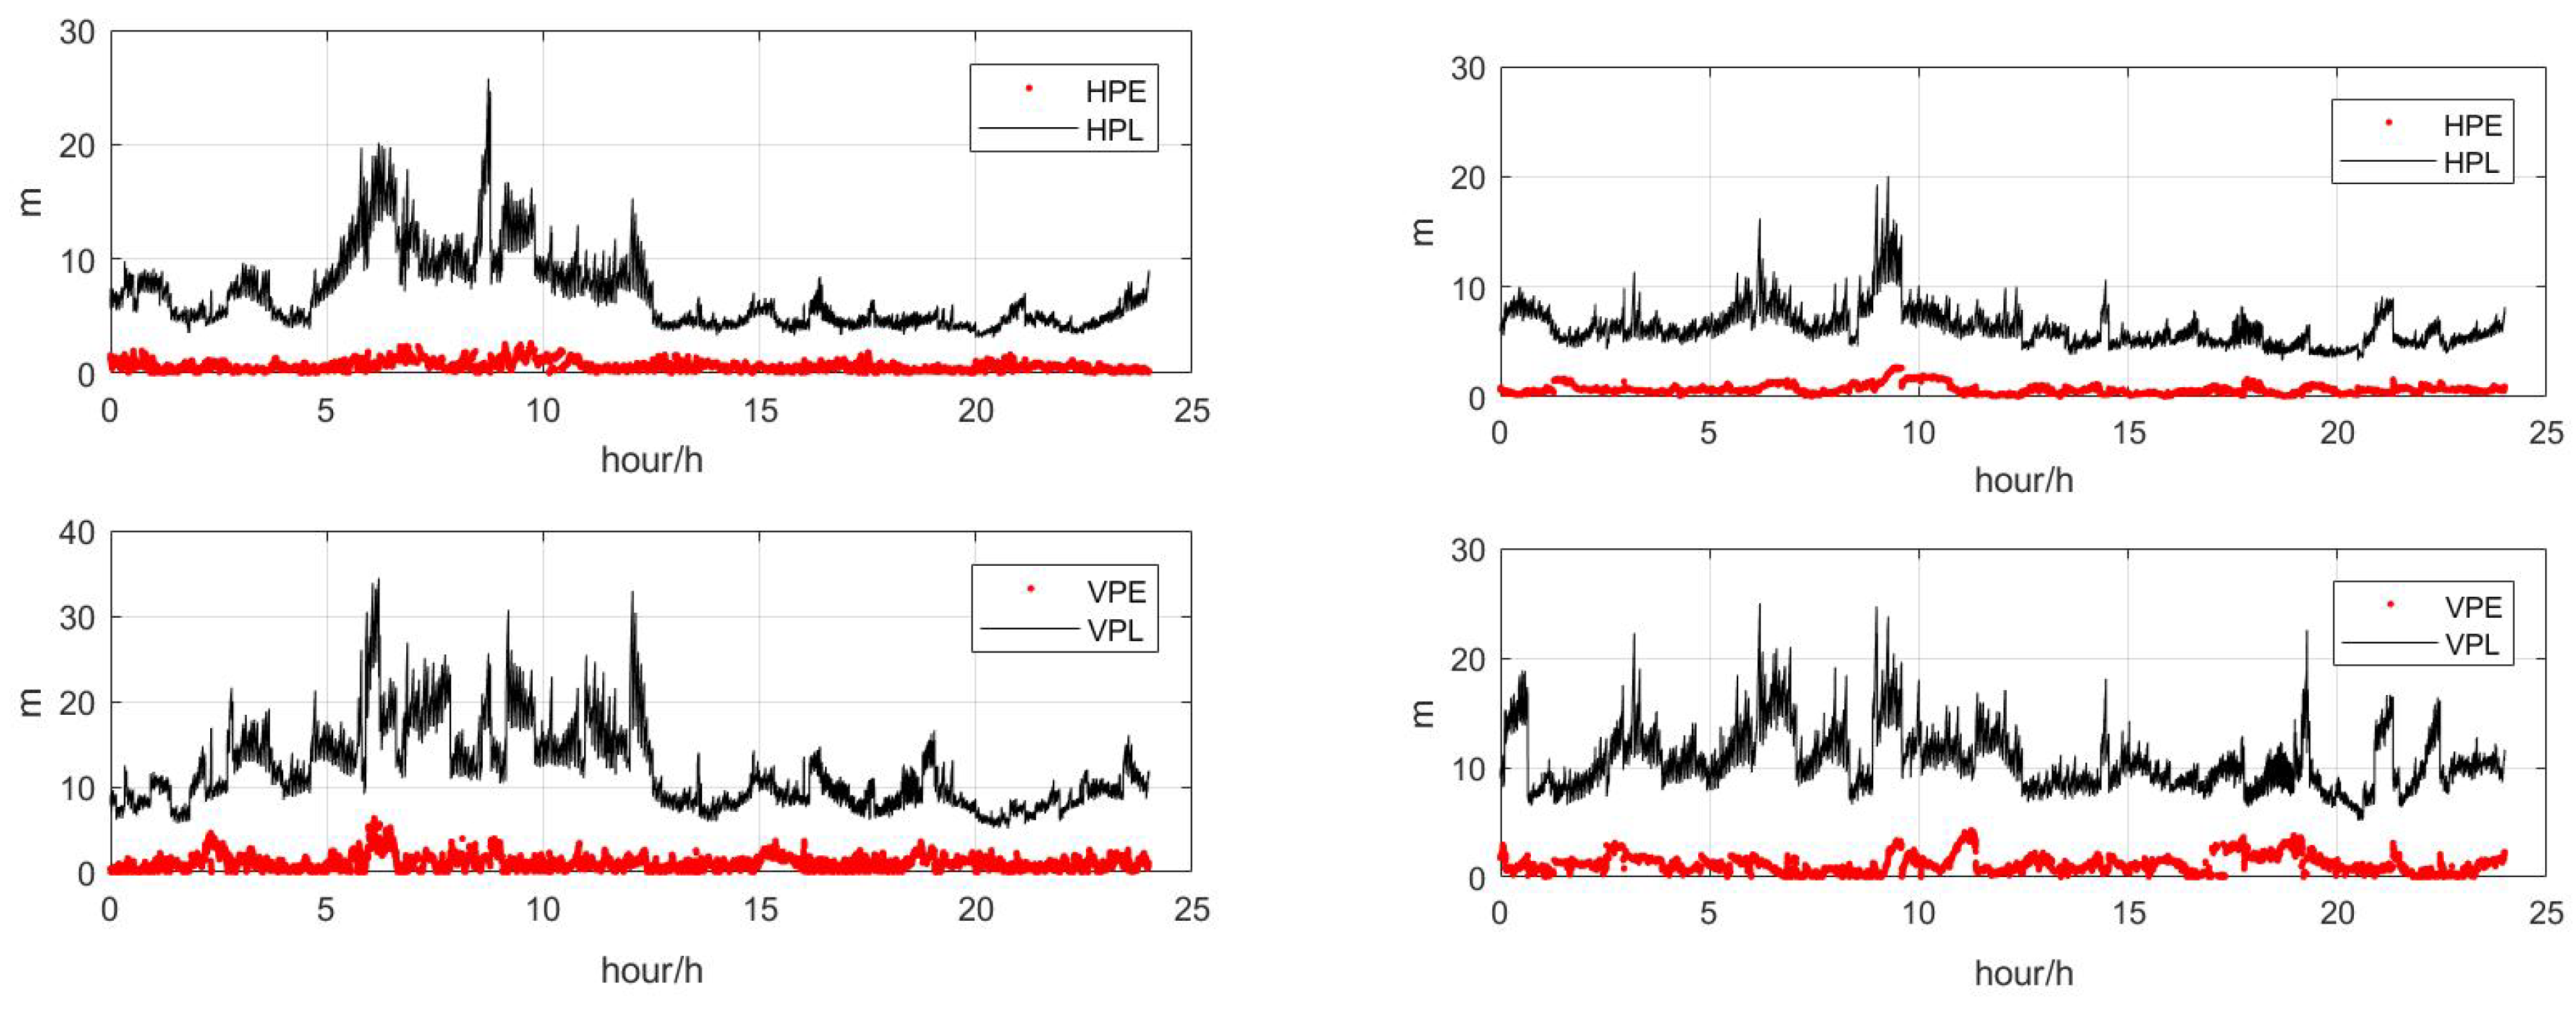
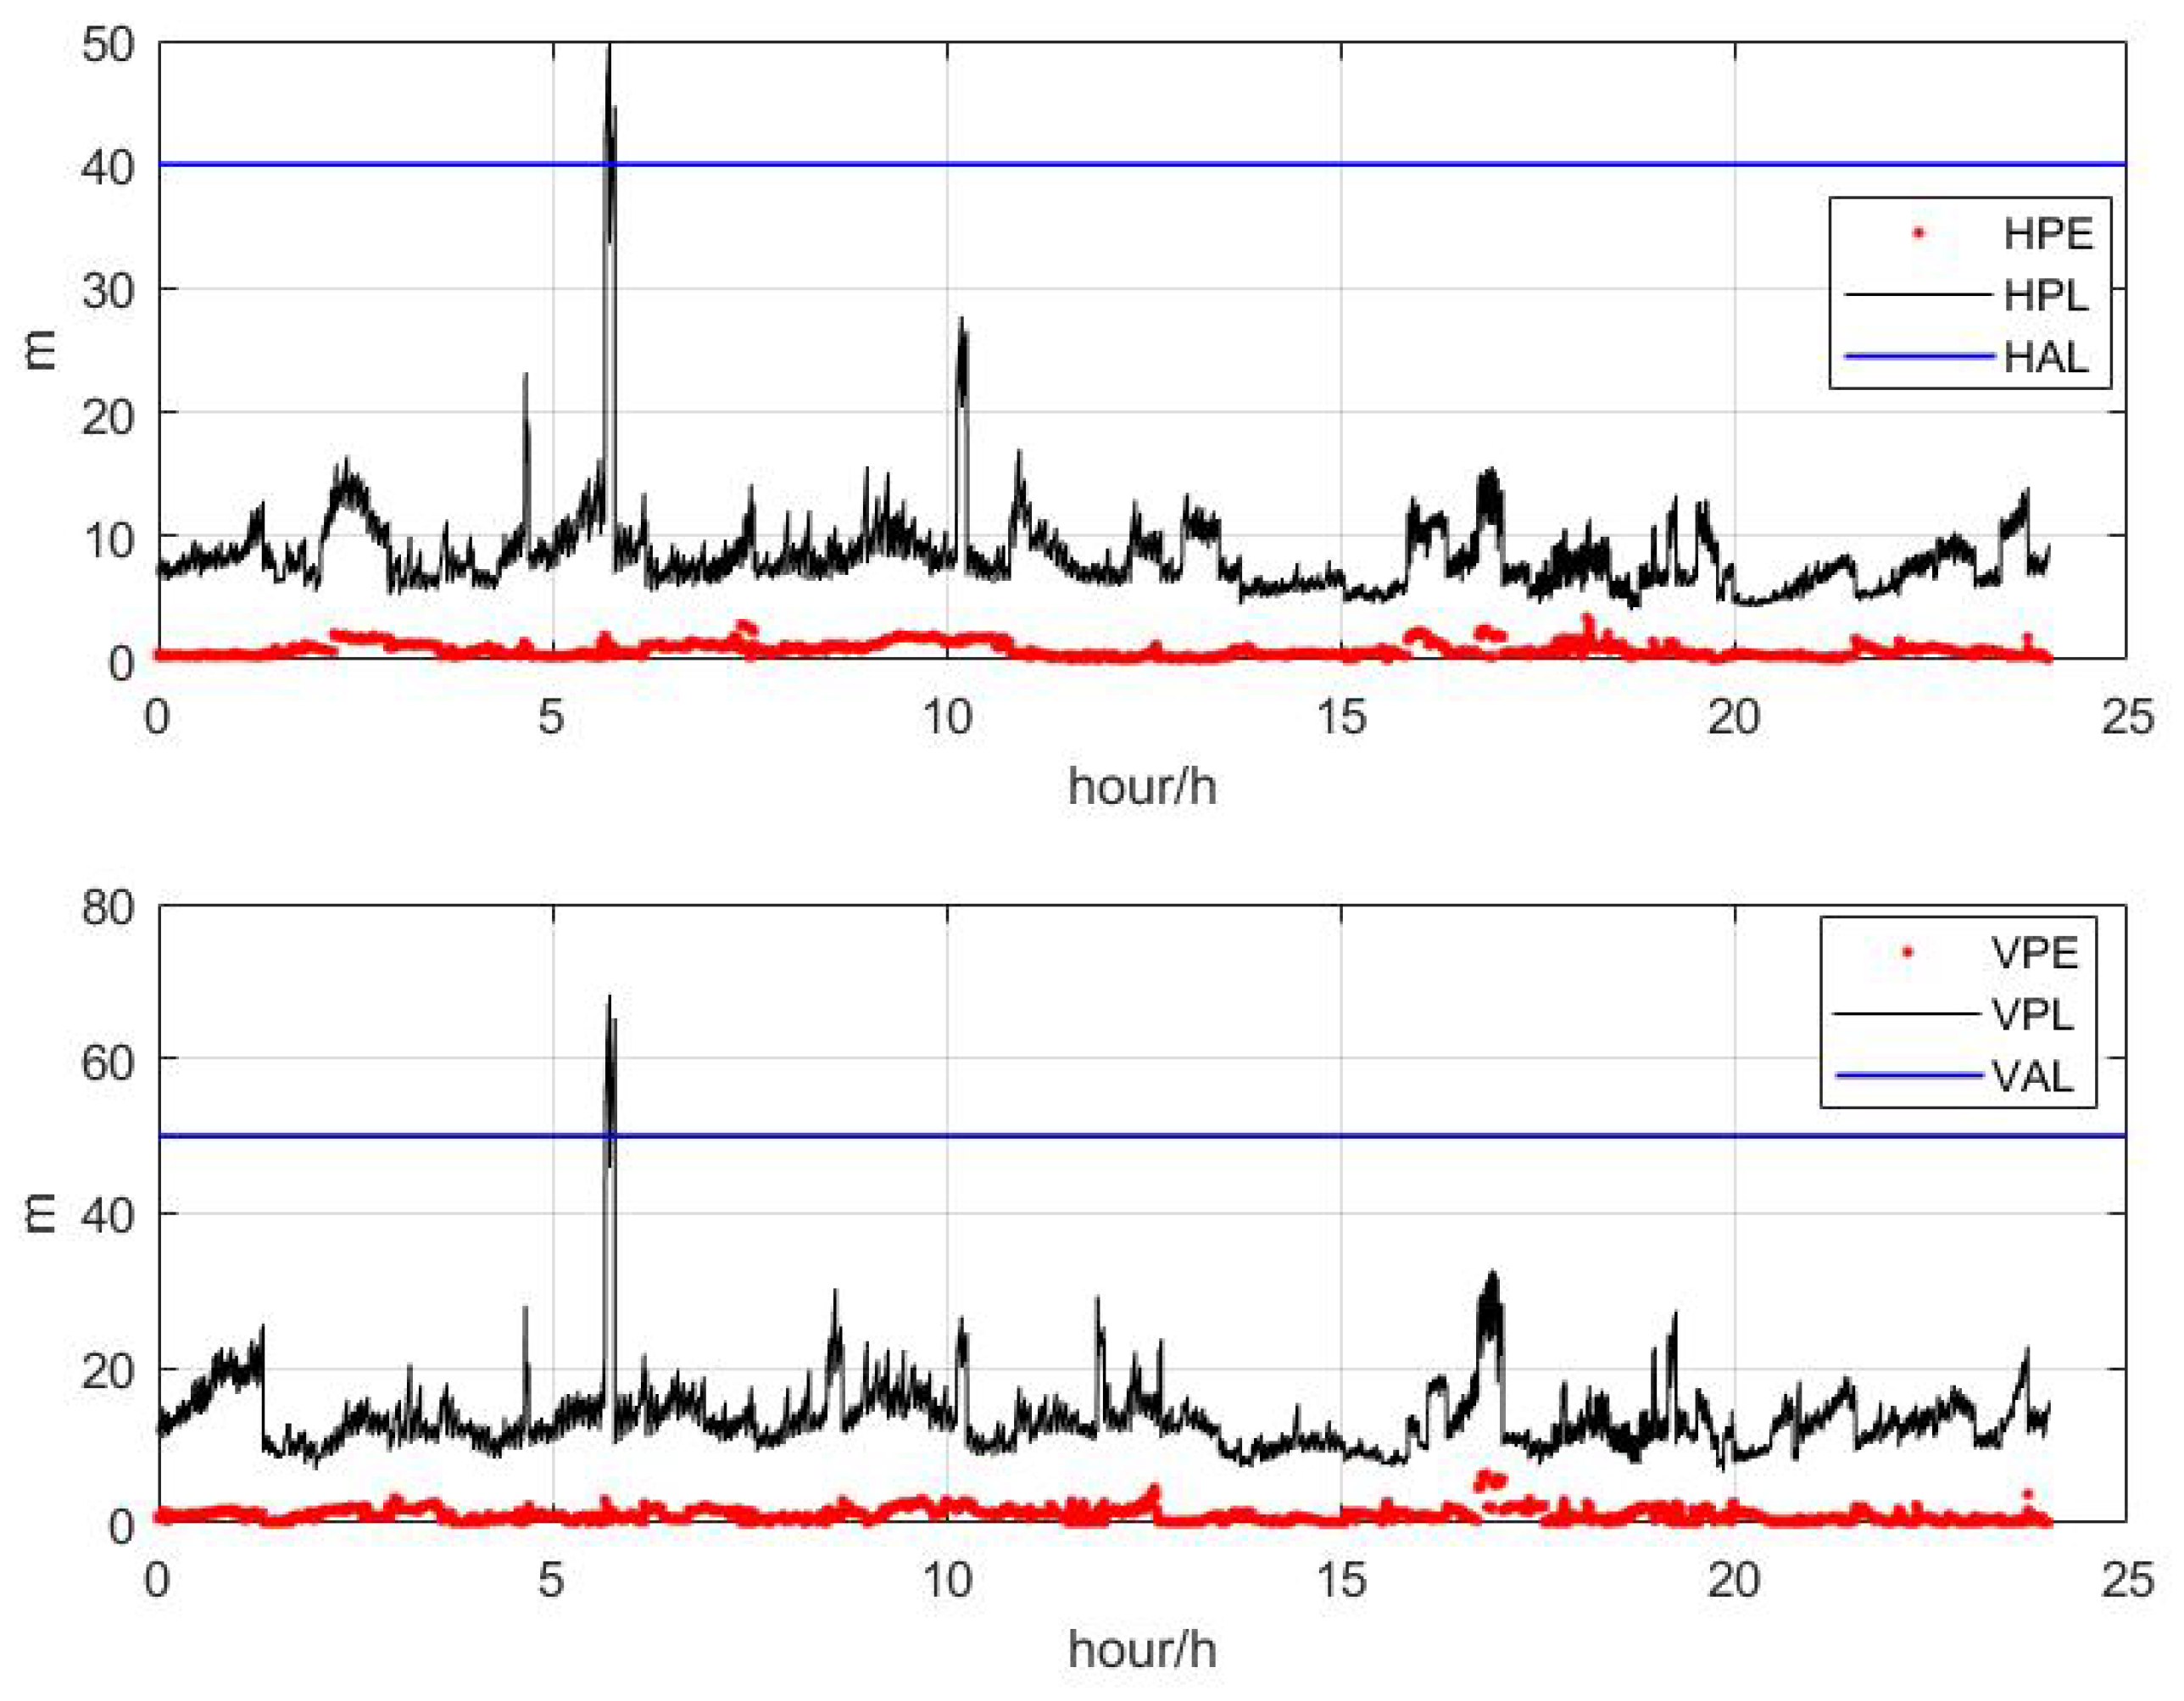
2.3. Method to Evaluate the Performance of BDSBAS
3. Data and Processing Strategies
- (1)
- Single point positioning (SPP).
- (2)
- SPP with differential SBAS corrections.
4. Results and Analysis
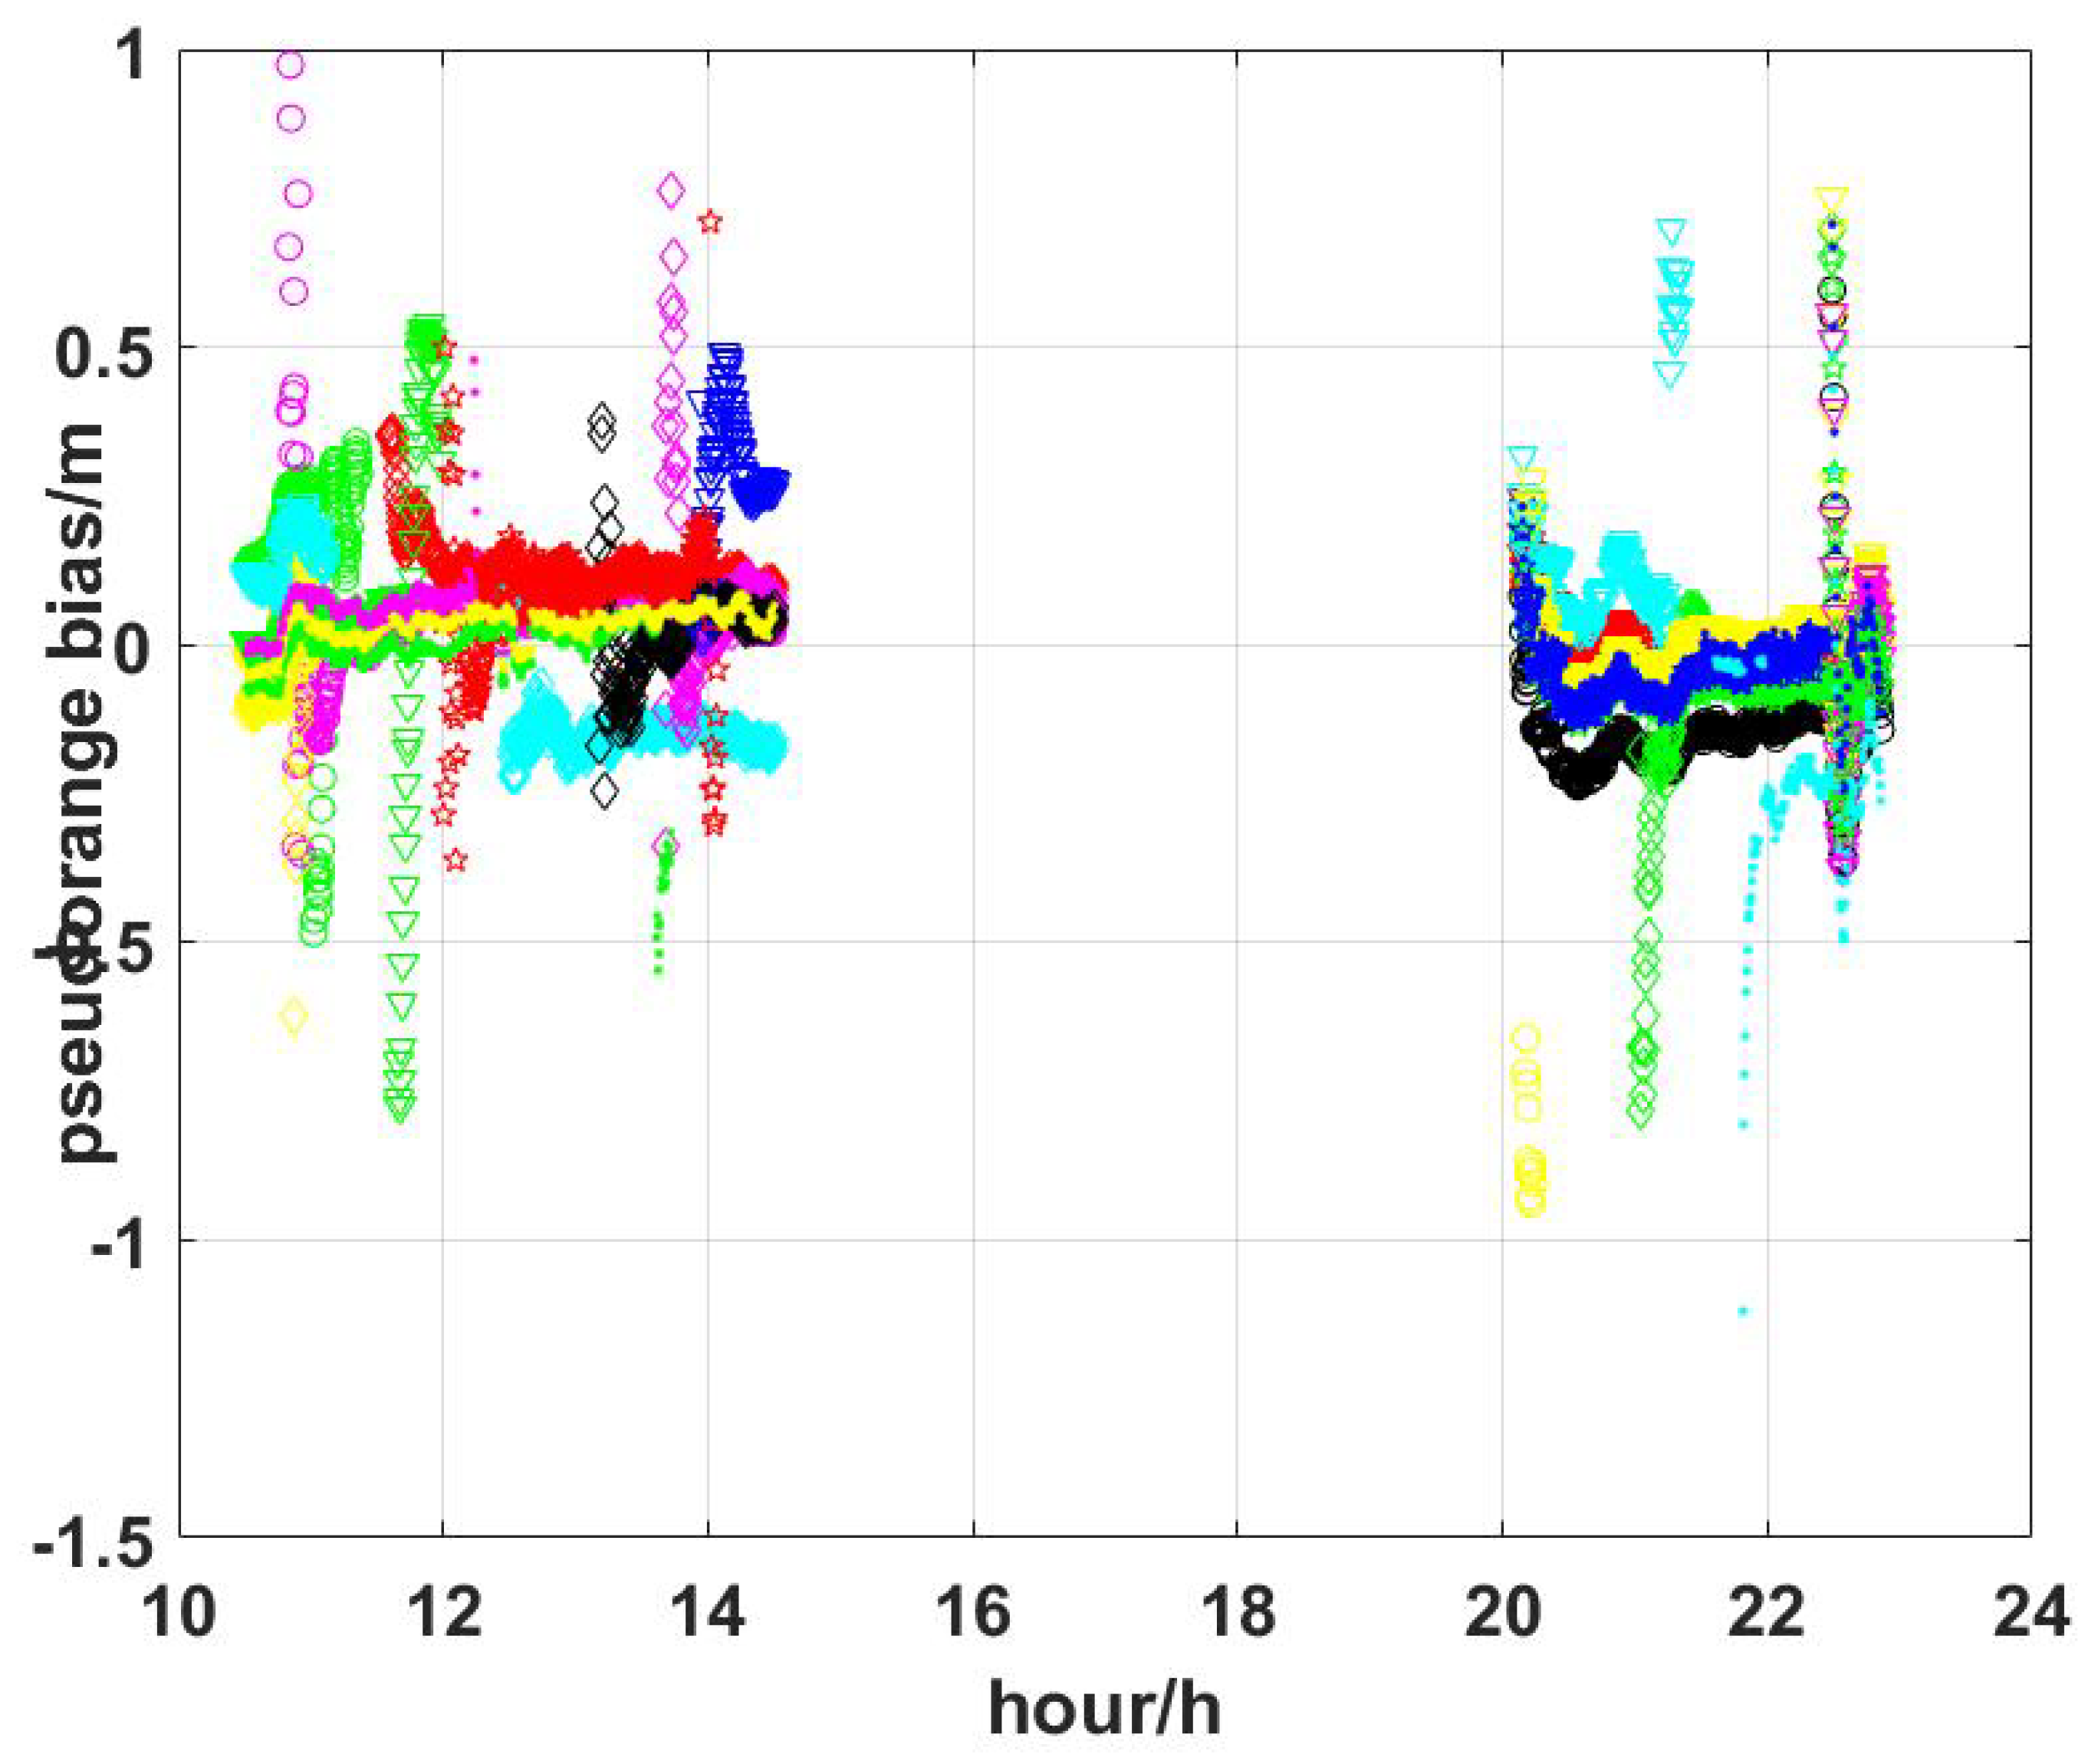
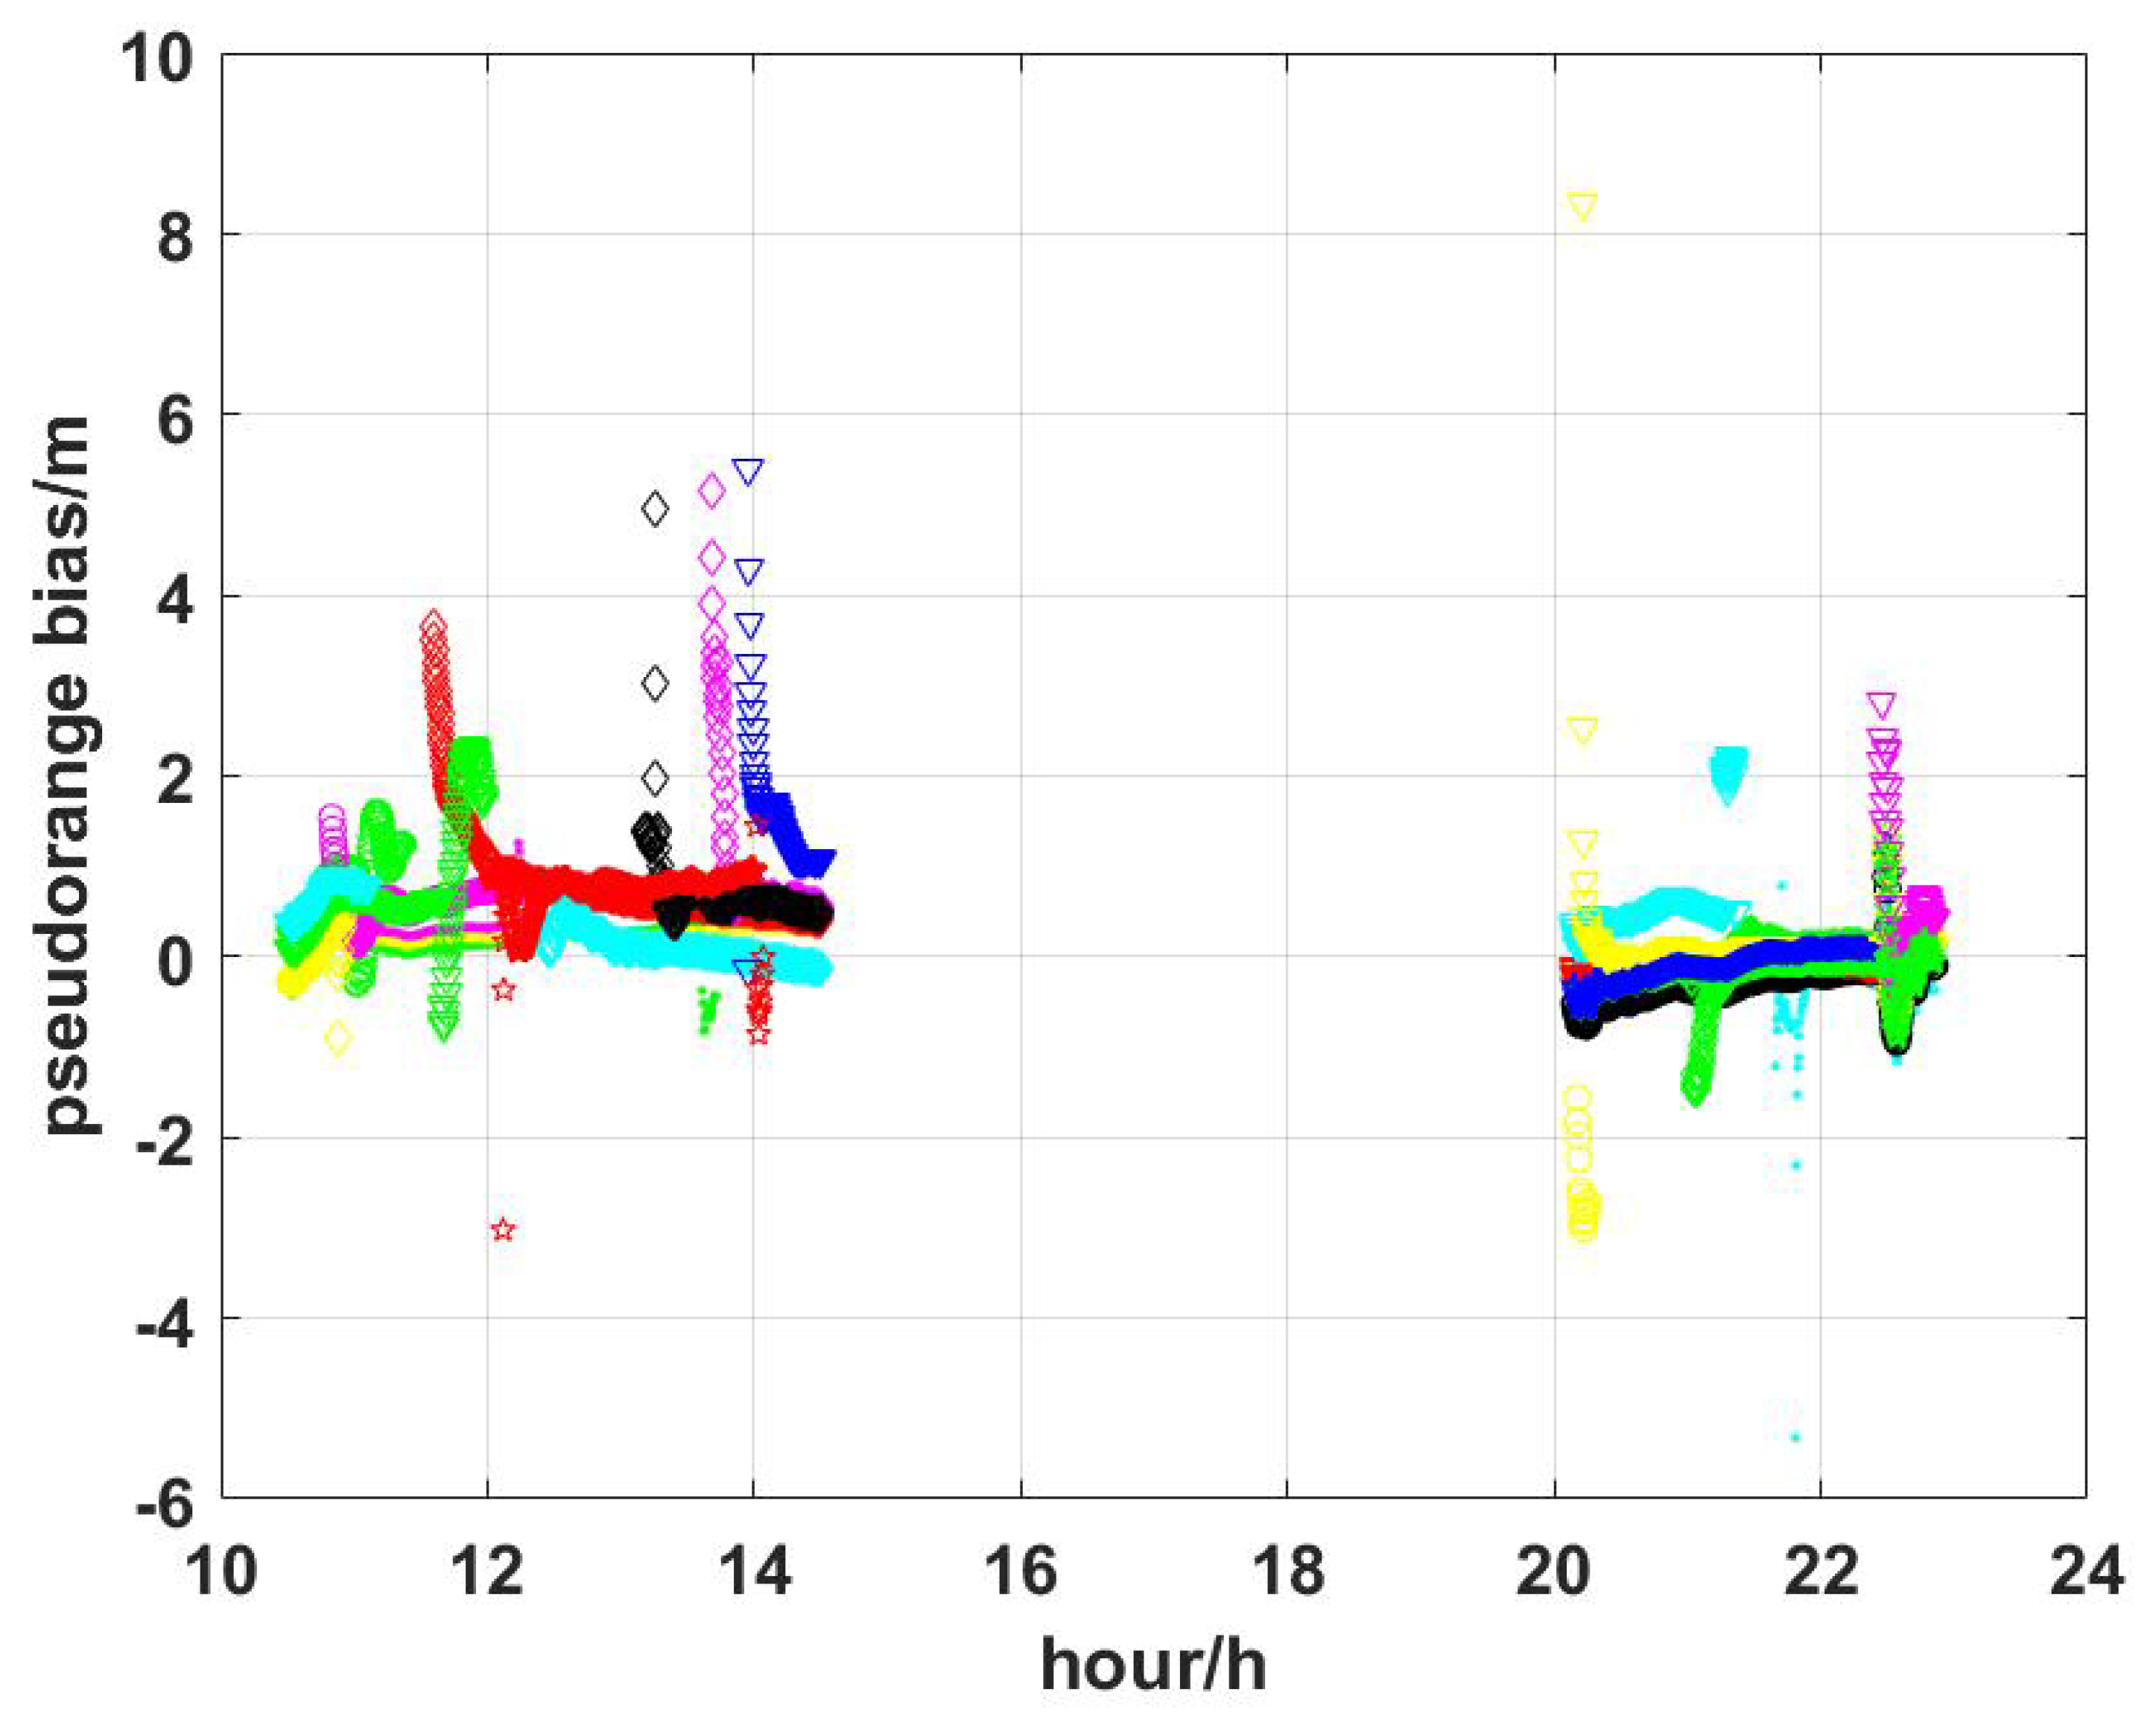
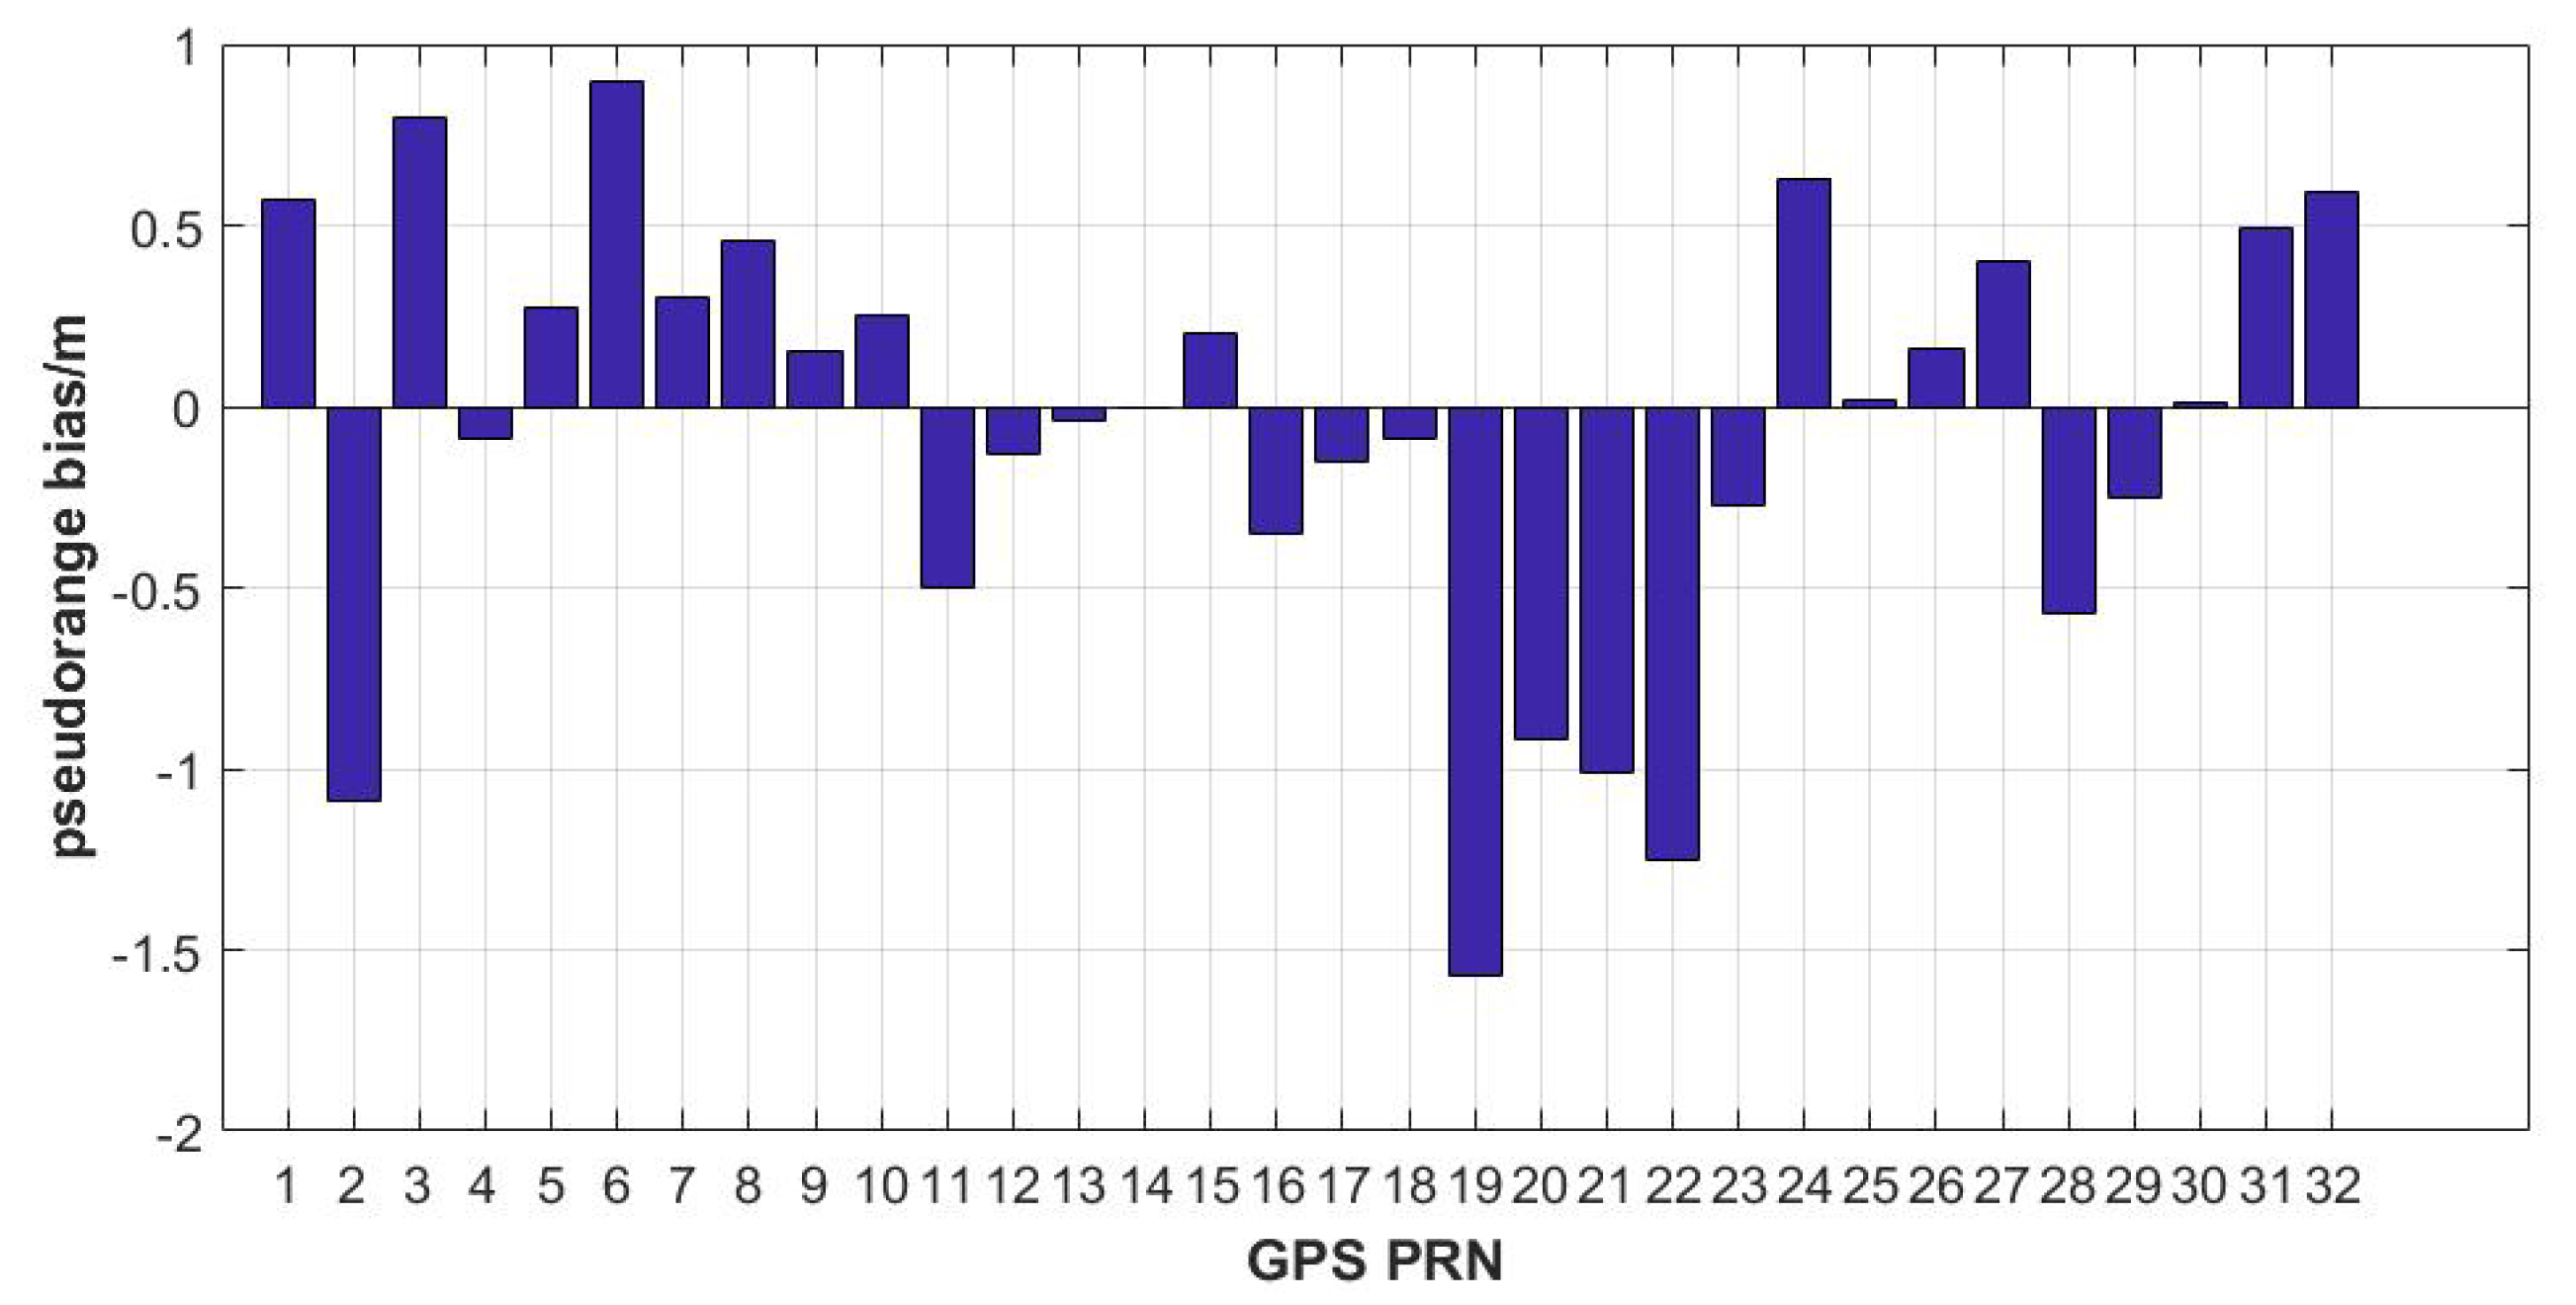
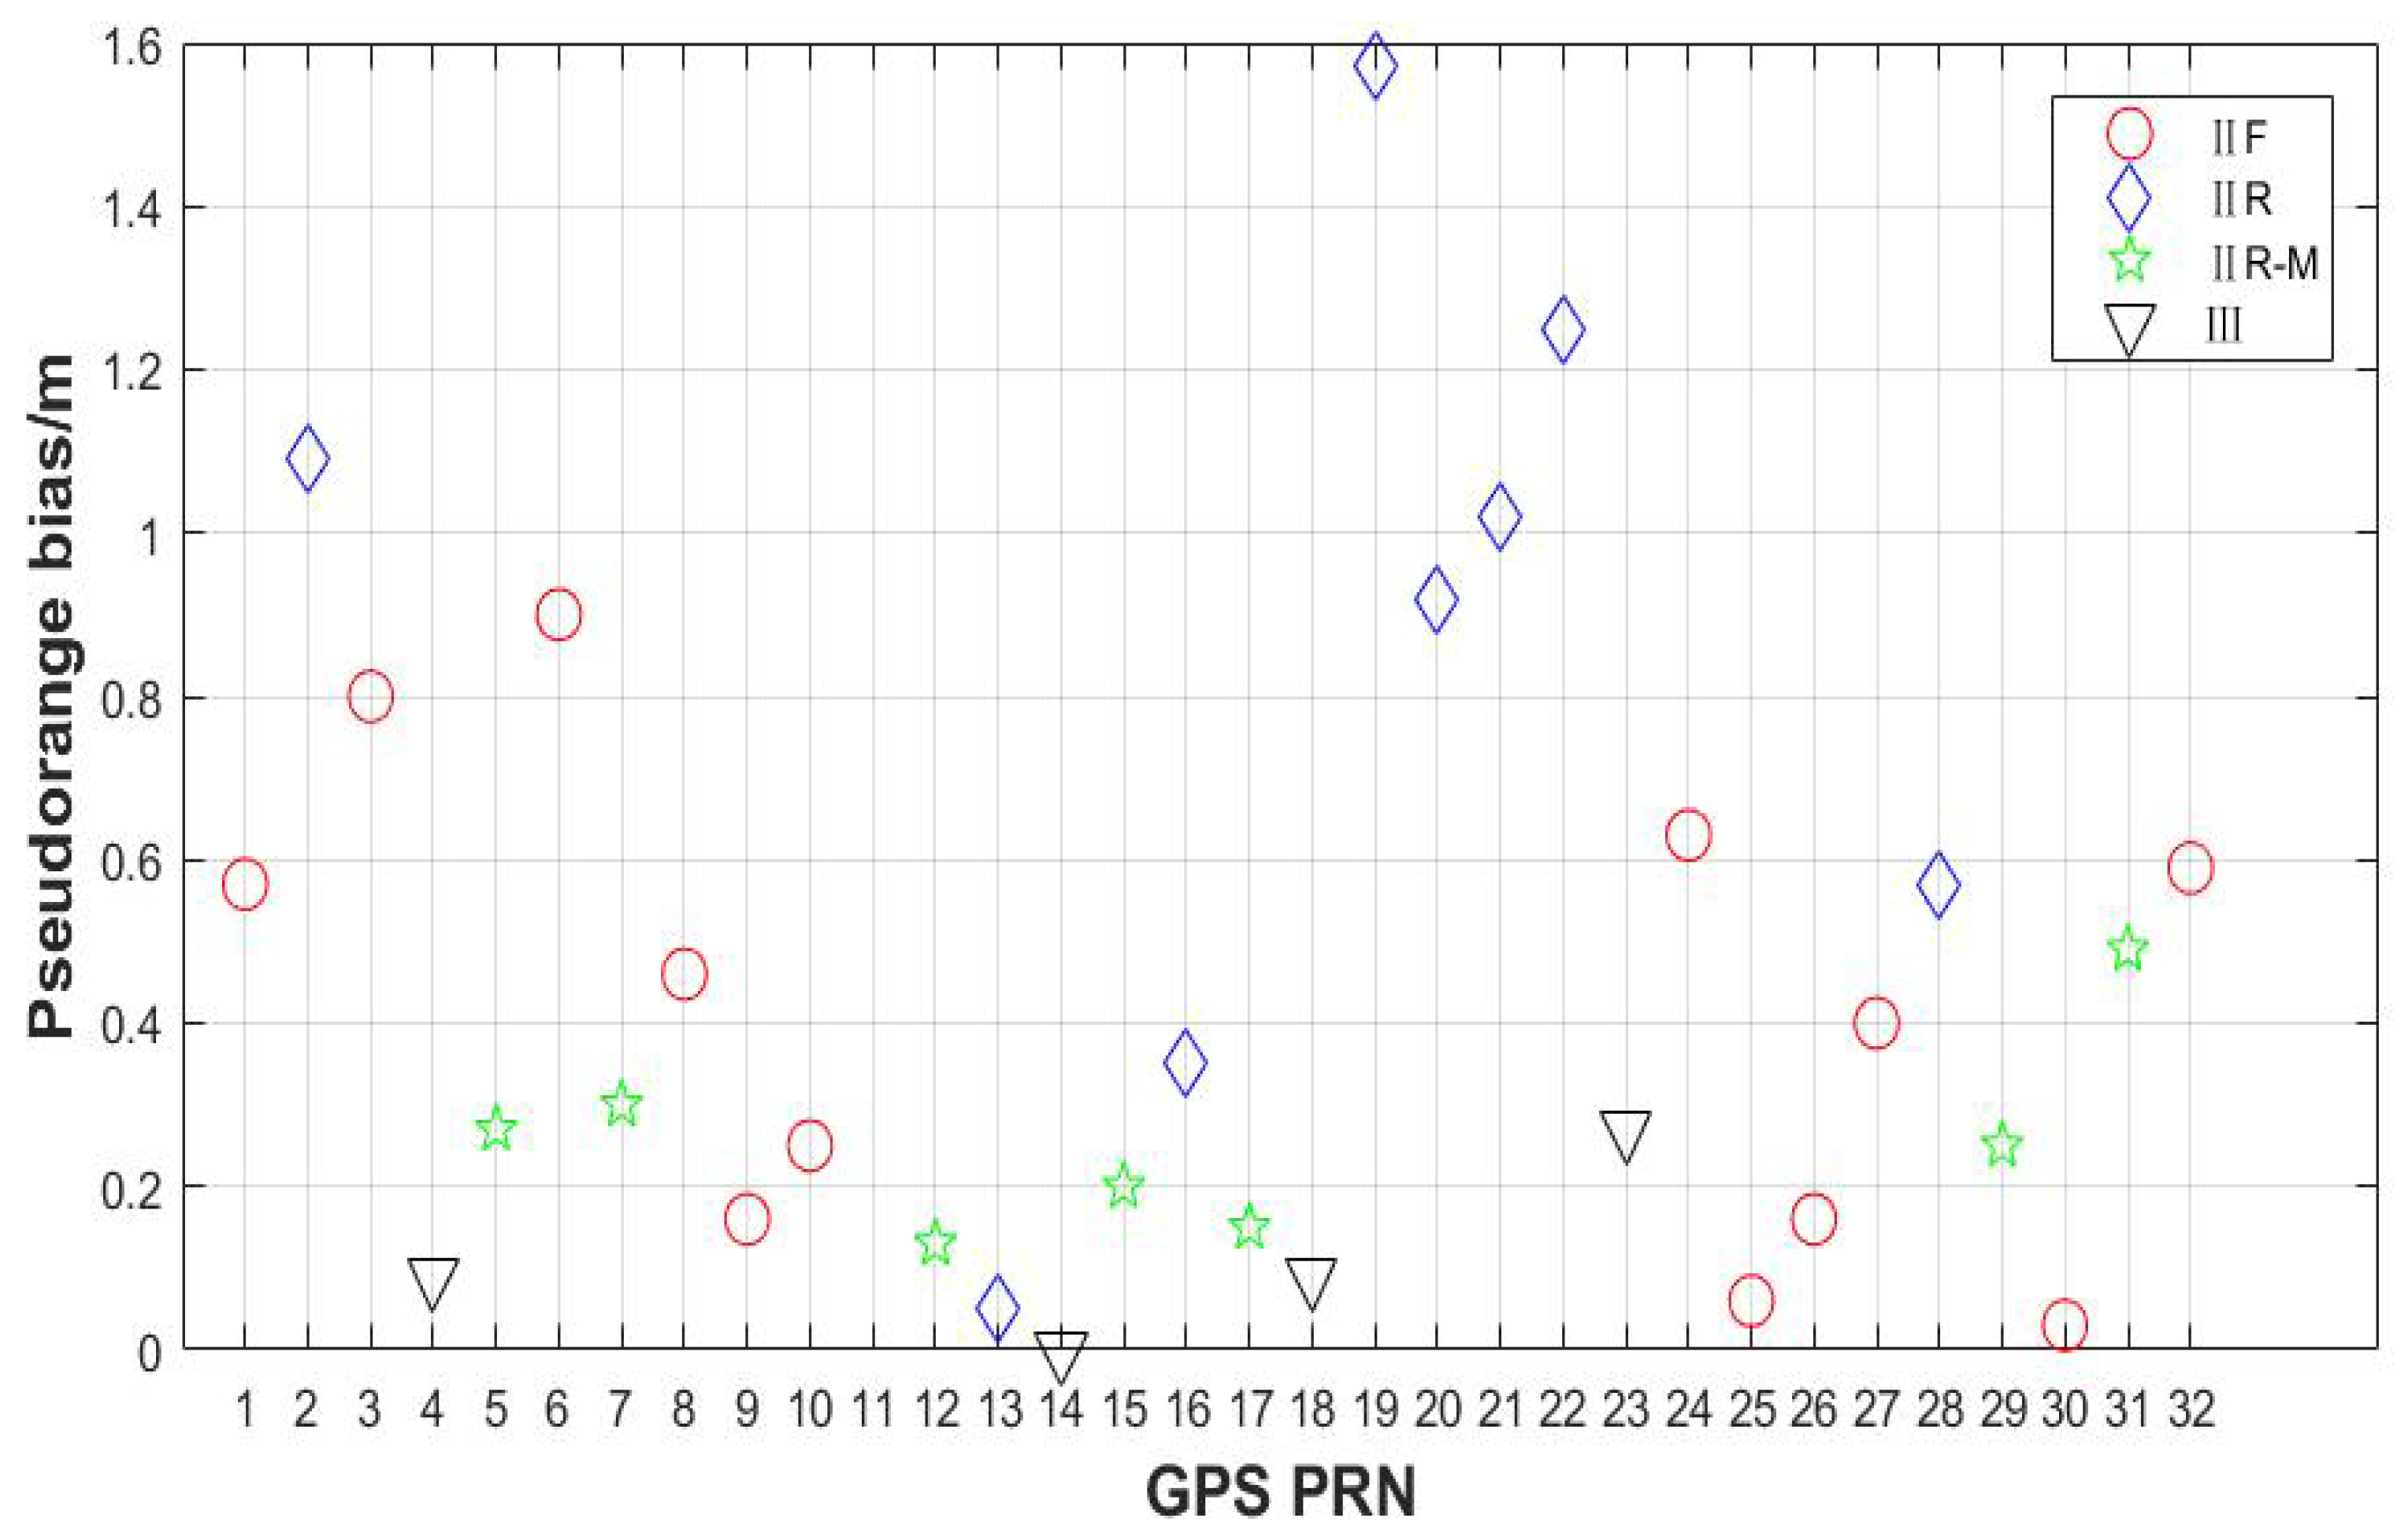
4.1. Results of Pseudorange Bias
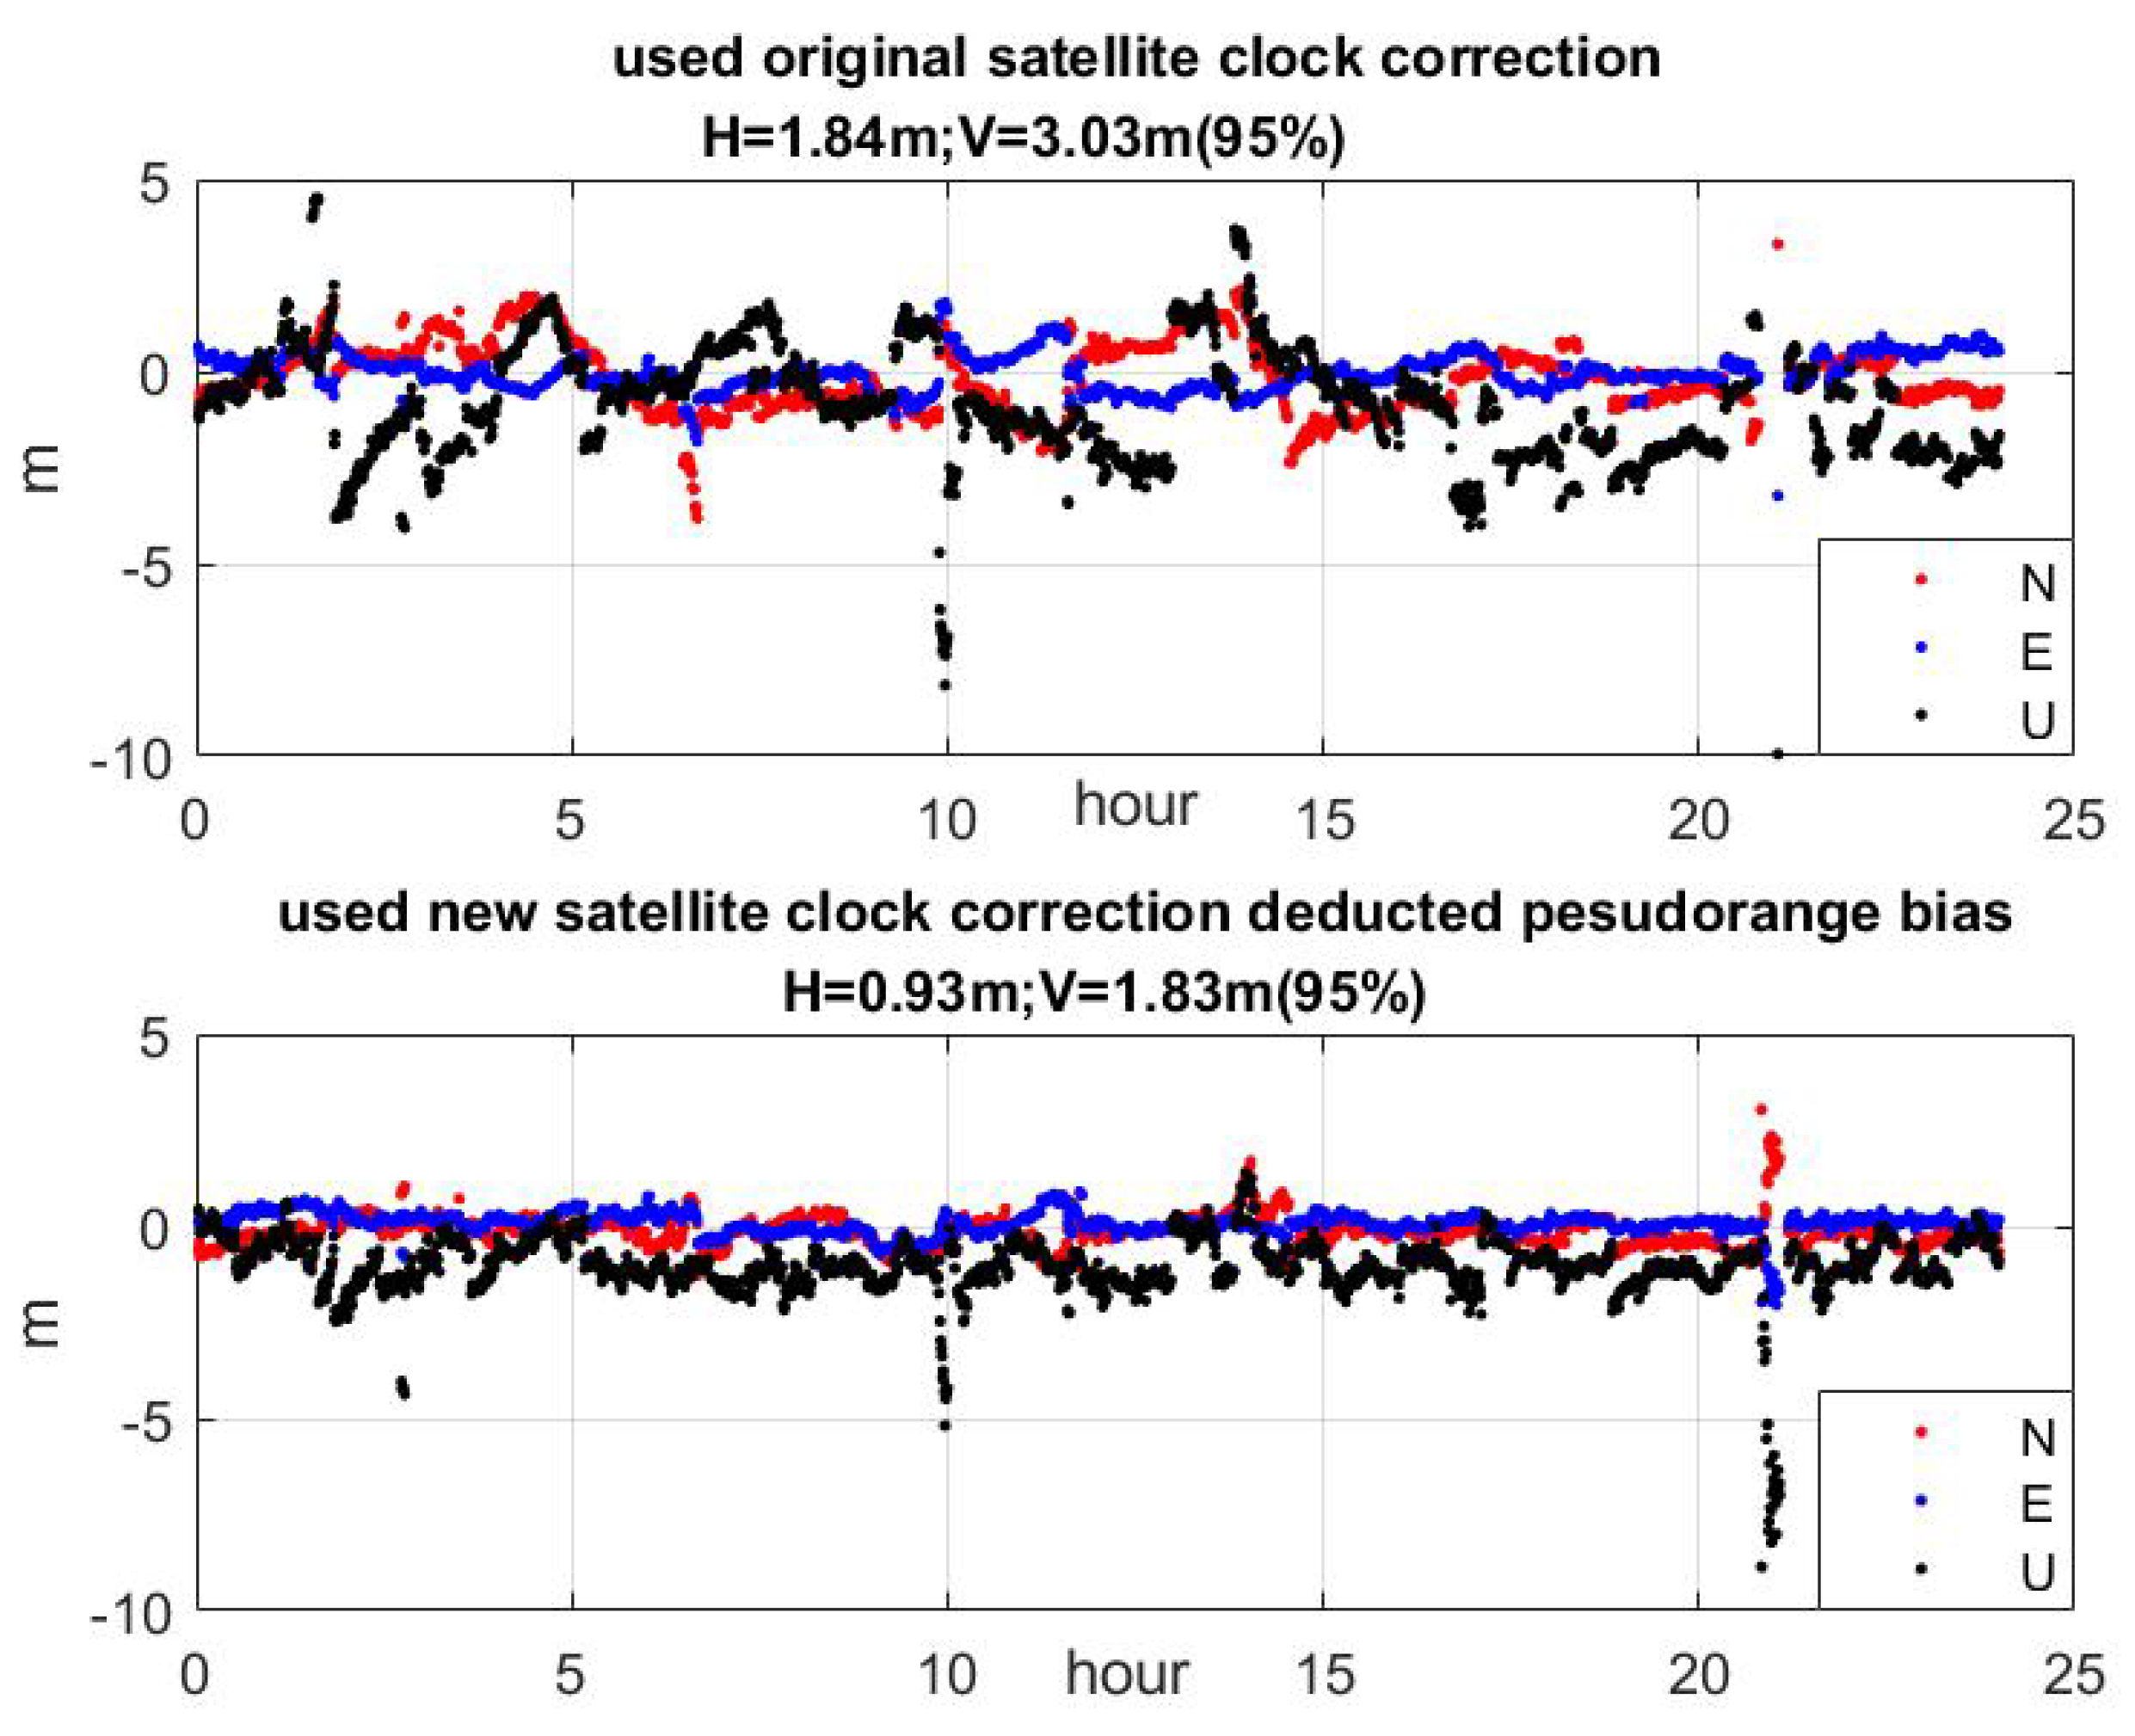
4.2. Performance of BDSBAS
5. Conclusions and Discussion
Author Contributions
Funding
Data Availability Statement
Acknowledgments
Conflicts of Interest
References
- Zhang, X.; Wu, M.; Liu, W.; Li, X.; Yu, S.; Lu, C.; Wickert, J. Initial assessment of the COMPASS/BeiDou-3: New-generation navigation signals. J. Geod. 2017, 91, 1225–1240. [Google Scholar] [CrossRef]
- Zhou, S.; Hu, X.; Wu, B.; Liu, L.; Qu, W.; Guo, R.; He, F.; Cao, Y.; Wu, X.; Zhu, L.; et al. Orbit determination and time synchronization for a GEO/IGSO satellite navigation constellation with regional tracking network. Sci. China Ser. G Phys. Mech. Astron. 2011, 54, 1089–1097. [Google Scholar] [CrossRef]
- Zhou, S.; Cao, Y.; Zhou, J.; Hu, X.; Tang, C.; Liu, L.; Guo, R.; He, F.; Chen, J.; Wu, B. Positioning accuracy assessment for the 4GEO/5IGSO/2MEO constellation of COMPASS. Sci. China Ser. G Phys. Mech. Astron. 2012, 55, 2290–2299. [Google Scholar] [CrossRef]
- ICAO. International Standards and Recommended Practices (SARPS), Annex 10—Aeronautical Telecommunications; Radio Navigation Aids 2006; ICAO: Montreal, QC, Canada, 2006. [Google Scholar]
- SBAS IWG. SBAS L5 DFMC Interface Control Document (SBAS L5 DFMC ICD); Revision 4; SBAS IWG: Dakar, Senegal, 2017. [Google Scholar]
- RTCA. Minimum Operational Performance Standards for Global Positioning System/Wide Area Augmentation System Airborne Equipment, RTCA DO-229D; RTCA, Inc.: Washington, DC, USA, 2006. [Google Scholar]
- RTCA. Minimum Operational Performance Standards for Global Positioning System/Wide Area Augmentation System Airborne Equipment: Integrated and Highlighted; RTCA, Inc.: Washington, DC, USA, 2013. [Google Scholar]
- Cao, Y.; Hu, X.; Wu, B.; Zhou, S.; Liu, L.; Su, R.; Chang, Z.; He, F.; Zhou, J. The wide-area difference system for the regional satellite navigation system of COMPASS. Sci. China Ser. G Phys. Mech. Astron. 2012, 55, 1307–1315. [Google Scholar] [CrossRef]
- Cabler, H.; De Cleene, B. LPV: New, Improved WAAS Instrument Approach. In Proceedings of the International Technical Meeting of the Satellite Division of the Institute of Navigation, Portland, OR, USA, 24–27 September 2002. [Google Scholar]
- Chen, J.; Huang, Z.G.; Li, R. Computation of satellite clock–ephemeris corrections using a priori knowledge for satellite-based augmentation system. GPS Solut. 2017, 21, 663–673. [Google Scholar] [CrossRef]
- Zhao, L.; Hu, X.; Tang, C.; Cao, Y.; Zhou, S.; Yang, Y.; Liu, L.; Guo, R. Generation of DFMC SBAS corrections for BDS-3 satellites and improved positioning performances. Adv. Space Res. 2020, 66, 702–714. [Google Scholar] [CrossRef]
- Xu, A.; Xu, Z.; Ge, M.; Xu, X.; Zhu, H.; Sui, X. Estimating Zenith Tropospheric Delays from BeiDou Navigation Satellite System Observations. Sensors 2013, 13, 4514–4526. [Google Scholar] [CrossRef] [PubMed]
- Zhang, X.; Guo, F.; Zhou, P. Improved precise point positioning in the presence of ionospheric scintillation. GPS Solut. 2014, 18, 51–60. [Google Scholar] [CrossRef]
- Shallberg, K.; Shloss, P.; Altshuler, E.; Tahmazyan, L. WAAS Measurement Processing, Reducing the Effects of Multipath; ION GPS 2001; ION: Salt Lake City, VA, USA, 2001; pp. 2334–2340. [Google Scholar]
- Wu, X.; Zhou, J.; Wang, G.; Hu, X.; Cao, Y. Multipath error detection and correction for GEO/IGSO satellites. Sci. China Ser. G Phys. Mech. Astron. 2012, 55, 1297–1306. [Google Scholar] [CrossRef]
- Wong, G.; Phelts, R.E.; Walter, T.; Enge, P. Bounding errors caused by nominal gnss signal deformations. In Proceedings of the 24th International Technical Meeting of the Satellite Division of the Institute of Navigation (ION GNSS 2011), Portland, OR, USA, 20–23 September 2011; Volume 6955, pp. 2657–2664. [Google Scholar]
- Wong, G.; Phelts, R.E.; Walter, T.; Enge, P. Characterization of signal deformations for gps and waas satellites. In Proceedings of the 23rd International Technical Meeting of the Satellite Division of the Institute of Navigation (ION GNSS 2010), Portland, OR, USA, 21–24 September 2010; Volume 7672, pp. 3143–3151. [Google Scholar]
- Gong, X.; Lou, Y.; Zheng, F.; Gu, S.; Shi, C.; Liu, J.; Jing, G. Evaluation and calibration of BeiDou receiver-related pseudorange biases. GPS Solut. 2018, 22, 98. [Google Scholar] [CrossRef]
- Phelts, R.E.; Akos, D.M.; Enge, P. Robust signal quality monitoring and detection of evil waveforms. In Proceedings of the ION NTM 2000, Institute of Navigation, Anaheim, CA, USA, 26–28 January 2000; pp. 1180–1190. [Google Scholar]
- Grewal, M.S. Space-based augmentation for global navigation satellite systems. IEEE Trans. Ultrason. Ferroelectr. Freq. Control. 2012, 59, 497–503. [Google Scholar] [CrossRef] [PubMed]
- Cao, Y.L.; Hu, X.G.; Zhou, J.H.; Wu, B. Kinematic Wide Area Differential Corrections for BeiDou Regional System basing on two-way Time Synchronization. Lect. Notes Electr. Eng. 2014, 305, 277–288. [Google Scholar]
- Wong, G.; Chen, Y.H.; Phelts, R.E.; Walter, T.; Enge, P. Mitigation of Nominal Signal Deformations on Dual-Frequency WAAS Position Errors. In Proceedings of the 27th International Technical Meeting of the Satellite Division of the Institute of Navigation (ION GNSS+ 2014), Tampa, FL, USA, 8–12 September 2014; pp. 3129–3147. [Google Scholar]
- Hauschild, A.; Montenbruck, O. A study on the dependency of gnss pseudorange biases on correlator spacing. GPS Solut. 2016, 20, 159–171. [Google Scholar] [CrossRef]
- Hauschild, A.; Montenbruck, O. The Effect of Correlator and Front-End Design on GNSS Pseudorange Biases for Geodetic Receivers. Navigation 2016, 63, 443–453. [Google Scholar] [CrossRef]
- Tang, C.; Guo, R.; Hu, X.; Zhu, L.; Li, R.; Pan, J.; Zhou, S.; Chen, J. Orbit determination and time synchronization for new-generation Beidou satellites: Preliminary results. Sci. Sin. Phys. Mech. Astron. 2016, 46, 119502. [Google Scholar] [CrossRef] [Green Version]
- Felski, A.; Nowak, A. On Egnos Monitoring in Local Conditions. Artif. Satell. 2013, 48, 85–92. [Google Scholar] [CrossRef] [Green Version]
- Felski, A.; Nowak, A.; Woźniak, T. Accuracy and Availability of Egnos—Results of Observations. Artif. Satell. 2011, 46, 111–118. [Google Scholar] [CrossRef] [Green Version]
- Fellner, A.; Banaszek, K.; Trómi´nski, P. The implementation of the EGNOS system to APV-I precision approach operations. Trans. Nav. Int. J. Mar. Navig. Safe. Sea Transp. 2010, 4, 41–46. [Google Scholar]
- Larence, D.; Bunce, D.; Mathur, N.G.; Sigler, C.E. Wide Area Augmentation System (WAAS)—Program Status; ION GNSS 2007; ION: Fort Worth, VA, USA, 2007; pp. 892–899. [Google Scholar]
- Garcia, A.M.; Medel, C.H.; Merino, M.M.R. Galileo Navigation and Integrity Algorithms; ION GNSS 2005; ION: Long Beach, CA, SA, 2005; pp. 1315–1326. [Google Scholar]
- Hernandez, C.; Catalan, C.; Fernandez, M.A.; Gavin, A.J.; Sardon, E.; Martin, J.R. Galileo Integrity: The Ground Segment Comput Algorithm Perspective; ION GNSS 2006; ION: Fort Worth, TX, USA, 2006; pp. 2634–2645. [Google Scholar]
- Amarillo, F.; D’Angelo, P. New Developments for the User Integrity Processing with Galileo Implementation and Testing of Galileo User Integrity Algorithms; ION GNSS 2009; ION: Savannah, GA, USA, 2009; pp. 2775–2782. [Google Scholar]
- Kovach, K.; Dobyne, J.; Crews, M.; Miles, C. GPS III Integrity Concept; ION GNSS 2008; ION: Savannah, GA, USA, 2008; pp. 2250–2257. [Google Scholar]
- Steigenberger, P.; Hauschild, A.; Montenbruck, O.; Hugentobler, U. Performance Analysis of COMPASS Orbit and Clock Determination and COMPASS-Only PPP; IGS Workshop: Olsztyn, Poland, 2012. [Google Scholar]
- Wei, Z.; Liu, G.; Wu, F. Compass Coordinate System. EGU General Assembly Conference. In Proceedings of the EGU General Assembly Conference Abstracts; 2013; Available online: https://ui.adsabs.harvard.edu/abs/2013EGUGA..15.6788W (accessed on 15 August 2021).
- Liu, Y.C.; Liu, L.; Zhou, S.S.; Xu, J.Y.; Qi, W.; Hu, X.G. Research on Accuracy Evaluation Method of Beidou Coordinate Frame. Prog. Astron. 2021, 39, 105–107. [Google Scholar] [CrossRef]


| PRN | Pseudorange Bias/m | PRN | Pseudorange Bias/m | ||
|---|---|---|---|---|---|
| L1P | L1P/L2P | L1P | L1P/L2P | ||
| G02 | 0.1 | 0.2 | G19 | 0.1 | 0.4 |
| G03 | 0.1 | 0.2 | G20 | 0.2 | 1.3 |
| G04 | 0.3 | 0.6 | G21 | 0.1 | 0.8 |
| G05 | 0.0 | 0.2 | G22 | 0.0 | 0.1 |
| G06 | 0.1 | 0.3 | G23 | 0.2 | 0.9 |
| G09 | 0.2 | 0.9 | G24 | 0.3 | 1.6 |
| G10 | 0.1 | 0.4 | G25 | 0.2 | 0.7 |
| G12 | 0.3 | 1.0 | G26 | 0.1 | 0.4 |
| G13 | 0.1 | 0.6 | G27 | 0.2 | 0.9 |
| G14 | 0.2 | 0.4 | G30 | 0.1 | 0.8 |
| G15 | 0.1 | 0.9 | G31 | 0.1 | 0.3 |
| G16 | 0.2 | 0.4 | G32 | 0.1 | 0.2 |
| G18 | 0.2 | 0.2 | |||
| MEAN | L1CA:0.14 m | MEAN | L1CA/L2P:0.59 m | ||
| RMS | L1CA:0.17 m | RMS | L1CA/L2P:0.70 m | ||
| PRN | Pseudorange Bias/m | PRN | Pseudorange Bias/m | ||||
|---|---|---|---|---|---|---|---|
| MEAN | RMS | STD | MEAN | RMS | STD | ||
| G01 | 0.57 | 0.57 | 0.05 | G17 | −0.15 | 0.15 | 0.03 |
| G02 | −1.09 | 1.09 | 0.00 | G18 | −0.09 | 0.09 | 0.04 |
| G03 | 0.80 | 0.80 | 0.06 | G19 | −1.57 | 1.57 | 0.02 |
| G04 | −0.09 | 0.09 | 0.02 | G20 | −0.92 | 0.92 | 0.01 |
| G05 | 0.27 | 0.27 | 0.04 | G21 | −1.01 | 1.02 | 0.04 |
| G06 | 0.90 | 0.90 | 0.02 | G22 | −1.25 | 1.25 | 0.05 |
| G07 | 0.30 | 0.30 | 0.02 | G23 | −0.27 | 0.27 | 0.01 |
| G08 | 0.46 | 0.46 | 0.03 | G24 | 0.63 | 0.63 | 0.03 |
| G09 | 0.15 | 0.16 | 0.04 | G25 | 0.02 | 0.06 | 0.06 |
| G10 | 0.25 | 0.25 | 0.01 | G26 | 0.16 | 0.16 | 0.02 |
| G11 | −0.50 | 0.50 | 0.05 | G27 | 0.40 | 0.40 | 0.02 |
| G12 | −0.13 | 0.13 | 0.02 | G28 | −0.57 | 0.57 | 0.01 |
| G13 | −0.04 | 0.05 | 0.03 | G29 | −0.25 | 0.25 | 0.05 |
| G14 | 0.01 | 0.01 | 0.00 | G30 | 0.01 | 0.03 | 0.02 |
| G15 | 0.20 | 0.20 | 0.06 | G31 | 0.49 | 0.49 | 0.05 |
| G16 | −0.35 | 0.35 | 0.01 | G32 | 0.59 | 0.59 | 0.04 |
| GPS Open Service | SBAS | |||||
|---|---|---|---|---|---|---|
| Station | Horizontal/m | Vertical/m | 3-D/m | Horizontal/m | Vertical/m | 3-D/m |
| Station 01 | 1.76 | 4.29 | 4.41 | 0.81 | 2.13 | 2.20 |
| Station 02 | 1.81 | 3.98 | 4.08 | 0.94 | 1.76 | 1.90 |
| Station 03 | 2.11 | 3.74 | 3.97 | 1.18 | 2.90 | 3.02 |
| Station 04 | 1.94 | 3.94 | 4.12 | 0.96 | 2.39 | 2.46 |
| Station 05 | 1.66 | 4.10 | 4.22 | 0.84 | 1.33 | 1.43 |
| mean | 1.86 | 4.01 | 4.16 | 0.95 | 2.10 | 2.20 |
| BDS-3 Open Service | SBAS | |||||
|---|---|---|---|---|---|---|
| Station | Horizontal/m | Vertical/m | 3-D/m | Horizontal/m | Vertical/m | 3-D/m |
| Station 01 | 0.88 | 1.21 | 1.38 | 0.34 | 0.66 | 0.74 |
| Station 02 | 0.87 | 1.28 | 1.46 | 0.51 | 0.88 | 0.99 |
| Station 03 | 0.92 | 1.73 | 1.85 | 0.57 | 1.12 | 1.20 |
| Station 04 | 0.90 | 1.55 | 1.67 | 0.58 | 1.02 | 1.11 |
| Station 05 | 1.09 | 1.75 | 1.99 | 0.67 | 1.18 | 1.33 |
| mean | 0.93 | 1.50 | 1.67 | 0.53 | 0.97 | 1.07 |
| Station | RTCA Service | DFMC Service | ||
|---|---|---|---|---|
| Availability | Integrity | Availability | Integrity | |
| Station 01 | 100% | 0 | 100% | 0 |
| Station 02 | 99.95% | 0 | 100% | 0 |
| Station 03 | 97.58% | 0 | 100% | 0 |
| Station 04 | 96.82% | 0 | 100% | 0 |
| Station 05 | 100% | 0 | 100% | 0 |
| mean | 98.87% | 0 | 100% | 0 |
Publisher’s Note: MDPI stays neutral with regard to jurisdictional claims in published maps and institutional affiliations. |
© 2021 by the authors. Licensee MDPI, Basel, Switzerland. This article is an open access article distributed under the terms and conditions of the Creative Commons Attribution (CC BY) license (https://creativecommons.org/licenses/by/4.0/).
Share and Cite
Liu, Y.; Cao, Y.; Tang, C.; Chen, J.; Zhao, L.; Zhou, S.; Hu, X.; Tian, Q.; Yang, Y. Pseudorange Bias Analysis and Preliminary Service Performance Evaluation of BDSBAS. Remote Sens. 2021, 13, 4815. https://doi.org/10.3390/rs13234815
Liu Y, Cao Y, Tang C, Chen J, Zhao L, Zhou S, Hu X, Tian Q, Yang Y. Pseudorange Bias Analysis and Preliminary Service Performance Evaluation of BDSBAS. Remote Sensing. 2021; 13(23):4815. https://doi.org/10.3390/rs13234815
Chicago/Turabian StyleLiu, Yuchen, Yueling Cao, Chengpan Tang, Jinping Chen, Liqian Zhao, Shanshi Zhou, Xiaogong Hu, Qiuning Tian, and Yufei Yang. 2021. "Pseudorange Bias Analysis and Preliminary Service Performance Evaluation of BDSBAS" Remote Sensing 13, no. 23: 4815. https://doi.org/10.3390/rs13234815