Article

Meteorological Drought Analysis and Return Periods over North and West Africa and Linkage with El Niño–Southern Oscillation (ENSO)

1
Remote Sensing Information and Digital Earth Center, School of Computer Science and Technology, Qingdao University, Qingdao 266071, China
2
School of Business, Qingdao University, Qingdao 266071, China
3
Key Laboratory of Digital Earth Science, Aerospace Information Research Institute, Chinese Academy of Sciences, Beijing 100094, China
4
Department of Physics, Federal University of Agriculture, Makurdi 970211, Nigeria
5
Laboratory of Eremology and Combating Desertification, Institut des Regions Arides (IRA), Medenine 4119, Tunisia
6
Center for Sustainability and Resilient Infrastructure and Communities (SaRIC), School of the Built Environment and Architecture, London South Bank University, London SE1 0AA, UK
7
College of Earth and Planetary Sciences, University of Chinese Academy of Sciences, Beijing 100049, China
*
Author to whom correspondence should be addressed.
Remote Sens. 2021, 13(23), 4730; https://doi.org/10.3390/rs13234730
Submission received: 13 October 2021 / Revised: 12 November 2021 / Accepted: 16 November 2021 / Published: 23 November 2021

Abstract

:
Droughts are one of the world’s most destructive natural disasters. In large regions of Africa, droughts can have strong environmental and socioeconomic impacts. Understanding the mechanism that drives drought and predicting its variability is important for enhancing early warning and disaster risk management. Taking North and West Africa as the study area, this study adopted multi-source data and various statistical analysis methods, such as the joint probability density function (JPDF), to study the meteorological drought and return years across a long term (1982–2018). The standardized precipitation index (SPI) was used to evaluate the large-scale spatiotemporal drought characteristics at 1–12-month timescales. The intensity, severity, and duration of drought in the study area were evaluated using SPI–12. At the same time, the JPDF was used to determine the return year and identify the intensity, duration, and severity of drought. The Mann-Kendall method was used to test the trend of SPI and annual precipitation at 1–12-month timescales. The pattern of drought occurrence and its correlation with climate factors were analyzed. The results showed that the drought magnitude (DM) of the study area was the highest in 2008–2010, 2000–2003, and 1984–1987, with the values of 5.361, 2.792, and 2.187, respectively, and the drought lasting for three years in each of the three periods. At the same time, the lowest DM was found in 1997–1998, 1993–1994, and 1991–1992, with DM values of 0.113, 0.658, and 0.727, respectively, with a duration of one year each time. It was confirmed that the probability of return to drought was higher when the duration of drought was shorter, with short droughts occurring more regularly, but not all severe droughts hit after longer time intervals. Beyond this, we discovered a direct connection between drought and the North Atlantic Oscillation Index (NAOI) over Morocco, Algeria, and the sub-Saharan countries, and some slight indications that drought is linked with the Southern Oscillation Index (SOI) over Guinea, Ghana, Sierra Leone, Mali, Cote d’Ivoire, Burkina Faso, Niger, and Nigeria.

Graphical Abstract

1. Introduction

Drought is a recurrent climatic phenomenon all over the world, which varies every time it occurs in terms of its magnitude, severity, duration, and geographical coverage. Drought episodes have been recurring for many years in Africa and have affected humanity in many ways, such as causing loss of life, crop failures, and food shortages. These, in turn, have triggered famine in many regions, resulting in malnutrition, health issues, and mass migration [1,2,3].
Previous research found that more than 10 million people died due to drought impacts from 1900–2010 in the world [3,4]. In 2003 and 2006, Europe was hit by severe droughts that caused crop failures, navigation problems, and loss of life due to a heat wave [5]. In addition, until 2008, the Iberian Peninsula faced impacts of the latter drought that extended for multiple years, reducing groundwater levels and reservoir storage to a minimum [6]. In Africa, drought events caused more than 800,000 deaths and affected about 262 million people from 1900–2013 [7]. Gautam [8] and Shiferaw et al. [9] have reported that 382 dry spells between 1960 and 2006 affected 326 million people in Africa. Furthermore, a very severe drought in Africa during 2010–11 resulted in massive migration, extreme hunger, and the mortality of more than 260,000 people [10]. Henchiri et al. [11] reported that in North and West African regions, severe drought events occurred in 2002, 2009, 2010, and 2016, though the severity and impact differed from one country to another. Shanahan et al. [12] surmised that the severe drought experienced in the Sahel in the 1970s was not uncommon in the context of the last three millennia, and proposed that the monsoon is capable of triggering more extended and severe droughts, which the world will experience in the future. The driest years have become more frequent, now occurring at shorter intervals, and the geographic extent of drought has also increased in West Africa according to Gautier et al. [13]. Oguntunde et al. [14] studied the characteristics of drought and projected the effects of future climate change on drought in West Africa between 1986 and 2100. They reported that the historical pattern of drought was consistent with previous studies conducted over most parts of West Africa, and predicted that an increase in drought intensity and frequency can be expected.
Mauritania, along with various countries in the Sahel, was dramatically impacted by severe droughts during the 2010–11 rainy seasons, which resulted in poor harvests, loss of livestock, and high food prices [9,15,16]. Winkler et al. [17] studied the droughts affecting agriculture in Africa between 2000–16, finding that during La Niña 2010–11, large cropland areas in Somalia (88%), Sudan (64%), and South Sudan (51%) were affected by severe to extreme droughts during the growing seasons. In addition, the study of Elagib and Elhang [18] from the 1940s to 2008 showed several multi-year droughts to have occurred from the 1970s onward in Sudan. Furthermore, Gargouri et al. [19] described how Algeria and Tunisia experienced severe drought during 1999 and 2002. Touchan et al. [20] observed that over the last 1000 years, droughts have occurred every 20 years or so, on average, which could last for two to four successive years in the Mediterranean regions. Numerous investigations, meanwhile, have shown that the frequency of having one dry year is high for Algeria, Tunisia, and Morocco, and the frequency of two or more successive drought years is generally high in the south, moderate in the middle, and low in the north of the continent [21,22,23]. Dry spell phases can affect one or various areas, and their duration can last from one month or season, extending to one year or more [24].
These enumerations of the drought impact in recent years indicate that drought is a recurring, worldwide natural phenomenon, of which the related losses rise day by day [25,26,27]. In research, remote sensing data and methods are critical tools for studying droughts’ underlying drivers. Numerous studies over the last few decades have investigated drought based on their magnitude and severity using different indices, such as multivariable linear regression with composite drought indices (MCDIs) by Liu et al. [28]; optimized vegetation and meteorological drought indices (OVDI and OMDI) by Hao et al. [29]; the US drought monitor (USDM) by Svoboda et al. [30]; the reclamation drought index (RDI) by Weghorst [31]; the standardized precipitation index (SPI) by McKee et al. [32]; the Palmer drought severity index (PDSI) by Palmer [33]; the decile index (DI) by Gibbs and Maher [34]. The SPI was used to study meteorological drought, but this tool can be applied at various timescales to categorize diverse types of drought [35]. Long timescales designate groundwater drought, medium timescales designate hydrological drought, and short timescales are linked to soil moisture and agricultural drought [36].
Understanding the determinants of dry spells’ occurrence is significant in forecasting future events, which acts to prevent adverse effects on the environment [37]. In many regions, observed recurrent droughts are linked with the phenomenon of the El Niño–Southern Oscillation (ENSO) [38,39]. The fundamental climate conditions that cause dry spells are high-pressure systems at a huge scale across a region (over an extended period of low-pressure forecast), rain-bearing frontal systems moving into the zone, or elevated convectional conditions that persevere [40,41]. The adjustments in the overarching climate dynamics that trigger these situations are still ineffectively comprehended [42]. These teleconnections are characterized as repeating and persistent huge-scale patterns of circulation anomalies and pressure across large areas, or even more basically, as atmospheric interactions between usually isolated areas of the ground [38]. The teleconnections can last from weeks to months and may appear for numerous successive years, meaning that they could play a significant role in interdecadal and interannual atmospheric variability. Since they influence precipitation, temperature, jet stream location, storm tracks, and intensity, teleconnections are frequently held accountable for unusual climate patterns across regions [40,41,43]. Different teleconnections are found around the globe, and specific indices often characterize their strengths and phases. The main teleconnections of concern in this study were the Mediterranean Oscillation Index (MOI), Southern Oscillation Index (SOI), and North Atlantic Oscillation Index (NAOI), obtained from the Climate Research Unit (CRU).
In this context, ENSO is related to regional climate variability and associated droughts over large parts of the African continent. In general, Africa is the hottest and most water-scarce continent on earth [17]. The Mediterranean climate is characterized as a mid-latitude temperate climate with a dry summer season. Precipitation has a distinct yearly cycle, with low precipitation in the summer season, as well as a spatial gradient, with values dropping toward the south [44]. The high variability of the Mediterranean climate at seasonal and inter-annual scales is caused by the transitional situation between temperate, cold mild-latitudes and the tropics, resulting in significant circulation changes between winter and summer, as well as the association with several large-scale atmospheric oscillations/teleconnection patterns [44].
The climate of West Africa, meanwhile, is influenced by the interaction of two air masses, the effect of which fluctuates during the year due to the north-south movement of the Intertropical Convergence Zone (ITCZ) [17]. From November to February, dusty Harmattan winds blow throughout most of West Africa as a result of hot, dry continental air masses coming from a high-pressure system above the Sahara desert. Annual monsoon rains are brought by moist equatorial air masses originating over the Atlantic Ocean in the summer [45]. As a result of these interacting air masses, West Africa’s precipitation regime is defined by latitudinal belts of decreasing rainfall and the wet season length. Not only the scarcity of rainfall but also its variability and unpredictability become more significant with increasing latitude. As a result, rainfall variability is great from year to year, ranging from 10 to 20% in coastal regions and up to more than 40% in the northern Sahel [46]. Therefore, drought is considered a recurrent phenomenon in North and West African regions.
The Mediterranean droughts, particularly those that occur during the wet season, can have a significant impact on water resources by lowering groundwater levels and the amount of water available in dams and reservoirs [17,47,48,49]. Meanwhile, in semiarid West Africa, normal rainfall is rare and rainfall is biased to dryness, with a few big rainfall years offset by a larger number of below-average rainfall years [50,51]. Therefore, with rainfall as the limiting factor for farming and many countries strongly relying on rain-fed agriculture, droughts affect natural ecosystems, crop production, and the food supply, and may have severe socioeconomic impacts [52,53]. What is more, severe dry episodes in Africa have often been linked to the effects of the El Niño–Southern Oscillation (ENSO), leading to regional precipitation and temperature anomalies around the globe [54]. Considering the recent drought events of recorded history, and the devastating effects of drought on agriculture and food security over large parts of Africa, monitoring and understanding ENSO-related droughts in North and West Africa is a major concern for implementing measures of adaption to drought hazards.
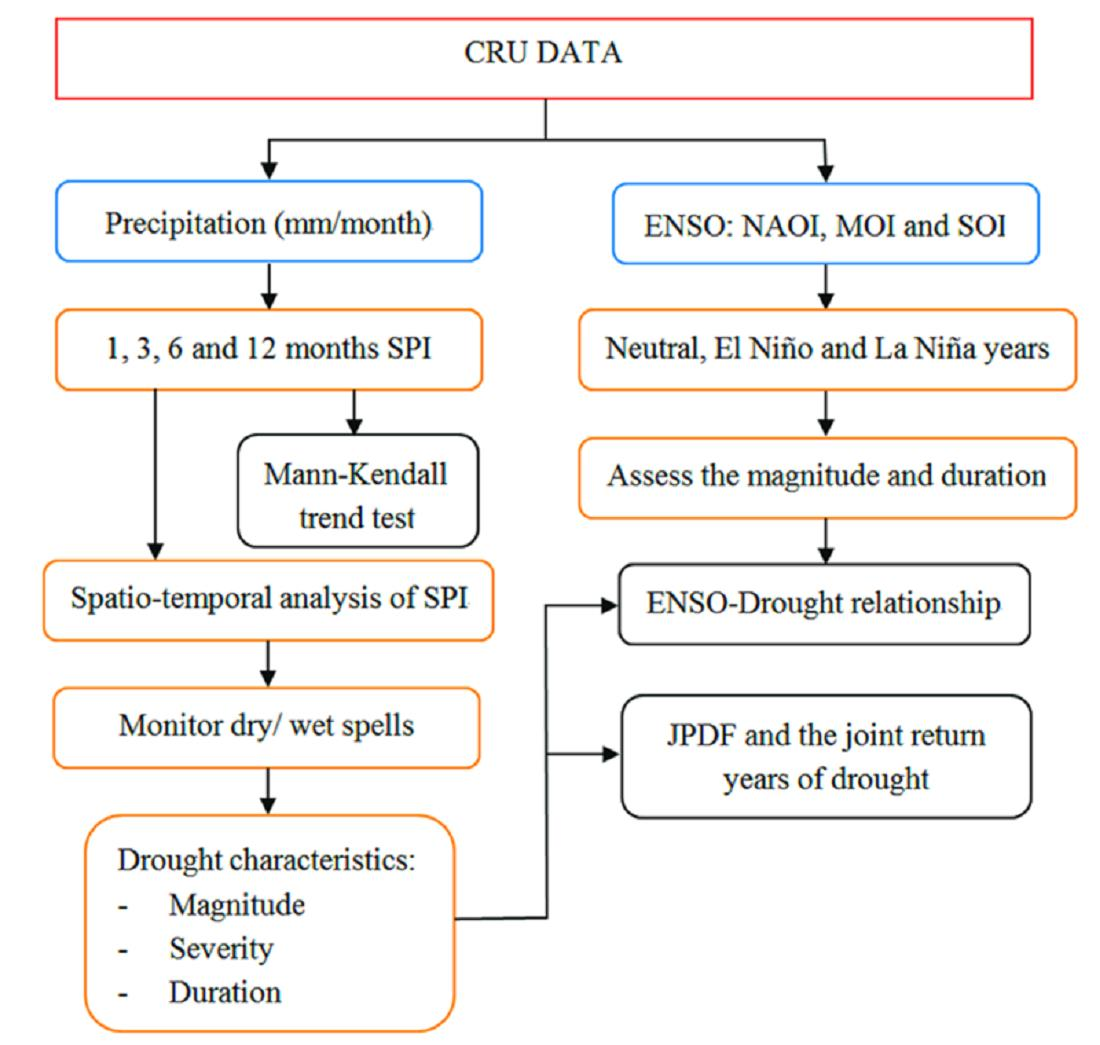
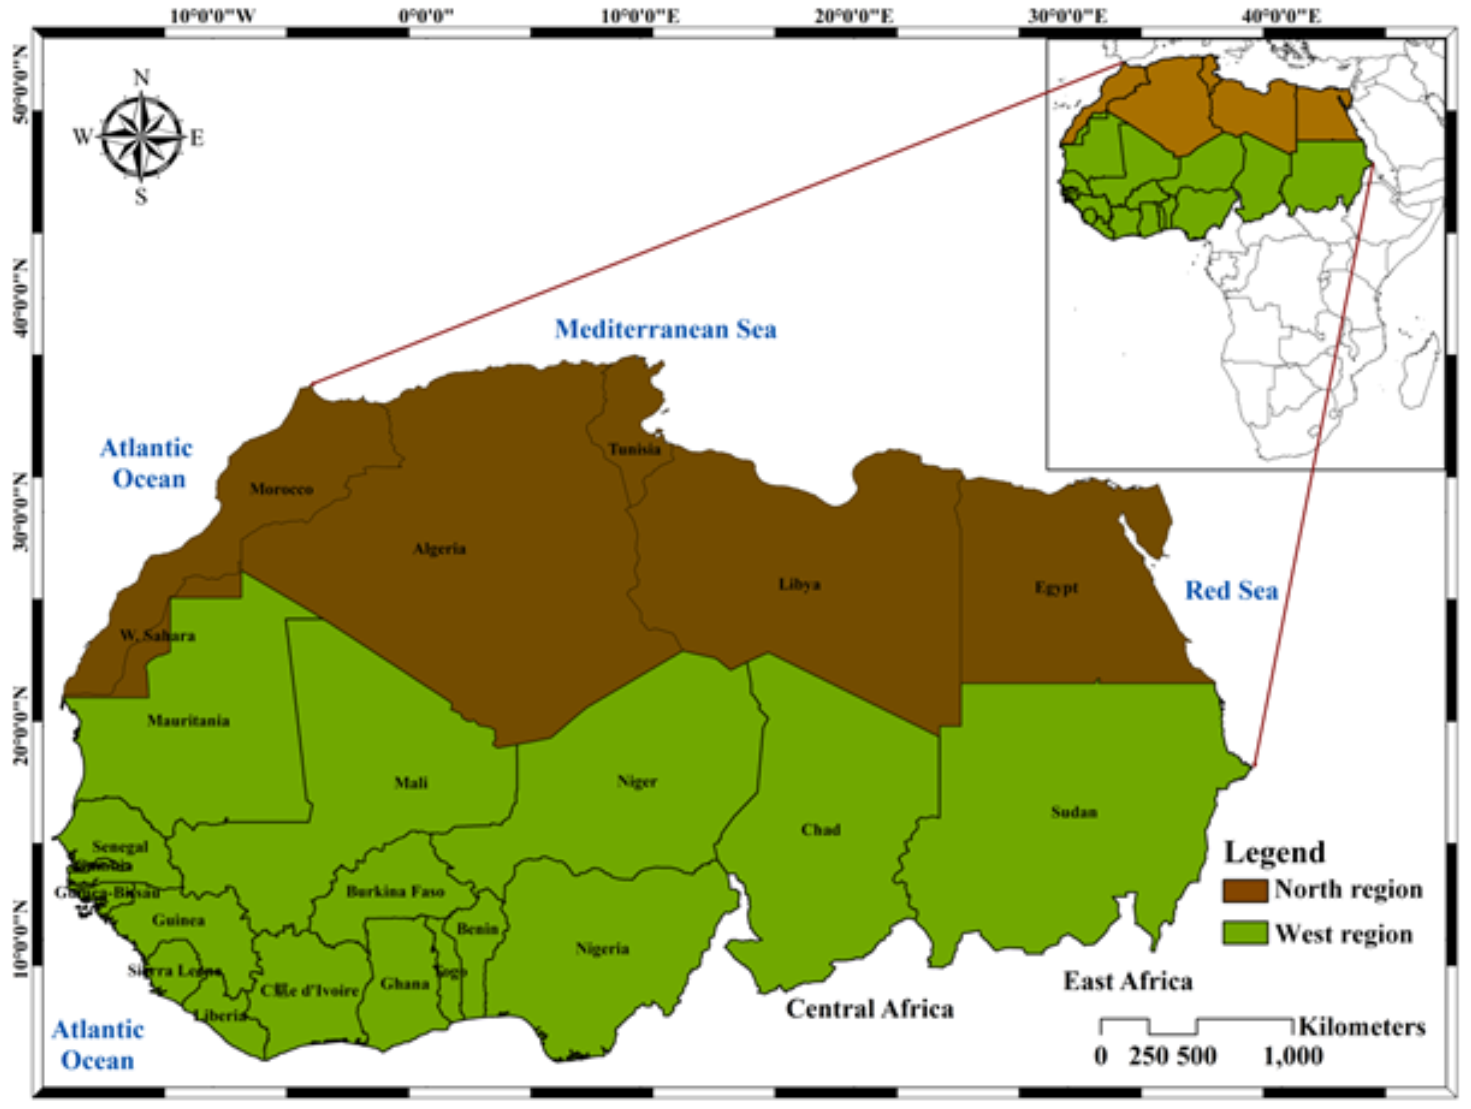
In this study, meteorological droughts are analyzed using the SPI at 1–12-month timescales, to assess the dry and wet spells from 1982 to 2018 over North and West Africa. Using the joint probability distribution function (JPDF), the drought return periods were calculated based on their characteristics. MOI, NAOI, and SOI data from the CRU (1982–2018) were used to examine the ENSO-drought relationship over the study area. The result of this study can be considered when interrogating future drought variations in comparison with the historical period.

2. Materials and Methods

2.1. Study Area

The study area covers North and West Africa. This region lies between latitudes 4° and 38°N, and longitudes 18°W and 40°E. It is surrounded by the Atlantic Ocean in the West and Southwest, the Red Sea in the East, the Mediterranean Sea in the North, and East and Central Africa in the Southeast (Figure 1) [11]. The study region contains a range of climates such as the desert climate (arid and hyper-arid), the semi-arid climate (steppe and semi-desert), the tropical monsoon climate, and the tropical wet and dry climate [55].

2.2. Methods

In this work, we used the precipitation dataset during 1982–2018 from the Climate Research Unit (CRU) (http://data.ceda.ac.uk/badc/cru/data/cru_ts/cru_ts_4.00/data/ accessed on 18 September 2021) between 1982 and 2018. The SPI presented by McKee et al. [32] was used to assess meteorological drought. It is calculated by fitting the function of the gamma distribution to the precipitation dataset of a specified frequency variation across a region, and then converting the gamma distribution function to a normal distribution function with a variance and mean of one (1) and zero (0), respectively [11]. Following Guttman [56], the main objective of doing this is to reduce the skewness in the dataset to zero. The magnitude of the drought was understood as the cumulative SPI for the dry years and considered as a positive value. The intensity of drought was calculated as the drought magnitude divided by the drought duration. We also used the Mann-Kendall test to characterize the SPI trends and precipitation and assess the statistical distributions of the dataset records. Kalisa et al. [57] mentioned that the Mann-Kendall test is the most suitable due to its ability to overcome the issue of (positive or negative) skewness associated with an extreme value of the precipitation dataset. In this work, we also studied the main ENSO teleconnections such as the Mediterranean Oscillation Index (MOI), the North Atlantic Oscillation Index (NAOI), and the Southern Oscillation Index (SOI), as obtained from the CRU during 1982–2018 (https://crudata.uea.ac.uk/cru/data/pci.htm accessed on 18 September 2021), to understand the ENSO-drought relationship over the study area. The methodology employed in this study is illustrated in the abstract flowchart.

2.2.1. Standardized Precipitation Index (SPI)

For the SPI calculation, the method of Guttman [56] and Haroon et al. [58] was used. The standard deviation (s), skew X (sk), and mean ( X ) were defined following the Equations below:
mean   x   = X N
standard   deviation   s   = ( X + X ) 2 N
skewness   sk   = N N 1 N 2 ( X + X ) 2 N
where N represents the length of the dataset records and X presents the time series of precipitation. The precipitation dataset was converted using the log normal (ln), and the average of those values was calculated. The converted values were exposed to (U), which was utilized to calculate the scale parameter and shape following the Equations:
Log   mean =   Xh   = In X N
U = In X In X N
Shape β = 1 4 U 1 + 4 U 3
and
Scale α = X β
Additionally, the values of (ln) were converted by the function of gamma distribution, including the scale values and shape:
Cumulative   gamma   function   G x = 1 α β Γ β 0 x x β 1 e x a dx
and we performed a T transform as
In 1 X g 2 ,   where   0   <   X g     0 .
Likewise ,   t = In 1 1 x g 2   ,   where   0.5   <   X g     1.0
and
SPI = t + C 0 + C 1 t + C 2 t 2 1 + d 1 t + d 2 t 2 + d 3 t 3   ,   where   0   <   X g     0.5
or
SPI = t C 0 + C 1 t + C 2 t 2 1 + d 1 t + d 2 t 2 + d 3 t 3   ,   where   0   <   X g     0.5 .
The constants articulated in Equations (11) and (12) are:
C0 = (2.515517), d1= (1.432788);
C1 = (0.802853), d2 = (0.189269);
C2 = (0.010328), d3 = (0.001308).

2.2.2. Magnitude, Intensity, and Duration of Drought

The magnitude of drought (DM) was obtained via Equation (13):
D M = i = 1 n SPI ij
where DM is the drought magnitude and n is the number of months with a drought event at j timescale. The drought intensity (DI) is the ratio of the drought magnitude (DM) to the drought duration (Dd), as follows:
D M = D M D d

2.2.3. Mann-Kendall Test

The Equation below displays the Mann-Kendall trend test:
S = i 1 n 1 j 1 + 1 n sgn x j x i ,
where xj is ordered from j = i + 1, 2, 3,….n and xi from i = 1, 2, 3,….n – 1. The values of the dataset are considered as a reference point to which assessment is prepared with the dataset values xj, such as:
sgn x j x i   =   + 1 , >   x j x i 0 , =   x j x i 1 , <   x j x i
The statistic of variance is given as
Var   S   = n n 1 2 n + 5   i = 1 m t i i i 1 2 i + 5 18
where ti is the number of ties up to sample value i. Zc is the statistics test, which is calculated as follows:
as   Z c =   S 1 Var S ,   S > 0 0 ,     S = 0 S 1 Var S ,   S < 0
Zc defines a standard normal distribution (SND). The negative and positive Zc values display downward and upward trends, respectively. Mondal et al. [59] mentioned that to evaluate either a downward or upward trend, a significance level γ can be used; if Zc is bigger than Zγ/2, then the test of the trend is assumed significant, and vice versa.

2.2.4. Sen’s Slope Estimator

Modarres et al. [60] characterized the Sen’s slope estimator, and the magnitude of the slope is specified in the Equation below:
T i = x j x k j k
where xk and xj are taken as datapoints k and j (j > k). Sen’s slope estimator is characterized as the median of the values of N from Ti, which is specified as:
Q i =   T N + 1 2 1 2 T N 2 + T N + 2 2
Negative and positive values of Qi signify downward (decreasing) and upward (increasing) trends, respectively.
The 12–month, 6–month, 3–month, and 1–month SPI were used to monitor a spatiotemporal drought event in the long term over North and West Africa. This period was sufficient for the assessment of drought intensity and frequency. The monthly SPI was calculated so that the reliability of the intensity of drought could be categorized following Table 1. González and Valdés [61] define a drought as a complex event, the treatment and dimension of which depend on its frequency, duration, and severity. To determine the probabilistic characteristic, we used the joint probability distribution function (JPDF) since drought duration and severity are frequently difficult to assess distinctly.
Assuming a set of interpretations yi…yn, Kim et al. [62] defined a mathematical expression of fSD as:
f SD s ,   d   = 1 nh s h d i = 1 n K S S i h s K d d i h d
Kim et al. [62] defined the drought joint return period (Tsd) as:
T sd = N n 1 f SD s ,   d
where N presents the numbers of years.

3. Results

3.1. Precipitation Anomaly and Precipitation Characteristics over North and West Africa from 1982 to 2018

Characterization of the mean monthly precipitation from 1982 to 2018 over the study area indicated great variability between two regions (Figure 2) [62]. In the North African region, the rainy season started from October to April with deficient rainfall [63,64,65], while in the southern regions of West Africa, there were two rainy seasons, one lasting from the end of April to mid-July, and another, shorter one in September and October. In the north, where there is less rainfall, there is only one rainy season, which lasts from July to September [66,67].
The precipitation anomalies in Figure 3 show positive and negative anomalies from 1982 to 2018 that occurred when the precipitation was below or above the normal conditions (representing dry and wet conditions, respectively) for the North and West African regions.
The 36 hydrological years presented in Table 2, from 1982 to 2018, reveal 13 dry years and 23 wet years. The years 2002–03, 2008–09, 2009–10, 2010–11, and 2016–17 were the driest, while 1994–95, 1995–96, 2003–04, 2014–15, and 2015–16 were the wettest.
The annual precipitation, SPI–12, and corresponding anomalies for dry and wet years revealed that dry and wet spells corresponded with negative and positive anomalies over the North and West African regions, respectively (Table 2). This revealed that the drought conditions occurred as a consequence of insufficient water in the ground. The magnitude of anomaly of the dry years was lower than that of the wet years. This knowledge is significant for future management and planning of water usage, specifically for agricultural practices.

3.2. Spatiotemporal Variation of SPI over North and West Africa from 1982 to 2018

The spatial patterns of SPI–12 for the hydrological years between 1982 and 2018 across North and West African regions are shown in Figure 4a–ak. Figure 4c,e,j,n,p,ab,ac,ad,aj shows wet conditions in the North African region coupled with dry conditions in the West African region while Figure 4d,f,o,q,r,s,y,ai registers wet conditions in the West African region coupled with dry conditions in the North African region. This implies that many areas registered a high SPI for several years and also registered a low SPI in other years. Therefore, drought occurrence is not restricted to one region, and the SPI over many regions of North and West Africa is changeable.
Figure 5 displays the SPI variation at different timescales of 1, 3, 6, and 12 months from 1982 to 2018. The results indicate that short timescales (i.e., 1 or 3 months) have higher temporal variability in wet and dry periods, while long timescales (12 months) have a lower frequency of wet and dry periods.

3.3. Drought Characteristics, JPDF, and Drought Return Years over North and West Africa

The drought intensity, duration, and magnitude were computed across North and West African regions (Table 3). The magnitude of drought was calculated as the cumulative SPI–12 for the dry hydrological years and considered as a positive value. Years with a high magnitude of drought were 2008–10, 2000–03, and 1984–87, with values of 5.361, 2.792, and 2.187, respectively; these droughts each had a duration of three years. The lowest magnitude of drought was observed in 1997–98, 1993–94, and 1991–92, with values corresponding to 0.113, 0.658, and 0.727, respectively; these droughts each had a duration of one year. The duration and magnitude of drought show that extreme droughts last for longer, and vice versa, in the study region.
Figure 6 displays the spatial pattern of the magnitude of drought for various hydrological years over North and West African regions. The results indicate that the magnitude of drought was higher during the hydrological years 2008–11, 1984–87, 2000–03, and 2016–17. In 2008–11, the regions that registered the highest drought magnitude covered Morocco and Algeria. In 1984–87, the drought magnitude was higher over Tunisia, Algeria, Morocco, Libya, Mauritania, Nigeria, and Sudan. In 2000–03, the drought magnitude was higher over Sudan, Nigeria, Niger, Cote d’Ivoire, and Liberia. In 2016–17, the drought magnitude was higher over Tunisia, Algeria, South Nigeria, Ghana, Cote d’Ivoire, and Liberia. These results show spatial variability in the drought magnitude over the study period across different parts of the two study regions.
Figure 7 displays the drought risk generated from the maps of SPI over North and West African regions during the selected dry years following the classification of McKee et al. [32]. The drought conditions can be characterized from extreme to moderate, with different magnitudes and durations. Meanwhile, the severity, duration, and magnitude of drought events changed from one region to another over the study period. The drought risk maps show that drought could persist in some regions after a period of wide extent, and that the regions to experience drought have differed over the years (see Figure 7a–m). In Figure 7l, extreme drought conditions can be seen in the Sub-Saharan regions, Morocco, and Algeria. In a different case, in Figure 7m, extreme drought conditions can be observed over Morocco, Nigeria, Benin, Ghana, Cote d’Ivoire, and Mauritania.
Since the drought duration and severity may have different distributions, the probability density function was calculated using the joint probability distribution function (JPDF) provided by Equation (9), and the joint return years were calculated using Equation (10). JPDF analysis is a multivariate method that may be used to manage water resources. The JPDF was calculated based on the drought magnitude and duration using the 12–month SPI (Figure 8). Figure 8 indicates that when drought severity is low and droughts occur at short intervals, the chance of drought occurrence is high. Severe drought also requires a certain number of years of duration to recur at such short intervals.
The drought severity, duration, and frequency curves for North and West Africa were generated after the JPDF for the bivariate return periods of the drought was computed (Figure 9). Figure 9 shows a bivariate study of drought severity for North and West Africa, including return periods and severity levels. Drought severity is determined by many drought drivers that exist in a given region. Drought severity describes the drought magnitude of dry events. Figure 9 shows the JPDF drought-based curves created for specified recurrence severity levels of one, two, three, four, and five years. It can be noted that for a short drought duration lasting from one to two years, severe drought conditions have greater drought return periods, of between 10 and 20 years. Moreover, a drought lasting for three years with a severity from three to five can return in between 20 and 30 years.
Table A1, Table A2, Table A3 and Table A4 (Appendix A) displays the occurrence of drought over North and West African regions. The results indicate that drought is a complex phenomenon and the drivers are enormously influenced by the conditions of the local environment of a specific region. Dry periods are related to low rainfall values closely corresponding to the values of SPI and to negative precipitation anomalies.
Spatial and temporal variability of drought trends can be observed in the study area and are shown in Table 4 as the positive and negative trends of SPI at various timescales over North and West African countries. The tested models of SPI indicated that SPI–12, SPI–3, and SPI–1 showed significant trend values in Algeria, Tunisia, Mali, and Cote d’Ivoire, with Sen’s slope (Kendall’s tau) values of 0.021 (0.156), 0.009 (0.127), and 0.006 (0.102); 0.007 (0.054), 0.007 (0.127), and 0.006 (0.187); 0.013 (0.095), 0.012 (0.159), and 0.009 (0.235); and 0.010 (0.076), 0.008 (0.105), and 0.009 (0.130), respectively. Also, the tested models of SPI indicated that SPI–12 showed a significant trend in Burkina Faso and Niger, with Sen’s slope (Kendall’s tau) values of 0.008 (0.070) and 0.007 (0.048), respectively. Tan et al. [68] mentioned that SPI–12 demonstrated year-round water deficiency, whereas SPI–1, SPI–3, and SPI–6 were suitable indicators of the state of seasonal water deficiency affected by drought.
Table 5 illustrates positive and negative precipitation trends across North and West African countries. The tested models of precipitation showed significant trends in Algeria, Tunisia, Mali, Sudan, Burkina Faso, and Cote d’Ivoire with Sen’s slope (Kendall’s tau) values of 1.1375 (0.156), 0.637 (0.054), 1.352 (0.124), 0.087 (0.019), 0.619 (0.048), and 1.73 (0.07), respectively.

3.4. ENSO-Drought Relationship

3.4.1. Mediterranean Oscillation Index (MOI)

The MOI was determined by Palutikof et al. [69] and Conte et al. [70] as the difference of normalized pressure between Algiers (36.4°N, 3.1°E) and Cairo (30.1°N, 31.4°E). Daily records of this index were obtained from the Climate Research Unit (University of East Anglia) from 1982 to 2018, and monthly and annual means were collated by averaging daily values. In this work, we chose neutral, La Niña, and El Niño conditions based on the Mediterranean oscillation (MOI) for the Mediterranean regions (Figure 10). We considered La Niña (El Niño) as a period with a MOI below (above) −0.5 °C (+0.5 °C) and neutral as −0.5 < MOI < +0.5. Figure 10 shows La Niña as lasting from October to February and El Niño from June until August in many years.
The 1–12 month SPI values for the yearly MOI showed only neutral years over the study period (Figure 11). The results displayed in Figure 11 show that for the SPI at different timescales, the mean magnitude was very similar and the mean duration was between two and five years.

3.4.2. North Atlantic Oscillation Index (NAOI)

The NAOI was determined by Jones et al. [71] as the difference of the normalized sea level pressure between Southwest Iceland and Gibraltar. This index’s monthly and yearly records were obtained from the Climate Research Unit (University of East Anglia) from 1982 to 2018. We selected neutral, La Niña, and El Niño conditions based on the North Atlantic Oscillation Index (NAOI) in this work. We considered La Niña (El Niño) as a period with a NAOI below (above) −0.5 °C (+0.5 °C) and neutral as −0.5 < NAOI < +0.5 (Figure 12).
Figure 12 displays La Niña, El Niño, and neutral conditions for different months during 1982–2018. The most noticeable La Niña years were in 2002–03 from September to December, with −3.58, −1.5, −0.55, and −0.98 monthly NAOI values, and in 2010–11 from September to January, with −2.01, −2.41, −3.34, −4.61, and −1.38. Moreover, the most noticeable El Niño years were observed in 1991–92 from November to May with monthly NAOI values of 1.86, 1.24, 0.64, 3.18, 1.66, 1.32, and 0.79, in 2014–15 from December to May with 1.89, 2.81, 1.47, 1.99, 1.03, and 2.09, and in 2015–16 from November to February with 3.54, 4.22, 1.17, and 1.61.
The 1–12 month SPI values for the yearly NAOI revealed La Niña, El Niño, and neutral years from 1982 to 2018 (Figure 13). The results displayed in Figure 13 show that in (A) neutral years, the mean magnitude was very similar for SPI–1, SPI–3, SPI–6, and SPI–12, with a value of 0.2, and the mean duration was similar for SPI–3, SPI–6, and SPI–12, with a value of 2, while for SPI–1 it presented a value of 4. For (B) La Niña years, the results show that the mean magnitude for SPI–1, SPI–3, and SPI–6 was similar (between 0.6 and 0.8), and for SPI–12 it presented a value of 1.4. The mean duration was very similar for SPI–1, SPI–3, and SPI–6 at around 1, and for SPI–12 it was 1.4. For (C) El Niño years, the result display that for SPI–3, SPI–6, and SPI–12 the mean magnitude was between 0.5 and 1, with the mean duration very similar for SPI–3, SPI–6, and SPI–12 at around 1.

3.4.3. Southern Oscillation Index (SOI)

The Southern Oscillation Index (SOI) was defined by Ropelewski and Jones [72] as the difference of normalized pressure between Darwin and Tahiti. This index’s monthly and yearly records were obtained from the Climate Research Unit (University of East Anglia) from 1982 to 2018. We chose neutral, La Niña, and El Niño conditions based on the SOI in this work. We considered La Niña (El Niño) as a period with a SOI below (above) −0.5 °C (+0.5 °C) and the condition to be neutral at −0.5 < SOI < +0.5 (Figure 14).
Figure 14 shows La Niña, El Niño, and neutral conditions for various months during 1982–2018. The most noticeable La Niña years were in 1986–87 from November to August, in 1991–92 and 1997–98 from September to April, in 2002–03 from September to March, and in 2009–10 from October to March. Furthermore, the most visible El Niño years were observed in 1998–99 from September to April, in 2000–01 from September to February, and in 2007–08 from November to April.
Figure 15 displays the 1–12 month SPI values for yearly SOI, showing La Niña, El Niño, and neutral years from 1982 to 2018. The results revealed that during (A) neutral, (B) La Niña, and (C) El Niño years, the mean magnitude and mean duration were very similar for SPIs at various timescales.

4. Discussion

The most widely used drought indicator is the actual precipitation, represented as a percentage variation from normal (or long-term average), although it has limited use/reliability for regional comparison due to its reliance on the mean [73]. According to Ye et al. [74], the SPI reflects a deviation from the mean and is thus expressed as a normalized index in time and space in standard deviation units. The deviation from the mean is a probabilistic indicator of the severity of the wetness or drought that may be used to estimate risk. Given that the SPI is a statistical approach, it was preferable to use data from as far back as 1982 in this study. Long records provide more trustworthy statistics for the SPI. As a result of the availability of such data records, the SPI has gained traction as a potential drought indicator in recent years, allowing for comparisons across different precipitation zones [73,74].
The results of this study revealed that extremely low or extremely high precipitation was linked with extremely low or extremely high SPI values. When the precipitation was very low or very high, SPI readings accurately predicted the dryness or wetness. 
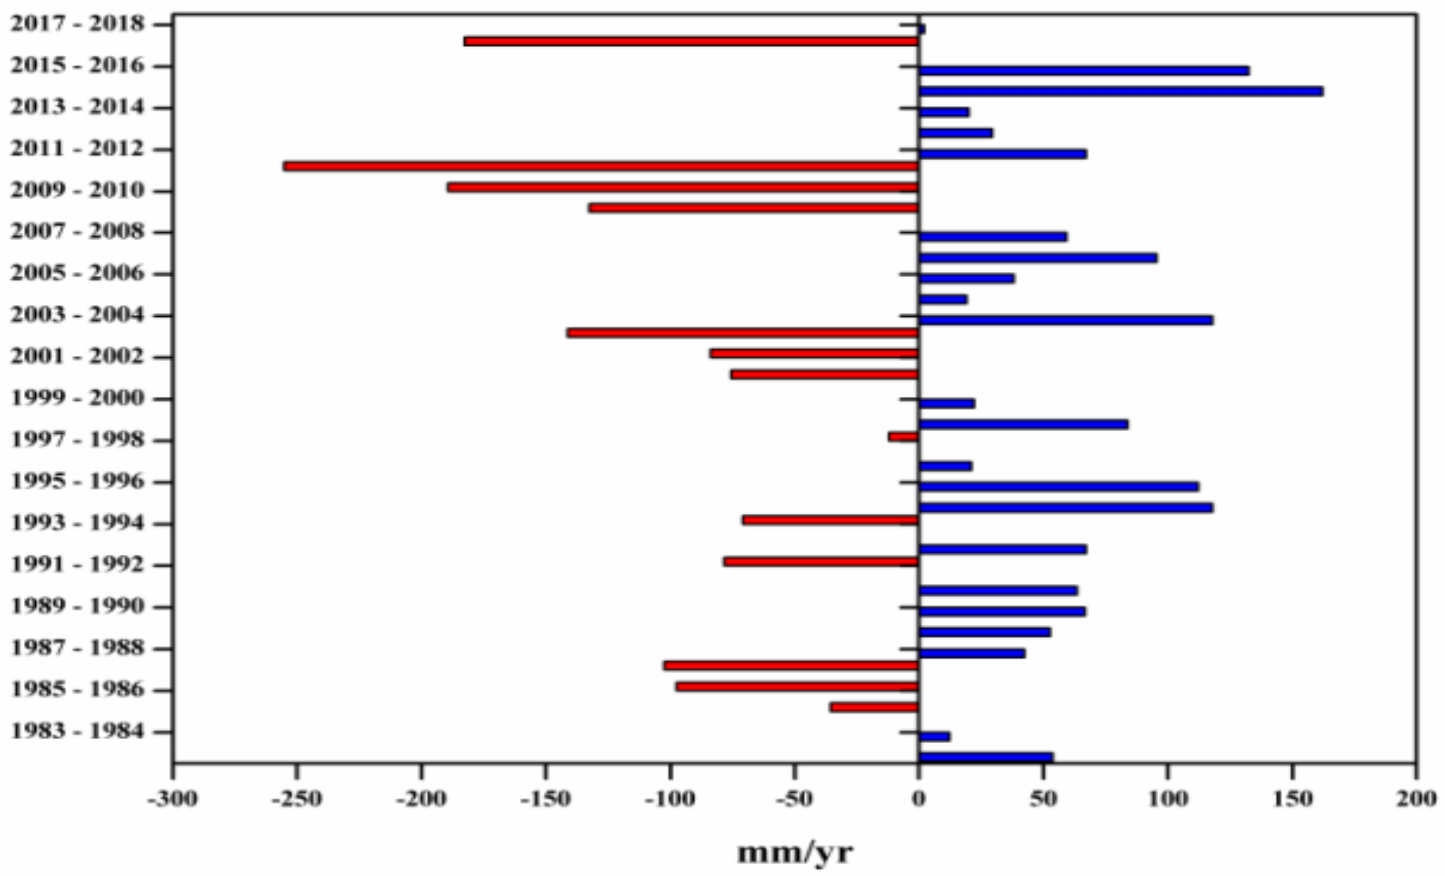
Table 2 demonstrates that all periods with dry spells had low/negative anomaly and SPI values, with the driest being 2010–2011 (2.37) followed by 2009–2010 (1.76). Similarly, wet spell periods showed positive anomaly and SPI values, with the wettest periods being 2014–2015 (1.51) and 2015–2016 (1.23). The findings of this investigation are consistent with the SPI classifications of McKee et al. [32]. Our results are also consistent with Henchiri et al. [11], who evaluated the spatiotemporal patterns of drought and its impact on vegetation in North and West Africa, finding that 2002, 2009, 2010, and 2016 were the driest years, and 2014 and 2015 were the wettest years. Furthermore, Ghoneim et al. [
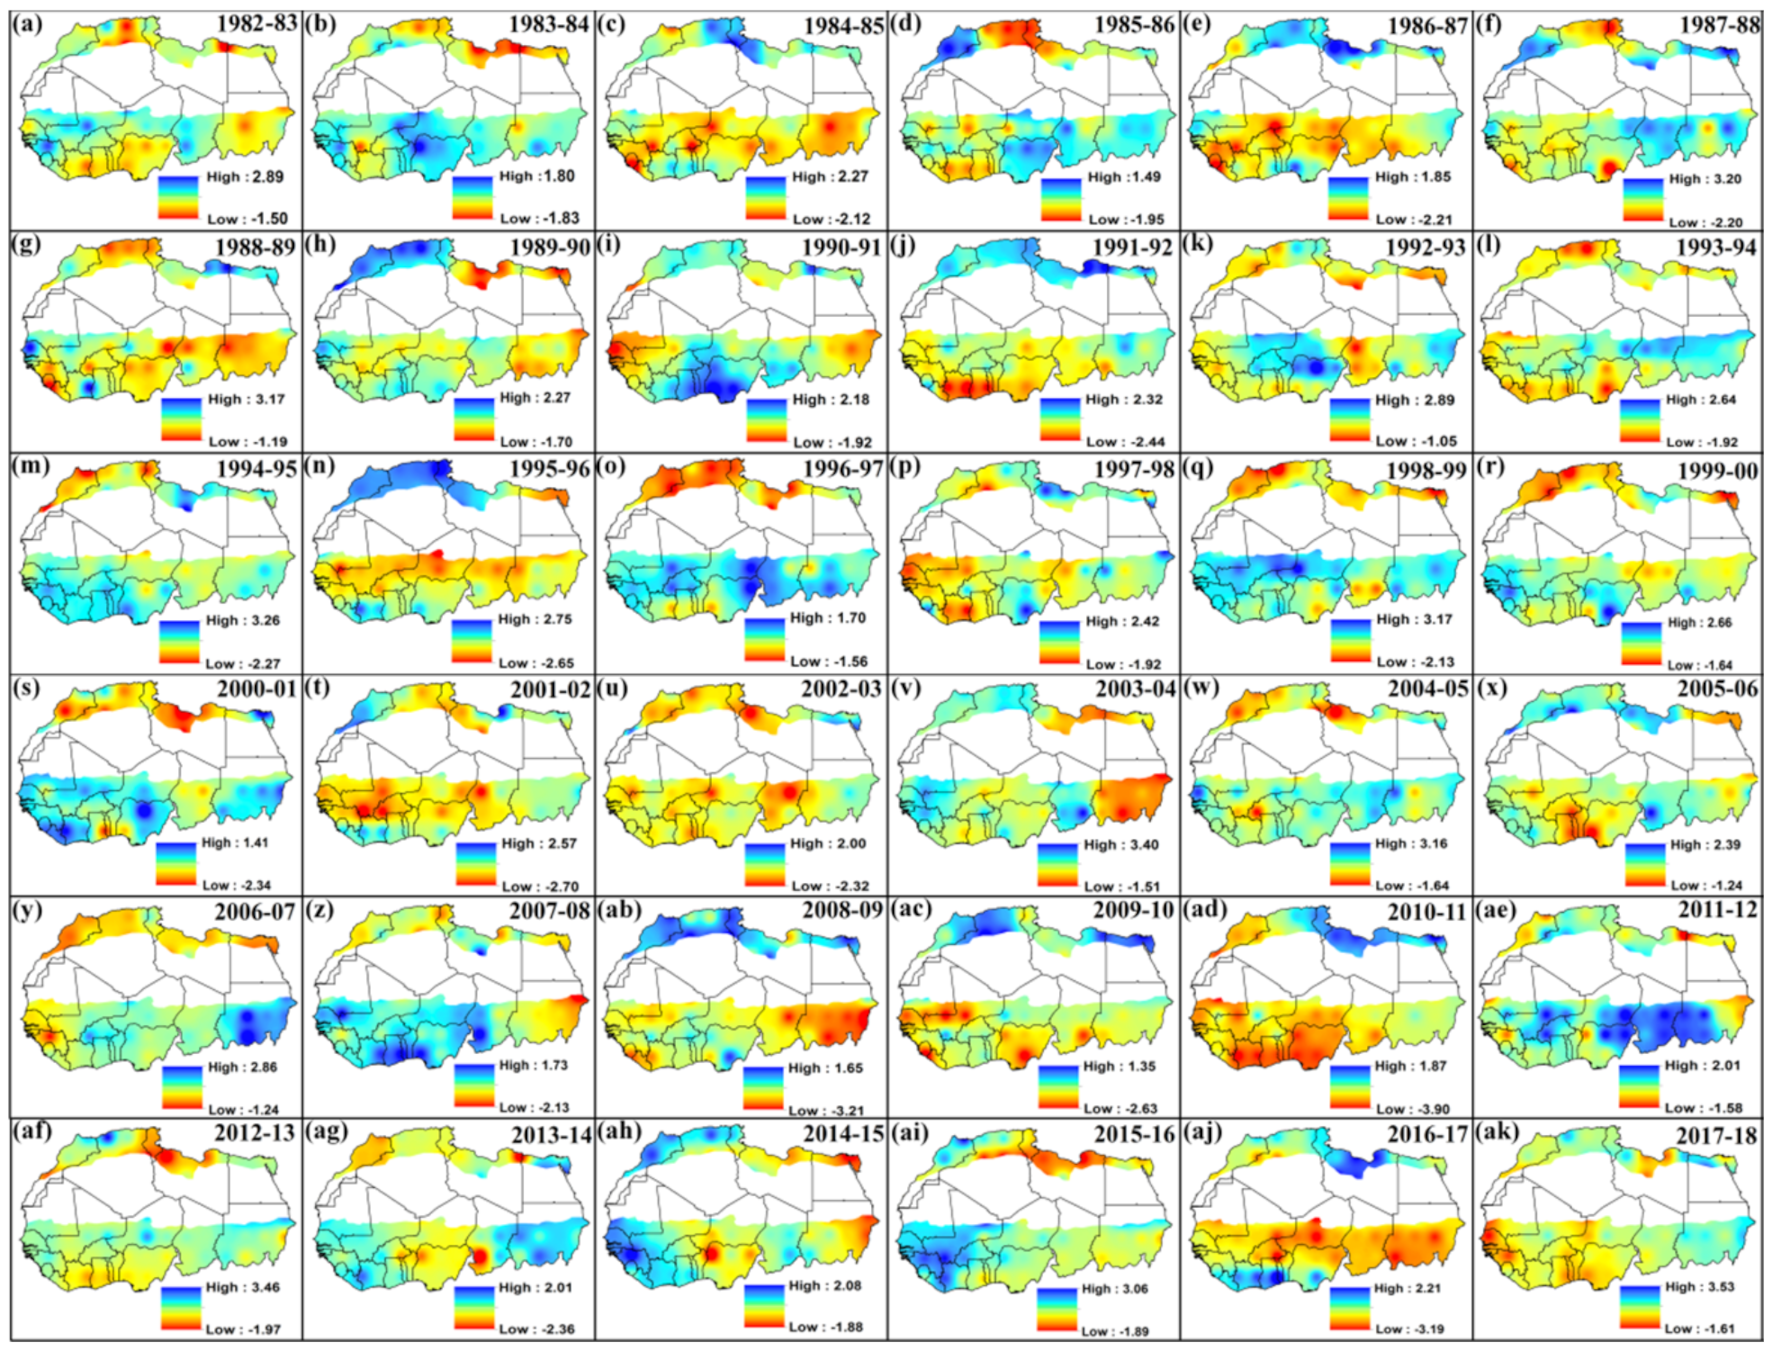
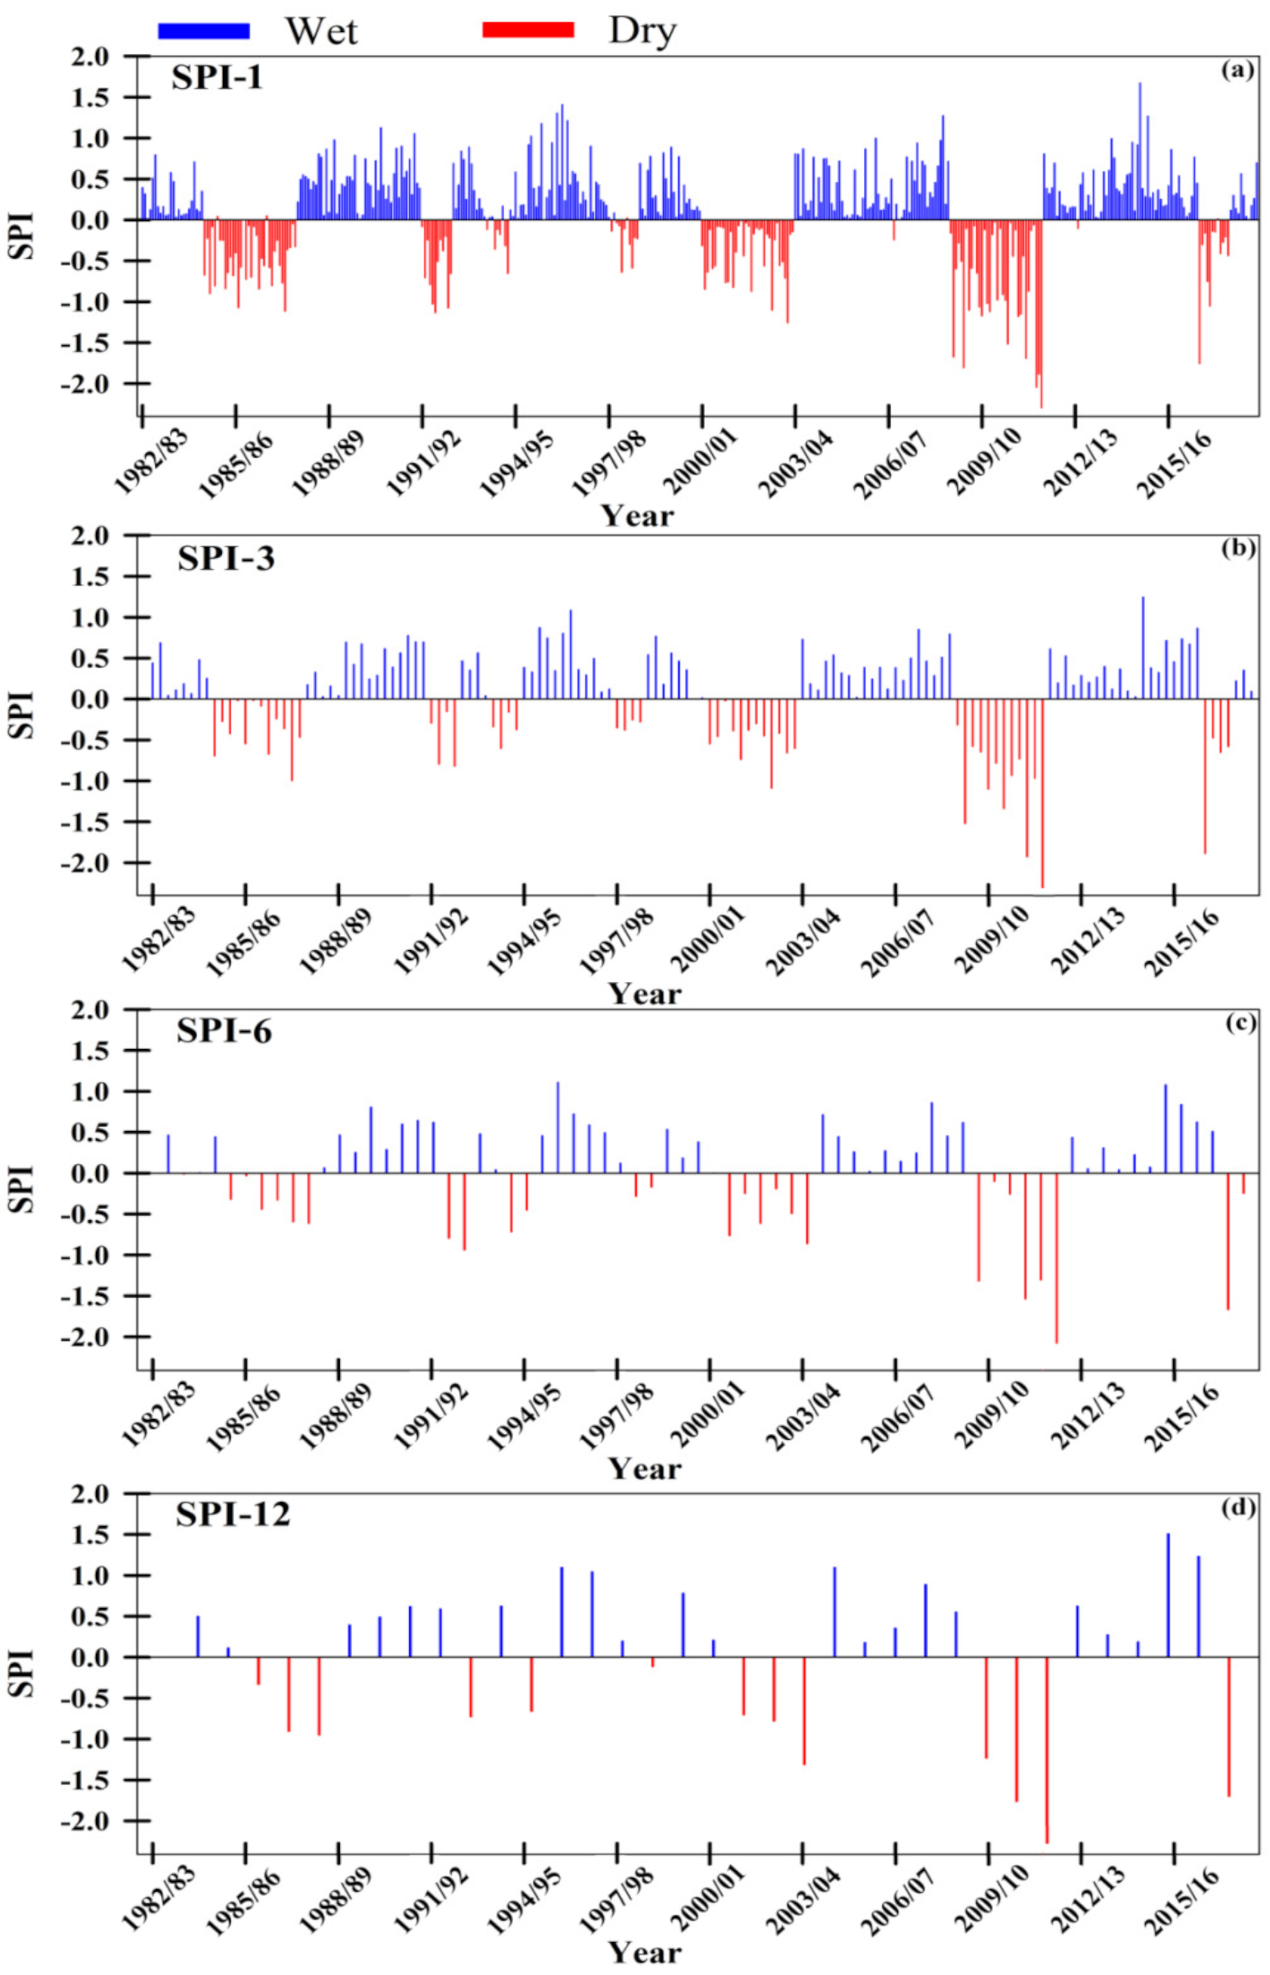
75] analyzed vegetation drought in North Africa (Tunisia) and identified 2002 as the driest year. Moreover, SPI analysis at 1, 3, 6, and 12–month timescales showed that shorter timescales have large temporal variability in dry and wet periods, but longer timescales (12 months) have a much lower frequency of dry and wet periods (Figure 4). Furthermore, drought characteristic analysis showed that years of higher drought magnitude increased when the duration of drought was longer, and vice versa (see Table 3 and 
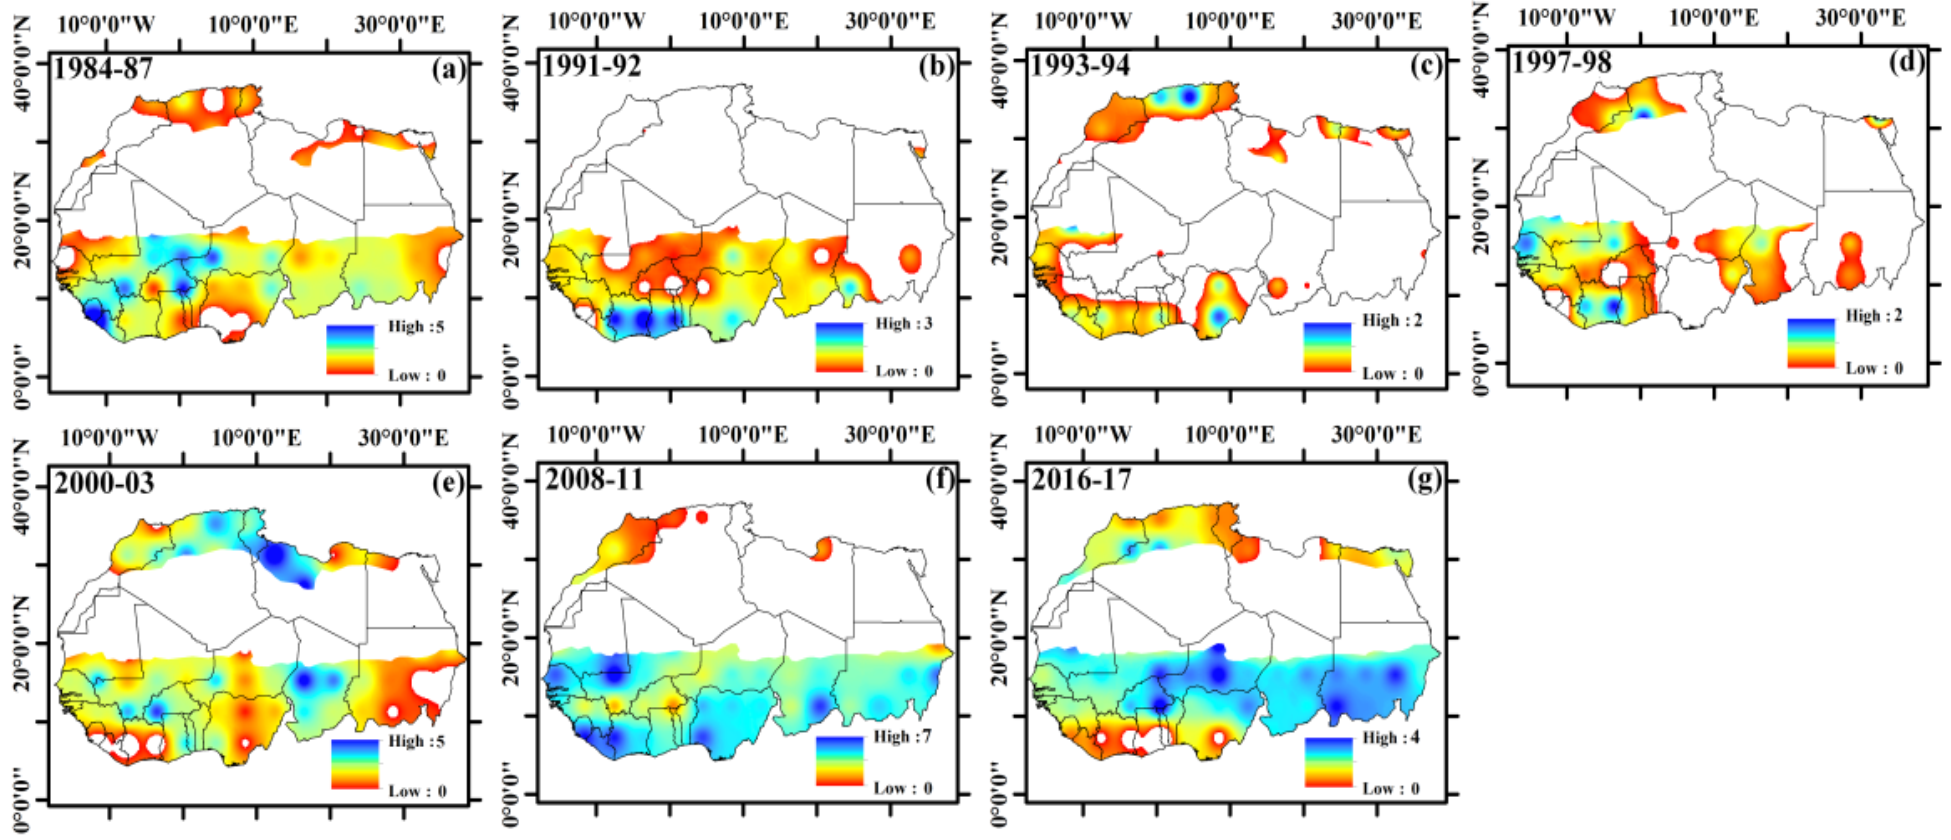
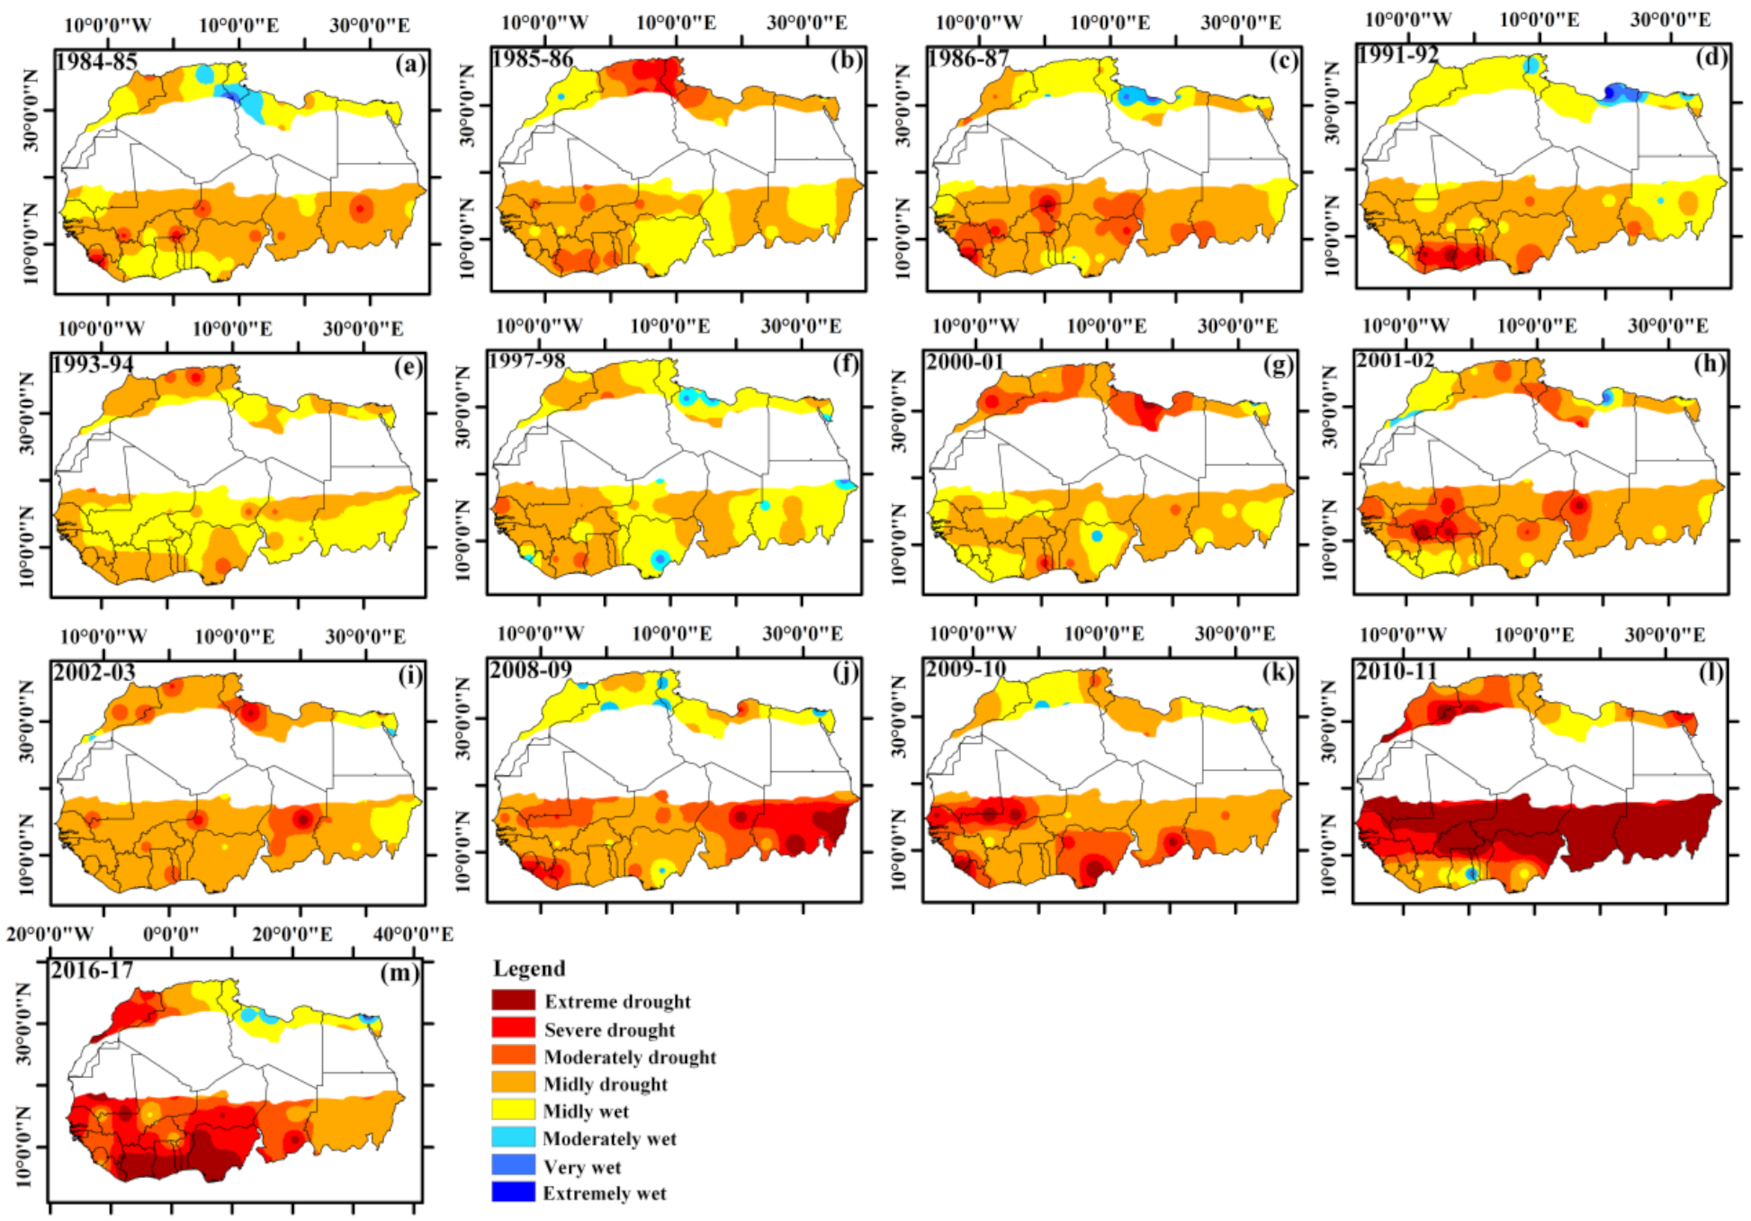
Figure 6). Also, the severity of drought might differ in a specific region in different years (see Figure 7), which confirms the findings of the study of Orimoloye et al. [
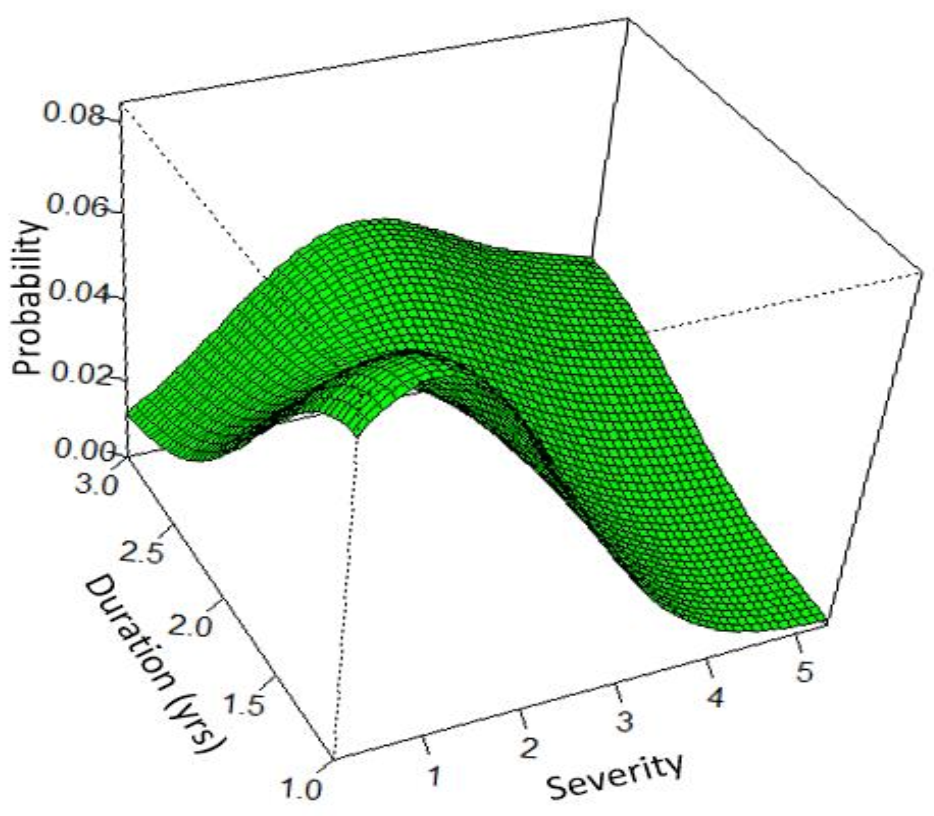
14]. They mentioned that the Sahel experiences severe drought conditions with a significantly greater water deficiency than elsewhere, especially during the late dry seasons. The period of 2001 to 2019, during late dry seasons, showed severe to extreme drought conditions, while the region observed mild droughts, such as in 2001 and 2003–2018, where the region observed no to moderate drought events during the wet seasons. Additionally, numerous studies over arid regions, such as those of Kim et al. [62], Kalisa et al. [57], and Mesbahzadeh et al. [
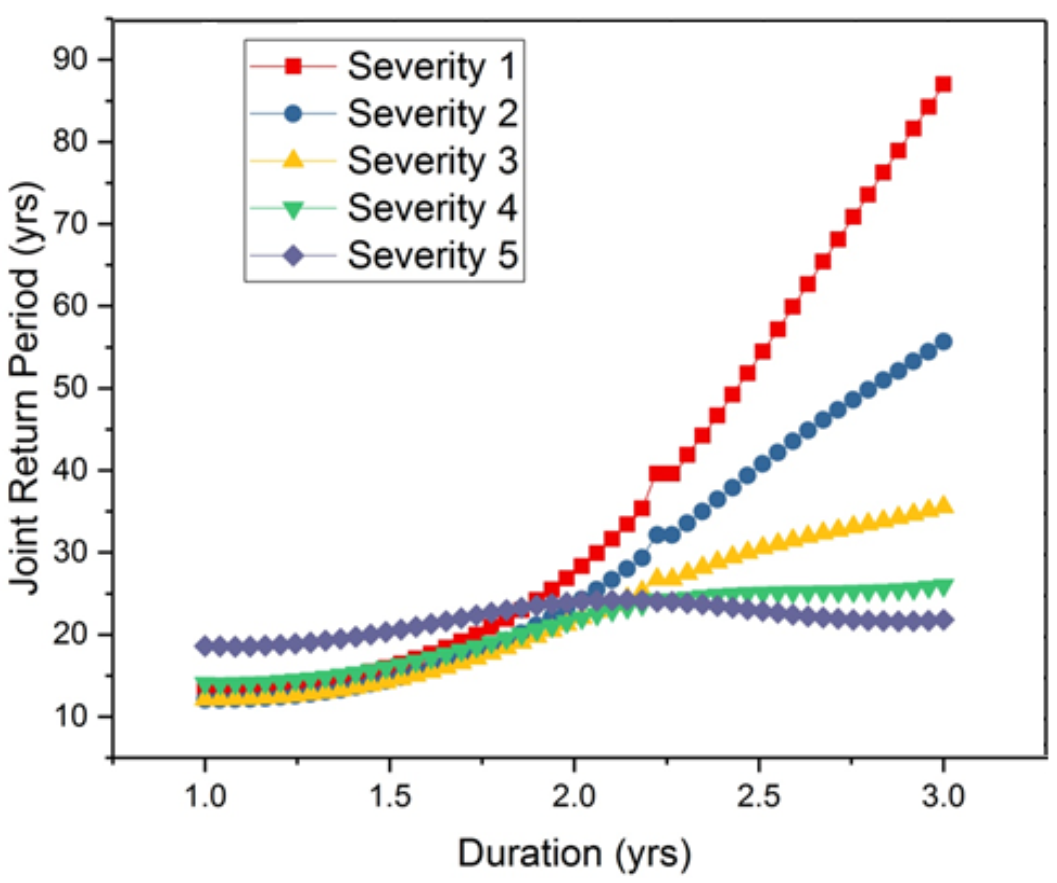
76], have mentioned that the likelihood of drought is higher when the severity is lower, and that such a drought happens at a short timescale. Simultaneously, severe drought conditions take many years to repeat themselves, as was confirmed by the results of the JPDF and joint return years analysis in our study (see Figure 8 and Figure 9).
The findings of this study show that drought characteristics analysis (magnitude, intensity, and duration) using SPI can be applied to accurately measure the drought intensity in regions like North and West Africa, where drought sensitivity and low precipitation are common.
The SPI–12 and precipitation anomalies (Appendix A, Table A1, Table A2, Table A3 and Table A4), the Mann-Kendall trend and significance level of 1–12-month SPI (Table 4), and the Mann-Kendall trend and significance level of precipitation (Table 5) demonstrate varied findings, both spatially and temporally, over North and West African countries. For example, a country may have the same drought level (SPI), but the precipitation anomaly values may differ (Appendix A, Table A1, Table A2, Table A3 and Table A4). The drought of 2010–11 was worst in countries like Mauritania, Senegal, Mali, Niger, Sudan, Guinea, Burkina Faso, and Chad. From 2002–03, Algeria, Tunisia, Morocco, and Libya experienced severe drought conditions. Also, from 2000–01, Morocco and Libya experienced severe drought episodes (Appendix A, Table A1, Table A2, Table A3 and Table A4). Table 4 reveals that out of 17 countries, the tested models of SPI indicated that SPI–12, SPI–3, and SPI–1showed significant trends in Algeria, Tunisia, Mali, and Cote d’Ivoire with Sen’s slope (Kendall’s tau) values of 0.021 (0.156), 0.009 (0.127), and 0.006 (0.102); 0.007 (0.054), 0.007 (0.127), and 0.006 (0.187); 0.013 (0.095), 0.012 (0.159), and 0.009 (0.235); and 0.010 (0.076), 0.008 (0.105), and 0.009 (0.130), respectively. Also, the tested models of SPI indicated that SPI–12 showed significant trends in Burkina Faso and Niger with Sen’s slope (Kendall’s tau) values of 0.008 (0.070) and 0.007 (0.048), respectively. The results in Table 5 illustrate positive and negative precipitation trends across North and West African countries. The tested models of precipitation showed significant trends in Algeria, Tunisia, Mali, Sudan, Burkina Faso, and Cote d’Ivoire with Sen’s slope (Kendall’s tau) values of 1.1375 (0.156), 0.637 (0.054), 1.352 (0.124), 0.087 (0.019), 0.619 (0.048), and 1.73 (0.07), respectively. Furthermore, Table 5 shows that most countries suffered oscillations between dry and wet conditions, with a few countries becoming increasingly wet and others becoming increasingly dry. There was no discernible trend in precipitation at a regional scale. During the research period, there was no substantial change in the annual rainy season’s precipitation. We used SPI to study precipitation, to address potential changes in precipitation extremes, because there was no yearly trend in precipitation amount.
Due to the diverse plant varieties over the study area, which have variable water storage capabilities, a temporal lag was expected [77]. The humid areas of various ports of West Africa (with mostly dense forests), as stated by Henchiri et al. [11], are projected to have the largest time lag. This is because, according to McDowell et al. [78], forests have the greatest capacity for water retention, with deeper roots to tap groundwater. Arid and semi-arid regions such as Sudan, Chad, Mali, Niger, Mauritania, Libya, Algeria, and Egypt, on the other hand, are primarily covered by grasslands and have a shorter time lag due to grasslands’ lower water retention capacity. The north parts of Algeria, Tunisia, Morocco, Libya, and Egypt are sub-humid areas covered by croplands. Croplands’ water storage capacity is estimated to be comparable to, if not lower than, that of grasslands. Moreover, artificial irrigation, according to Grünzweig et al. [79], might change the time lag for irrigated agricultural zones. As a result, semi-arid areas are likely to have a temporal lag equivalent to or longer than dry areas [80]. This pattern closely resembles the study’s findings, as illustrated in Appendix A Table A1, Table A2, Table A3 and Table A4, Table 5, and Figure 4, Figure 6 and Figure 7.
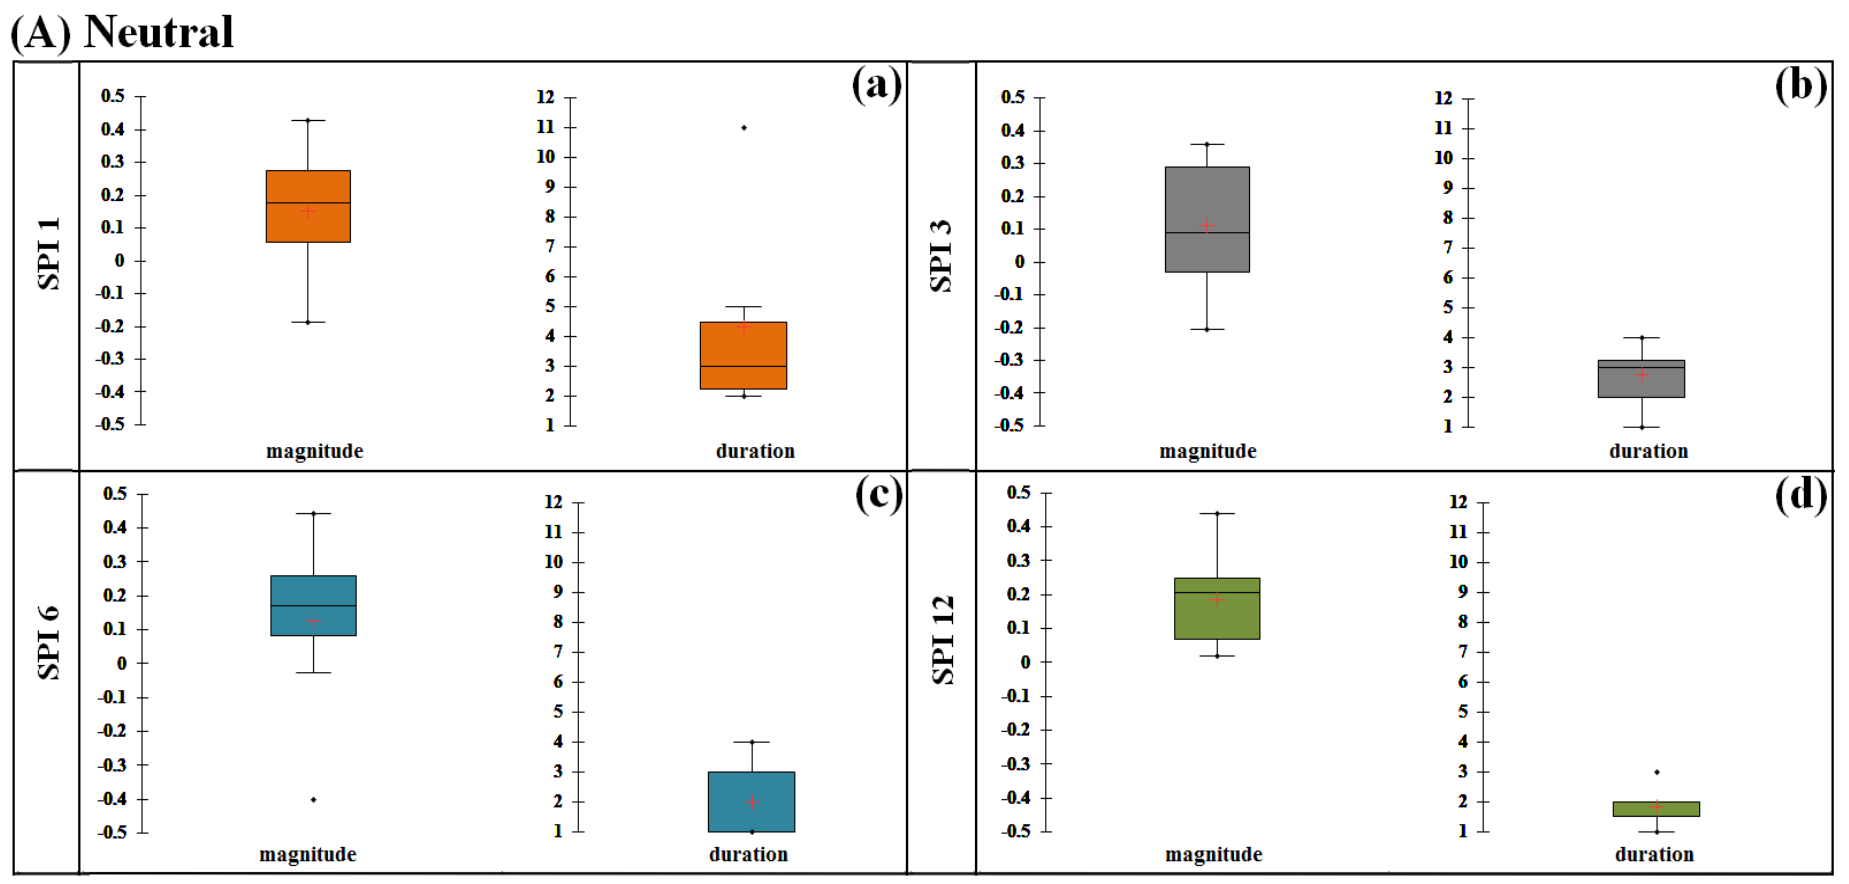
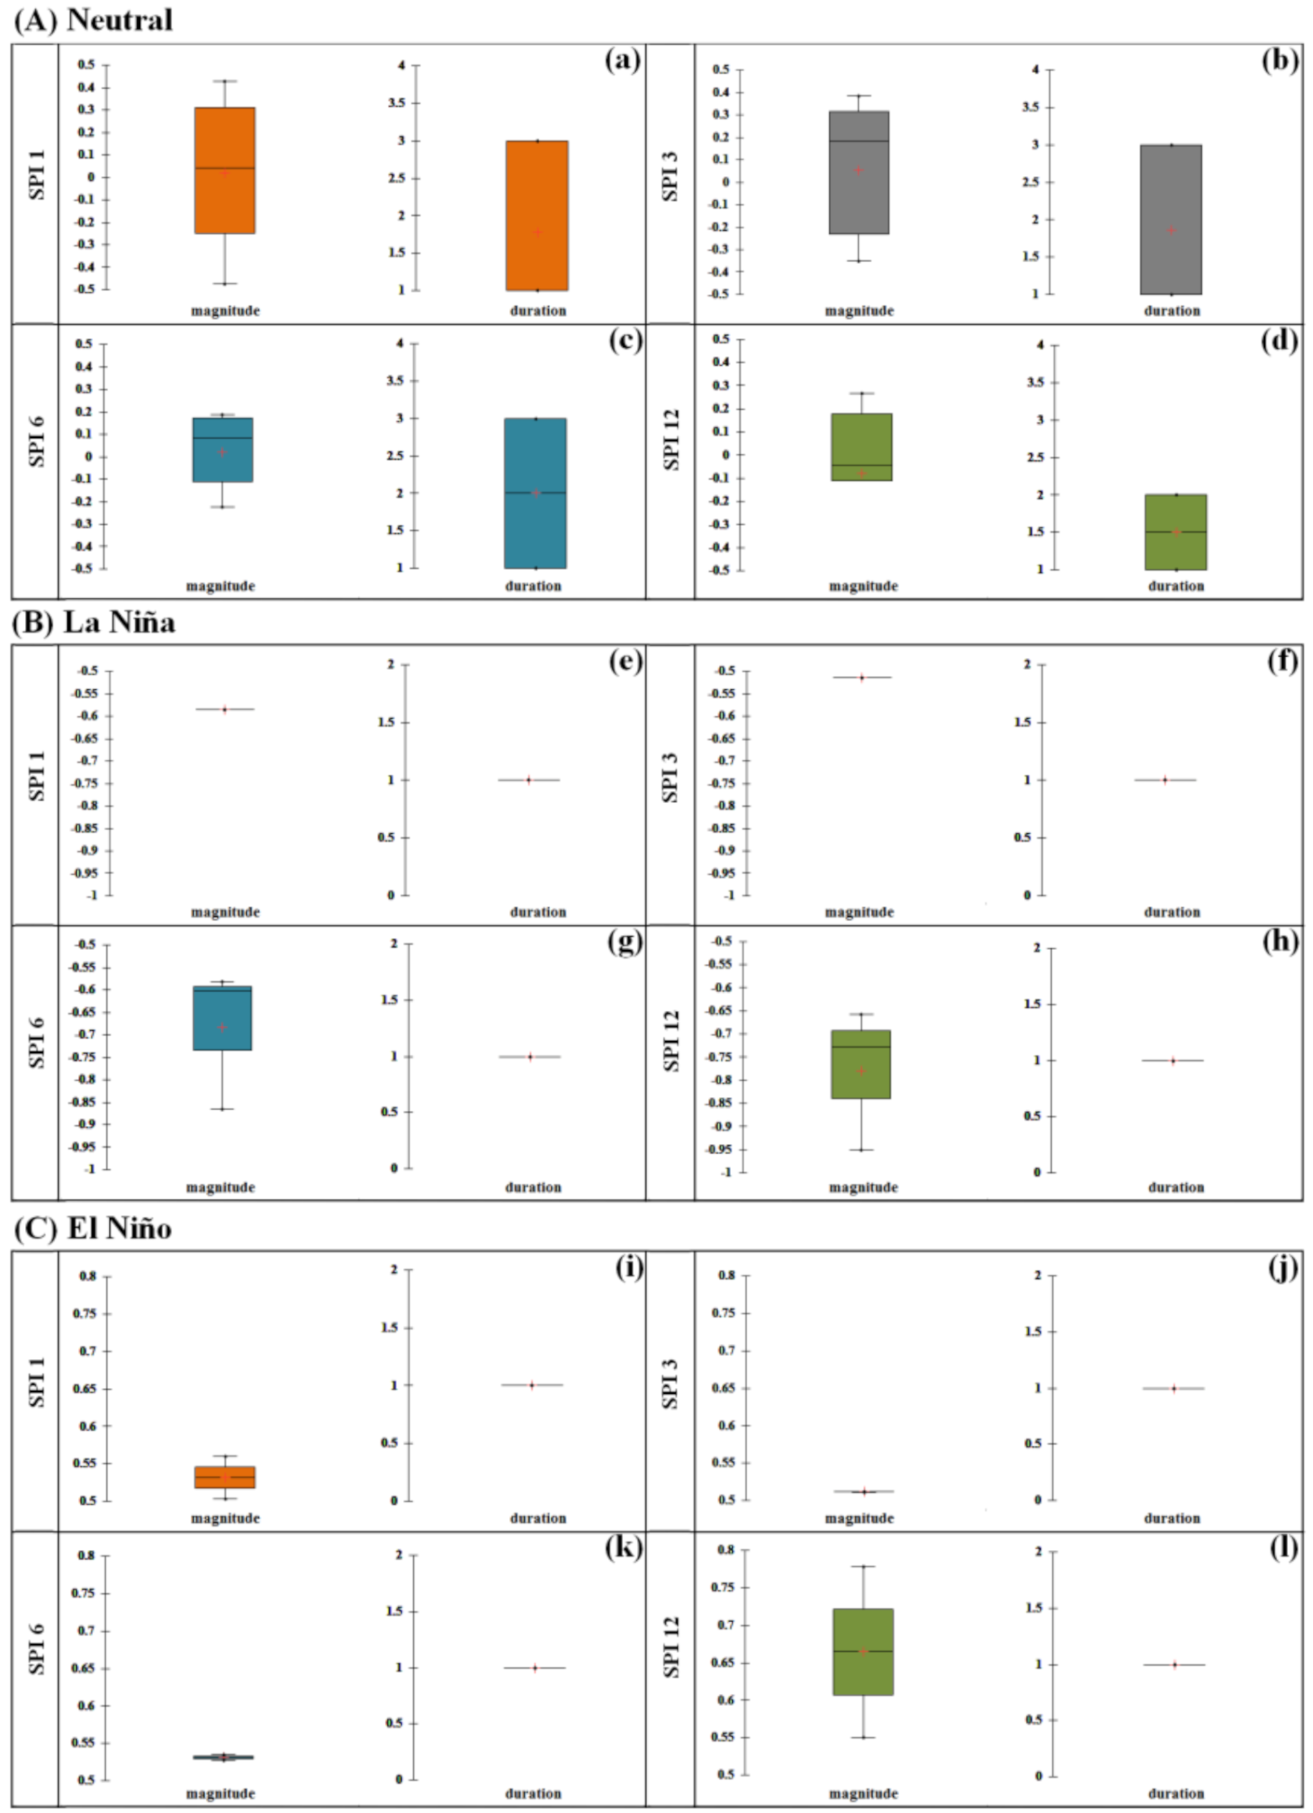
In terms of the ENSO-drought relationship over the study region, we sought to better understand the mechanism that drives drought and predict its variability, to enhance early warning and disaster risk management. We used the MOI, NAOI, and SOI, which displayed the La Niña, El Niño, and neutral conditions for various months of 1982–2018. For the MOI, La Niña was noted from November to February, and El Niño was detected from June to August in some years. The mean magnitude of SPI at different time scales was very similar during the neutral years for MOI, and the mean duration was between two and five years.
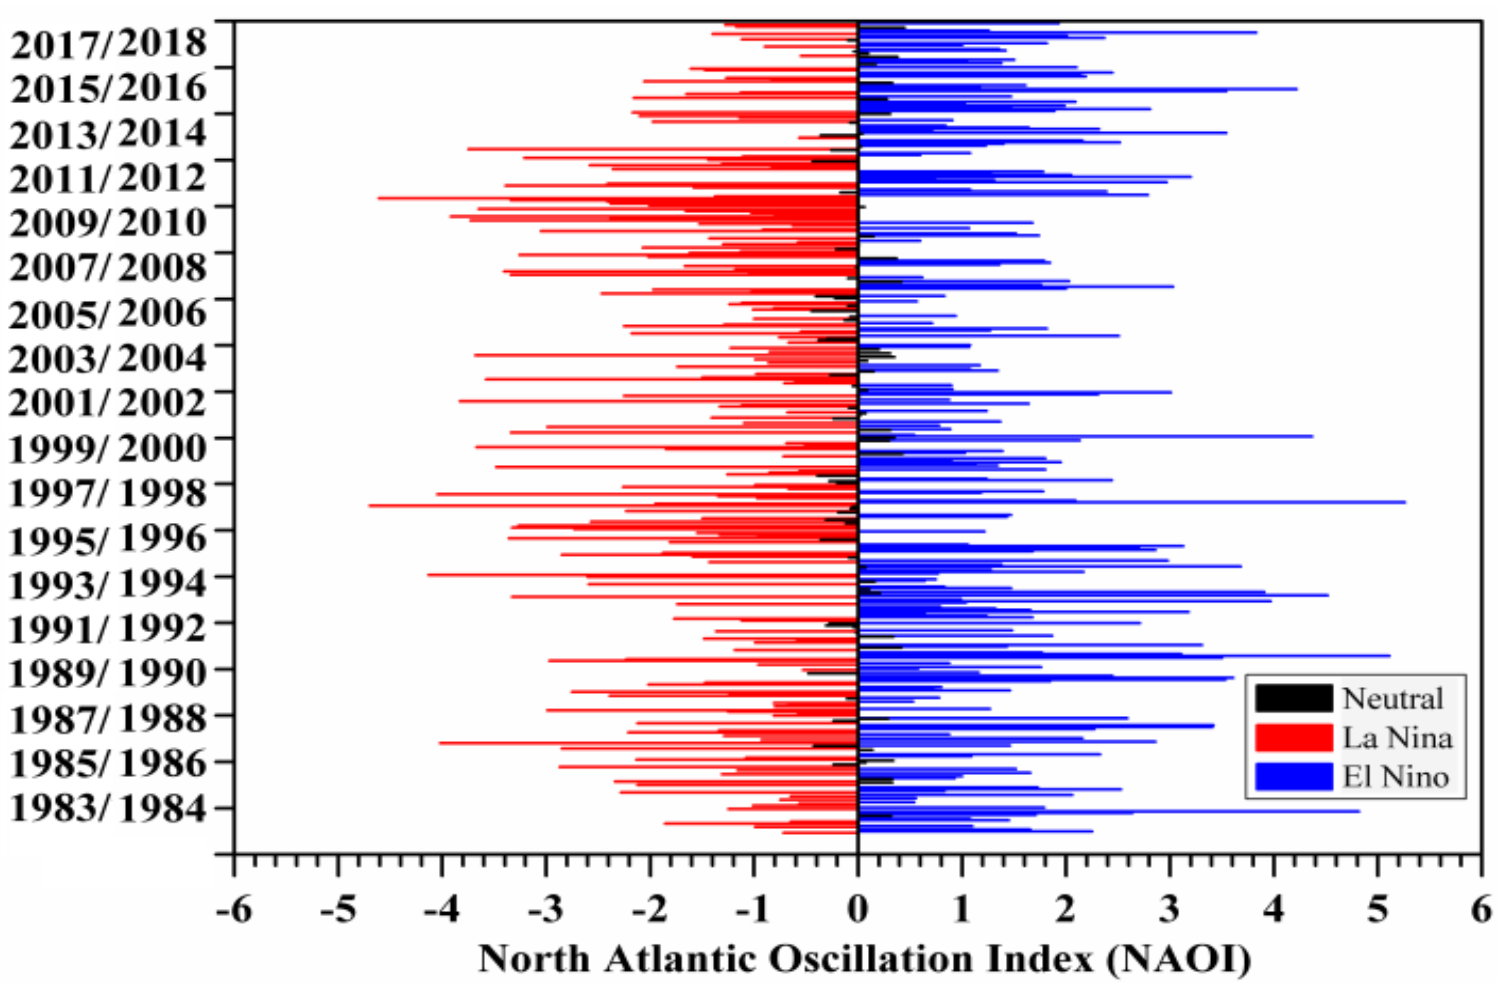
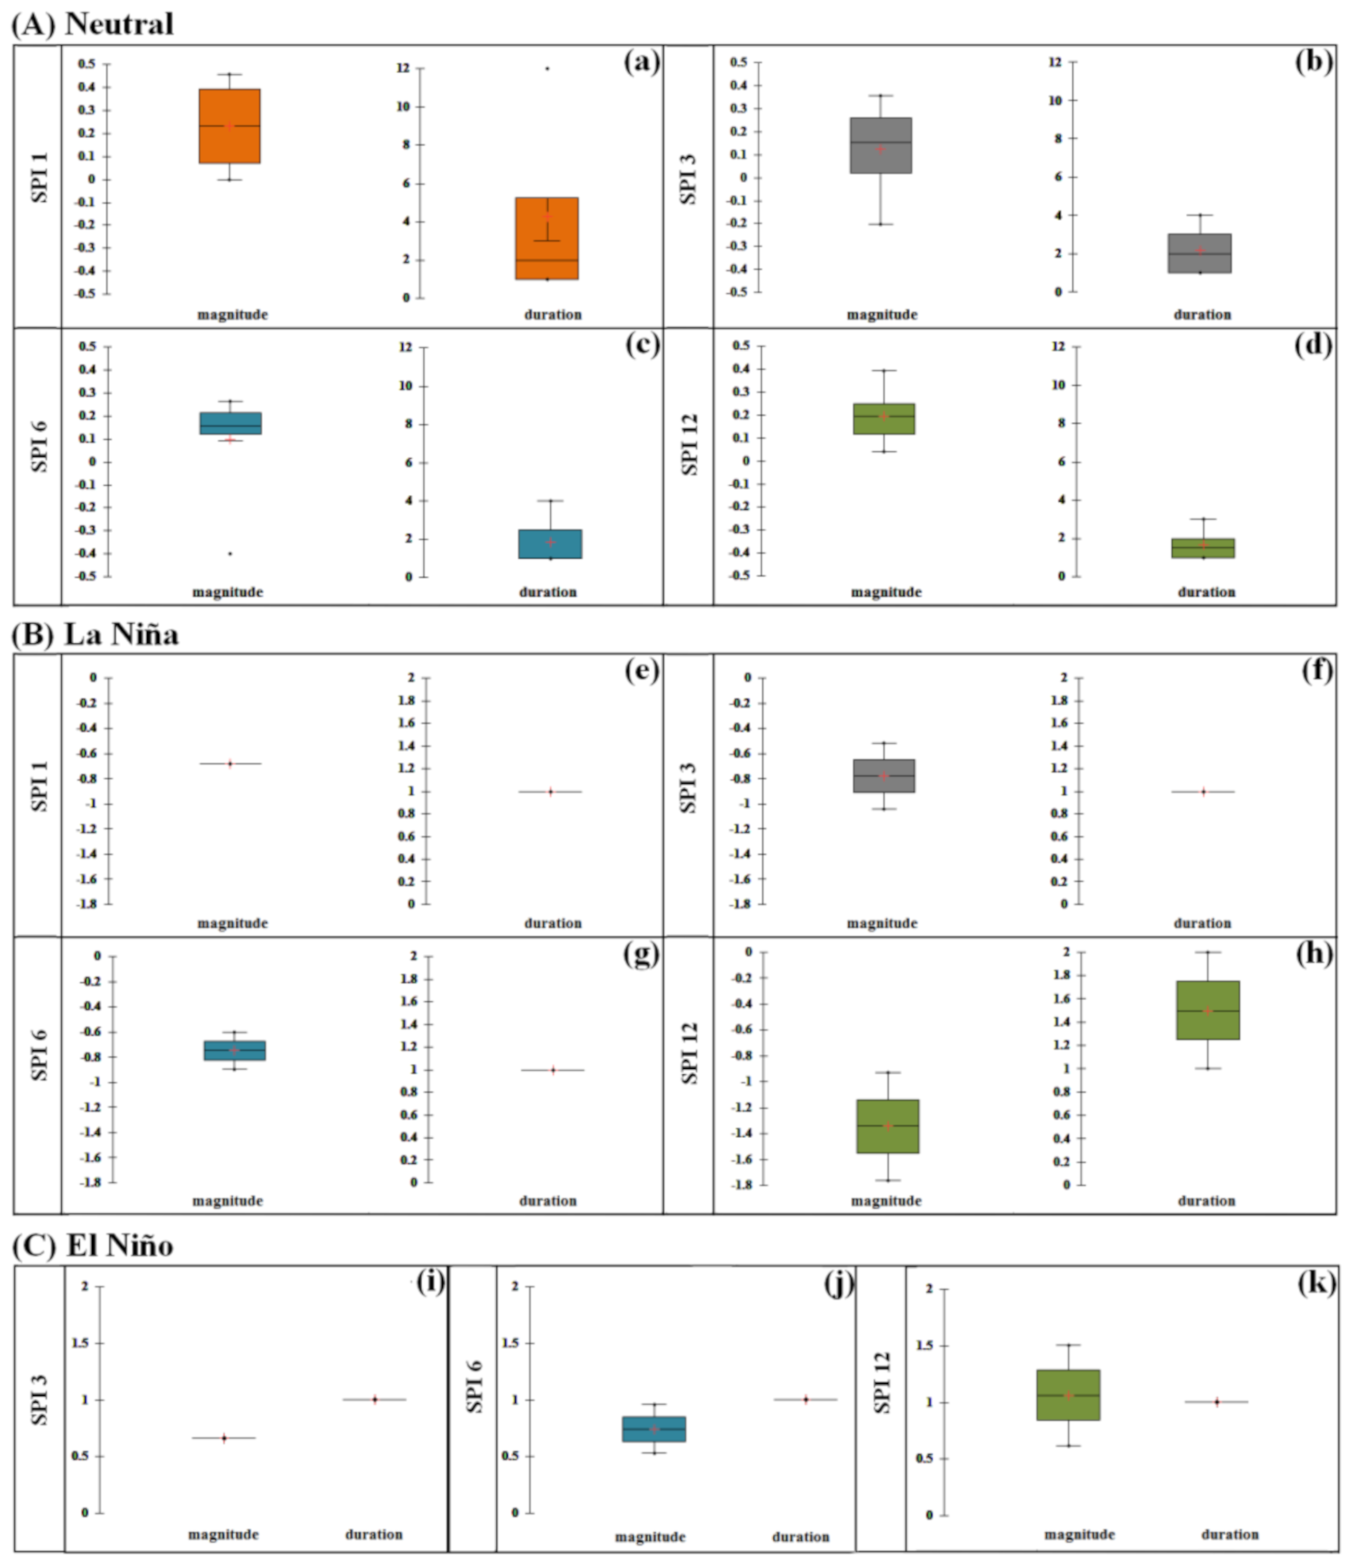
For the NAOI, the most noticeable La Niña years were 2002–03 and 2010–11, and for El Niño, 1991–92, 2014–15, and 2015–16 during autumn (SON) and winter (DJF), a period that concurs with the increased precipitation in northern regions. For NAOI during the neutral years, the mean magnitude was very similar for SPI at 1–12 months’ timescale, and the mean duration was similar for SPI–12, SPI–6, and SPI–3. For La Niña years, the mean magnitude and mean duration for SPI–1, SPI–3, and SPI–6 were similar, and in El Niño years, the mean magnitude and mean duration were similar for SPI–12, SPI–6, and SPI–3. These results with the spatial pattern of SPI–12 revealed that drought conditions could occur during La Niña years and wet conditions during El Niño years in many regions affected by the NAOI like Morocco, Algeria, and the sub-Saharan countries (Figure 4, Figure 12 and Figure 13). This result clarifies that there is a direct connection between drought and the NAOI over these countries, which is in agreement with the work of Hurrell [81] and Osborn et al. [82], who mentioned that the North Atlantic Oscillation (NAO) is one of the main modes of variability of the northern hemisphere’s atmosphere. The NAO is especially important in winter when it exerts robust control over the northern hemisphere’s climate. Osborn [83] also reported that this season could be subject to intense interdecadal variability; in winter, the difference of the normalized sea level pressure between Southwest Iceland and Gibraltar is a useful index of the strength of the NAOI. Furthermore, Mariotti et al. [84,85] found that averaged rainfall over the western Mediterranean is significantly correlated with ENSO variability in autumn, with the trend opposite to that found in spring.
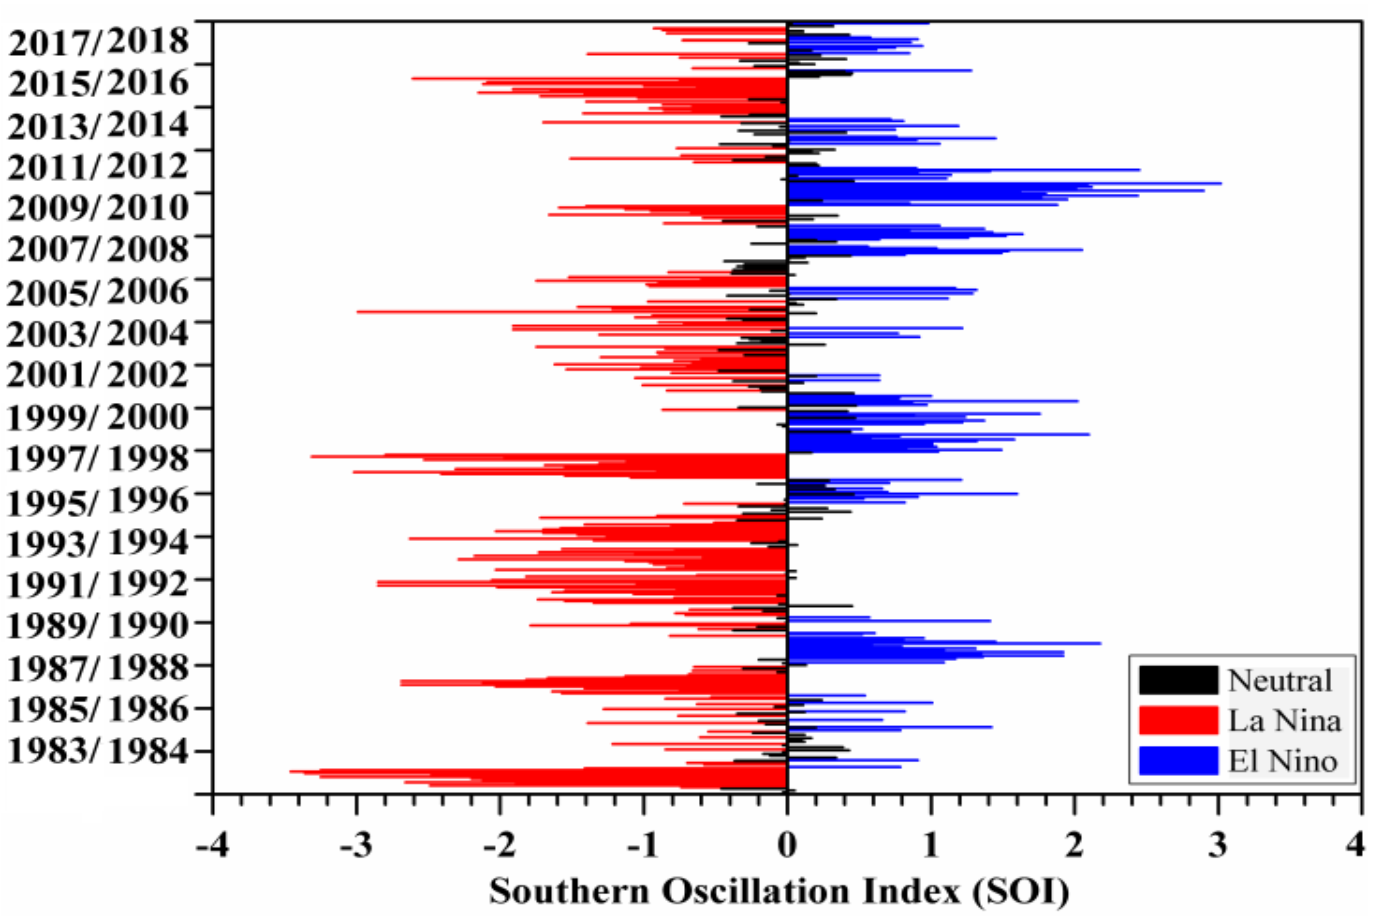
For the SOI, the most noticeable La Niña years were 1986–87, 1991–92, 1997–98, 2002–03, and 2009–10, and the El Niño years were 1998–99, 2000–01, and 2007–08. The 1–12 month SPI revealed that for the SOI, the mean magnitude and duration were very similar during neutral, La Niña, and El Niño years. Comparison of this result with the spatial pattern of SPI–12 revealed that drought conditions could occur during La Niña years in many regions affected by the SOI like Guinea, Ghana, Sierra Leone, Mali, Cote d’Ivoire, Burkina Faso, Niger, and Nigeria (Figure 4, Figure 14 and Figure 15). Our result was affirmed by Ogunjo et al. [51]; they investigated the impact of large-scale ocean oscillation indices—the SOI, NAO and Pacific Decadal Oscillation (PDO)—on drought over West Africa. They found that the SOI showed a predominantly positive correlation with drought over the West African region, while PDO and NAO showed a negative correlation. Moreover, Addi et al. [86] studied the impact of large-scale climate indices on the meteorological drought of coastal Ghana (West Africa). They found that the SPI and ENSO led to moderate to severe drought during the dry seasons, meaning they have great potential for seasonal drought prediction over coastal Ghana. This conclusion demonstrates that drought in these regions can be linked to the SOI. The trend in the ENSO originating in both the Pacific and Indian Oceans influences the regional climate of West Africa. This affirms that the global phenomenon’s apparition impacts weather conditions, and mainly those in West Africa, as confirmed by Egbuawa et al. [87] and Adeniyi et al. [88].

5. Conclusions

There is a consensus on the increase in droughts over the past decades, nor on future climate scenarios, for most regions of Africa. Recent studies have made significant progress in understanding drought in West and North African regions, as well as the effects of climate change, but further research is needed due to the uncertainty remaining in regional climate responses. This could be addressed by recent advances in climate modelling, which take advantage of increased spatiotemporal resolutions and a better quality of observations. In the current study, the SPI index was used to effectively describe the meteorological drought over North and West African regions from 1982 to 2018. The result for 36 years showed 13 dry years and 23 wet years. The SPI analysis at different timescales revealed a higher temporal variability in wet and dry periods for short timescales, while for long timescales, it was lower. The drought characteristics also showed that years of higher drought magnitude increased when the duration was longer (and vice versa), and the severity of drought differed across the study area over the different study years. In terms of the ENSO-drought relationship, the NAOI showed that the mean drought characteristics, duration, and magnitude for SPI–1, SPI–3, and SPI–6 were similar in La Niña years, while the mean drought characteristics for SPI–12, SPI–6, and SPI–3 coincided with El Niño years. The SOI showed that the mean magnitude and duration were very similar during La Niña and El Niño years at various timescales. The NAOI and SOI with the spatial pattern of SPI–12 revealed that drought conditions could occur in many regions. In Morocco, Algeria, and the sub-Saharan countries, the result clarified a direct link between the NAOI and drought in these countries. The findings of this study also exposed how drought is linked with the SOI in Guinea, Ghana, Sierra Leone, Mali, Cote d’Ivoire, Burkina Faso, Niger, and Nigeria.
The SPI was an applicable and suitable index for drought monitoring over the study region as it offered drought analysis at various timescales. This research might aid in improving our understanding of drought characteristics and return years, and their association with the ENSO over the study area, which will be useful for monitoring droughts in an integrated manner. Moreover, this study offers policymakers essential information that is prerequisite to local adaptation, increased mitigation measures, and resilience in the face of a vulnerable ecoclimatic system, brought on by constant climate change in the study area. For improved understanding of the drought processes related to climate change, a shift from index-based analysis to impact-based research is likely required. Adaptation to forthcoming climate changes will present a huge challenge for the region, and this necessitates a comprehensive assessment of droughts that includes a realistic representation of the water available in soils, drought propagation, feedback from vegetation cover, and human influence during these events.

Author Contributions

Conceptualization, M.H., T.I. and T.J.; methodology, M.H., J.Z, software, M.H, T.I. and T.J.; validation, M.H., T.I. and T.J.; formal analysis, M.H.; investigation, M.H.; resources, M.H., T.J; data curation, M.H.; writing—original draft preparation, M.H.; writing—review and editing, J.Z., Y.B., S.Z., B.E. and F.U.; visualization, M.H.; supervision, J.Z.; project administration, J.Z.; funding acquisition, J.Z. All authors have read and agreed to the published version of the manuscript.

Funding

This research was funded by the CAS Strategic Priority Research Program (no. XDA19030402), National Natural Science Foundation of China (no. 42071425), Shandong Natural Science Foundation Project (no. 2018GNC110025, ZR2020QF281, and ZR2020QF067), and the “Taishan Scholar” Project of Shandong Province.

Acknowledgments

We appreciate the CRU for providing the datasets used in this research from 1982 to 2018 (http://data.ceda.ac.uk/badc/cru/data/cru_ts/cru_ts_4.00/data/; https://crudata.uea.ac.uk/cru/data/pci.htm accessed on 18 September 2021), the CAS Strategic Priority Research Program (no. XDA19030402), National Natural Science Foundation of China (no. 42071425), Key Basic Research Project of Shandong Natural Science Foundation of China (no. 2018GNC110025, ZR2020QF281, ZR2020QF067), and the “Taishan Scholar” Project of Shandong Province. We are grateful to the native English speakers who helped to improve the English grammar of this paper.

Conflicts of Interest

The authors declare that they have no known competing financial interest or personal relationship that could have influenced the work reported in this paper.

Appendix A

Table A1. Annual PA and SPI–12 for different countries (Algeria, Tunisia, Morocco, Libya and Egypt) in northern region between 1982 and 2018.
YearAlgeriaTunisiaMoroccoLibyaEgypt
PASPIPASPIPASPIPASPIPASPI
1982–1983−0.05 −0.01 0.51 0.57 0.16 0.25 0.30 0.31 0.05 0.00
1983–1984−1.00 −0.89 −0.76 −0.76 −0.40 −0.33 −0.85 −0.60 −0.80 −0.43
1984–19850.62 0.53 0.68 0.73 0.16 0.26 0.52 0.54 0.39 0.50
1985–1986−1.68 −1.64 −1.55 −1.73 1.05 1.06 −1.01 −0.89 −0.23 −0.39
1986–19870.59 0.57 −0.11 −0.05 −1.00 −1.03 1.62 1.30 0.67 −0.01
1987–1988−0.79 −0.68 −1.62 −1.82 1.90 1.74 −0.22 −0.13 2.86 1.40
1988–1989−0.78 −0.68 −0.61 −0.59 0.96 0.99 1.55 1.16 1.20 1.24
1989–19902.00 1.68 0.90 0.94 1.44 1.39 −0.97 −0.71 −1.35 −1.00
1990–19910.46 0.48 0.66 0.71 0.06 0.16 −0.24 −0.11 0.02 0.49
1991–19920.75 0.71 1.08 1.10 0.94 0.97 2.15 1.47 1.11 0.12
1992–19930.63 0.54 1.10 1.12 0.04 0.14 0.84 0.70 −0.35 −0.41
1993–1994−1.55 −1.49 −0.37 −0.33 −0.44 −0.37 0.29 0.34 −0.36 0.21
1994–1995−0.05 −0.03 −1.38 −1.51 −0.75 −0.72 1.07 0.84 1.06 0.63
1995–19962.21 1.84 3.10 2.76 1.98 1.81 1.52 1.24 −1.16 −1.10
1996–1997−0.99 −0.88 −1.19 −1.27 −0.74 −0.72 −0.89 −0.63 0.13 0.09
1997–19980.20 0.20 0.39 0.45 −0.16 −0.07 1.13 0.98 −0.16 0.78
1998–1999−1.32 −1.31 0.29 0.35 −1.04 −1.09 0.37 0.26 −1.44 −0.85
1999–2000−1.13 −1.07 −0.75 −0.74 −0.61 −0.56 −0.04 −0.01 −1.49 −1.24
2000–2001−0.77 −0.67 −0.82 −0.83 −1.54 −1.79 * −1.63 −1.40 * 0.93 0.31
2001–2002−0.71 −0.61 −0.76 −0.75 0.77 0.82 0.68 0.22 −0.07 −0.37
2002–2003−1.20 −1.13 * −0.68 −0.67 *−1.12 −1.19 *−1.19 −1.17 * 0.25 0.91
2003–20040.94 0.85 1.03 1.06 0.72 0.78 −0.19 −0.02 0.08 0.10
2004–2005−0.32 −0.26 0.34 0.41 −1.04 −1.09 −0.47 −0.55 0.07 0.52
2005–20060.48 0.48 −0.11 −0.05 0.58 0.66 1.19 0.99 −0.65 −0.50
2006–2007−0.26 −0.16 1.10 1.12 −0.69 −0.65 −0.32 −0.16 −0.65 −0.70
2007–2008−0.05 0.02 −1.11 −1.17 −0.76 −0.74 −0.59 −0.36 −0.84 −0.80
2008–2009−0.76 −0.65 1.12 1.14 0.29 0.38 −0.82 −0.57 1.31 0.84
2009–20100.44 0.46 −1.21 −1.29 −0.71 −0.68 −0.61 −0.49 1.11 0.88
2010–2011−0.99 −0.88 −0.53 −0.50 −1.27 −1.39 0.26 0.17 −1.66 −1.49
2011–20120.24 0.29 0.31 0.38 −0.65 −0.60 −0.04 0.00 −0.26 −0.35
2012–20131.74 1.49 −0.77 −0.77 0.39 0.48 −1.77 −1.62 0.09 0.17
2013–2014−0.16 −0.08 −0.31 −0.26 −0.78 −0.77 −0.51 −0.36 0.67 1.15
2014–20151.32 1.15 1.02 1.05 1.64 1.55 −0.64 −0.43 −1.32 −1.12
2015–20161.06 0.96 −0.14 −0.08 1.54 1.47 −1.75 −1.51 −0.80 −0.58
2016–2017−0.19 −0.14 0.71 0.76 −1.57 −1.84 1.06 0.91 1.70 0.49
2017–20181.06 0.97 0.42 0.49 0.64 0.70 0.18 0.27 −0.10 0.45
*: Dry years.
Table A2. Annual PA and SPI–12 for different countries (Mauritania, Senegal, Mali, Niger and Sudan) in western region between 1982 and 2018.
YearMauritaniaSenegalMaliNigerSudan
PASPIPASPIPASPIPASPIPASPI
1982–19831.24 0.82 −0.30 −0.22 0.75 0.80 0.47 0.44 −0.11 −0.04
1983–1984−0.05 0.17 0.41 0.47 −0.74 −0.45 0.58 0.56 0.00 0.26
1984–19851.00 0.50 0.20 0.27 −1.21 −0.91 −0.88 −0.81 −1.09 −0.72
1985–1986−0.46 −0.02 −0.14 −0.07 −0.52 −0.65 −0.89 −0.80 0.08 0.11
1986–19870.40 −0.19 0.40 0.46 −1.53 −1.28 −0.99 −0.83 −0.99 0.06
1987–19880.74 0.86 1.38 1.31 0.22 0.15 0.75 0.70 1.16 0.70
1988–19891.03 0.80 2.31 2.04 0.70 0.61 0.86 0.81 −0.12 −0.22
1989–19900.27 0.31 1.17 1.14 −0.60 −0.43 −0.43 −0.30 −0.63 −0.12
1990–1991−1.22 −1.24 −1.56 −1.68 −0.28 −0.31 0.26 0.31 −0.39 −0.93
1991–1992−0.71 −0.31 −0.59 −0.53 −0.63 −0.49 −0.78 −0.63 −0.92 0.35
1992–19930.42 0.42 −0.03 0.05 0.89 0.87 1.52 1.27 1.79 1.17
1993–1994−1.77 −1.70 −0.62 −0.57 0.78 0.64 0.85 0.80 0.60 0.52
1994–19951.00 1.02 −0.01 0.07 0.82 0.63 0.28 0.33 0.78 0.77
1995–19960.56 0.72 −0.42 −0.35 −0.61 −0.52 −1.06 −0.91 −0.17 0.28
1996–19970.35 0.38 0.18 0.25 0.97 0.93 0.61 0.57 0.65 0.40
1997–1998−1.07 −0.53 −1.20 −1.23 −0.56 −0.57 −0.22 −0.12 0.01 0.06
1998–19990.48 0.44 0.76 0.78 1.37 1.16 2.25 1.84 1.88 1.14
1999–20000.23 0.19 0.79 0.81 0.55 0.52 0.17 0.21 0.56 −0.08
2000–20010.38 0.40 0.08 0.15 −0.20 −0.04 −0.03 0.03 0.28 0.40
2001–2002−0.90 −0.41 −1.31 −1.37 −2.44 −2.24 −0.79 −0.68 −0.73 0.01
2002–2003−0.59 −0.01 −0.69 −0.64 −0.45 −0.46 −1.24 −1.16 −0.38 0.04
2003–20041.60 1.28 0.63 0.67 0.71 0.57 0.17 0.20 −0.64 −0.56
2004–2005−0.49 −0.26 1.44 1.36 −0.52 −0.35 0.42 0.44 0.11 0.09
2005–20060.31 0.26 0.26 0.32 0.15 0.17 0.37 0.38 0.34 0.34
2006–20070.12 0.37 −0.09 −0.01 0.63 0.66 1.11 0.96 1.95 2.20
2007–20080.36 0.27 0.87 0.88 0.26 0.26 0.61 0.58 −0.30 −0.72
2008–2009−0.85 −1.13 −1.03 −1.03 −0.55 −0.68 −1.05 −0.90 −1.44 −2.45
2009–2010−0.45 −0.92 −1.82 −2.05 −0.65 −0.99 −0.25 −0.13 −1.36 −1.03
2010–2011−2.58 −2.49 * −1.46 −1.56 * −2.01 −1.97 * −2.94 −3.25 * −2.96 −2.73 *
2011–20120.12 0.17 0.27 0.34 1.53 1.38 0.78 0.66 1.22 0.29
2012–20130.80 0.46 0.42 0.48 0.20 0.30 1.26 1.01 0.77 0.04
2013–20140.44 0.45 0.32 0.38 0.26 0.27 −0.31 −0.19 0.27 0.45
2014–20150.54 0.57 1.27 1.22 0.91 0.77 −0.13 −0.08 0.43 −0.29
2015–20161.24 0.90 1.13 1.10 2.36 1.86 0.32 0.35 −0.38 −0.22
2016–2017−2.74 −2.77 −1.78 −1.99 −1.09 −0.76 −1.89 −1.82 −0.90 −0.55
2017–20180.23 0.32 −1.21 −1.24 0.51 0.57 0.24 0.20 0.64 1.05
*: Dry years.
Table A3. Annual PA and SPI–12 for different countries (Guinea, Burkina Faso, Chad, Sierra Leone and Cote d’Ivoire) in western region between 1982 and 2018.
YearGuineaBurkina FasoChadSierra LeoneCote d’Ivoire
PASPIPASPIPASPIPASPIPASPI
1982–19831.51 1.51 0.46 0.48 0.95 0.83 0.57 0.57 −0.52 −0.48
1983–19841.07 1.10 −0.41 −0.38 0.48 0.47 0.60 0.61 −0.37 −0.30
1984–1985−0.71 −0.71 0.33 0.36 −0.90 −0.77 −2.08 −2.13 0.63 0.63
1985–19860.12 0.16 −0.04 0.00 −0.03 0.03 −0.73 −0.71 −1.49 −1.41
1986–1987−1.39 −1.46 −0.48 −0.46 −1.00 −0.89 −2.07 −2.12 −0.53 −0.51
1987–1988−0.10 −0.07 −0.67 −0.65 1.24 1.10 −1.23 −1.23 0.38 0.40
1988–1989−0.50 −0.49 −0.64 −0.62 0.75 0.66 −1.20 −1.19 1.15 1.10
1989–1990−0.20 −0.17 −0.50 −0.48 0.02 0.08 0.51 0.52 0.38 0.40
1990–1991−0.70 −0.70 −0.05 −0.01 1.18 1.05 −0.19 −0.17 0.85 0.82
1991–1992−0.89 −0.91 0.13 0.17 −0.81 −0.70 0.94 0.93 −2.26 −2.27
1992–1993−0.26 −0.24 1.50 1.46 −0.42 −0.31 0.39 0.41 0.29 0.30
1993–19940.08 0.12 0.32 0.35 −0.31 −0.22 −0.84 −0.83 −0.82 −0.72
1994–19951.44 1.45 0.73 0.74 0.23 0.23 1.08 1.07 0.95 0.89
1995–1996−0.43 −0.42 −0.85 −0.84 0.29 0.27 0.59 0.60 2.01 1.76
1996–19970.78 0.82 1.27 1.25 0.97 0.86 0.65 0.65 −0.39 −0.37
1997–1998−0.65 −0.65 0.82 0.84 −0.24 −0.15 1.27 1.24 −1.31 −1.26
1998–19991.04 1.07 0.43 0.46 −1.12 −1.00 1.07 1.05 0.25 0.26
1999–20001.38 1.39 0.62 0.64 −0.02 0.05 0.57 0.58 −0.31 −0.24
2000–2001−0.24 −0.22 −0.59 −0.57 −0.79 −0.68 0.50 0.51 0.63 0.58
2001–2002−1.12 −1.16 −2.07 −2.20 −1.09 −0.97 0.55 0.56 0.91 0.85
2002–2003−0.41 −0.40 −1.15 −1.16 −0.80 −0.68 −0.34 −0.32 −0.55 −0.45
2003–20041.44 1.44 0.13 0.16 2.12 1.78 0.51 0.52 −0.02 −0.01
2004–20050.44 0.48 −1.30 −1.32 0.50 0.50 0.15 0.16 0.11 0.13
2005–20060.64 0.68 −0.32 −0.28 1.23 1.04 0.51 0.52 0.54 0.50
2006–2007−0.99 −1.02 1.96 1.87 0.98 0.87 0.83 0.82 0.56 0.56
2007–2008−0.47 −0.46 −0.06 −0.03 1.03 0.83 0.35 0.37 0.82 0.81
2008–2009−0.46 −0.45 −0.38 −0.35 −1.04 −0.93 −2.05 −2.09 −1.34 −1.23
2009–2010−0.69 −0.69 −0.36 −0.33 −1.43 −1.39 −2.54 −2.64 −0.94 −0.85
2010–2011−1.75 −1.88 * −2.38 −2.57 * −2.29 −2.27 * −0.45 −0.43 0.34 0.37
2011–2012−0.90 −0.92 1.68 1.62 1.39 1.22 0.48 0.49 −0.04 0.00
2012–20130.88 0.91 0.14 0.17 0.41 0.43 0.51 0.52 −0.61 −0.57
2013–2014−0.11 −0.08 0.61 0.63 −0.80 −0.77 0.49 0.50 0.86 0.77
2014–20152.13 2.09 0.71 0.73 0.65 0.63 0.51 0.52 0.99 0.92
2015–20161.98 1.95 1.64 1.59 0.11 0.16 0.51 0.52 1.27 1.06
2016–2017−1.00 −1.03 −1.61 −1.68 −1.70 −1.64 −0.90 −0.89 −2.67 −2.70
2017–2018−0.99 −1.02 0.35 0.38 0.23 0.27 0.51 0.52 0.24 0.28
*: Dry years.
Table A4. Annual PA and SPI–12 for different countries (Ghana and Nigeria) in western region between 1982 and 2018.
YearGhanaNigeria
PASPIPASPI
1982–1983−0.29 −0.25 −0.32 −0.17
1983–19840.47 0.50 0.47 0.45
1984–19850.80 0.81 0.40 0.30
1985–1986−1.25 −1.28 0.09 0.11
1986–19870.36 0.39 0.79 0.55
1987–19880.32 0.36 −0.21 −0.61
1988–19890.41 0.45 0.05 0.05
1989–19900.87 0.88 0.66 0.63
1990–19911.61 1.55 2.56 2.02
1991–1992−1.91 −2.05 −1.35 −1.20
1992–1993−0.26 −0.22 0.08 0.13
1993–1994−0.97 −0.96 −0.58 −0.69
1994–19951.07 1.06 1.67 1.25
1995–19960.26 0.30 1.35 1.01
1996–1997−0.44 −0.40 −0.51 −0.26
1997–1998−0.32 −0.28 0.93 0.97
1998–19991.27 1.25 0.08 −0.09
1999–2000−0.24 −0.20 0.33 0.59
2000–2001−1.61 −1.69 −0.76 −0.47
2001–20020.15 0.19 −0.19 −0.05
2002–2003−1.28 −1.31 −0.78 −0.59
2003–2004−0.01 0.03 1.03 0.74
2004–20050.53 0.56 0.34 0.25
2005–2006−0.85 −0.84 −0.74 −0.44
2006–20070.89 0.90 0.85 0.65
2007–20081.68 1.61 1.22 0.83
2008–2009−0.74 −0.72 −0.50 −0.12
2009–2010−0.32 −0.28 −2.04 −1.91
2010–20111.99 1.88 −0.81 −0.48
2011–20120.47 0.50 −0.13 −0.09
2012–2013−0.65 −0.63 −0.43 −0.32
2013–20140.49 0.52 −0.31 −0.23
2014–20150.96 0.97 0.19 0.11
2015–2016−0.52 −0.48 −0.01 0.02
2016–2017−2.19 −2.39 −2.82 −2.52
2017–2018−0.73 −0.71 −0.59 −0.42

References

  1. Dodangeh, E.; Shahedi, K.; Shiau, J.T.; MirAkbari, M. Spatial hydrological drought characteristics in Karkheh River basin, southwest Iran using copulas. J. Earth Syst. Sci. 2017, 126, 80. [Google Scholar] [CrossRef]
  2. Hoerling, M.; Kumar, A. The perfect ocean for drought. Science 2003, 299, 691–694. [Google Scholar] [CrossRef] [PubMed] [Green Version]
  3. Kuwayama, Y.; Thompson, A.; Bernknopf, R.; Zaitchik, B.; Vail, P. Estimating the impact of drought on agriculture using the US Drought Monitor. Am. J. Agric. Econ. 2019, 101, 193–210. [Google Scholar] [CrossRef]
  4. Hildén, M.; Marx, A. Evaluation of climate change state, impact and vulnerability indicators. ETC CCA Tech. Pap. 2013, 2, 2013. [Google Scholar]
  5. Renaud, V.; Rebetez, M. Comparison between open-site and below-canopy climatic conditions in Switzerland during the exceptionally hot summer of 2003. Agric. For. Meteorol. 2009, 149, 873–880. [Google Scholar] [CrossRef]
  6. Vicente-Serrano, S.M.; López-Moreno, J.I.; Drumond, A.; Gimeno, L.; Nieto, R.; Morán-Tejeda, E.; Lorenzo-Lacruz, J.; Beguería, S.; Zabalza, J. Effects of warming processes on droughts and water resources in the NW Iberian Peninsula (1930–2006). Clim. Res. 2011, 48, 203–212. [Google Scholar] [CrossRef]
  7. Delbiso, T.D.; Rodriguez-Llanes, J.M.; Donneau, A.-F.; Speybroeck, N.; Guha-Sapir, D. Drought, conflict and children’s undernutrition in Ethiopia 2000–2013: A meta-analysis. Bull. World Health Organ. 2017, 95, 94. [Google Scholar] [CrossRef]
  8. Gautam, M. Managing Drought in Sub-Saharan Africa: Policy Perspectives; International Association of Agricultural Economists: Milwaukee, WI, USA, 2006; p. 78563. [Google Scholar]
  9. Shiferaw, B.; Tesfaye, K.; Kassie, M.; Abate, T.; Prasanna, B.; Menkir, A. Managing vulnerability to drought and enhancing livelihood resilience in sub-Saharan Africa: Technological, institutional and policy options. Weather Clim. Extrem. 2014, 3, 67–79. [Google Scholar] [CrossRef] [Green Version]
  10. Viste, E.; Korecha, D.; Sorteberg, A. Recent drought and precipitation tendencies in Ethiopia. Theor. Appl. Clim. 2013, 112, 535–551. [Google Scholar] [CrossRef] [Green Version]
  11. Henchiri, M.; Liu, Q.; Essifi, B.; Javed, T.; Zhang, S.; Bai, Y.; Zhang, J. Spatio-Temporal Patterns of Drought and Impact on Vegetation in North and West Africa Based on Multi-Satellite Data. Remote Sens. 2020, 12, 3869. [Google Scholar] [CrossRef]
  12. Shanahan, T.M.; Overpeck, J.T.; Anchukaitis, K.; Beck, J.W.; Cole, J.E.; Dettman, D.L.; Peck, J.A.; Scholz, C.A.; King, J.W. Atlantic forcing of persistent drought in West Africa. Science 2009, 324, 377–380. [Google Scholar] [CrossRef] [Green Version]
  13. Gautier, D.; Denis, D.; Locatelli, B. Impacts of drought and responses of rural populations in West Africa: A systematic review. Wiley Interdiscip. Rev. Clim. Chang. 2016, 7, 666–681. [Google Scholar] [CrossRef]
  14. Orimoloye, I.R.; Olusola, A.O.; Ololade, O.; Adelabu, S. A persistent fact: Reflections on drought severity evaluation over Nigerian Sahel using MOD13Q1. Arab. J. Geosci. 2021, 14, 1997. [Google Scholar] [CrossRef]
  15. Yacoub, E.; Tayfur, G. Evaluation and assessment of meteorological drought by different methods in Trarza region, Mauritania. Water Resour. Manag. 2017, 31, 825–845. [Google Scholar] [CrossRef]
  16. Ozer, P.; Hountondji, Y.-C.; Niang, A.J.; Karimoune, S.; Laminou Manzo, O.; Salmon, M. Désertification au Sahel: Historique et perspectives. Bull. Soc. Géogr. Liège. 2010, 54, 69–84. [Google Scholar]
  17. Winkler, K.; Gessner, U.; Hochschild, V. Identifying Droughts Affecting Agriculture in Africa Based on Remote Sensing Time Series between 2000–2016: Rainfall Anomalies and Vegetation Condition in the Context of ENSO. Remote Sens. 2017, 9, 831. [Google Scholar] [CrossRef] [Green Version]
  18. Elagib, N.A.; Elhag, M.M. Major climate indicators of ongoing drought in Sudan. J. Hydrol. 2011, 409, 612–625. [Google Scholar] [CrossRef]
  19. Gargouri, K.; Laajimi, A.; Chebil, A.; Aoun, W.B. Drought occurrence and its impact on olive production and cereals in Tunisia. Options Méditerr. Sér. A Sémin. Méditerr. 2010, 95, 41–47. [Google Scholar]
  20. Touchan, R.; Anchukaitis, K.J.; Meko, D.M.; Attalah, S.; Baisan, C.; Aloui, A. Long term context for recent drought in northwestern Africa. Geophys. Res. Lett. 2008, 35, 660. [Google Scholar] [CrossRef]
  21. Abou-Hadid, A.F. Assessment of Impacts, Adaptation, and Vulnerability to Climate Change in North Africa: Food Production and Water Resources; A Final Report Submitted to Assessments of Impacts Adaptations to Climate Change; International START Secretariat: Washington, DC, USA, 2006. [Google Scholar]
  22. Verner, D.; Treguer, D.; Redwood, J.; Christensen, J.; McDonnell, R.; Elbert, C.; Konishi, Y.; Belghazi, S. Climate Variability, Drought, and Drought Management in Morocco’s Agricultural Sector. 2018. Available online: http://hdl.handle.net/10986/30603 (accessed on 10 November 2021).
  23. Ahmadalipour, A.; Moradkhani, H. Multi-dimensional assessment of drought vulnerability in Africa: 1960–2100. Sci. Total Environ. 2018, 644, 520–535. [Google Scholar] [CrossRef] [PubMed]
  24. Mohmmed, A.; Li, J.; Elaru, J.; Elbashier, M.M.; Keesstra, S.; Artemi, C.; Martin, K.; Reuben, M.; Teffera, Z. Assessing drought vulnerability and adaptation among farmers in Gadaref region, Eastern Sudan. Land Use Policy 2018, 70, 402–413. [Google Scholar] [CrossRef] [Green Version]
  25. Dai, A. Drought under global warming: A review. Wiley Interdiscip. Rev. Clim. Chang. 2011, 2, 45–65. [Google Scholar] [CrossRef] [Green Version]
  26. Mohammad, A.H.; Jung, H.C.; Odeh, T.; Bhuiyan, C.; Hussein, H. Understanding the impact of droughts in the Yarmouk Basin, Jordan: Monitoring droughts through meteorological and hydrological drought indices. Arab. J. Geosci. 2018, 11, 103. [Google Scholar] [CrossRef] [Green Version]
  27. Han, Y.; Li, Z.; Huang, C.; Zhou, Y.; Zong, S.; Hao, T.; Niu, H.; Yao, H. Monitoring droughts in the Greater Changbai Mountains using multiple remote sensing-based drought indices. Remote Sens. 2020, 12, 530. [Google Scholar] [CrossRef] [Green Version]
  28. Liu, Q.; Zhang, S.; Zhang, H.; Bai, Y.; Zhang, J. Monitoring drought using composite drought indices based on remote sensing. Sci. Total Environ. 2020, 711, 134585. [Google Scholar] [CrossRef]
  29. Hao, C.; Zhang, J.; Yao, F. Combination of multi-sensor remote sensing data for drought monitoring over Southwest China. Int. J. Appl. Earth Obs. Geoinf. 2015, 35, 270–283. [Google Scholar] [CrossRef]
  30. Svoboda, M.; LeComte, D.; Hayes, M.; Heim, R.; Gleason, K.; Angel, J.; Rippey, B.; Tinker, R.; Palecki, M.; Stooksbury, D. The drought monitor. Bull. Am. Meteorol. Soc. 2002, 83, 1181–1190. [Google Scholar] [CrossRef] [Green Version]
  31. Weghorst, K.M. The Reclamation Drought Index: Guidelines and practical applications. Bur. Reclam. Denver CO 1996, 6. Available online: http://www.wamis.org/agm/RDI_paper.pdf (accessed on 10 November 2021).
  32. McKee, T.B.; Doesken, N.J.; Kleist, J. The relationship of drought frequency and duration to time scales. In Proceedings of the 8th Conference on Applied Climatology, Anaheim, CA, USA, 17–22 June 1993; pp. 179–183. [Google Scholar]
  33. Palmer, W.C. Keeping Track of Crop Moisture Conditions, Nationwide: The New Crop Moisture Index; Taylor & Francis: Abingdon, UK, 1968. [Google Scholar]
  34. Gibbs, W.J.; Maher, J.V. Rainfall Deciles Drought Inddicators; FAO: Rome, Italy, 1967. [Google Scholar]
  35. Vicente-Serrano, S.M.; Beguería, S.; Lorenzo-Lacruz, J.; Camarero, J.J.; López-Moreno, J.I.; Azorin-Molina, C.; Revuelto, J.; Morán-Tejeda, E.; Sanchez-Lorenzo, A. Performance of drought indices for ecological, agricultural, and hydrological applications. Earth Interact. 2012, 16, 1–27. [Google Scholar] [CrossRef] [Green Version]
  36. Ekwezuo, C.S.; Ezeh, C.U. Regional characterisation of meteorological drought and floods over west Africa. Sustain. Water Resour. Manag. 2020, 6, 80. [Google Scholar] [CrossRef]
  37. Oloruntade, A.J.; Mohammad, T.A.; Ghazali, A.H.; Wayayok, A. Analysis of meteorological and hydrological droughts in the Niger-South Basin, Nigeria. Glob. Planet. Chang. 2017, 155, 225–233. [Google Scholar] [CrossRef]
  38. Vicente-Serrano, S.M.; Aguilar, E.; Martínez, R.; Martín-Hernández, N.; Azorin-Molina, C.; Sánchez-Lorenzo, A.; El Kenawy, A.; Tomás-Burguera, M.; Moran-Tejeda, E.; López-Moreno, J. The complex influence of ENSO on droughts in Ecuador. Clim. Dyn. 2017, 48, 405–427. [Google Scholar] [CrossRef] [Green Version]
  39. Park, S.; Kang, D.; Yoo, C.; Im, J.; Lee, M.-I. Recent ENSO influence on East African drought during rainy seasons through the synergistic use of satellite and reanalysis data. J. Photogramm. Remote Sens. 2020, 162, 17–26. [Google Scholar] [CrossRef]
  40. Meque, A.; Abiodun, B. Simulating the link between ENSO and summer drought in Southern Africa using regional climate models. Clim. Dyn. 2015, 44, 1881–1900. [Google Scholar] [CrossRef]
  41. Martin-Vide, J.; Lopez-Bustins, J.A. The western Mediterranean oscillation and rainfall in the Iberian Peninsula. Int. J. Climatol. 2006, 26, 1455–1475. [Google Scholar] [CrossRef]
  42. Mo, K.C.; Livezey, R.E. Tropical-extratropical geopotential height teleconnections during the Northern Hemisphere winter. Mon. Weather Rev. 1986, 114, 2488–2515. [Google Scholar] [CrossRef]
  43. Lionello, P. The Climate of The Mediterranean Region: From The Past to The Future; Elsevier: Amsterdam, The Netherlands, 2012; Available online: https://books.google.com.hk/books?hl=fr&lr=&id=paKNr0-wdToC&oi=fnd&pg=PP1&dq=The+Climate+of+The+Mediterranean+Region:+From+The+Past+to+The+Future&ots=niCFIYEo5y&sig=LvTPDcR8fmEU6je0SlKQuLaIbIQ&redir_esc=y&hl=zh-CN&sourceid=cndr#v=onepage&q=The%20Climate%20of%20The%20Mediterranean%20Region%3A%20From%20The%20Past%20to%20The%20Future&f=false (accessed on 10 November 2021).
  44. Yves, T.; Koutroulis, A.; Samaniego, L.; Vicente-Serrano, S.M.; Volaire, F.; Boone, A.; Le Page, M.; Llasat, M.C.; Albergel, C.; Burak, S. Challenges for drought assessment in the Mediterranean region under future climate scenarios. Earth-Sci. Rev. 2020, 210, 103348. [Google Scholar]
  45. Oguntunde, P.G.; Lischeid, G.; Abiodun, B. Impacts of climate variability and change on drought characteristics in the Niger River Basin, West Africa. Stoch. Environ. Res. Risk Assess. 2018, 32, 1017–1034. [Google Scholar] [CrossRef]
  46. Giannini, A. 40 years of climate modeling: The causes of late-20th century drought in the Sahel. In The End of Desertification? Springer: Berlin/Heidelberg, Germany, 2016; pp. 265–291. [Google Scholar]
  47. Bazza, M.; Kay, M.; Knutson, C. Drought Characteristics and Management in North Africa and the Near East; FAO Water Reports; FAO: Rome, Italy, 2018; p. 45. [Google Scholar]
  48. DePauw, E. Drought early warning systems in West Asia and North Africa. In Early Warning Systems for Drought Preparedness and Drought Management; WMO: Geneva, Switzerland, 2000; p. 65. [Google Scholar]
  49. Zribi, M.; Nativel, S.; Le Page, M. Analysis of Agronomic Drought over North Africa Using Remote Sensing Satellite Data; 2021; p. EGU21-14780. Available online: https://ui.adsabs.harvard.edu/abs/2021EGUGA..2314780Z (accessed on 10 November 2021).
  50. Whittleston, D.; Nicholson, S.; Schlosser, A.; Entekhabi, D. Climate models lack jet–rainfall coupling over West Africa. J. Clim. 2017, 30, 4625–4632. [Google Scholar] [CrossRef] [Green Version]
  51. Ogunjo, S.T.; Fuwape, I.A.; Olusegun, C.F. Impact of large scale climate oscillation on drought in West Africa. arXiv 2019, arXiv:1901.10145. [Google Scholar]
  52. Godfray, H.C.J.; Beddington, J.R.; Crute, I.R.; Haddad, L.; Lawrence, D.; Muir, J.F.; Pretty, J.; Robinson, S.; Thomas, S.M.; Toulmin, C. Food security: The challenge of feeding 9 billion people. Science 2010, 327, 812–818. [Google Scholar] [CrossRef] [Green Version]
  53. Khan, Z.R.; Midega, C.A.; Pittchar, J.O.; Murage, A.W.; Birkett, M.A.; Bruce, T.J.; Pickett, J.A. Achieving food security for one million sub-Saharan African poor through push–pull innovation by 2020. Philos. Trans. R. Soc. Lond. B Biol. Sci. 2014, 369, 20120284. [Google Scholar] [CrossRef] [Green Version]
  54. Propastin, P.; Fotso, L.; Kappas, M. Assessment of vegetation vulnerability to ENSO warm events over Africa. Int. J. Appl. Earth Obs. Geoinf. 2010, 12, S83–S89. [Google Scholar] [CrossRef]
  55. Ahmadalipour, A.; Moradkhani, H.; Castelletti, A.; Magliocca, N. Future drought risk in Africa: Integrating vulnerability, climate change, and population growth. Sci. Total Environ. 2019, 662, 672–686. [Google Scholar] [CrossRef]
  56. Guttman, N.B. Accepting the standardized precipitation index: A calculation algorithm 1. J. Am. Water Resour. Assoc. 1999, 35, 311–322. [Google Scholar] [CrossRef]
  57. Kalisa, W.; Zhang, J.; Igbawua, T.; Ujoh, F.; Ebohon, O.J.; Namugize, J.N.; Yao, F. Spatio-temporal analysis of drought and return periods over the East African region using Standardized Precipitation Index from 1920 to 2016. Agric. Water Manag. 2020, 237, 106195. [Google Scholar] [CrossRef]
  58. Haroon, M.A.; Zhang, J.; Yao, F. Drought monitoring and performance evaluation of MODIS-based drought severity index (DSI) over Pakistan. Nat. Hazards 2016, 84, 1349–1366. [Google Scholar] [CrossRef]
  59. Mondal, A.; Kundu, S.; Mukhopadhyay, A. Rainfall trend analysis by Mann-Kendall test: A case study of north-eastern part of Cuttack district, Orissa. Int. J. Geol. Earth Environ. Sci. 2012, 2, 70–78. [Google Scholar]
  60. Modarres, R.; Sarhadi, A.; Burn, D.H. Changes of extreme drought and flood events in Iran. Glob. Planet. Chang. 2016, 144, 67–81. [Google Scholar] [CrossRef]
  61. González, J.; Valdés, J. The mean frequency of recurrence of in-time-multidimensional events for drought analyses. Nat. Hazards Earth Syst. Sci. 2004, 4, 17–28. [Google Scholar] [CrossRef]
  62. Kim, T.-W.; Yoo, C.; Valdés, J.B. Nonparametric approach for estimating effects of ENSO on return periods of droughts. J. Civ. Eng. 2003, 7, 629–636. [Google Scholar] [CrossRef]
  63. Masih, I.; Maskey, S.; Mussá, F.; Trambauer, P. A review of droughts on the African continent: A geospatial and long-term perspective. Hydrol. Earth Syst. Sci. 2014, 18, 3635–3649. [Google Scholar] [CrossRef] [Green Version]
  64. Amri, R.; Zribi, M.; Lili-Chabaane, Z.; Duchemin, B.; Gruhier, C.; Chehbouni, A. Analysis of vegetation behavior in a North African semi-arid region, using SPOT-VEGETATION NDVI data. Remote Sens. 2011, 3, 2568–2590. [Google Scholar] [CrossRef] [Green Version]
  65. Zribi, M.; Dridi, G.; Amri, R.; Lili-Chabaane, Z. Analysis of the effects of drought on vegetation cover in a Mediterranean region through the use of SPOT-VGT and TERRA-MODIS long time series. Remote Sens. 2016, 8, 992. [Google Scholar] [CrossRef] [Green Version]
  66. Abiodun, B.J.; Adegoke, J.; Abatan, A.A.; Ibe, C.A.; Egbebiyi, T.S.; Engelbrecht, F.; Pinto, I. Potential impacts of climate change on extreme precipitation over four African coastal cities. Clim. Chang. 2017, 143, 399–413. [Google Scholar] [CrossRef]
  67. Blakeley, S.L.; Sweeney, S.; Husak, G.; Harrison, L.; Funk, C.; Peterson, P.; Osgood, D.E. Identifying Precipitation and Reference Evapotranspiration Trends in West Africa to Support Drought Insurance. Remote Sens. 2020, 12, 2432. [Google Scholar] [CrossRef]
  68. Tan, C.; Yang, J.; Li, M. Temporal-spatial variation of drought indicated by SPI and SPEI in Ningxia Hui Autonomous Region, China. Atmosphere 2015, 6, 1399–1421. [Google Scholar] [CrossRef] [Green Version]
  69. Palutikof, J.; Conte, M.; Casimiro Mendes, J.; Goodess, C.; Use, L. Climate and Climatic Change. Mediterr. Desertif. 1996, 43, 86. [Google Scholar]
  70. Conte, M.; Giuffrida, A.; Tedesco, S. The Mediterranean Oscillation: Impact on Precipitation and Hydrology in Italy; MOI: Rome, Italy, 1989. [Google Scholar]
  71. Jones, P.D.; Jónsson, T.; Wheeler, D. Extension to the North Atlantic Oscillation using early instrumental pressure observations from Gibraltar and south-west Iceland. Int. J. Climatol. 1997, 17, 1433–1450. [Google Scholar] [CrossRef]
  72. Ropelewski, C.F.; Jones, P.D. An extension of the Tahiti–Darwin southern oscillation index. Mon. Weather Rev. 1987, 115, 2161–2165. [Google Scholar] [CrossRef] [Green Version]
  73. Lee, S.-J.; Kim, N.; Lee, Y. Development of Integrated Crop Drought Index by Combining Rainfall, Land Surface Temperature, Evapotranspiration, Soil Moisture, and Vegetation Index for Agricultural Drought Monitoring. Remote Sens. 2021, 13, 1778. [Google Scholar] [CrossRef]
  74. Ye, Z.-X.; Cheng, W.-M.; Zhao, Z.-Q.; Guo, J.-Y.; Yang, Z.-X.; Wang, R.-B.; Wang, N. Spatio-Temporal Characteristics of Drought Events and Their Effects on Vegetation: A Case Study in Southern Tibet, China. Remote Sens. 2020, 12, 4174. [Google Scholar] [CrossRef]
  75. Ghoneim, E.; Dorofeeva, A.; Benedetti, M.; Gamble, D.; Leonard, L.; AbuBakr, M. Vegetation drought analysis in Tunisia: A geospatial investigation. J. Atmos. Sci. 2017, 1, 2. [Google Scholar] [CrossRef]
  76. Mesbahzadeh, T.; Mirakbari, M.; Mohseni Saravi, M.; Soleimani Sardoo, F.; Miglietta, M.M. Meteorological drought analysis using copula theory and drought indicators under climate change scenarios (RCP). Meteorol. Appl. 2020, 27, e1856. [Google Scholar] [CrossRef]
  77. Abbas, S.; Nichol, J.E.; Qamer, F.M.; Xu, J. Characterization of drought development through remote sensing: A case study in Central Yunnan, China. Remote Sens. 2014, 6, 4998–5018. [Google Scholar] [CrossRef] [Green Version]
  78. McDowell, N.; Pockman, W.T.; Allen, C.D.; Breshears, D.D.; Cobb, N.; Kolb, T.; Plaut, J.; Sperry, J.; West, A.; Williams, D.G. Mechanisms of plant survival and mortality during drought: Why do some plants survive while others succumb to drought? New Phytol. 2008, 178, 719–739. [Google Scholar] [CrossRef]
  79. Grünzweig, J.; Valentine, D.; Chapin, F. Successional changes in carbon stocks after logging and deforestation for agriculture in interior Alaska: Implications for boreal climate feedbacks. Ecosystems 2015, 18, 132–145. [Google Scholar] [CrossRef]
  80. Cong, D.; Zhao, S.; Chen, C.; Duan, Z. Characterization of droughts during 2001–2014 based on remote sensing: A case study of Northeast China. Ecol. Inform. 2017, 39, 56–67. [Google Scholar] [CrossRef]
  81. Hurrell, J.W. Decadal trends in the North Atlantic Oscillation: Regional temperatures and precipitation. Science 1995, 269, 676–679. [Google Scholar] [CrossRef] [Green Version]
  82. Osborn, T. Winter 2009/2010 temperatures and a record-breaking North Atlantic Oscillation index. Weather 2011, 66, 19–21. [Google Scholar] [CrossRef]
  83. Osborn, T. Simulating the winter North Atlantic Oscillation: The roles of internal variability and greenhouse gas forcing. Clim. Dyn. 2004, 22, 605–623. [Google Scholar] [CrossRef]
  84. Mariotti, A.; Zeng, N.; Lau, K.M. Euro-Mediterranean rainfall and ENSO—A seasonally varying relationship. Geophys. Res. Lett. 2002, 29, 59-1–59-4. [Google Scholar] [CrossRef] [Green Version]
  85. Mariotti, A.; Dell’Aquila, A. Decadal climate variability in the Mediterranean region: Roles of large-scale forcings and regional processes. Clim. Dyn. 2012, 38, 1129–1145. [Google Scholar] [CrossRef]
  86. Addi, M.; Asare, K.; Fosuhene, S.K.; Ansah-Narh, T.; Aidoo, K.; Botchway, C.G. Impact of Large-Scale Climate Indices on Meteorological Drought of Coastal Ghana. Adv. Meteorol. 2021, 2021, 8899645. [Google Scholar] [CrossRef]
  87. Egbuawa, O.; Anyanwu, J.; Amaku, G.; Onuoha, I. Assessment of the Teleconnection Between El Nino Southern Oscillation (ENSO) and West African Rainfall. Afr. Res. Rev. 2017, 11, 17–29. [Google Scholar] [CrossRef] [Green Version]
  88. Adeniyi, M.O.; Dilau, K.A. Assessing the link between Atlantic Niño 1 and drought over West Africa using CORDEX regional climate models. Theor. Appl. Climatol. 2018, 131, 937–949. [Google Scholar] [CrossRef]
Figure 1. Study area. Adapted from Ref.[11].
Remotesensing 13 04730 g001
Figure 2. Mean monthly precipitation (mm) over North and West Africa (1982–2018). (a) Jan, (b) Feb, (c) Mar, (d) Apr, (e) May, (f) Jun, (g) Jul, (h) Aug, (i) Sep, (j) Oct, (k) Nov, (l) Dec.
Remotesensing 13 04730 g002
Figure 3. Precipitation anomalies over North and West Africa.
Remotesensing 13 04730 g003
Figure 4. Spatial distribution of SPI–12 during various hydrological years from 1982 to 2018 over North and West Africa. (a) 1982–83, (b) 1983–84, (c) 1984–85, (d) 1985–86, (e) 1986–87, (f) 1987–88, (g) 1988–89, (h) 1989–90, (i) 1990–91, (j) 1991–92, (k) 1992–93, (l) 1993–94, (m) 1994–95, (n) 1995–96, (o) 1996–97, (p) 1997–98, (q) 1998–99, (r) 1999–2000, (s) 2000–01, (t) 2001–02, (u) 2002–03, (v) 2003–04, (w) 2004–05, (x) 2005–06, (y) 2006–07, (z) 2007–08, (ab) 2008–09, (ac) 2009–10, (ad) 2010–11, (ae) 2011–12, (af) 2012–13, (ag) 2013–14, (ah) 2014–15, (ai) 2015–16, (aj) 2016–17, (ak) 2017–18.
Remotesensing 13 04730 g004
Figure 5. (a) SPI–1 month, (b) SPI–3 months, (c) SPI–6 months, (d) SPI–12 months.
Remotesensing 13 04730 g005
Figure 6. Spatial distribution of drought magnitude over North and West Africa. (a) 1984–1987, (b) 1991–1992, (c) 1993–1994, (d) 1997–1998, (e) 2000–03, (f) 2008–11, (g) 2016–2017.
Remotesensing 13 04730 g006
Figure 7. Spatial drought risk map over North and West Africa regions. (a) 1984–1985, (b) 1985–1986, (c) 1986–1987, (d) 1991–1992, (e) 1993–1994, (f) 1997–1998, (g) 2000–01, (h) 2001–2002, (i) 2002–2003, (j) 2008–2009, (k) 2009–2010, (l) 2010–2011, (m) 2016–2017.
Remotesensing 13 04730 g007
Figure 8. JPDF for severity, duration, and magnitude of drought.
Remotesensing 13 04730 g008
Figure 9. Joint return years for duration corresponding to severity.
Remotesensing 13 04730 g009
Figure 10. Variability of MOI showing neutral, La Niña, and El Niño years from 1982 to 2018.
Remotesensing 13 04730 g010
Figure 11. Boxplots of mean duration and magnitude for MOI (A) for neutral years for (a) SPI–1, (b) SPI–3, (c) SPI–6, (d) SPI–12.
Remotesensing 13 04730 g011
Figure 12. Variability of NAOI showing neutral, La Niña, and El Niño years from 1982 to 2018.
Remotesensing 13 04730 g012
Figure 13. Boxplots of mean duration and magnitude of NAOI for (A) neutral, (B) La Niña (C), and El Niño for SPI–1, SPI–3, SPI–6, and SPI–12.
Remotesensing 13 04730 g013
Figure 14. Variability of SOI showing neutral, La Niña, and El Niño years from 1982 to 2018.
Remotesensing 13 04730 g014
Figure 15. Boxplots of mean duration and magnitude of SOI for (A) neutral, (B) La Niña (C), and El Niño for SPI–1, SPI–3, SPI–6, and SPI–12.
Remotesensing 13 04730 g015
Table 1. Description of SPI (McKee et al. [32]).
SPI ValueCategory
−2<Extreme drought
−1.99 to −1.5Severe drought
−1.49 to −1Moderate drought
−0.99 to 0Mild drought
0 to 0.99Mildly wet
1 to 1.49Moderately wet
1.5 to 1.99Very wet
2>Extremely wet
Table 2. SPI–12, annual precipitation (P), and annual precipitation anomaly (PA) over North and West Africa.
ConditionsYearSPI–12P (mm/yr)PA
Dry spells1984–1985−0.3312,917.95−35.52
1985–1986−0.9112,411.05−97.47
1986–1987−0.9512,370.62−102.41
1991–1992−0.7312,567.83−78.31
1993–1994−0.6612,628.98−70.84
1997–1998−0.1113,108.82−12.2
2000–2001−0.712,590−75.6
2001–2002−0.7812,522.9−83.8
2002–2003−1.31 **12,053.27−141.2
2008–2009−1.2312,124.13−132.54
2009–2010−1.76 **11,658.48−189.45
2010–2011−2.37 **11,120.93−255.14
2016–2017−1.7 **11,713.27−182.75
Wet spells1982–19830.513,647.6253.65
1983–19840.1113,307.6212.1
1987–19880.3913,554.442.26
1988–19890.4913,638.7852.57
1989–19900.6213,753.1866.56
1990–19910.5913,726.663.31
1992–19930.6213,756.8867.01
1994–19951.0914,172.83117.84
1995–19961.0414,126112.12
1996–19970.213,380.6721.03
1998–19990.7713,894.583.82
1999–20000.213,389.8522.15
2003–20041.0914,172.48117.8
2004–20050.1813,365.3219.15
2005–20060.3513,519.7338.02
2006–20070.8913,989.1795.4
2007–20080.5513,693.3559.24
2011–20120.6213,757.667.09
2012–20130.2713,449.0729.39
2013–20140.1913,371.919.96
2014–20151.51 *14,535.47162.16
2015–20161.23 *14,292.22132.43
2017–20180.0213,226.322.16
**: Dry years; *: wet years.
Table 3. Characteristics of drought.
Hydrological YearIntensityDurationMagnitude
1984–19870.72932.187
1991–19920.72710.727
1993–19940.65810.658
1997–19980.11310.113
2000–20030.93132.792
2008–20101.78735.361
2016–20171.69811.698
Table 4. Mann-Kendall test of 1–12 months’ SPI over North and West African countries.
CountrySeries\TestKendall’s Taup-ValueSen’s Slope
AlgeriaSPI–120.1560.1880.021
SPI–60.1460.217−0.5
SPI–30.1270.2840.009
SPI–10.1020.3940.006
TunisiaSPI–120.0540.6560.007
SPI–60.0570.636−0.5
SPI–30.1270.2840.007
SPI–10.1870.1120.006
MoroccoSPI–12−0.1650.162−0.02
SPI–6−0.1020.394−0.5
SPI–3−0.130.272−0.013
SPI–1−0.1240.297−0.007
LibyaSPI–12−0.1870.112−0.024
SPI–6−0.2730.019−0.5
SPI–3−0.2410.039−0.015
SPI–1−0.1840.118−0.007
EgyptSPI–12−0.060.617−0.006
SPI–6−0.0220.861−0.5
SPI–3−0.1490.207−0.011
SPI–10.0130.9250.001
MauritaniaSPI–12−0.0830.49−0.008
SPI–6−0.010.946−0.5
SPI–3−0.0670.579−0.005
SPI–1−0.0540.656−0.003
SenegalSPI–12−0.0570.636−0.012
SPI–6−0.070.561−0.5
SPI–3−0.1110.35−0.007
SPI–1−0.0480.695−0.002
MaliSPI–120.0950.4250.013
SPI–60.0160.903−0.5
SPI–30.1590.1790.012
SPI–10.2350.0450.009
NigerSPI–12−0.0510.675−0.006
SPI–60.0670.579−0.5
SPI–30.070.5610.008
SPI–10.0410.7350.004
SudanSPI–12−0.0980.409−0.009
SPI–6−0.1170.323−0.5
SPI–30.0290.8180.003
SPI–1−0.0570.636−0.002
GuineaSPI–12−0.0760.525−0.01
SPI–6−0.0860.473−0.5
SPI–3−0.0480.695−0.004
SPI–1−0.0630.598−0.004
Burkina FasoSPI–120.0480.6950.007
SPI–60.0570.636−0.5
SPI–30.0510.6750.004
SPI–10.0830.490.004
ChadSPI–12−0.0760.525−0.013
SPI–6−0.1270.284−0.5
SPI–3−0.0760.525−0.004
SPI–10.0510.6750.002
Sierra LeoneSPI–12−0.0050.9670
SPI–6−0.0530.652−0.5
SPI–30.0180.8810
SPI–10.0720.5390.001
Cote d’IvoireSPI–120.0760.5250.01
SPI–60.1050.379−0.5
SPI–30.130.2720.008
SPI–10.1810.1250.009
GhanaSPI–12−0.0130.925−0.003
SPI–600.989−0.5
SPI–3−0.0570.636−0.003
SPI–10.0480.6950.002
NigeriaSPI–12−0.1840.118−0.019
SPI–6−0.0760.525−0.5
SPI–30.0030.9890
SPI–1−0.0980.409−0.006
Table 5. Mann-Kendall test of annual precipitation over North and West African countries.
Series\TestKendall’s Taup-ValueSen’s Slope
Algeria0.1560.1881.375
Tunisia0.0540.6560.637
Morocco−0.1650.162−2.079
Libya−0.2060.079−0.922
Egypt−0.1050.379−0.821
Mauritania−0.0950.414−0.088
Senegal−0.0570.636−0.964
Mali0.1240.2971.352
Niger−0.0540.656−0.389
Sudan0.0190.8820.087
Guinea−0.0760.525−1.317
Burkina Faso0.0480.6950.619
Chad−0.0680.558−1.392
Sierra Leone−0.0050.9670.000
Cote d’Ivoire0.0700.5611.730
Ghana−0.0130.925−0.453
Nigeria−0.2220.058−2.469
Publisher’s Note: MDPI stays neutral with regard to jurisdictional claims in published maps and institutional affiliations.

