Technical Note

Landsat TM/OLI-Based Ecological and Environmental Quality Survey of Yellow River Basin, Inner Mongolia Section

1
College of Water Conservancy and Civil Engineering, Inner Mongolia Agricultural University, Hohhot 010018, China
2
Inner Mongolia Autonomous Region Key Laboratory of Big Data Research and Application of Agriculture and Animal Husbandry, Hohhot 010018, China
3
Key Laboratory of Water Resources Protection and Utilization of Inner Mongolia Autonomous Region, Hohhot 010018, China
*
Author to whom correspondence should be addressed.
Remote Sens. 2021, 13(21), 4477; https://doi.org/10.3390/rs13214477
Submission received: 1 October 2021 / Revised: 28 October 2021 / Accepted: 4 November 2021 / Published: 8 November 2021
(This article belongs to the Special Issue Remote Sensing in Natural Resource and Water Environment)

Abstract

:
The monitoring and maintenance of the Inner Mongolia section of the Yellow River Basin is of great significance to the safety and development of China’s Yellow River Economic Belt and to the protection of the Yellow River ecology. In this study, we calculated diagnostic values from a total of 520 Landsat OLI/TM remote sensing images of the Yellow River Basin of Inner Mongolia from 2001 to 2020. Using the RSEI and the GEE Cloud Computing Jigsaw, we analyzed the spatial and temporal distribution of diagnostic values representative of the basin’s ecological status. Further, Mantel and Pearson correlations were used to analyze the significance of environmental factors in affecting the ecological quality of cities along the Yellow River within the study area. The results indicated that the overall mean of RSEI values rose at first and then fell. The RSEI grade to land area ratio was calculated to be highest in 2015 (excellent) and worst in 2001. From 2001 to 2020, ecological quality monitoring process of main cities in the Inner Mongolia region of the Yellow River Basin. Hohhot, Baotou, and Linhe all have an RSEI score greater than 0.5, considered average. However, Dongsheng had its best score (0.60, good) in 2005, which then declined and increased to an average rating in 2020. The RSEI value for Wuhai reached excellent in 2010 but then became poor in 2020, dropping to 0.28. The analysis of ecological quality in the city shows that the greenness index (NDVI) carried the most significant impact on the ecological environment, followed by the humidity index (Wet), the dryness index (NDBSI), the temperature index (Lst), land use, and then regional gross product (RGP). The significance of this study is to provide a real-time, accurate, and rapid understanding of trends in the spatial and temporal distribution of ecological and environmental quality along the Yellow River, thereby providing a theoretical basis and technical support for ecological and environmental protection and high-quality development of the Yellow River Basin.

1. Introduction

At present, ecological degradation is occurring everywhere due to excessive exploitation of natural resources [1]. Ecological conservation is the primary goal of global sustainable development [2]. Rapid and quantitative evaluation of regional ecological quality provides technical support and necessary tools for these conservation efforts [3]. The Yellow River Basin is an important ecological function area yet also one of the most ecologically fragile, suffering from serious soil erosion [4]. It plays a pivotal role in the economic development, urban construction, and ecological protection of the major river areas in northern China and globally. The Yellow River is the largest river in northern China and an area of major government concern. With the ecological protection of the Inner Mongolia section of the basin an urgent priority [5], the Chinese government has launched a series of national strategies with high-quality economic development of the basin at the heart. Greater ecological security allows for sustainable construction and development projects, as well as contributing to the broader aim of carbon neutrality [6,7,8]. Achieving real-time, accurate, and rapid access to information quantifying the trends of ecological quality in the Inner Mongolia section of the Yellow River Basin is a limiting factor for development of the region.
Since its inception, remote sensing has been recognized as the most effective method for monitoring changes on the Earth’s land surface because of its advantages of rapid, periodic, and wide-area observations [9]. It provides a complete record of the state of the land surface and is used in a wide range of scientific research, into subjects such as land use/cover change, spatial and temporal distribution of surface energy, inversion of vegetation, soil evapotranspiration, and calculation of various singular vegetation indices [10,11,12,13]. However, experiments are time-consuming in the acquisition and screening of remote sensing images and single-view images (volume, time, cloud amount, etc.), as well as in computer processing [14]. The Google Earth Engine (GEE) platform has emerged recently and provides a reliable tool for the development of remote sensing technology, greatly reducing image data processing time and improving the efficiency of remote sensing work [15,16,17].
In order to satisfy the need for comprehensive consideration of ecosystems, a multifactor composite ecological index is established to monitor changes in the regional ecological environment and to provide a numerical assessment of its environmental status [18,19]. The remote sensing ecological index (RSEI) provides a more comprehensive view of ecological quality than the single ecological indices currently developed, such as NDVI, EVI, LAI, and FVC [20,21]. RSEI is a combination of Green, WET, Dry, and Lst values [22,23]. It is an objective method for monitoring and evaluating regional ecological environment quality, which is relatively simple in its calculation process [24]. In addition, RSEI is generally considered to be comparable and scalable across spatial–temporal scale distributions. The reliability and credibility of RSEI have been well documented in previous studies [16,22,23]. Many studies on the spatial–temporal distribution of ecological and environmental quality indices for watersheds, lakes, and urban RSEIs have been carried out in China, including for the Yangtze River Economic Zone, Guangdong–Hong Kong–Macao Bay Area, and Xiongan New Area [7,8,25,26].
We selected image data from the Landsat 5 TM and Landsat 8 OLI series and applied the RSEI model combined with the GEE platform to monitor and evaluate the spatial–temporal changes in ecological and environmental quality of the basin from 2001 to 2020. We also focused on the ecological environment of five cities along the Yellow River (Hohhot, Baotou, Wuhai, Dongsheng, and Linhe), combining social development data to provide insight into the distribution and changes in ecological quality in the five cities. We then evaluated the impact of natural factors on human activities (e.g., urban infrastructure construction, natural resource extraction, and economic development) and on ecological quality, while also assessing the reciprocal impact of human activities on the environment of the basin. Exploring the relationship between economic development and ecological quality is necessary for the restoration processes of mountains, forests, lakes, grasses, and sands, and their community of life [27]. The objective of the study is to better understand this relationship, which will provide a theoretical basis to support ecological and environmental protection initiatives and high-quality development in the Yellow River Basin.

2. Data and Method

2.1. Study Area

The Yellow River in Inner Mongolia is located in the middle of the Yellow River Basin (106.21°–112.47°E, 37.35°–41.51°N), and the study area covers an area of about 141,500 km2, located in the transition zone between the Mongolian Plateau and the Yellow River. The Yellow River is a significant ecological barrier in China, preventing further desertification of the Loess Plateau (Figure 1a,c). The Inner Mongolia section of the Yellow River runs from west to east across the cities of Wuhai, Bayannur, Erdos, Baotou, and Hohhot. The five urban areas, Hohhot, Baotou, Wuhai, Dongsheng, and Linhe, which have developed along the Yellow River were selected for ecological studies (Figure 1c).
The average altitude of the study area is 1000 m and the highest altitude is 2334 m, which leads to large climatic differences across complex geomorphological units. The annual precipitation ranges from 400 to 800 mm, with precipitation concentrated between June and September, accounting for about 80% of the annual rainfall. As one of the most fragile ecological areas in China, the Yellow River Basin is threatened by reduced runoff, serious turbidity of water bodies, increased soil erosion, land desertification, and degradation of vegetation cover. Currently, the main land types in the watershed are grasslands (53.99%), croplands (16.90%), bare lands (15.93%), woodlands (5.07%), buildings (3.81%), and waters (2.52%). It is important to note that the carbon sequestration capacity increases with the expansion of vegetation cover (Figure 1c–e).

2.2. Data

2.2.1. Landsat Time Series

Landsat OLI/TM data for the Yellow River Basin in the Inner Mongolia section were provided online by Google Earth Engine and selected for less than 10% cloudiness. All image preprocessing and RSEI calculations were completed by the Google Earth Engine platform (https://earthengine.google.com, accessed on 28 September 2021). The 520 Landsat data images used in this study were taken from the years 2001, 2005, 2010, 2015, and 2020. To avoid the effects of seasonal differences and vegetation growth, the vegetation growth maturity period data from September–October were selected for each of the five years [28].

2.2.2. Other Data

The land use data were obtained from the Resource and Environment Science Data Center of the Chinese Academy of Sciences (http://www.resd.cn/, accessed on 20 September 2021) for the years 2000 (there was no land use data available for 2001), 2005, 2010, 2015, and 2020, with a spatial resolution of 30 m (Figure 1d). Regional gross product (RGP) for the five cities in the Inner Mongolia section of the Yellow River from 2001 to 2020 was obtained from the China Urban Statistical Yearbook. Precipitation data were obtained from the China Meteorological Data Network (http://data.cma.cn/, accessed on 25 September 2021).

2.3. Method

2.3.1. RSEI Calculation

Based on the principal component analysis (PCA) transformation, RSEI is constructed to characterize the ecological quality of a given area, combining four key natural indicators of ecosystem quality: greenness index (NDVI), wet index (Wet), dry index (NDBSI), and land surface temperature index (Lst) [14,18,19,24]. These four indexes are synthesized into a 4-band image. According to the contribution of each component, the first principal component (PC1) is calculated by using the PCA function in GEE. Generally, the RSEI is obtained after the positive and negative transposition of PC1. Meanwhile, to avoid the influence of lakes and rivers on the RSEI, we used the modified normalized difference water index (MNDWI) to exclude the interference of water information [29].
R S E I 0 = P C 1 [ f ( N D V I , W e t , N D B S I , L s t ) ] ,
R S E I = 1 R S E I 0 ,
where: RSEI0 is the result of the PC1 calculation, NDVI is the greenness index, Wet is the humidity index, NDBSI is the dryness index, and Lst is the temperature index.
  • Green Index
N D V I = ( N I R R E D ) / ( N I R + R E D ) ,
where NIR and RED represent the reflectance of Band 5 and Band 4 in Landsat 8; and the reflectance of Band 4 and Band 3 in Landsat 5, respectively.
  • Wet Index
The images chosen for this study were acquired using Landsat 8 OLI and Landsat 5 TM, so the wet index was calculated using the following equation:
W e t = a · B L U E + b · G R E E N + c · R E D + d · N I R + e · S W I R 1 + f · S W I R 2
where the values of the a–f parameter in TM are 0.0315, 0.2021, 0.3012, 0.1594, −0.6806, −0.6109; and OLI parameter values are 0.1511, 0.1973, 0.3283, 0.3407, −0.7117, −0.4559.
  • Dry Index
NDBSI is the representative of the dryness index in the RSEI model, which can be calculated using the following formula:
N D B S I = ( S I + I B I ) / 2 ,
S I = [ ( N I R + R E D ) ( N I R + B L U E ) ] / [ ( N I R + R E D ) + ( N I R + B L U E ) ] ,
I B I = { [ 2 S W I R 2 / ( S W I R 1 + N I R ) ] [ N I R / ( N I R + R E D ) + G R E E N / ( S W I R 1 + G R E E N ) ] } / { [ 2 S W I R 2 / ( S W I R 1 + N I R ) ] + [ N I R / ( N I R + R E D ) + G R E E N / ( S W I R 1 + G R E E N ) ] } I B I 2
where Landsat OLI/TM corresponds to the reflectance of each band, SI is the bare earth index, and IBI is the building index.
  • Lst Index
Land surface temperature is a proxy for the heat index in the RSEI model and is calculated as follows:
L s t = T / [ 1 + ( λ T / ρ ) L n ε ] 273.15 ,
T = K 2 / ln ( K 1 / S W I R 1 + 1 ) ,
S W I R 1 = g a i n × D N + b i a s
where gain and bias denote the band gain and offset values, respectively. TM has gain = 0.055 and bias = 1.18243. OLI has gain = 3.342 × 10⁻⁴ and bias = 0.1. T indicates the bright surface temperature. K1 and K2 are calibration parameters for surface temperature. TM has K1 = 607.76 Wm−2 Sr−1 μm−1 and K2 = 1260.56 K. OLI has K1 = 774.89 Wm−2 Sr−1 μm−1 and K2 = 1321.08 K.
Since these four indices have their own dimensions and each accounts for an unbalanced weight, there is no way to bring them in directly for principal component analysis, so they need to be normalized to (0, 1) and then PCA is performed. The following normalization formula is used for each indicator:
E I i = ( I i I min ) / ( I max I min ) ,
where EIi denotes the normalized result for each index (0, 1). Ii denotes the DN value at each image element i, Imax and Imin are the maximum and minimum values for each image element, respectively.

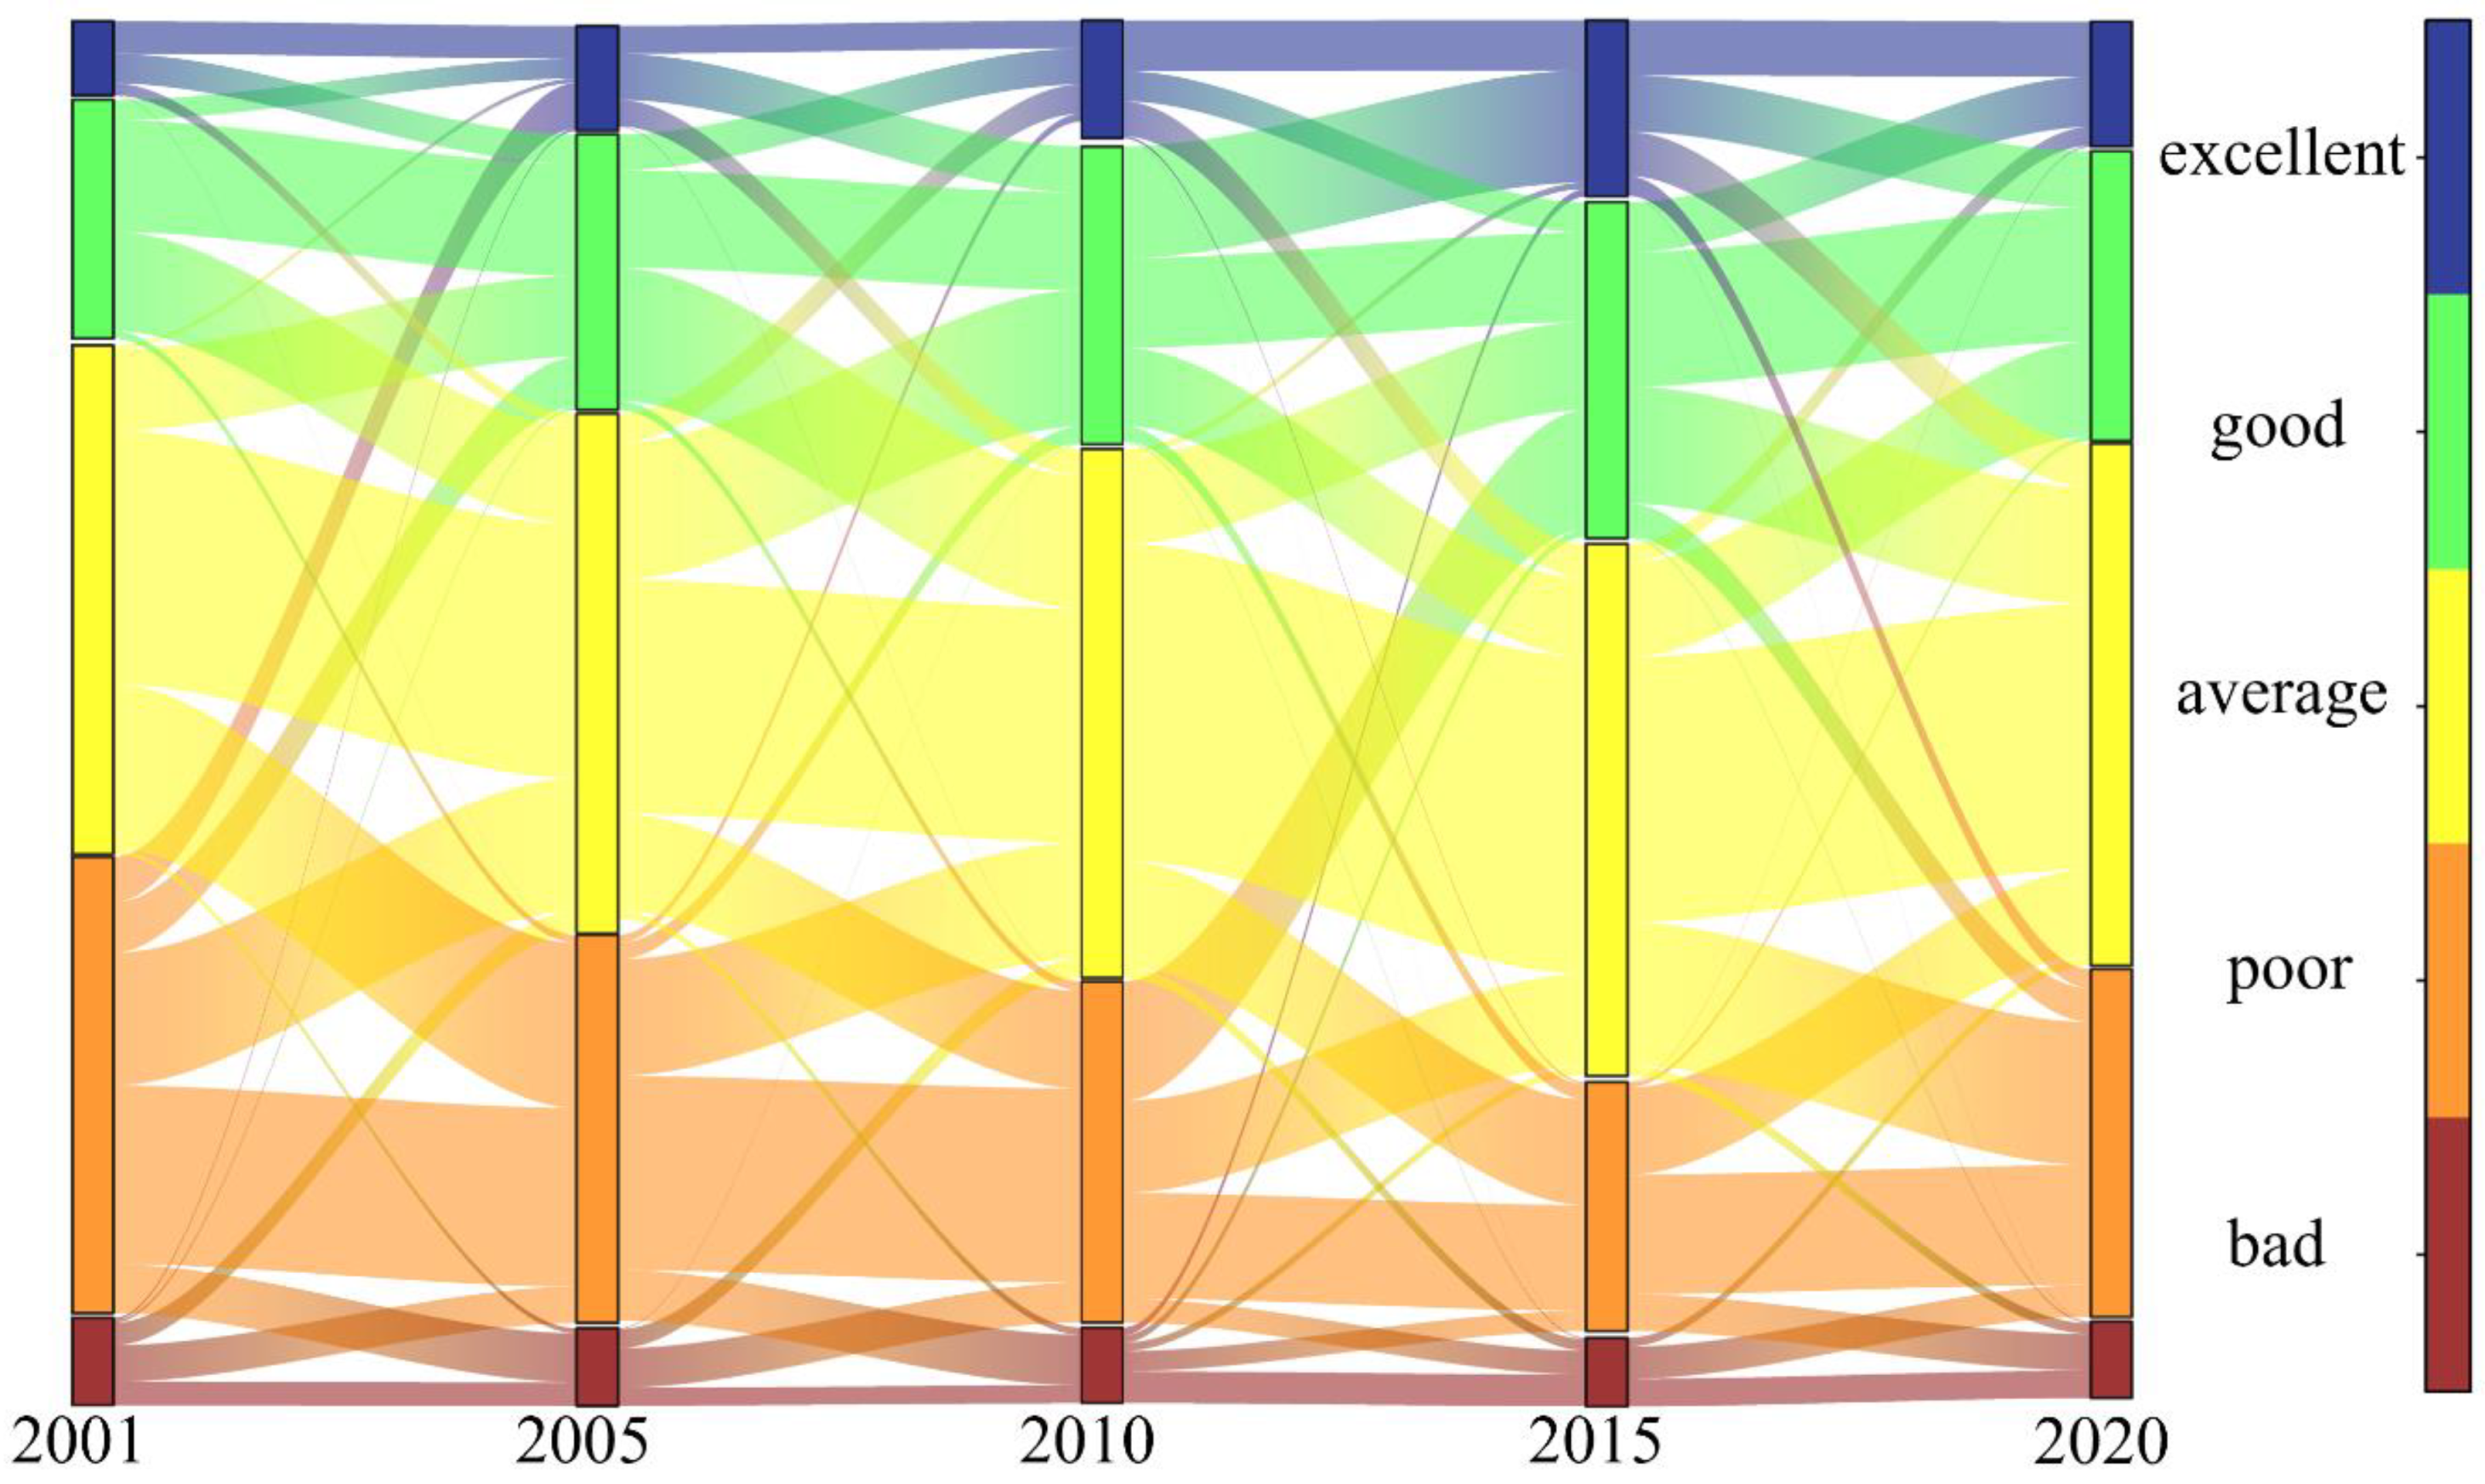
2.3.2. A Transfer Matrix Represented by Sankey Graph

Sankey is produced by the Networkd3 package in R. Sankey plots have been commonly used to represent the flow of different land use/cover changes between years, using directional lines between different land classes to represent the area of change of moving features [30]. Of course, Sankey is also applicable to remote sensing ecological indices to monitor changes in ecological quality over long time series, thus allowing quantitative visualization of changes in ecological quality [31]. In this study, the RSEI transfer process for 2001–2020 was calculated using remote sensing image data; the transfer matrix equation follows:
A = [ A 11 A 12 A 1 n A 21 A 22 A 2 n A n 1   A n 2 A n n ] ,
where A is the transfer matrix that, when combined with a Sankey diagram, is used to analyze the transfer situation of two time periods before and after different grades of RSEI, for example, the RSEI transfer process from 2001 to 2005 and the transfer process from 2005 to 2010.

2.3.3. Correlation Analysis of Influencing Factors of Ecological Quality

In order to explore which factors influence quality of the cities within the study area, Mantel and Pearson correlation analysis was conducted by combining R language for RSEI, NDVI, Wet, NDBSI, Lst, Precipitation, Land Use, and Regional Gross Product (RGP) for the Hohhot, Baotou, Wuhai, Dongsheng, and Linhe cities [12].

2.3.4. RSEI Flow Chart

RSEI is constructed on the basis of a principal component transformation, specifically elaborated by concentrating the main information provided by the four indices of Green, Dry, Wet, and Lst in the first principal components in order to be able to describe them within a single indicator. The method integrates information closely related to these four indices, which is advantageous when constructing RSEI. The higher the RSEI value, the better the ecological condition. We have divided the RSEI into five ecological quality classes: bad (0.00–0.20), poor (0.20–0.40), average (0.40–0.60), good (0.60–0.80), and excellent (0.80–1.00) [21,22,23]. Figure 2 shows the sequence of the process of calculating the ecological quality of the Yellow River Basin in the Inner Mongolia section using the Google Earth Engine.

3. Results

3.1. Temporal and Spatial Distribution Quality in the Yellow River, Inner Mongolia Section

RSEI images for 2001–2020 (Figure 3a–e) show the spatial variability of ecological conditions within the study area. In terms of spatial and temporal distribution, changes in the ecological and environmental quality of the basin show a trend of first rising and then falling. However, the overall changes show a large change in ecosystem quality before 2015 and a small change after 2015. The mean value and distribution of RSEI in the basin during the 20-year period from 2001 to 2020 (Figure 3f) show that the overall ecological quality of the Yellow River Basin is developing in a positive direction [2,4,30]. The mean value of RSEI ranged from 0.392 in 2001 to 0.452 in 2020, with a trend of an average annual increase of 0.003/a and a 20-year growth rate of 15.3%, with a peak in the mean value in 2015 (0.496) and a minimum in 2001 (0.392).
Overall, the ecological environment quality is divided into two regions, north and south, using the Yellow River as the boundary. The ecological environment quality of the basin gradually improves from west to east, and the north is in better condition than the south. This is mainly due to the fact that the Loop Plain (located on the north coast of the Yellow River, Inner Mongolia) and Wuliangsu Lake (located in Bayannur, 108.54°E, 41°N) in the Yellow River Irrigation Area are nourished by the Yellow River and have strong ecological self-regulation. The southern region has been affected by the Maowusu and Kubuqi deserts and the Loess Plateau, but the uncontrolled exploitation of surface resources in earlier years has also contributed to year-by-year deterioration in ecological quality. There was some improvement between 2001 and 2015, but due to the excessive exploitation of economic resources in the early years, the quality of ecological environment has not been effectively restored [3,32].

3.2. Analysis of the Current Ecological Quality of the Yellow River Basin, Inner Mongolia Section

In this study, the area conversion matrix of different levels of RSEI for five time periods were combined with Sankey plots to assess and analyze changes in ecological and environmental quality of the study area between 2001 to 2020 (Figure 4). As shown below, the ecological environment of the basin has improved to varying degrees. In particular, the average, good, and excellent lines in RSEI accounted for 10.5% of net transfers in 2015. Although RSEI scores decreased from 2015 to 2020, they show an overall gradual improvement of the ecosystem.
To provide a more comprehensive view of the changes in the quality of the ecological environment in the study area, the statistical information on the proportion of land area occupied by the five classes of RSEI values is represented by the ecological index area bar ratio map (Figure 4). The proportion of area occupied by bad and poor decreases gradually from 2001 to 2015 and increases from 2015 to 2020. The share during 2015 was only 23.3%, while the excellent class reached 12.9%, which was the highest level measured. Meanwhile, the worst ecological quality was in 2001, with bad and poor occupying the largest area of land at 39.9% and excellent occupying only 5.4% of the land proportion.

3.3. Evaluation of Ecological Changes in Major Cities of the Yellow River Basin, Inner Mongolia Section

To gain insight into the impact of human activities and economic development on ecosystems and environmental quality, it is important for us to study the changes in the ecological quality of cities along the Yellow River in the Inner Mongolia section. Figure 5 depicts the distribution of RSEI ratings and their changes between 2001 and 2020. Table 1 shows the statistical results.
The mean RSEI values for Hohhot, Baotou, and Linhe are average and good. In contrast, Dongsheng achieved its highest RSEI value during 2005 (0.6), while Wuhai had its best ecological quality in 2010, but with a mean RSEI value of only 0.37. The spatial and temporal distribution of RSEI for the five cities was found to basically correspond with the spatial and temporal distribution of RSEI of the Yellow River Basin more broadly, with the ecological and environmental quality reaching the optimum in 2015, with the exception of the Dongsheng area, where the RSEI reached its optimum in 2005.
Mantel analysis of RSEI with different factors revealed that RSEI was significantly correlated with NDVI in all five cities (Figure 6), with Baotou’s RSEI significantly correlated with Wet and RGP, and Wuhai’s RSEI significantly correlated with Lst. However, the factors of acquisition were also related to each other. According to Pearson correlation analysis, NDVI is positively correlated with Wet and Land use, with an r value close to 0.8, and negatively correlated with NDBSI, Lst, and RGP, with r close to −1. Wet was negatively correlated with RGP, NDBSI with Precipitation, and Lst with Precipitation. NDBSI is positively correlated with Lst and RGP. The results show that NDVI is the key factor governing the quality of RSEI scores, while Wet, NDBSI, Lst, Land use, and RGP have an important role in optimizing the quality of the ecological environment.

4. Discussion

4.1. Feasibility of RSEI in Assessing the Ecological Quality of the Yellow River Basin, Inner Mongolia

During the study period, the eco-environmental quality of the Yellow River Basin in Inner Mongolia was calculated by the RSEI remote sensing index [33]. Compared to traditional methods used to evaluate the eco-environmental quality, evaluation can be done on a much larger scale [34]. The multifactor index method also reflects the eco-environmental quality more comprehensively than the single-factor index method, which avoids the one-sidedness of single-factor evaluation of ecological quality [35].
The green degree and humidity load are positive in the four indexes of RSEI in the Yellow River Basin, Inner Mongolia, and the average greenness load (0.658) was greater than the wetness (0.594). Lst and dryness loads are negative, and the absolute value of the average Lst load (0.452) was greater than that of dryness (0.362). From 2001 to 2020, the contribution of the four indicators on the first principal component (PC1) reached a maximum of 92.37% (2015) and a minimum of 87.35% (2001), with an average contribution of 89.58%. This indicates that the study area is ecologically fragile and these results are consistent with the situation on the ground and with the laws of the ecological environment (Table 2) [36]. It can be seen that more than 87% of the information for each indicator feature is concentrated on PC1, indicating that the use of PC1 to construct RSEI is also feasible in the Yellow River Basin [2,4].
The eco-environmental quality of each region has deteriorated to varying degrees due to large-scale economic development and human construction together with the exploitation of energy resources within the Yellow River Basin and the cities along the route. The Chinese government has invested huge human, material, and financial resources in the ecological environment of the northwest region, doing its best to restore the state of the environment through initiatives such as the Three Northern Protected Forests shelterbelt, return of cultivated land to forest and grasses, and treatment of one lake and two seas. However, there are no effective measures to improve the quality of the ecological environment instantaneously, and cycles within the ecological recovery process are expected [37].

4.2. Influencing Factors of Ecological change in the Yellow River Basin, Inner Mongolia

Google Earth Engine platform makes it easier to study the dynamics of large-scale spatial and temporal processes on the Earth’s surface, such as deforestation, drought, disasters, disease, food security, water management, climate monitoring, and environmental protection [38,39]. Its greatest advantage is that it has a huge database of image resources, providing a convenient and accessible resource for remote sensing researchers [40]. The vast majority of the tasks in this study were completed in Google Earth Engine [41].
The Yellow River Basin of Inner Mongolia has nearly one-sixth of China’s natural resource reserves, including coal, natural gas, and oil [42]. As such, the impact of the lucrative economic development and human activities upon the eco-environmental quality of the basin is being given increasingly more attention by researchers [4]. According to the analysis of this study, the bad-to-poor eco-environmental quality of the basin is concentrated south of the Yellow River, which is due to a combination of relatively poor natural environmental conditions of the region and the damage caused by long-term human exploitation of natural resources (Figure 3) [43]. However, the upper and middle reaches of the Yellow River are a region where the quality of the ecological environment has improved the fastest in China during the last 20 years (2001–2020), especially in 2015 (Figure 3f). The analysis of the main urban influences of the RSEI along the Yellow River shows that human factors play an important role in this region compared to the influence of natural factors such as Precipitation and Lst (Figure 5 and Figure 6).
The implementation of measures to manage and restore the ecological quality of the Yellow River Basin is of great interest to researchers and government departments at home and abroad [37,44]. The results of this study show an inflection point in 2015, with a decline in RSEI [45]. We should give attention to the management and restoration of mountains, water, forests, fields, lakes, grass, and sand, which can help to improve the quality of the ecological environment and, at the same time, are crucial to further promote a good relationship between humans and nature [46,47].

5. Conclusions

We evaluated the trend of ecological quality changes and environmental status of the Yellow River Basin in the Inner Mongolia section from 2001 to 2020, and analyzed the main controlling factors of ecological quality in the cities along the river, taking into account the area of land types and the total regional economic value. These findings provide meaningful information to local governments for more targeted ecological restoration efforts in the Yellow River Basin by implementing effective management measures in areas sensitive to RSEI change and key feature types that affect RSEI change. The main conclusions of this paper follow:
First, we calculate the RSEI based on the Google Earth engine. The RSEI calculation using Google Earth Engine, where the average contribution of PC1 is 89.58%, shows that RSEI is a feasible tool for rapid assessment of ecological quality over large spatial and temporal distributions. In terms of spatial distribution, the overall change in RSEI from 2001 to 2020 shows a “rising at first and then falling” trend, with the best development of RSEI in 2015. Second, for the statistics on the ratio of RSEI grade to land area, the percentage of excellent in 2015 was 12.9%, the highest ever, and the worst was in 2001, when bad and poor constituted 39.9%. Sankey analysis found a net transfer of 10.5% to the average, good, and excellent lines in 2015, with a decline from 2015 to 2020. Finally, the ecological quality of cities along the Yellow River in Inner Mongolia was analyzed. The RSEI of Hohhot, Baotou, and Linhe along the Yellow River of the Inner Mongolia section was greater than 0.5, while Dongsheng was the best in 2005 (0.60) and Wuhai was the worst in 2010 (0.37). Analysis of the influence of various factors on the urban RSEI revealed that NDVI was the main factor constraining the ecological environment.

Author Contributions

Conceptualization, W.G. and S.Z.; methodology, W.G. and X.R.; validation, W.G., S.Z. and X.R.; formal analysis, W.G., X.L.; investigation, W.G., X.R. and R.L.; resources, W.G.; data curation, W.G., X.L.; writing—original draft preparation, W.G.; writing—review and editing, S.Z., X.L.; visualization, W.G.; supervision, S.Z.; project administration, S.Z.; funding acquisition, S.Z. All authors have read and agreed to the published version of the manuscript.

Funding

This research was funded by Technological Achievements of Inner Mongolia Autonomous Region of China (Grant no. 2020CG0054 and 2020GG0076) and Natural Science Foundation of Inner Mongolia Autonomous Region of China (Grant no. 2019JQ06).

Institutional Review Board Statement

Not applicable.

Informed Consent Statement

Not applicable.

Data Availability Statement

The data presented in this study are available on reasonable from the corresponding author.

Acknowledgments

We thank the anonymous reviewers for their constructive feedback.

Conflicts of Interest

The authors declare no conflict of interest.

References

  1. Zhu, Y.; Luo, P.; Su, F.; Zhang, S.; Sun, B. Spatiotemporal analysis of hydrological variations and their impacts on vegetation in semiarid areas from multiple satellite data. Remote Sens. 2020, 12, 4177. [Google Scholar] [CrossRef]
  2. Kamara, D.; Yang, Z.; Yusuf, A. Ecological geospatial monitoring and assessment of surface water environment using remote sensing ecological index model (RSEI) in Freetown, Sierra Leone, from 2010 to 2018. Glob. Sci. J. 2020, 12, 2320–9186. [Google Scholar]
  3. Duan, W.; Maskey, S.; Chaffe, P.; Luo, P.; He, B.; Wu, Y.; Hou, J. Recent advancement in remote sensing technology for hydrology analysis and water resources management. Remote Sens. 2021, 13, 1097. [Google Scholar] [CrossRef]
  4. Yang, Z.; Tian, J.; Li, W.; Su, W.; Guo, R.; Liu, W. Spatio-temporal pattern and evolution trend of ecological environment quality in the Yellow River Basin. Acta Ecol. Sin. 2021, 41, 514. [Google Scholar]
  5. Han, X.; Atsushi, T.; Mitsuru, T.; Li, S. Effects of land-cover type and topography on soil organic carbon storage on Northern Loess Plateau, China. Acta Agric. Scand. Sect. B Soil Plant Sci. 2010, 60, 326–334. [Google Scholar] [CrossRef]
  6. Luo, P.; Xu, C.; Kang, S.; Huo, A.; Lyu, J.; Zhou, M.; Nover, D. Heavy metals in water and surface sediments of the Fenghe River Basin, China: Assessment and source analysis. Water Sci. Technol. 2021. [Google Scholar] [CrossRef]
  7. Zhang, Y.; Luo, P.; Zhao, S.; Kang, S.; Wang, P.; Zhou, M.; Lyu, J. Control and remediation methods for eutrophic lakes in recent 30 years. Water Sci. Technol. 2020, 81, 1099–1113. [Google Scholar] [CrossRef]
  8. Xiong, Y.; Xu, W.; Huang, S.; Wu, C.; Kou, W. Ecological environment quality assessment of Xishuangbanna rubber plantations expansion (1995–2018) based on Multi-temporal Landsat imagery and RSEI. Geocarto Int. 2020, 1–23. [Google Scholar] [CrossRef]
  9. Liu, X.; Zhang, X.; He, Y.; Luan, H. Monitoring and assessment of ecological change in coastal cities based on RSEI. ISPRS—Int. Arch. Photogramm. Remote Sens. Spat. Inf. Sci. 2020, 42, 461–470. [Google Scholar] [CrossRef] [Green Version]
  10. Shan, W.; Jin, X.; Ren, J.; Wang, Y.; Xu, Z.; Fan, Y.; Gu, Z.; Hong, C.; Lin, J.; Zhou, Y. Ecological environment quality assessment based on remote sensing data for land consolidation. J. Clean. Prod. 2019, 239, 118126. [Google Scholar] [CrossRef]
  11. Ermida, S.L.; Soares, P.; Mantas, V.; Göttsche, F.-M.; Trigo, I.F. Google Earth engine open-source code for land surface temperature estimation from the landsat series. Remote Sens. 2020, 12, 1471. [Google Scholar] [CrossRef]
  12. Szewczak, K.; Łoś, H.; Pudełko, R.; Doroszewski, A.; Gluba, Ł.; Łukowski, M.; Rafalska Przysucha, A.; Słomiński, J.; Usowicz, B. Agricultural drought monitoring by MODIS potential evapotranspiration remote sensing data application. Remote Sens. 2020, 12, 3411. [Google Scholar] [CrossRef]
  13. Firozjaei, M.; Kiavarz, M.; Homaee, M.; Arsanjani, J.; Alavipanah, S. A novel method to quantify urban surface ecological poorness zone: A case study of several European cities. Sci. Total Environ. 2021, 757, 1. [Google Scholar] [CrossRef] [PubMed]
  14. Wang, Y.; Zhao, Y.; Wu, J. Dynamic monitoring of long time series of ecological quality in urban agglomerations using Google Earth Engine cloud computing: A case study of the Guangdong-Hong Kong-Macao Greater Bay Area. Acta Ecol. Sin. 2020, 40, 8461–8473. [Google Scholar]
  15. Huang, H.; Chen, W.; Zhang, Y.; Qiao, L.; Du, Y. Analysis of ecological quality in Lhasa Metropolitan Area during 1990–2017 based on remote sensing and Google Earth Engine platform. J. Geogr. Sci. 2021, 31, 265–280. [Google Scholar] [CrossRef]
  16. Hang, X.; Li, Y.; Luo, X.; Xu, M.; Han, X. Assessing the ecological quality of Nanjing during its urbanization process by using satellite, meteorological, and socioeconomic data. J. Meteorol. Res. 2020, 34, 280–293. [Google Scholar] [CrossRef]
  17. Li, N.; Wang, J.; Qin, F. The improvement of ecological environment index model RSEI. Arab. J. Geosci. 2020, 13, 1–14. [Google Scholar]
  18. Xu, H. A remote sensing index for assessment of regional ecological changes. China Environ. Sci. 2013, 33, 889–897. [Google Scholar]
  19. Xu, H.; Wang, Y.; Guan, H.; Shi, T.; Hu, X. Detecting ecological changes with a remote sensing based ecological index (RSEI) produced time series and change vector analysis. Remote Sens. 2019, 11, 2345. [Google Scholar] [CrossRef] [Green Version]
  20. Hang, X.; Luo, X.; Cao, Y.; Li, Y. Ecological quality assessment and the impact of urbanization based on RSEI model for Nanjing, Jiangsu Province, China. J. Appl. Ecol. 2020, 31, 219–229. [Google Scholar]
  21. Mu, D.; Luo, P.; Lyu, J.; Zhou, M.; Huo, A.; Duan, W.; Nover, D.; He, B.; Zhao, X. Impact of temporal rainfall patterns on flash floods in Hue City, Vietnam. J. Flood Risk Manag. 2020, 14, e12668. [Google Scholar] [CrossRef]
  22. Gao, P.; Kasimu, A.; Zhao, Y.; Lin, B.; Chai, J.; Ruzi, T.; Zhao, H. Evaluation of the temporal and spatial changes of ecological quality in the Hami oasis based on RSEI. Sustainability 2020, 12, 7716. [Google Scholar] [CrossRef]
  23. Yuan, B.; Fu, L.; Zou, Y.; Zhang, S.; Chen, X.; Li, F.; Deng, Z.; Xie, Y. Spatiotemporal change detection of ecological quality and the associated affecting factors in Dongting Lake Basin, based on RSEI. J. Clean. Prod. 2021, 302, 126995. [Google Scholar] [CrossRef]
  24. Xu, H.; Wang, M.; Shi, T.; Guan, H.; Fang, C.; Lin, Z. Prediction of ecological effects of potential population and impervious surface increases using a remote sensing based ecological index (RSEI). Ecol. Indic. 2018, 93, 730–740. [Google Scholar] [CrossRef]
  25. Yang, J.; Wu, T.; Pan, X. Ecological quality assessment of Xiongan New Area based on remote sensing ecological index. Chin. J. Appl. Ecol. 2019, 30, 277–284. [Google Scholar]
  26. Hui, Y.; Ying, L.; Yao, L.; Yang, L. Eco-environmental quality assessment in China’s 35 major cities based on remote sensing ecological index. IEEE Access 2019, 7, 51295–51311. [Google Scholar]
  27. Zhu, Q.; Guo, J.; Guo, X.; Chen, L.; Han, Y.; Liu, S. Relationship between ecological quality and ecosystem services in a red soil hilly watershed in southern China. Ecol. Indic. 2021, 121, 107119. [Google Scholar] [CrossRef]
  28. Gonzalo, M.; Luis, G.; Julia, A.; Jordi, M.; Gustau, C. Multitemporal cloud masking in the Google Earth engine. Remote Sens. 2018, 10, 1079. [Google Scholar]
  29. Xu, H. Research on extracting water body information using Modified Normalized Difference Water Index (MNDWI). J. Remote Sens. 2005, 5, 589–595. [Google Scholar]
  30. Ariken, M.; Zhang, F.; Liu, K.; Fang, C.; Kung, H. Coupling coordination analysis of urbanization and eco-environment in Yanqi Basin based on multi-source remote sensing data. Ecol. Indic. 2020, 114, 106331. [Google Scholar] [CrossRef]
  31. Yu, S.; Wang, F.; Qu, M.; Yu, B.; Zhao, Z. The effect of land use/cover change on soil erosion changeby spatial regression in Changwu county on the loess plateauin China. Forests 2021, 12, 1209. [Google Scholar] [CrossRef]
  32. Han, P.; Wang, Y.; Li, D. Responses to soil and water conservation in Hekouzhen-Longmen section in the middle reaches of the Yellow river. J. Basic Sci. Eng. 2020, 28, 505–521. [Google Scholar]
  33. Tian, Z.; Ren, Z.; Wei, H. Driving mechanism of the spatiotemporal evolution of vegetation in the Yellow River basin from 2000 to 2020. Environ. Sci. Available online: https://doi.org/10.13227/j.hjkx (accessed on 17 August 2021).
  34. Zhao, W.; Yan, T.; Ding, X.; Peng, S.; Chen, H.; Fu, Y.; Zhou, Z. Response of ecological quality to the evolution of land use structure in Taiyuan during 2003 to 2018. Alex. Eng. J. 2021, 60, 1777–1785. [Google Scholar] [CrossRef]
  35. Julio, N.; Karem, C.; Rachid, L. A novel index for assessment of riparian strip efficiency in agricultural landscapes using high spatial resolution satellite imagery. Sci. Total. Environ. 2018, 644, 1439–1451. [Google Scholar]
  36. Zhu, D.; Chen, T.; Zhen, N.; Niu, R. Monitoring the effects of open-pit mining on the eco-environment using a moving window-based remote sensing ecological index. Environ. Sci. Pollut. Res. 2020, 27, 15716–15728. [Google Scholar] [CrossRef]
  37. Xi, J. Address by general secretary Xijinping at the symposium on ecological protection and quality development of the Yellow River basin. Shanxi Water Resour. 2020, 9, 1–3. [Google Scholar]
  38. Noel, G.; Matt, H.; Mike, D.; Simon, I.; David, T.; Rebecca, M. Google Earth Engine: Planetary-scale geospatial analysis for everyone. Remote Sens. Environ. 2017, 202, 18–27. [Google Scholar]
  39. Bethany, M.; Arko, L.; Jagannath, A. Object-based random forest classify-cation of Landsat Etm+ and Worldview-2 satellite imagery for mapping lowland native grassland communities in Tasmania, Australia. Int. J. Appl. Earth Obs. Geoinf. 2018, 66, 46–55. [Google Scholar]
  40. Dong, J.; Xiao, X.; Menarguez, M.; Zhang, G.; Qin, Y.; Thau, D.; Biradar, C.; Moore, B. Mapping paddy rice planting area in northeastern Asia with Landsat 8 images, phenology-based algorithm and Google Earth Engine. Remote Sens. Environ. 2016, 185, 142–154. [Google Scholar] [CrossRef] [Green Version]
  41. He, Z.; Zhang, M.; Wu, B.; Xing, Q. Extraction of summer crop in Jiangsu based on Google Earth Engine. J. Geo-Inf. Sci. 2019, 21, 752–766. [Google Scholar]
  42. Zhi, Y. Quantitative Assessment of Groundwater and Surface Water Interactions in the Hailiutu River Basin, Erdos Plateau, China; CRC Press: Boca Raton, FL, USA, 2018. [Google Scholar]
  43. Zha, X.; Luo, P.; Zhu, W.; Wang, S.; Lyu, J.; Zhou, M.; Huo, A.; Wang, Z. A bibliometric analysis of the research on Sponge City: Current situation and future development direction. Ecohydrology 2021, e2328. [Google Scholar] [CrossRef]
  44. Xi, J. The Construction of Beautiful China Needs to Continue to Explore the Systematic Management of Mountains, Rivers, Forests and Lakes, Grass Sand and Benefit the People’s Livelihood. Chinese Social Sciences Net. Available online: http://www.cssn.cn/ (accessed on 3 April 2021).
  45. Rudolf, G.; Luke, B.; Sander, P.; Robert, C.; Florence, B.; Leon, B.; Mike, C.; Neville, C.; Andrea, G.; Lars, H.; et al. Global estimates of the value of ecosystems and their services in monetary units. Ecosyst. Serv. 2012, 1, 50–61. [Google Scholar]
  46. Huang, W.; Duan, W.; Chen, Y. Rapidly declining surface and terrestrial water resources in Central Asia driven by socio-economic and climatic changes. Sci. Total Environ. 2021, 784, 147193. [Google Scholar] [CrossRef] [PubMed]
  47. Wei, X.; Wang, N.; Luo, P.; Yang, J.; Zhang, J.; Lin, K. Spatiotemporal assessment of land marketization and its driving forces for sustainable urban–rural development in Shaanxi province in China. Sustainability 2021, 13, 7755. [Google Scholar] [CrossRef]
Figure 1. (a) Location map, (b) Landsat images, (c) elevation and cities, (d) land use, and (e) land area of the Yellow River, Inner Mongolia section.
Remotesensing 13 04477 g001
Figure 2. Flow chart showing the ecological quality in the Yellow River, Inner Mongolia section.
Remotesensing 13 04477 g002
Figure 3. Temporal and spatial distribution (ae) and mean value (f) of RSEI in the Yellow River, Inner Mongolia section.
Remotesensing 13 04477 g003
Figure 4. Sankey remote sensing ecological index transfer matrix.
Remotesensing 13 04477 g004
Figure 5. Spatial and temporal distribution of RSEI in the Yellow River Basin, Inner Mongolia, from 2001 to 2020. From top to bottom: Hohhot, Baotou, Wuhai, Dongsheng, and Linhe.
Remotesensing 13 04477 g005
Figure 6. Correlation analysis between ecological index and potential influencing factors of cities along the Yellow River, Inner Mongolia section; line segments represent Mantel, circles represent Pearson.
Remotesensing 13 04477 g006
Table 1. Average urban RSEI along the Yellow River, Inner Mongolia section.
City20012005201020152020
Hohhot0.530.560.540.760.59
Baotou0.520.620.520.750.47
Wuhai0.240.300.370.290.28
Dongsheng0.500.600.380.450.55
Linhe0.620.770.550.780.69
Table 2. Load values of RSEI indicators to the first principal component.
Indicators20012005201020152020Mean
NDVI0.6280.6430.6920.6620.6640.658
Wet0.5420.5790.6360.6040.6090.594
NDBSI−0.319−0.357−0.327−0.400−0.407−0.362
Lst−0.427−0.478−0.408−0.497−0.450−0.452
Contribution/%87.3589.0188.9590.2392.3789.58
Publisher’s Note: MDPI stays neutral with regard to jurisdictional claims in published maps and institutional affiliations.

