
Earthquake Aftermath from Very High-Resolution WorldView-2 Image and Semi-Automated Object-Based Image Analysis (Case Study: Kermanshah, Sarpol-e Zahab, Iran)


Abstract
:1. Introduction
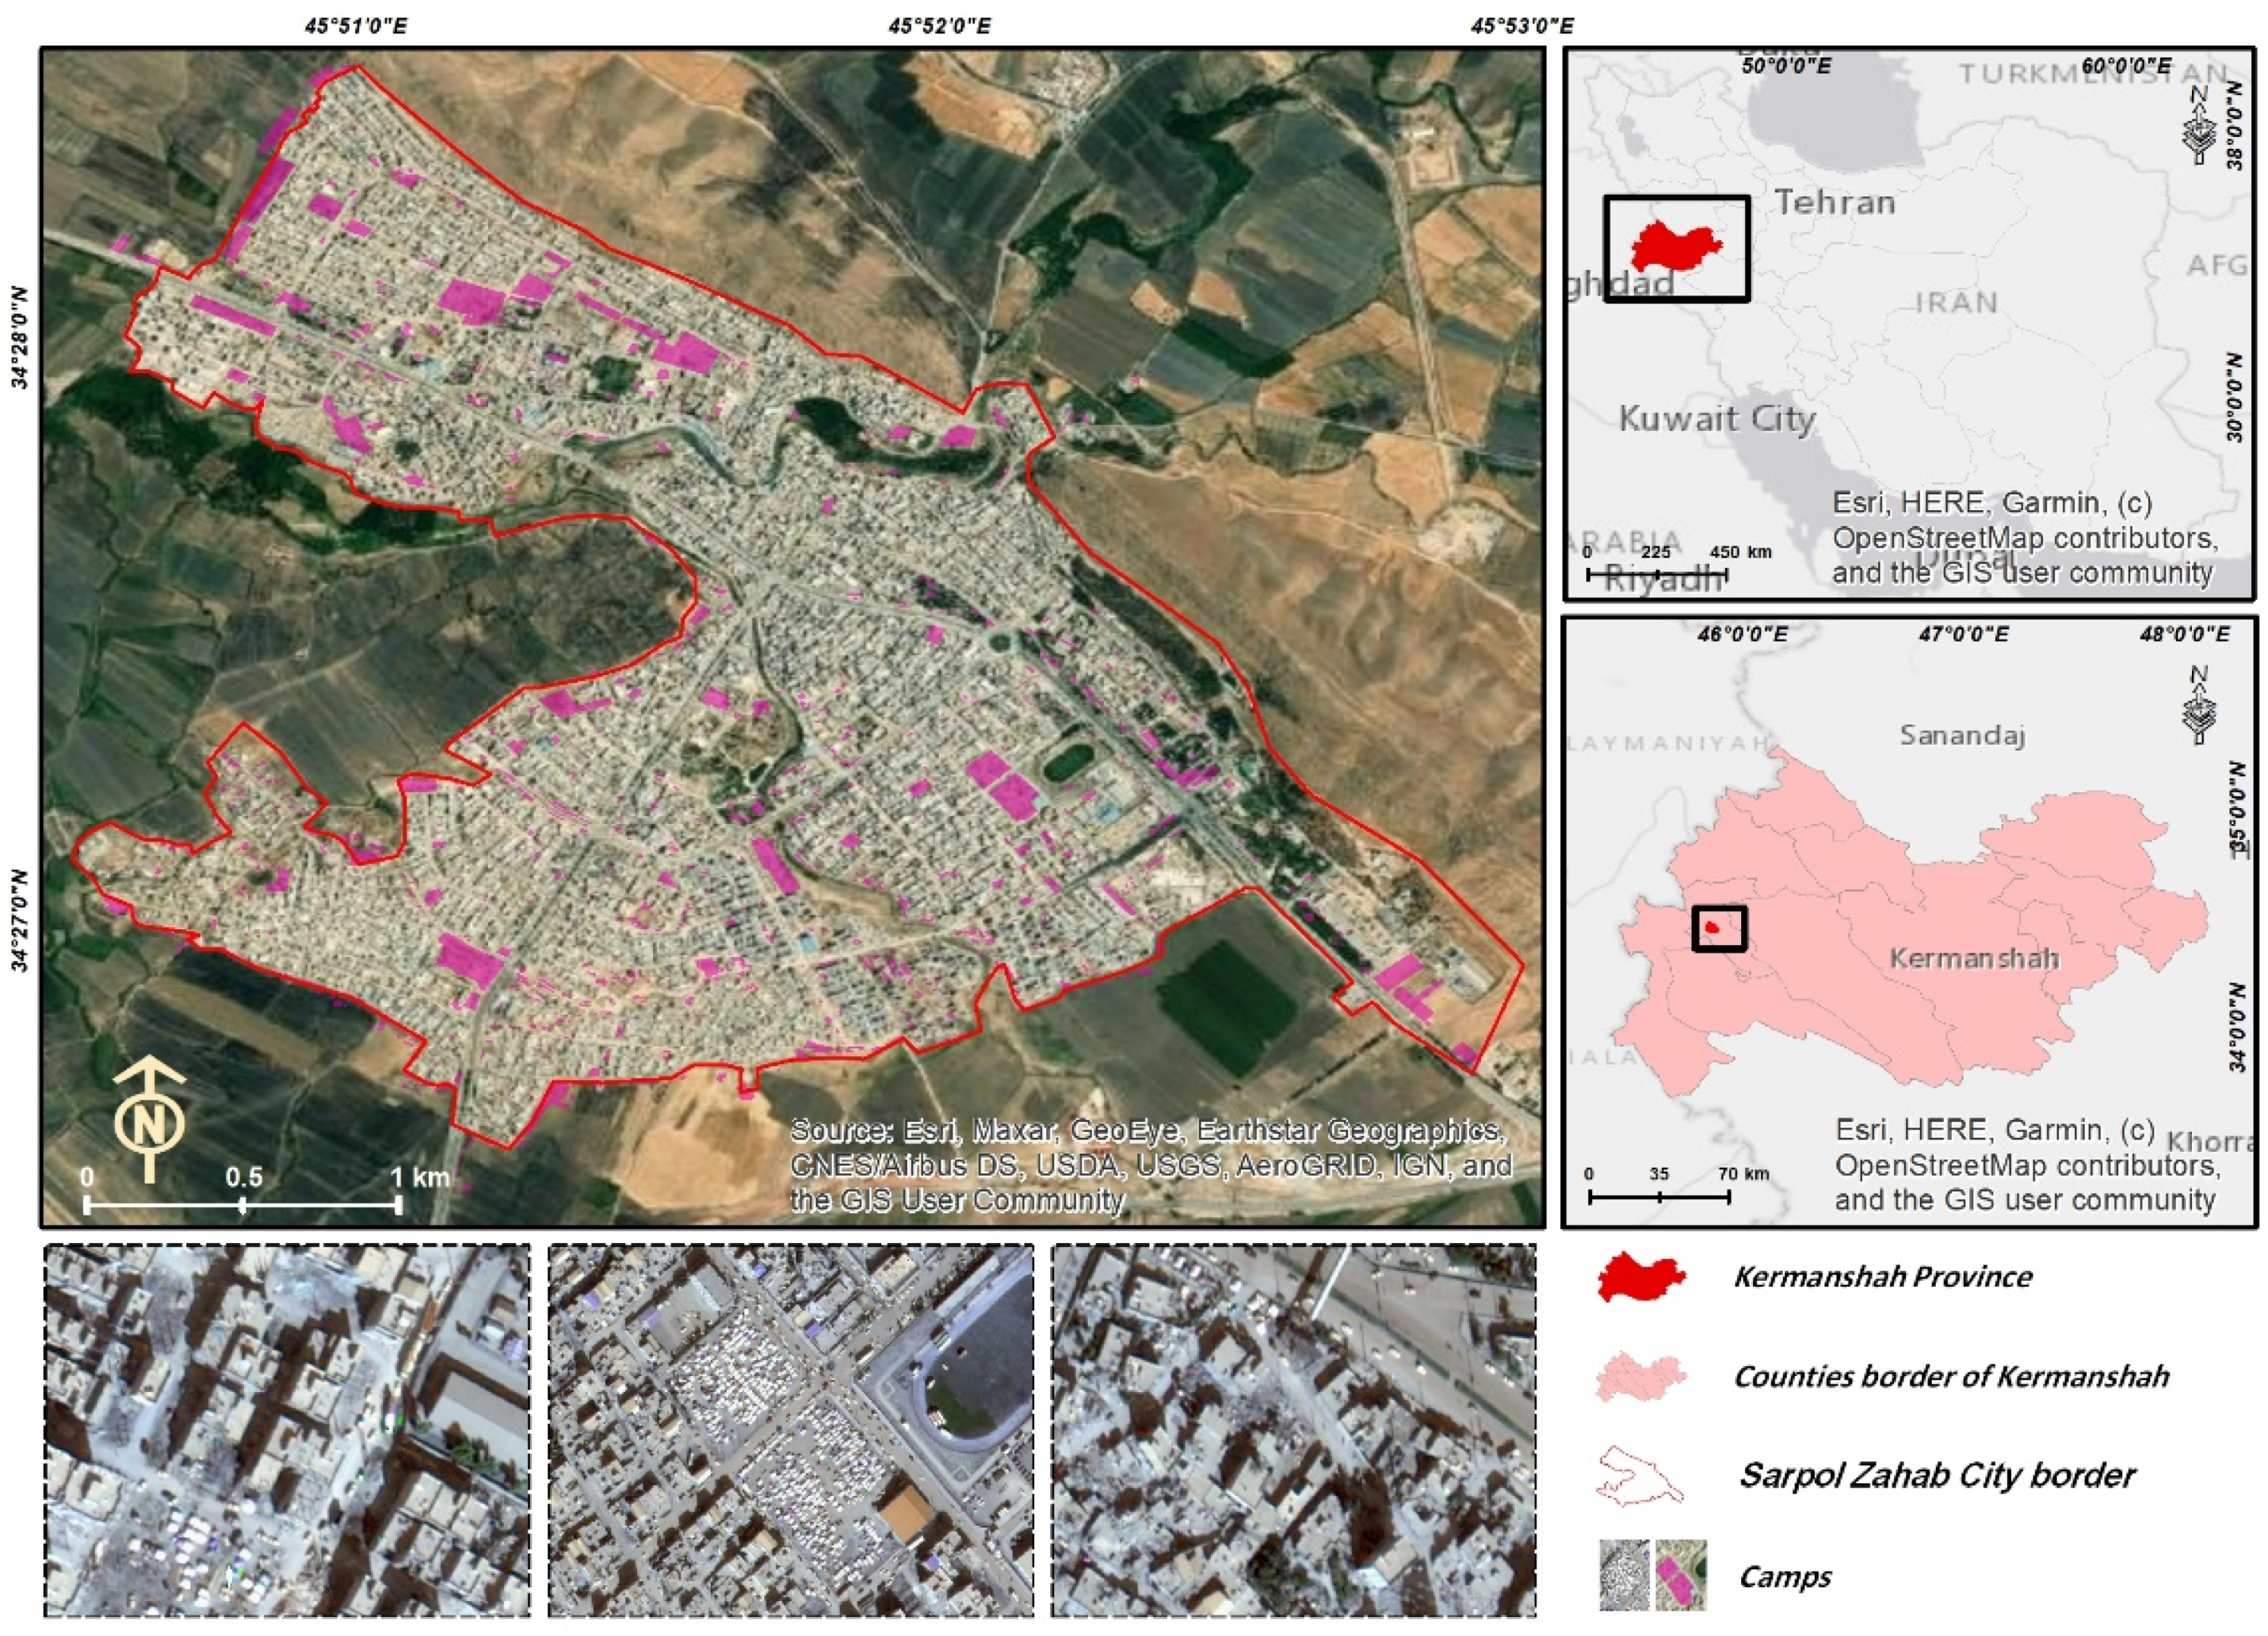
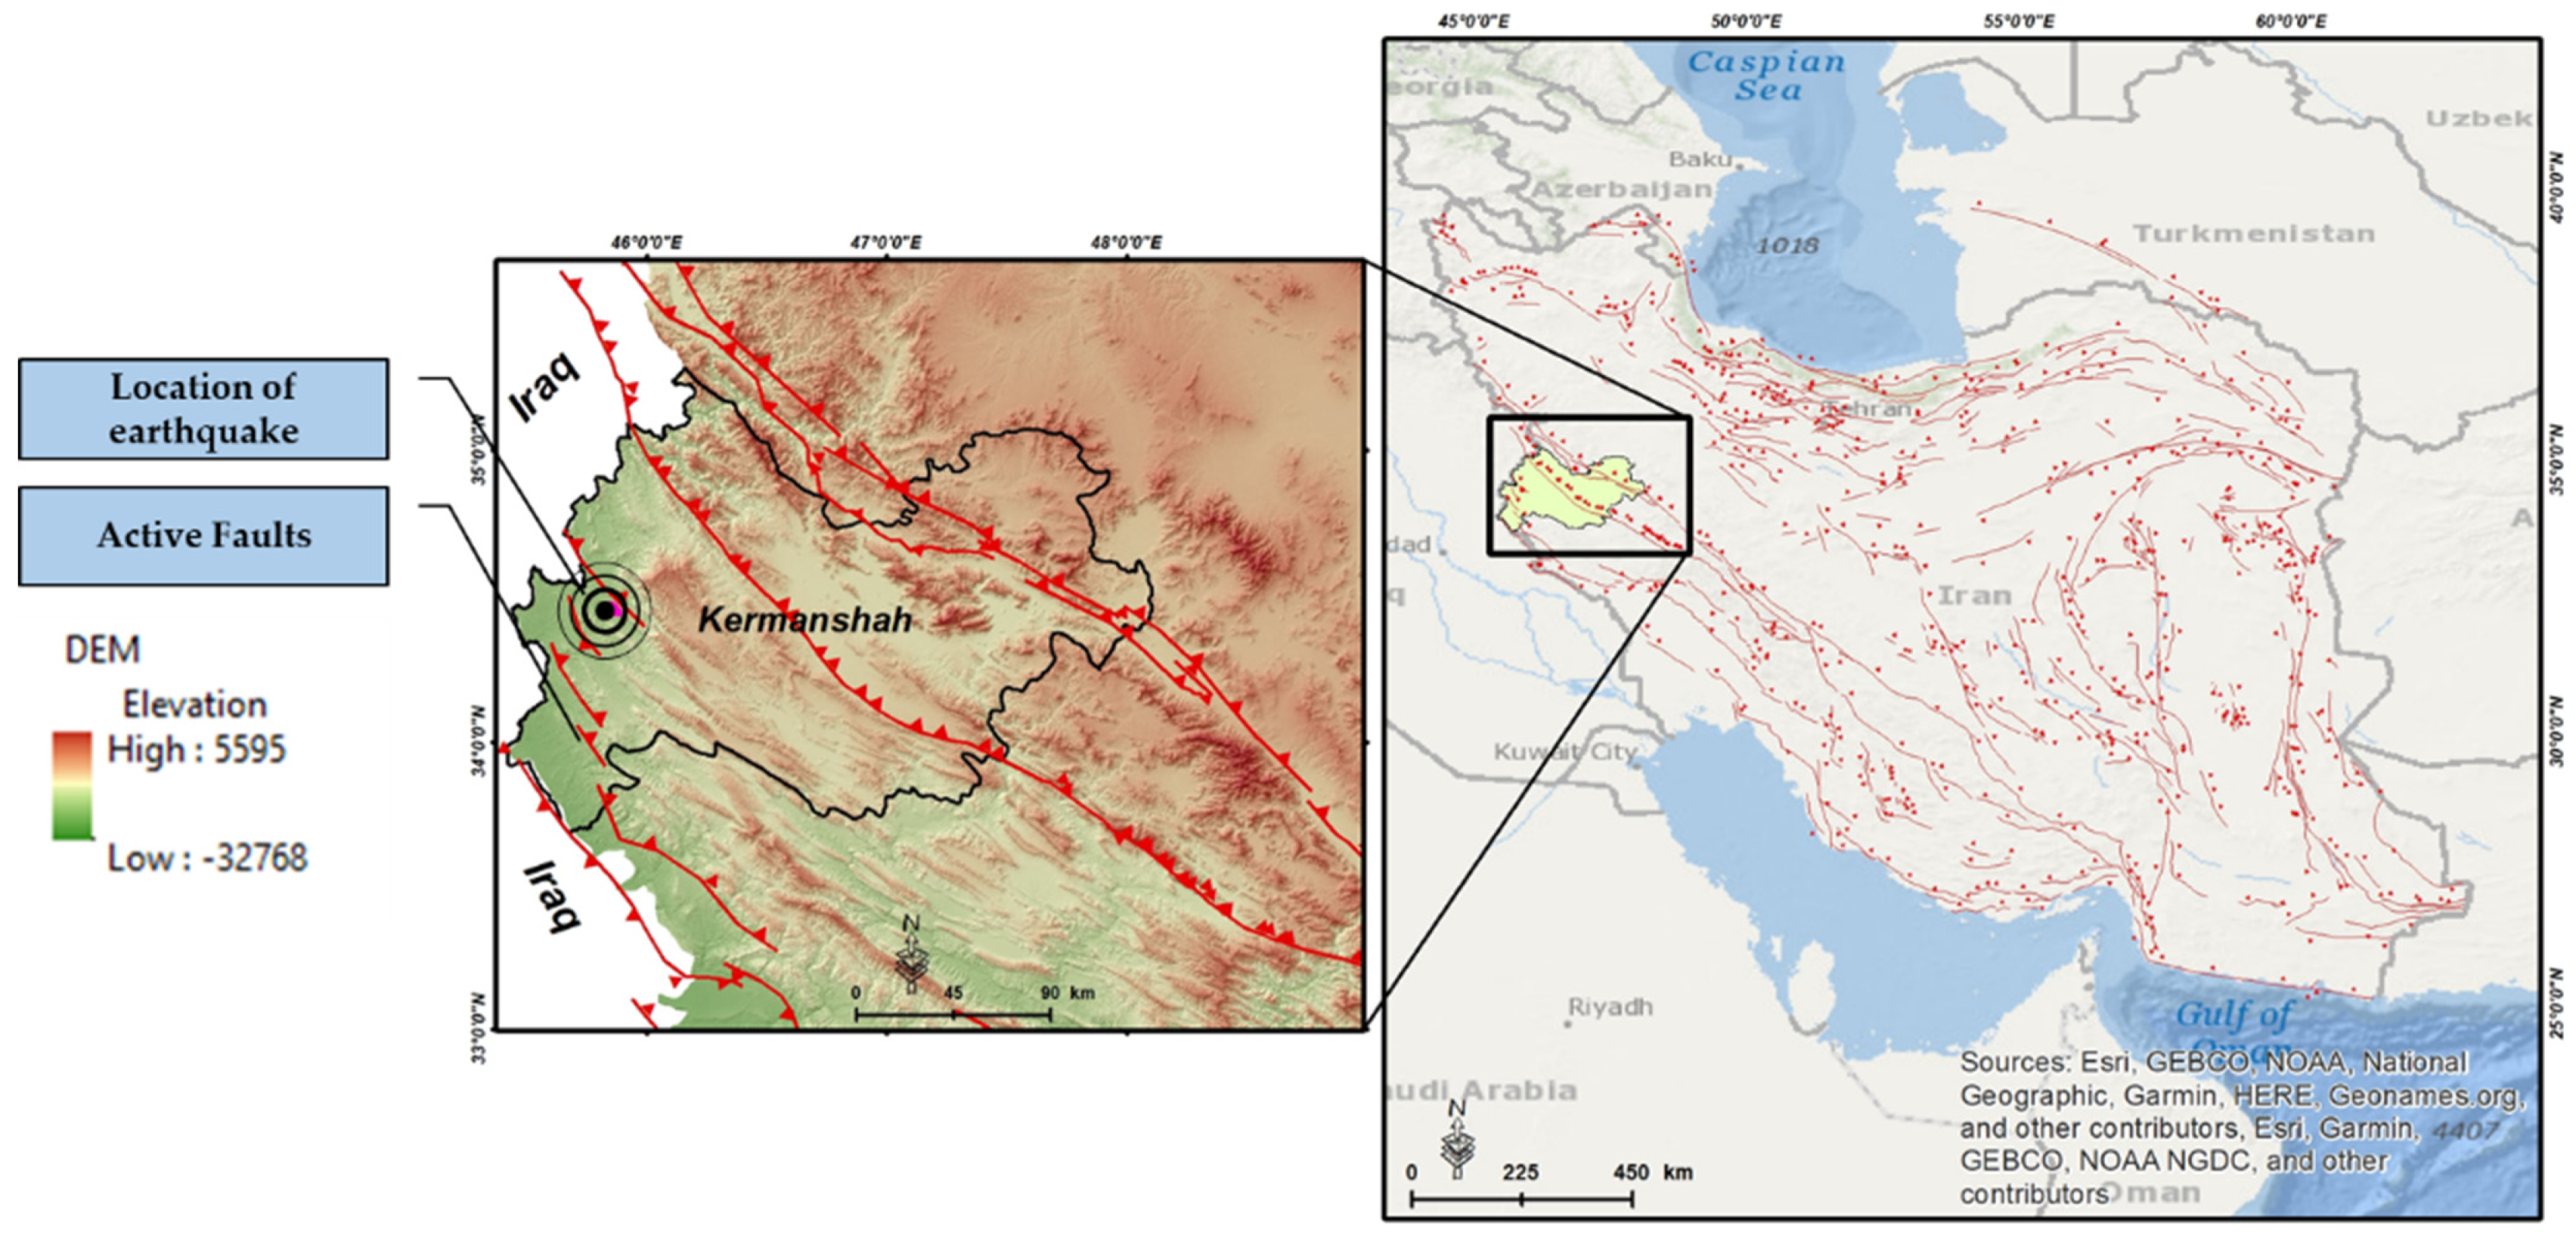
2. Study Area
3. Materials and Methods
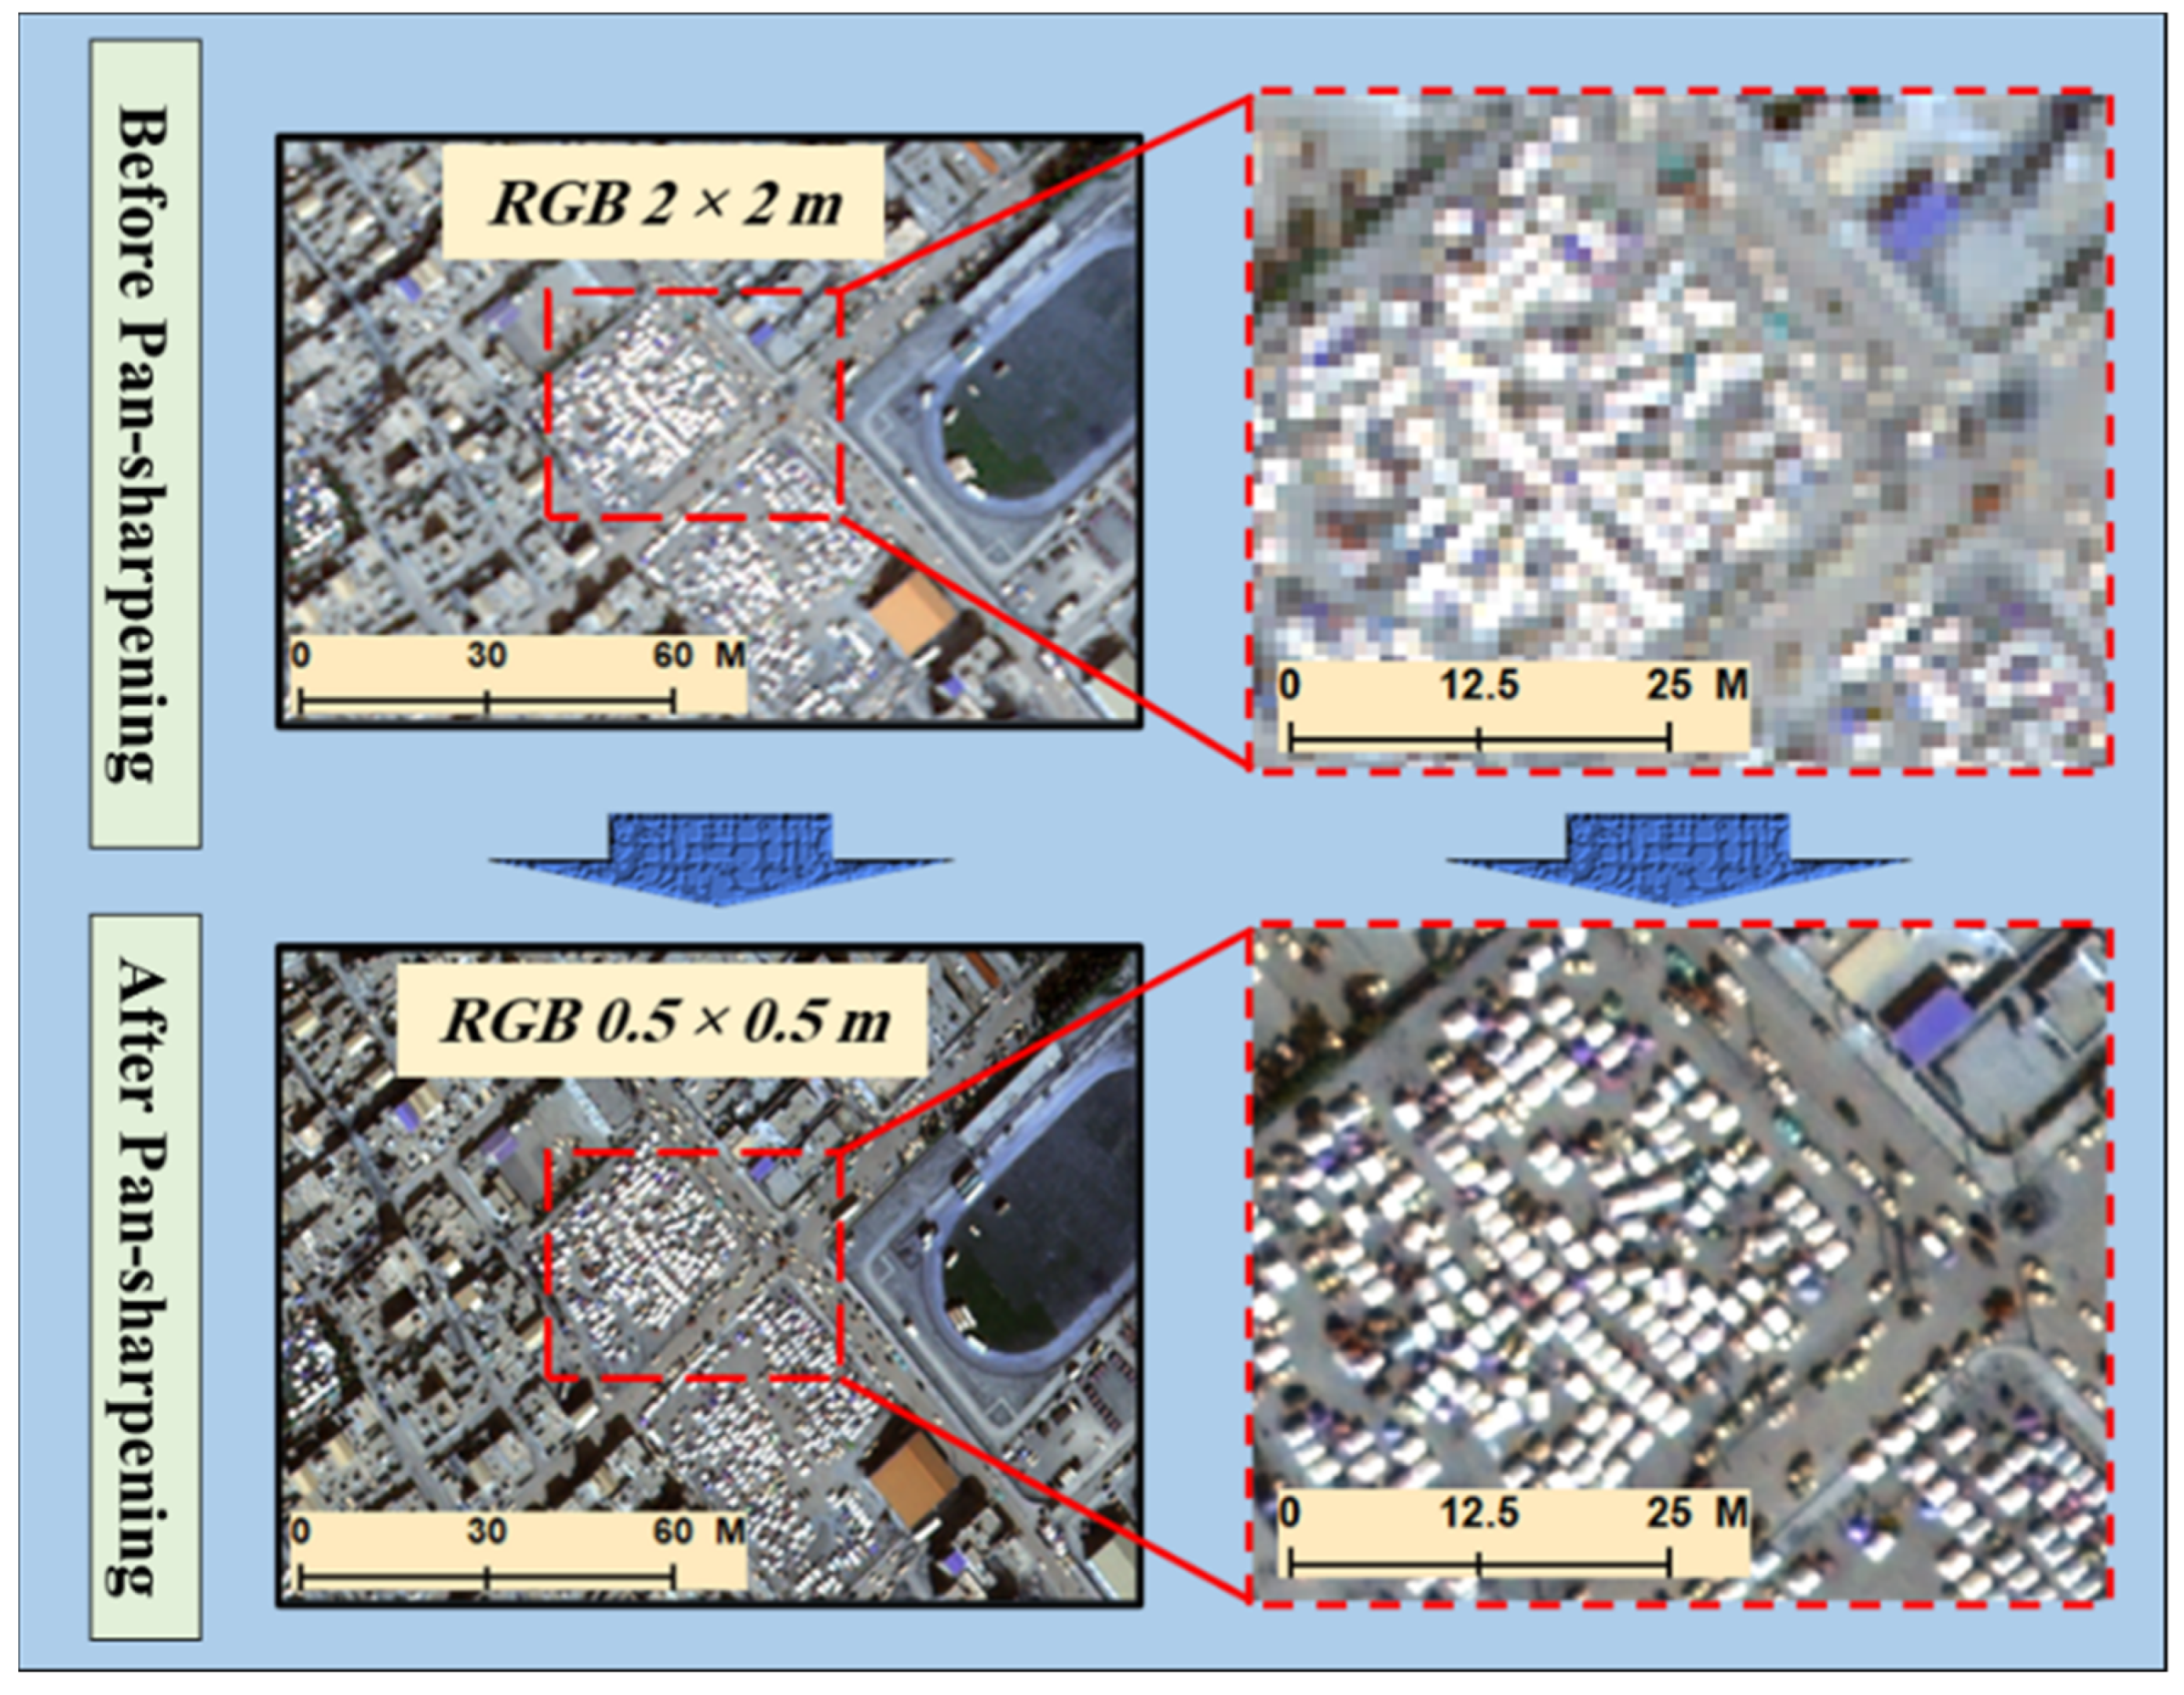
3.1. Dataset
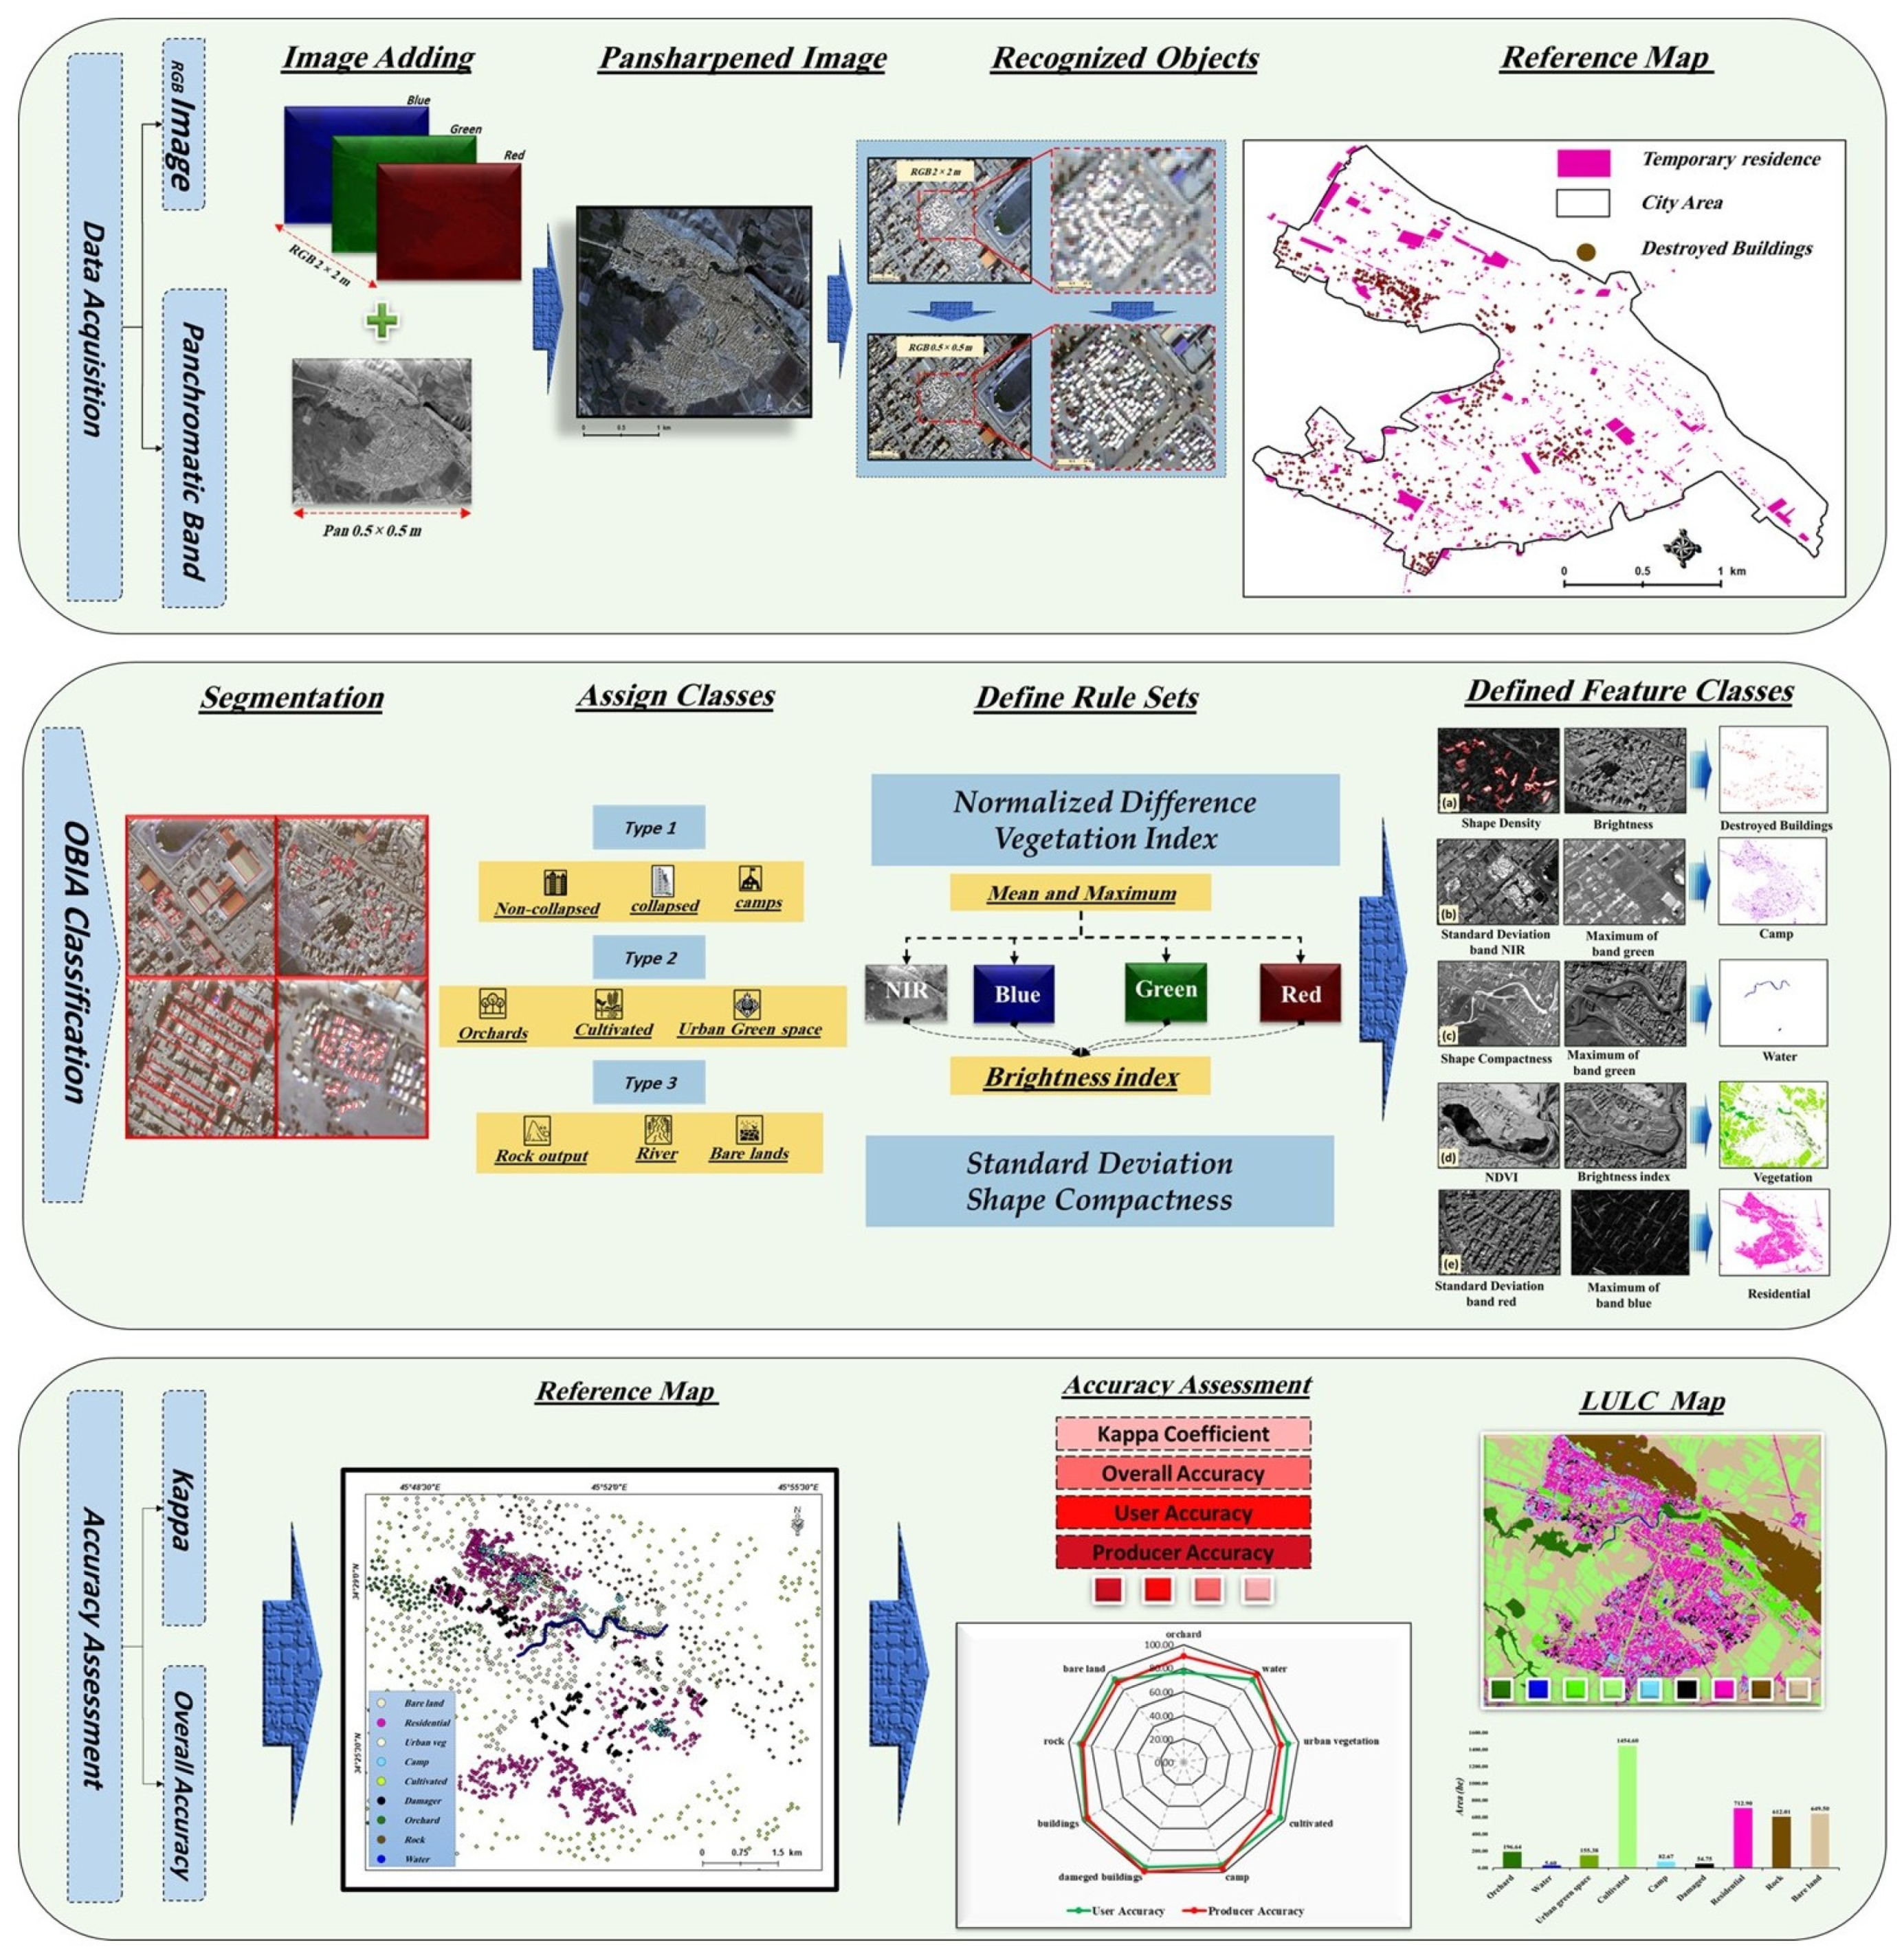
3.2. Methodology
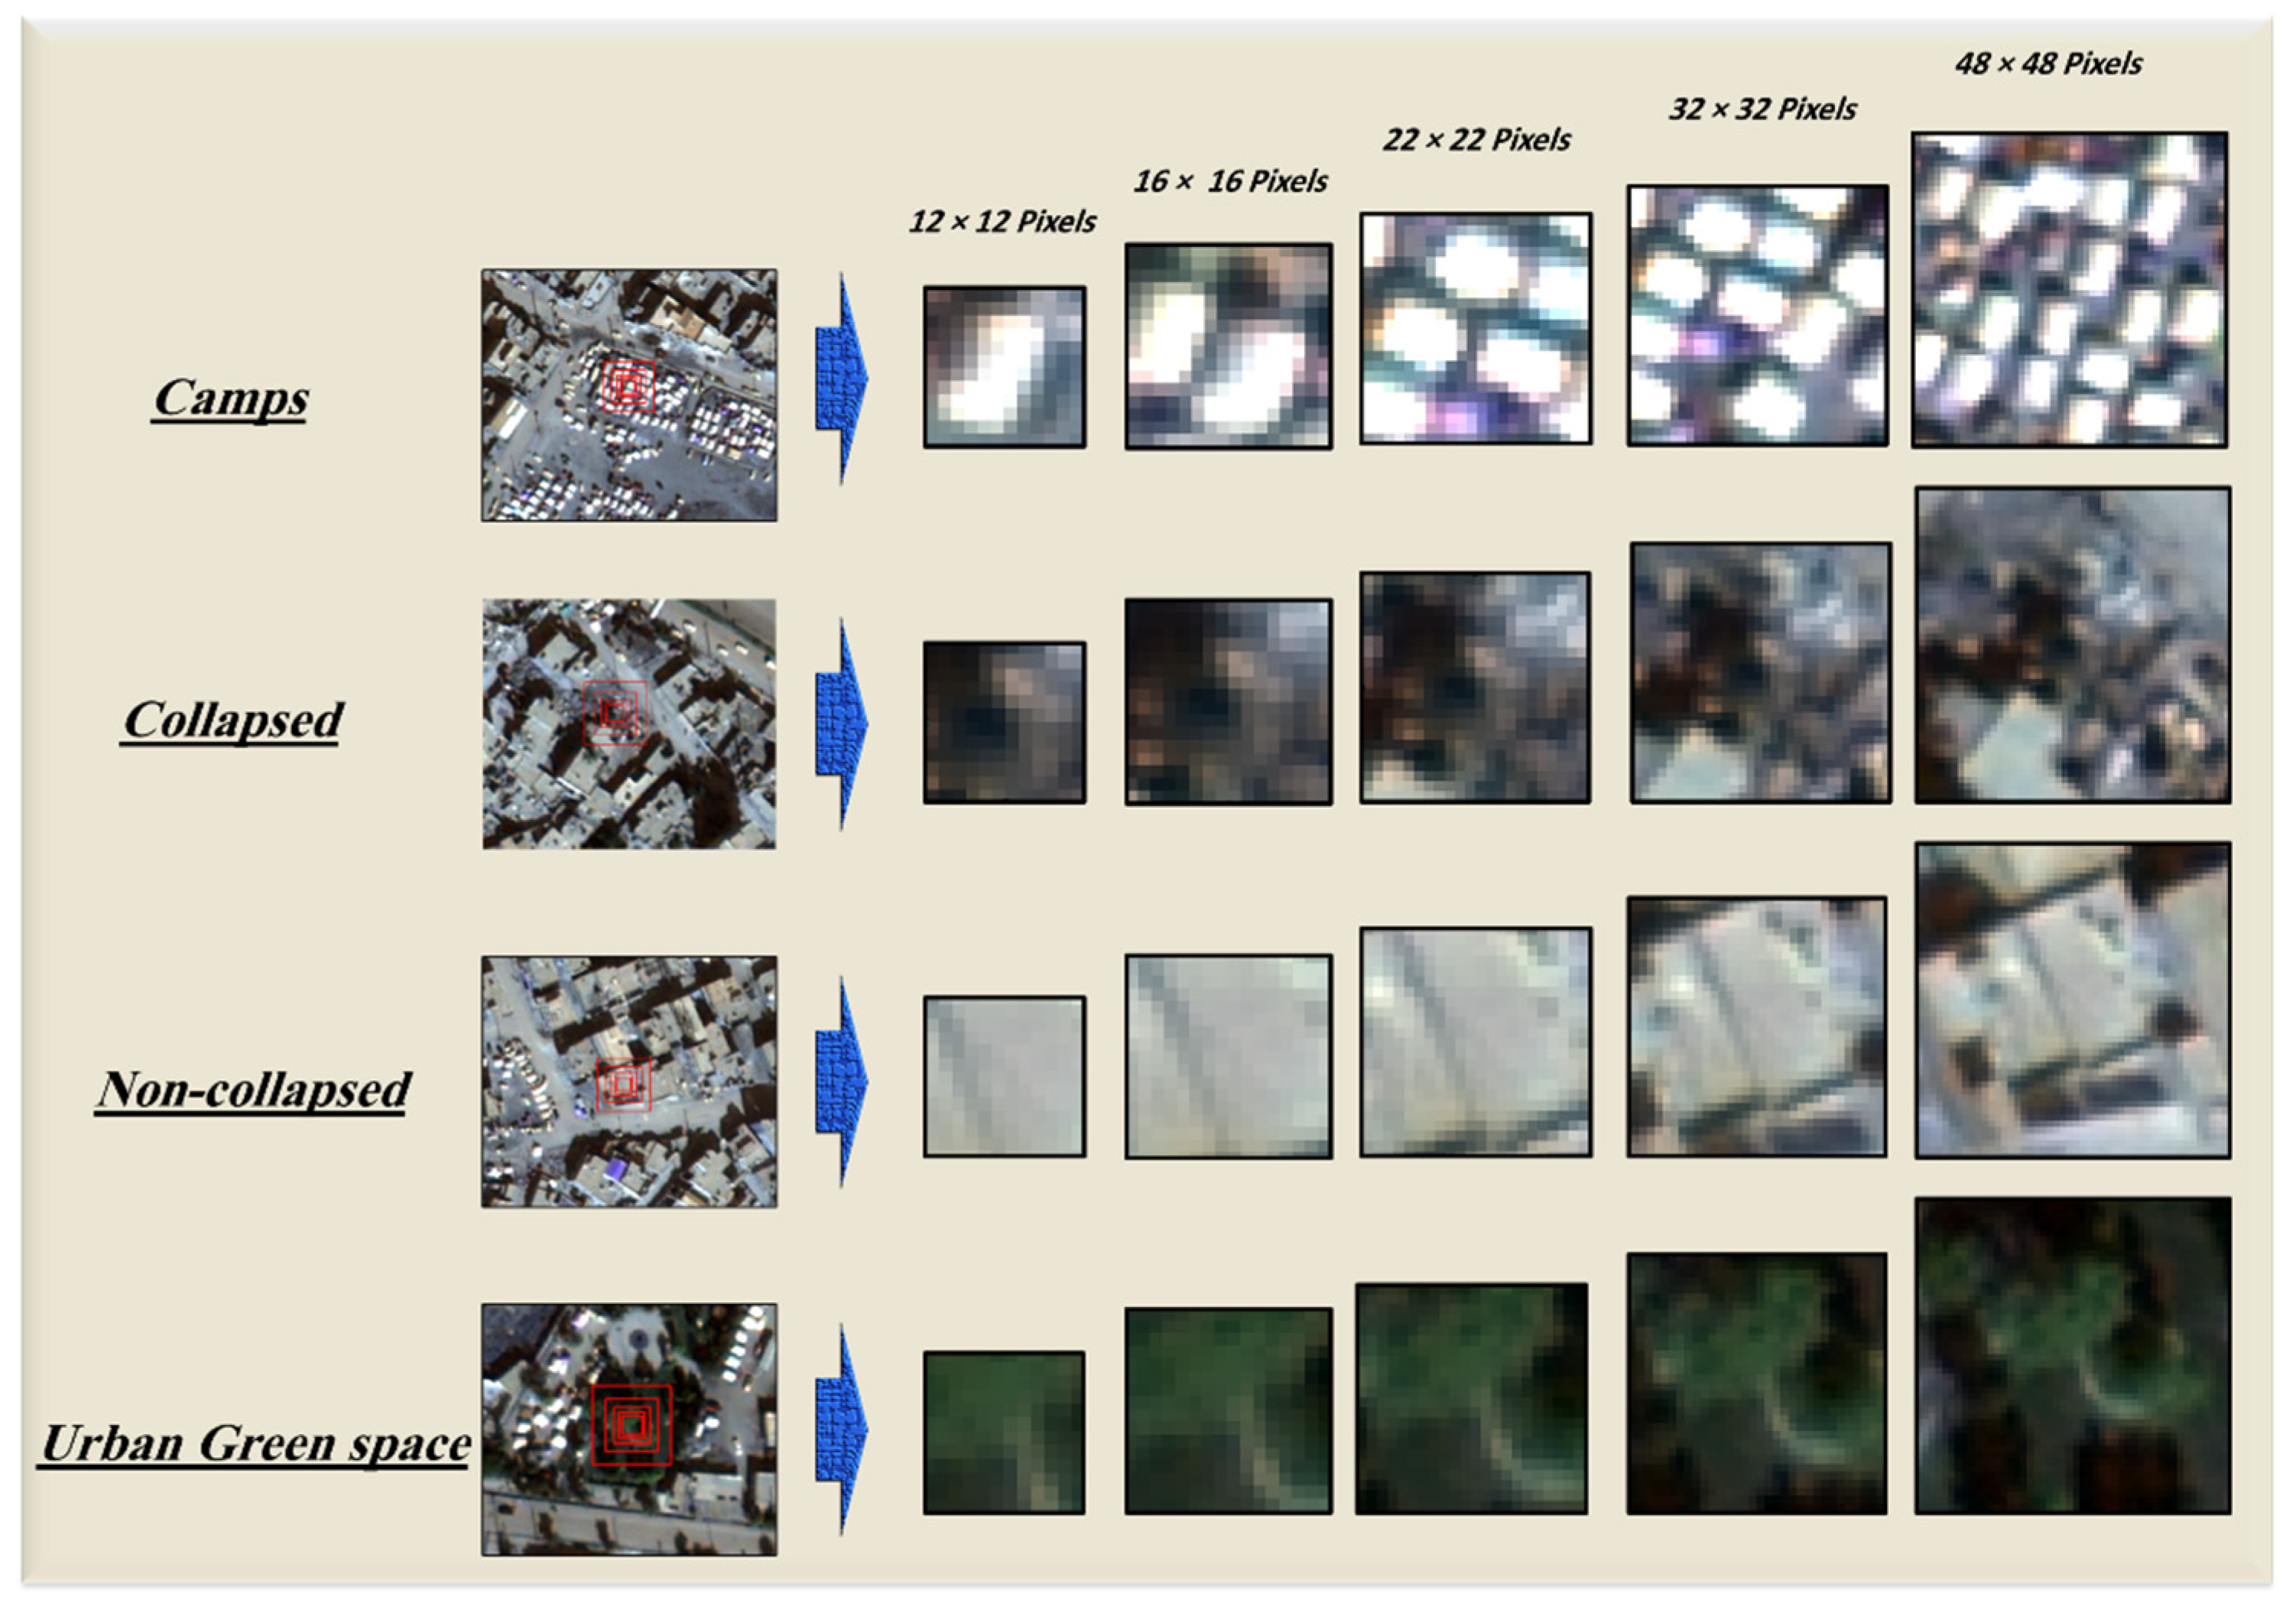
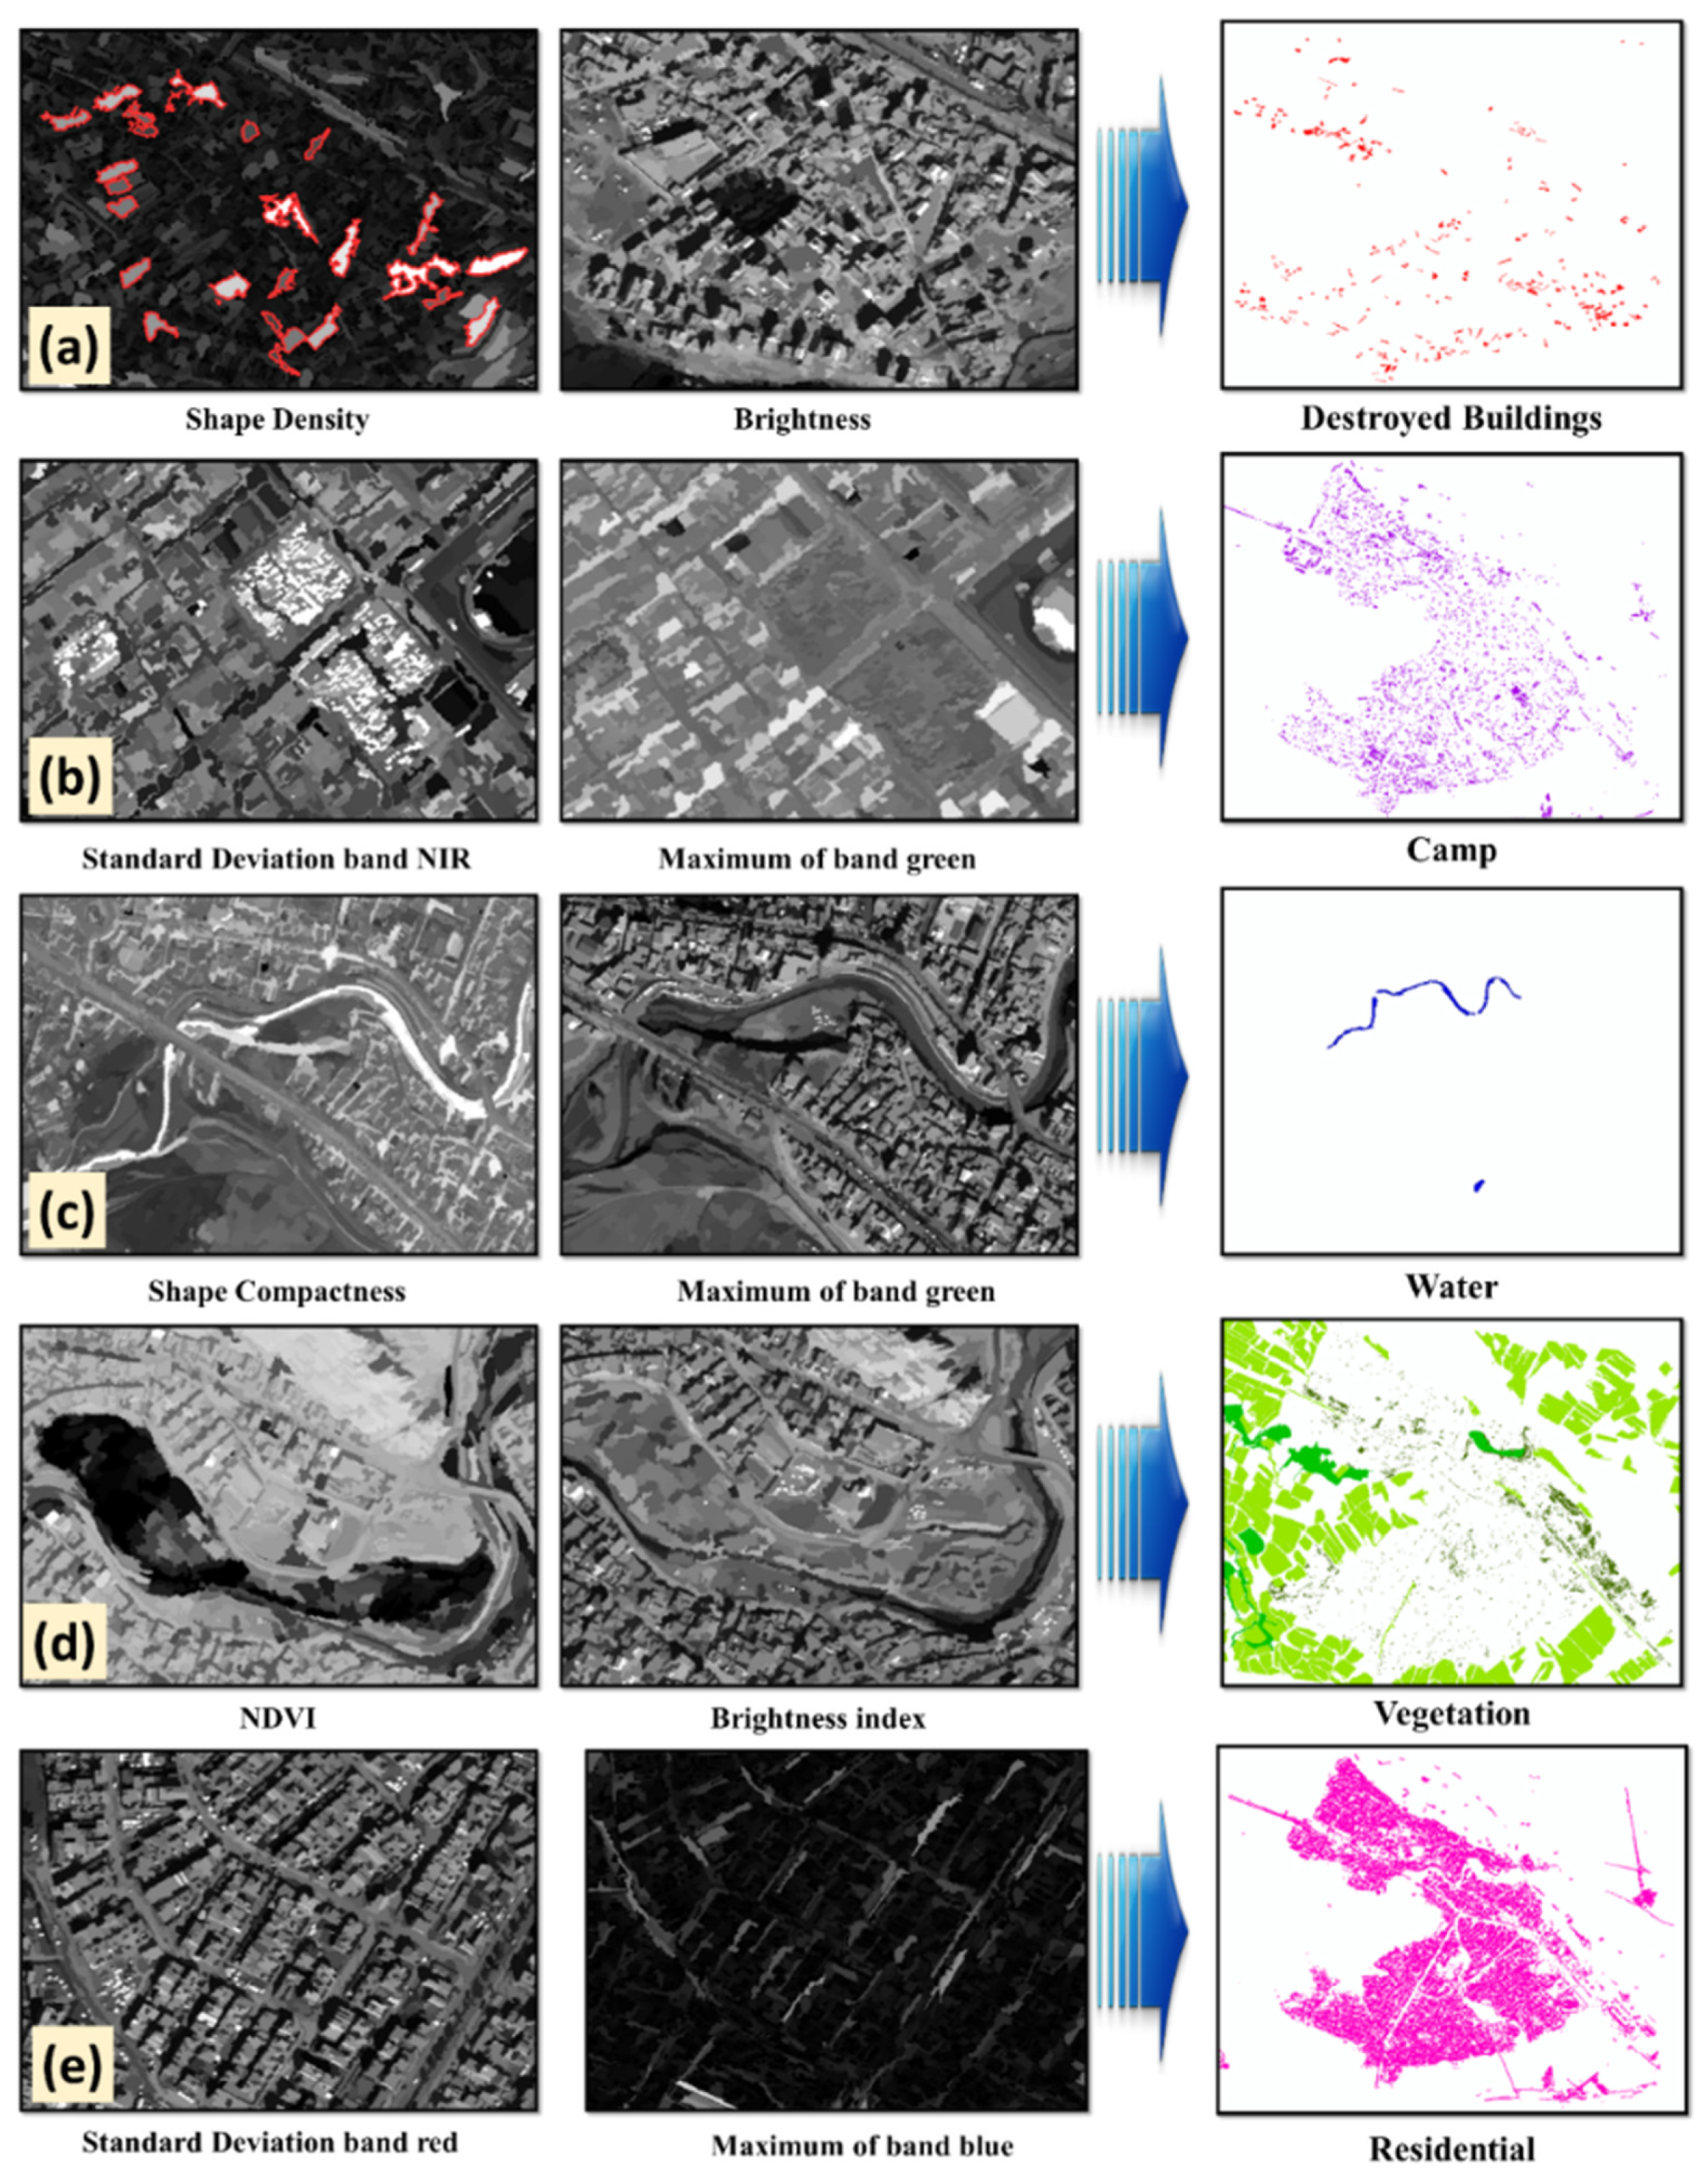
3.2.1. Object-Based Image Analysis for Damage Mapping
- Normalized Difference Vegetation Index
- Mean and Maximum of bands
- Brightness index
- Standard Deviation (StdDev)
- Shape compactness
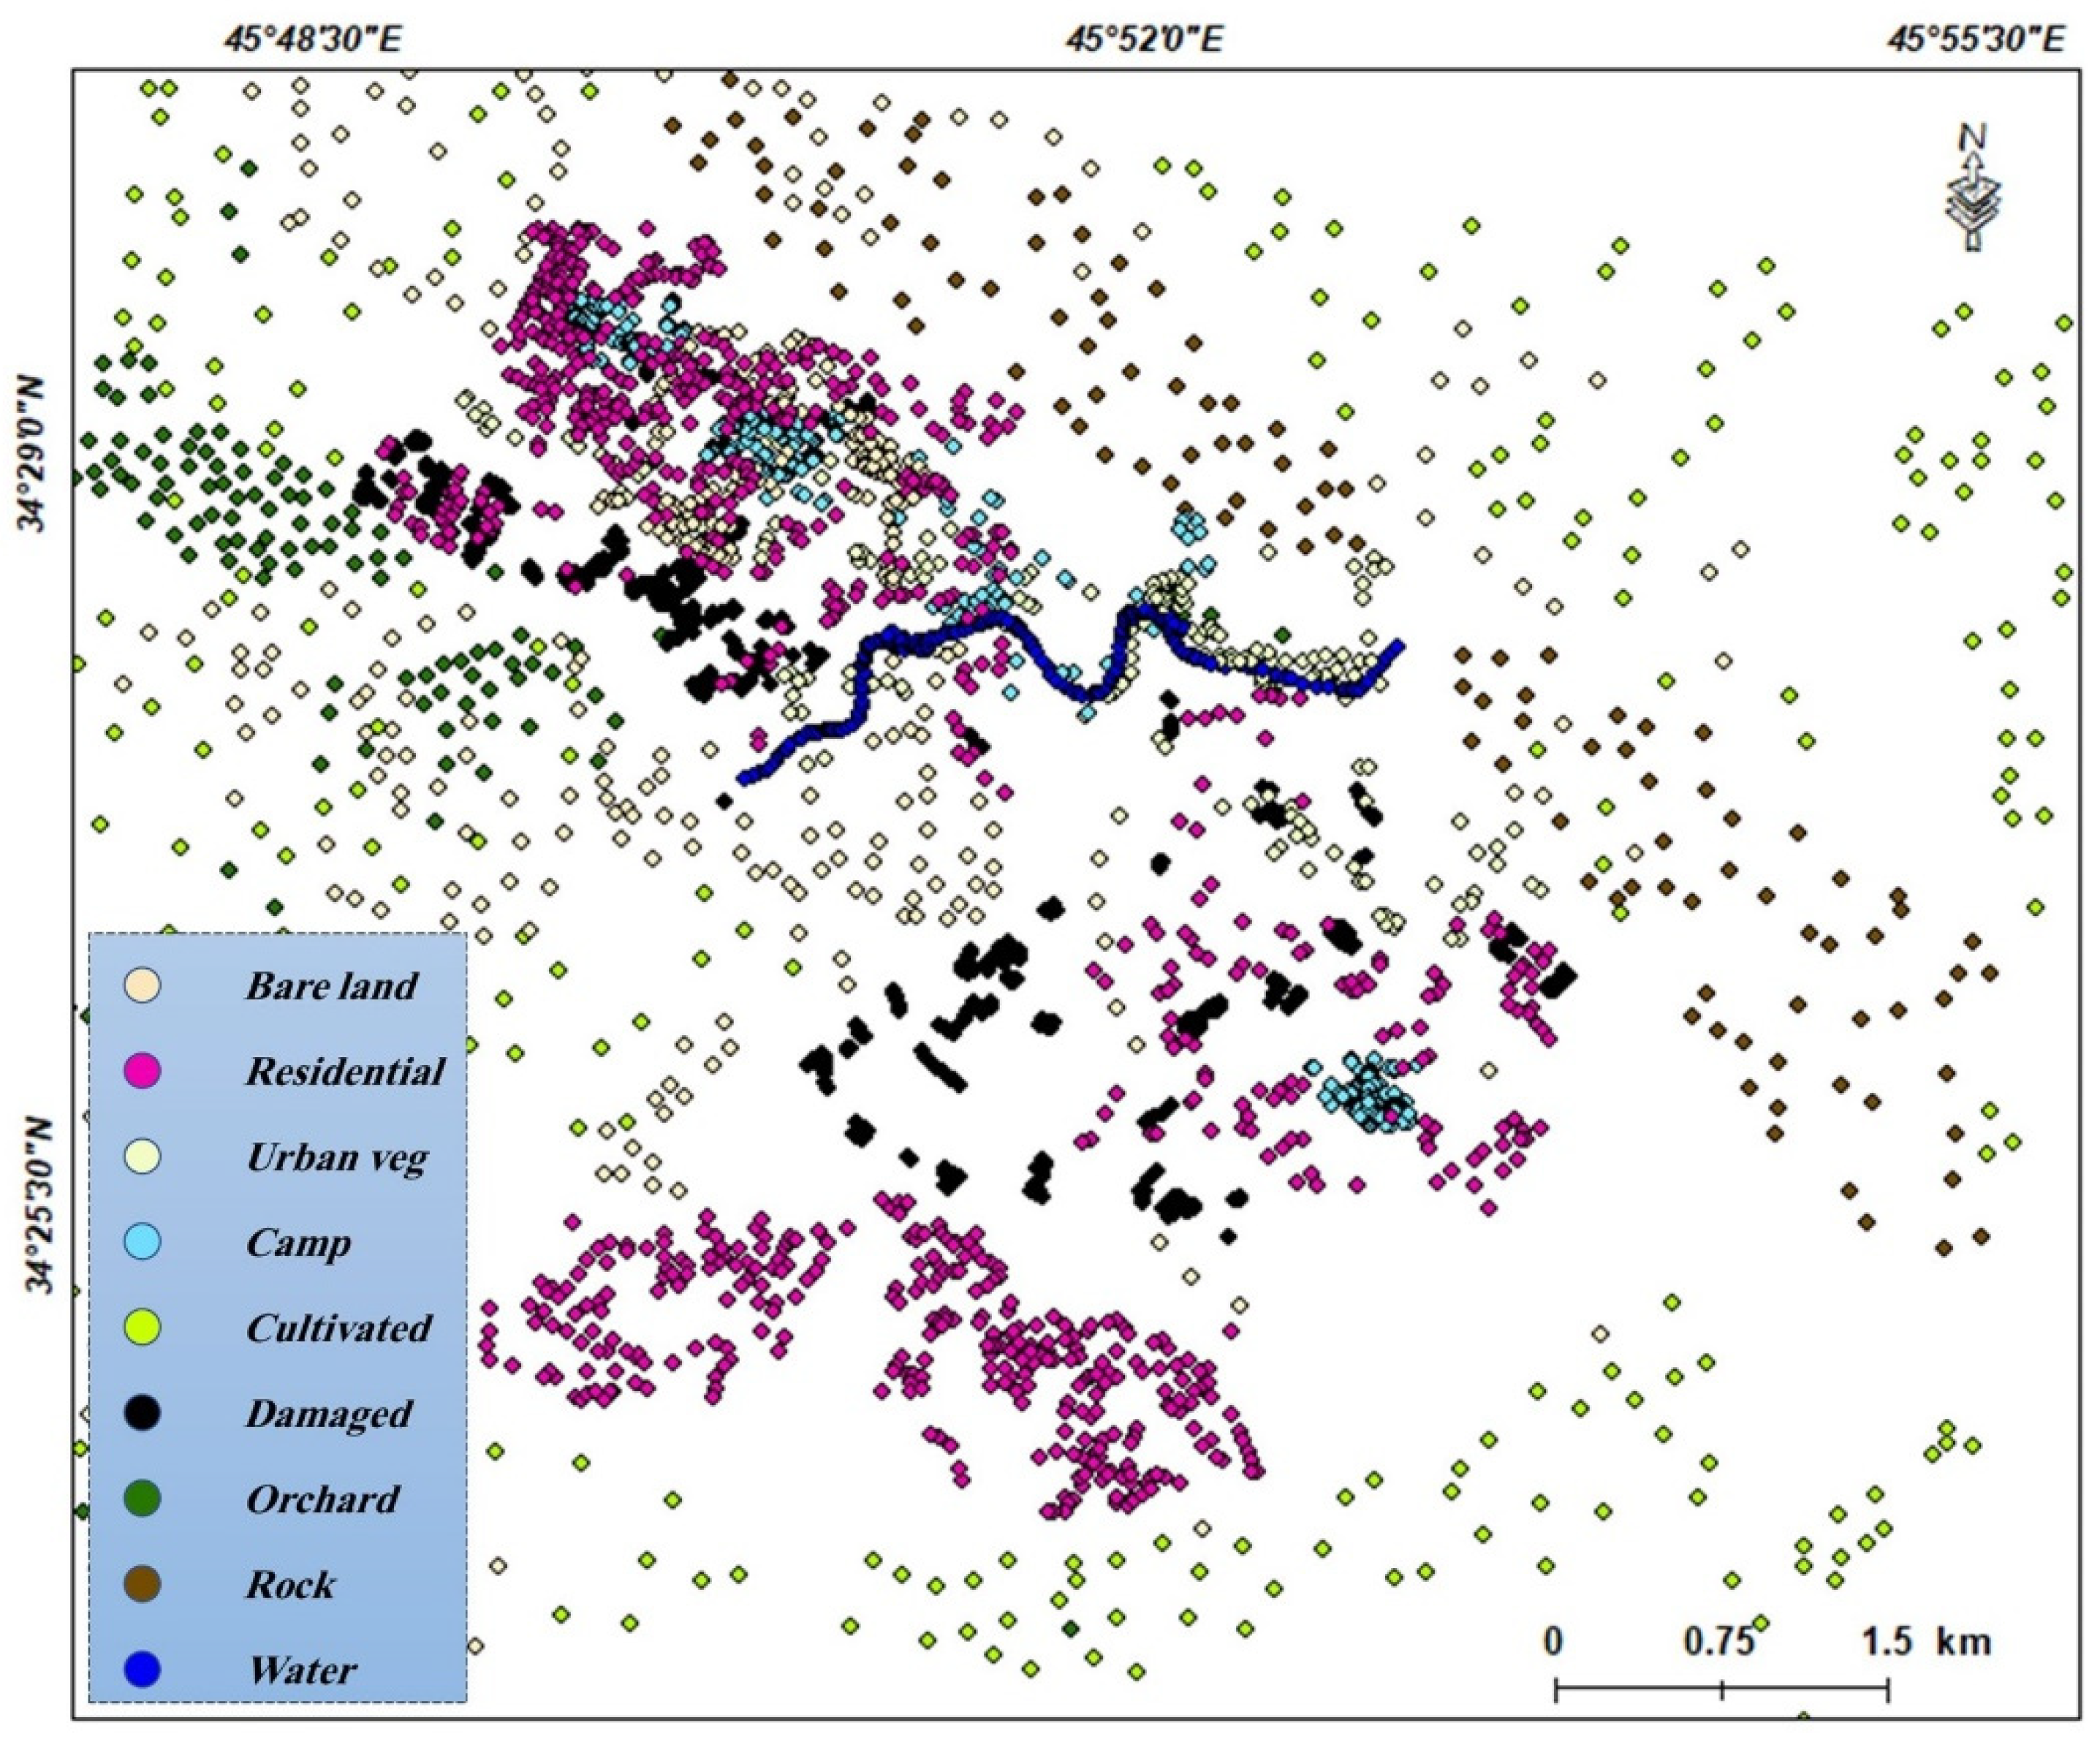
3.2.2. Accuracy Assessment
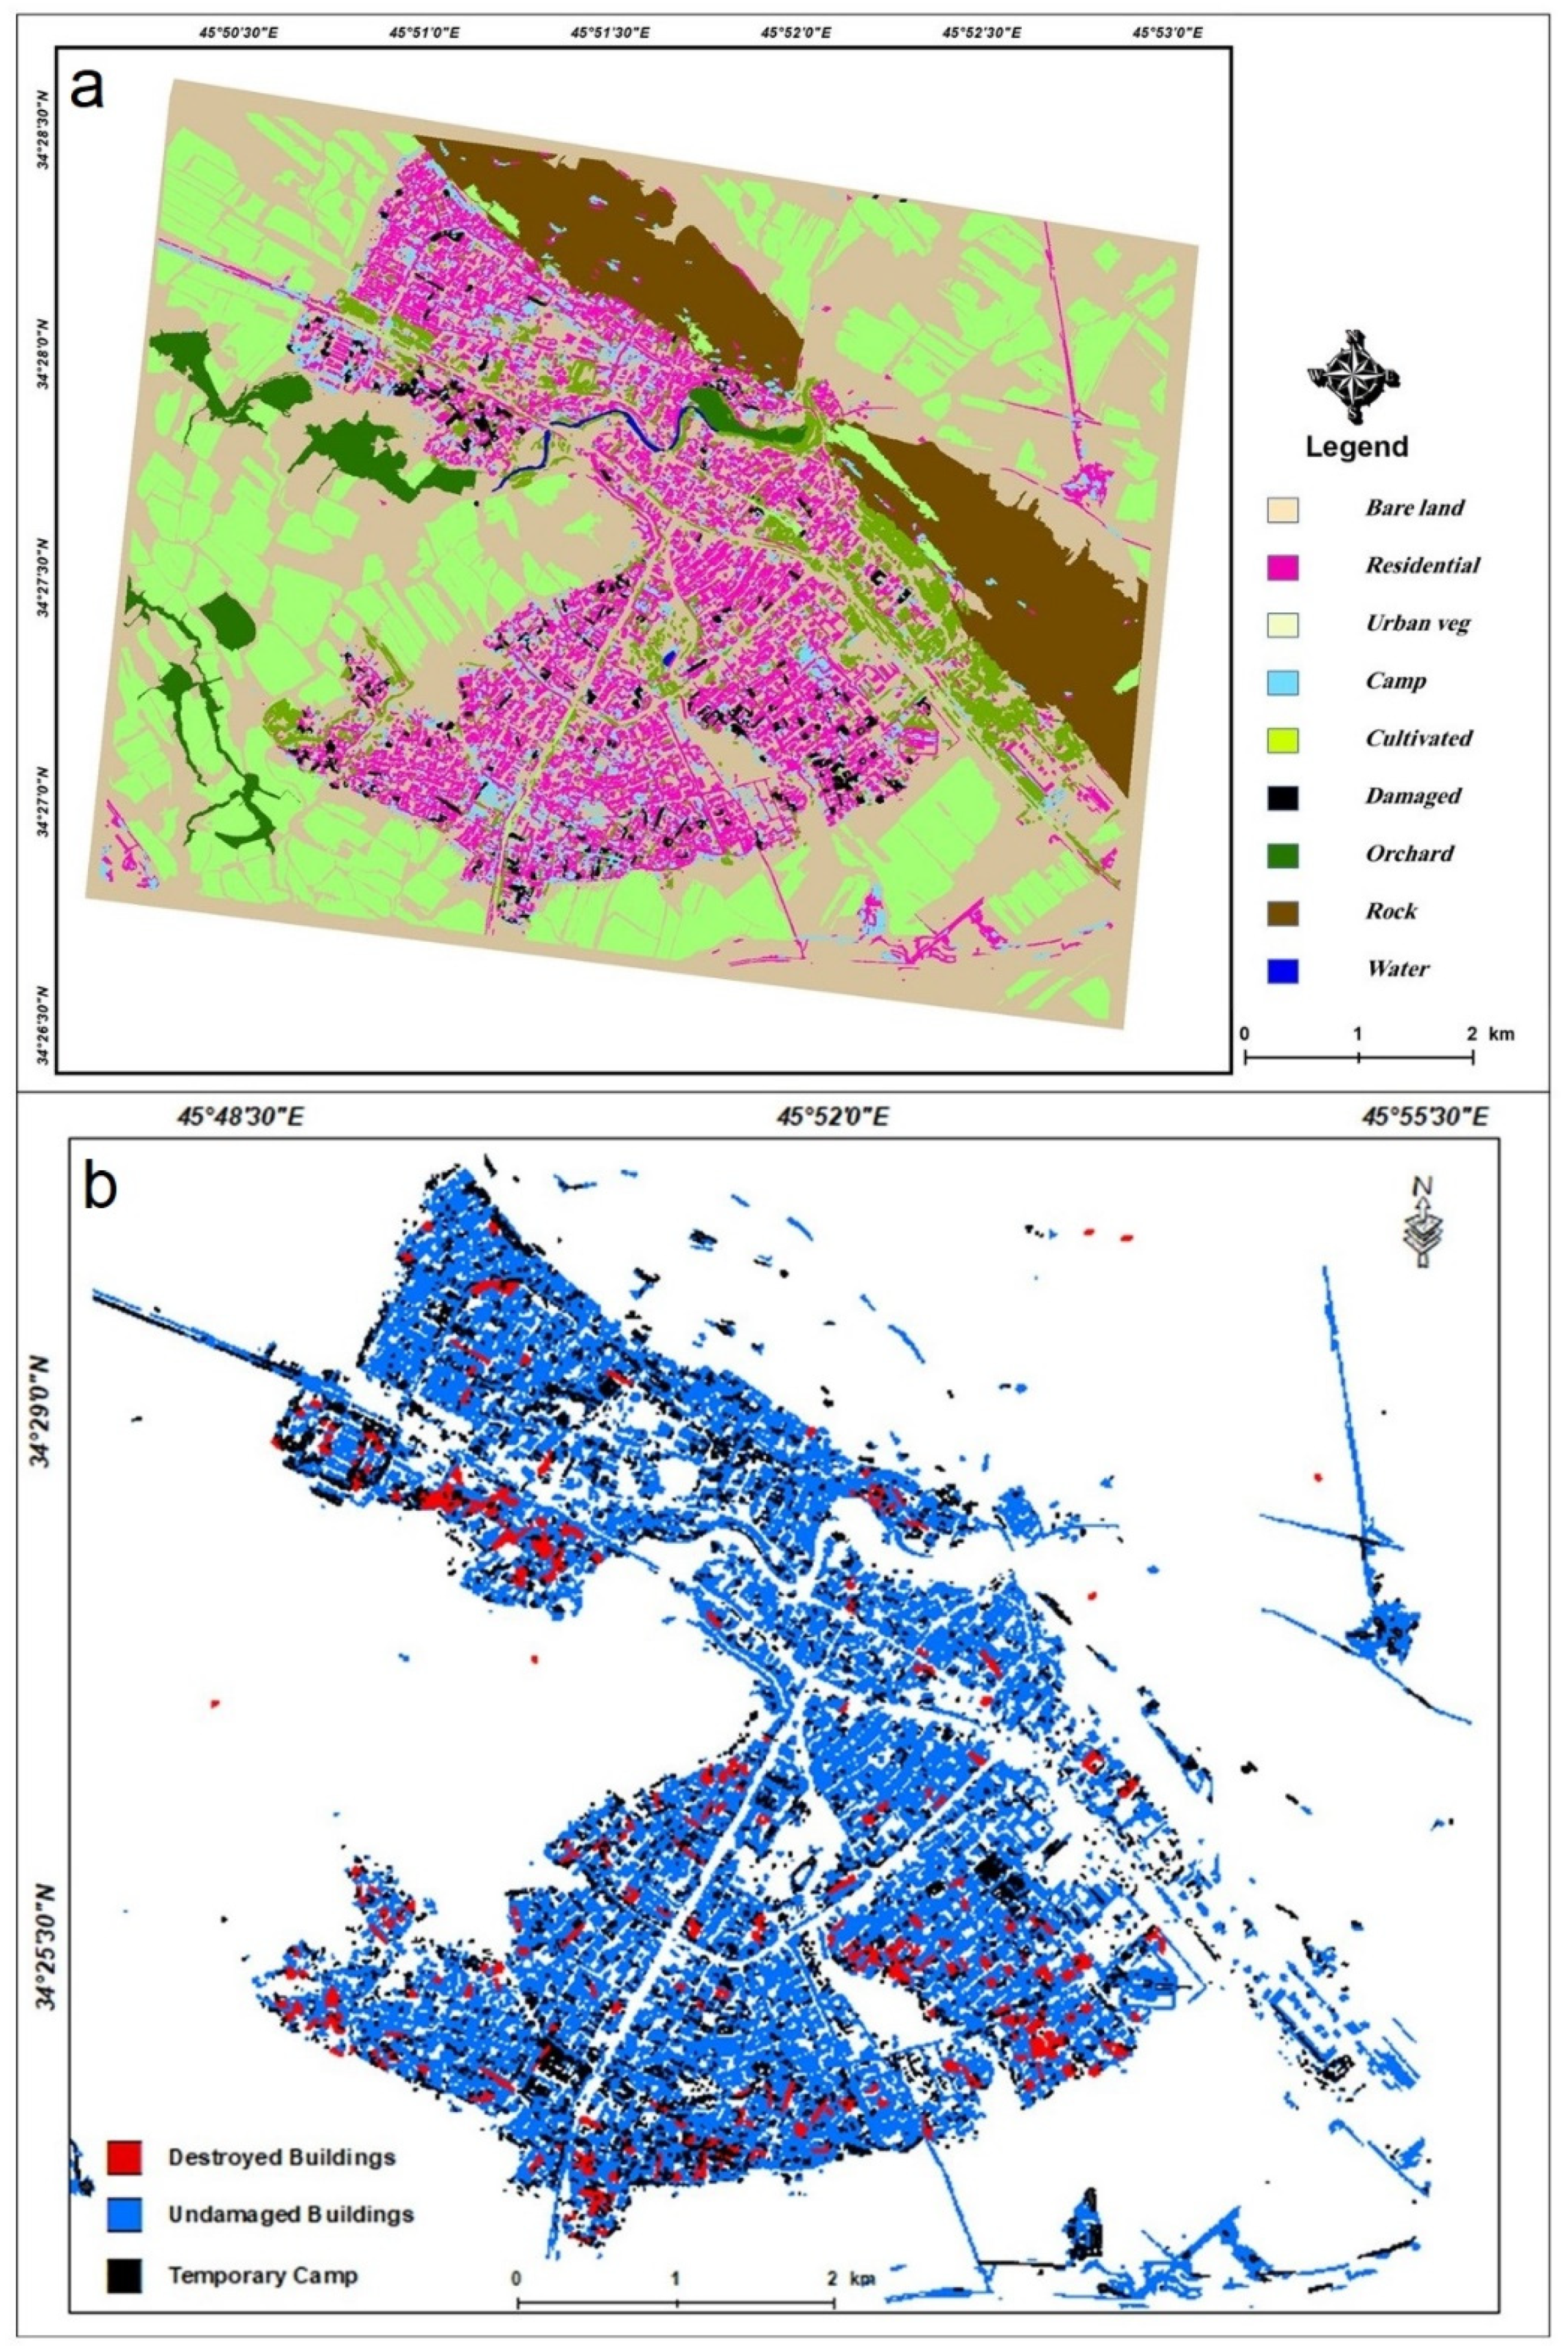
4. Results
4.1. Object-Based Image Analysis
4.2. Accuracy Assessment
4.3. Human Settlement in Temporary Camps
5. Discussion
6. Conclusions
Author Contributions
Funding
Institutional Review Board Statement
Informed Consent Statement
Data Availability Statement
Conflicts of Interest
References
- Karimzadeh, S.; Feizizadeh, B.; Matsuoka, M. From a GIS-based hybrid site condition map to an earthquake damage as-sessment in Iran: Methods and trends. Int. J. Disaster Risk Reduct. 2017, 22, 23–36. [Google Scholar] [CrossRef]
- Firuzi, E.; Ansari, A.; Hosseini, K.A.; Karkooti, E. Developing a customized system for generating near real time ground motion ShakeMap of Iran’s earthquakes. J. Earthq. Eng. 2020, 1–23. [Google Scholar] [CrossRef]
- Dell’Acqua, F.; Paolo, G. Remote sensing and earthquake damage assessment: Experiences, limits, and perspectives. Proc. IEEE 2012, 100, 2876–2890. [Google Scholar] [CrossRef]
- Eguchi, T.; Huyck, K.; Ghosh, S.; Adams, J.; McMillan, A. Utilizing new technologies in managing hazards and disasters. In Geospatial Techniques in Urban Hazard and Disaster Analysis; Springer: New York, NY, USA, 2009; Volume 2, pp. 295–323. [Google Scholar]
- Ghasemi, M.; Karimzadeh, S.; Matsuoka, M.; Feizizadeh, B. What Would Happen If the M 7.3 (1721) and M 7.4 (1780) Historical Earthquakes of Tabriz City (NW Iran) Occurred Again in 2021? ISPRS Int. J. GeoInf. 2021, 10, 657. [Google Scholar] [CrossRef]
- Coburn, W.; Spence, J.; Pomonis, A. Factors determining human casualty levels in earthquakes: Mortality prediction in building collapse. In Proceedings of the tenth world conference on earthquake engineering. Balkema Rotterdam 1992, 10, 5989–5994. [Google Scholar]
- Brunner, D.; Lemoine, G.; Bruzzone, L. Earthquake Damage Assessment of Buildings Using VHR Optical and SAR Imagery. IEEE Trans. Geosci. Remote Sens. 2010, 48, 2403–2420. [Google Scholar] [CrossRef] [Green Version]
- Jaiswal, K.; Wald, J. Creating a Global Building Inventory for Earthquake Loss Assessment and Risk Management; Open-File Report 2008–1160; US Geological Survey: Denver, CO, USA, 2008.
- Feizizadeh, B.; Abadi, H.S.S.; Didehban, K.; Blaschke, T.; Neubauer, F. Object-Based Thermal Remote-Sensing Analysis for Fault Detection in Mashhad County, Iran. Can. J. Remote Sens. 2019, 45, 847–861. [Google Scholar] [CrossRef]
- Karimzadeh, S.; Samsonov, S.; Matsuoka, M. Block-based damage assessment of the 2012 Ahar-Varzaghan, Iran, earthquake through SAR remote sensing data. In Proceedings of the IEEE International Geoscience and Remote Sensing Symposium (IGARSS), FortWorth, TX, USA, 23–28 July 2017. [Google Scholar]
- Najafi, P.; Feizizadeh, B.; Navid, H. A Comparative Approach of Fuzzy Object Based Image Analysis and Machine Learning Techniques Which Are Applied to Crop Residue Cover Mapping by Using Sentinel-2 Satellite and UAV Imagery. Remote Sens. 2021, 13, 937. [Google Scholar] [CrossRef]
- United Nations; International Search and Rescue Advisory Group. INSARAG Guidelines; Volume II: Preparedness and Response; Manual B: Operations; United Nations International Search and Rescue Advisory Group: Geneva, Switzerland, 2015. [Google Scholar]
- Han, Q.; Yin, Q.; Zheng, X.; Chen, Z. Remote sensing image building detection method based on Mask R-CNN. Complex Intell. Syst. 2021, 1–9. [Google Scholar] [CrossRef]
- Gusella, L.; Adams, B.J.; Bitelli, G.; Huyck, C.K.; Mognol, A. Object-Oriented Image Understanding and Post-Earthquake Damage Assessment for the 2003 Bam, Iran, Earthquake. Earthq. Spectra 2005, 21, 225–238. [Google Scholar] [CrossRef]
- Yamazaki, F.; Yano, Y.; Matsuoka, M. Visual Damage Interpretation of Buildings in Bam City using QuickBird Images following the 2003 Bam, Iran, Earthquake. Earthq. Spectra 2005, 21, 329–336. [Google Scholar] [CrossRef]
- Klonus, S.; Tomowski, D.; Ehlers, M.; Reinartz, P.; Michel, U. Combined Edge Segment Texture Analysis for the Detection of Damaged Buildings in Crisis Areas. IEEE J. Sel. Top. Appl. Earth Obs. Remote Sens. 2012, 5, 1118–1128. [Google Scholar] [CrossRef] [Green Version]
- Moya, L.; Zakeri, H.; Yamazaki, F.; Liu, W.; Mas, E.; Koshimura, S. 3D gray level co-occurrence matrix and its application to identifying collapsed buildings. ISPRS J. Photogramm. Remote Sens. 2019, 149, 14–28. [Google Scholar] [CrossRef]
- Song, J.; Wang, X.; Li, P. Urban building damage detection from VHR imagery by including temporal and spatial texture features. Yaogan Xuebao J. Remote Sens. 2012, 16, 1233–1245. [Google Scholar]
- Wang, X.; Li, P. Extraction of earthquake-induced collapsed buildings using very high-resolution imagery and airborne lidar data. Int. J. Remote Sens. 2015, 36, 2163–2183. [Google Scholar] [CrossRef]
- Chini, M.; Pierdicca, N.; Emery, W. Exploiting SAR and VHR Optical Images to Quantify Damage Caused by the 2003 Bam Earthquake. IEEE Trans. Geosci. Remote Sens. 2008, 47, 145–152. [Google Scholar] [CrossRef]
- Ural, S.; Hussain, E.; Kim, K.; Fu, C.-S.; Shan, J. Building Extraction and Rubble Mapping for City Port-au-Prince Post-2010 Earthquake with GeoEye-1 Imagery and Lidar Data. Photogramm. Eng. Remote Sens. 2011, 77, 1011–1023. [Google Scholar] [CrossRef] [Green Version]
- Tian, J.; Chen, M. Optimization in multi-scale segmentation of high-resolution satellite images for artificial feature recognition. Int. J. Remote Sens. 2007, 28, 4625–4644. [Google Scholar] [CrossRef]
- Blaschke, T.; Lang, S.; Hay, G. Object-Based Image Analysis: Spatial Concepts for Knowledge-Driven Remote Sensing Applications; Springer: New York, NY, USA, 2008; p. 817. [Google Scholar]
- Avci, Z.U.; Karaman, M.; Ozelkan, E.; Kumral, M.; Budakoglu, M. OBIA based hierarchical image classification for industrial lake water. Sci. Total Environ. 2014, 487, 565–573. [Google Scholar] [CrossRef] [PubMed]
- Benz, U.C.; Hofmann, P.; Willhauck, G.; Lingenfelder, I.; Heynen, M. Multi-resolution, object-oriented fuzzy analysis of remote sensing data for GIS-ready information. ISPRS J. Photogramm. Remote Sens. 2004, 58, 239–258. [Google Scholar] [CrossRef]
- Wang, J.; Zheng, Y.; Wang, M.; Shen, Q.; Huang, J. Object-Scale Adaptive Convolutional Neural Networks for High-Spatial Resolution Remote Sensing Image Classification. IEEE J. Sel. Top. Appl. Earth Obs. Remote Sens. 2020, 14, 283–299. [Google Scholar] [CrossRef]
- Fu, T.; Ma, L.; Li, M.; Johnson, B.A. Using convolutional neural network to identify irregular segmentation objects from very high-resolution remote sensing imagery. J. Appl. Remote Sens. 2018, 12, 025010. [Google Scholar] [CrossRef]
- Arvor, D.; Durieux, L.; Andrés, S.; Laporte, M.-A. Advances in Geographic Object-Based Image Analysis with ontologies: A review of main contributions and limitations from a remote sensing perspective. ISPRS J. Photogramm. Remote Sens. 2013, 82, 125–137. [Google Scholar] [CrossRef]
- Costa, H.; Carrão, H.; Bação, F.; Caetano, M. Combining per-pixel and object-based classifications for mapping land cover over large areas. Int. J. Remote Sens. 2014, 35, 738–753. [Google Scholar] [CrossRef]
- Pal, M.; Mather, M. Some issues in the classification of DAIS hyperspectral data. Int. J. Remote Sens. 2006, 27, 2895–2916. [Google Scholar] [CrossRef]
- Chen, G.; Weng, Q.; Hay, J.; He, Y. Geographic object-based image analysis (GEOBIA): Emerging trends and future op-portunities. GIScience Remote Sens. 2018, 55, 159–182. [Google Scholar] [CrossRef]
- Fallatah, A.; Jones, S.; Mitchell, D.; Kohli, D. Mapping informal settlement indicators using object-oriented analysis in the Middle East. Int. J. Digit. Earth 2018, 12, 802–824. [Google Scholar] [CrossRef]
- Feizizadeh, B.; Garajeh, M.K.; Blaschke, T.; Lakes, T. An object based image analysis applied for volcanic and glacial landforms mapping in Sahand Mountain, Iran. CATENA 2020, 198, 105073. [Google Scholar] [CrossRef]
- Ghasemi, M.; Karimzadeh, S.; Feizizadeh, B. Urban classification using preserved information of high dimensional textural features of Sentinel-1 images in Tabriz, Iran. Earth Sci. Inform. 2021, 1–18. [Google Scholar] [CrossRef]
- Garajeh, M.K.; Malakyar, F.; Weng, Q.; Feizizadeh, B.; Blaschke, T.; Lakes, T. An automated deep learning convolutional neural network algorithm applied for soil salinity distribution mapping in Lake Urmia, Iran. Sci. Total Environ. 2021, 778, 146253. [Google Scholar] [CrossRef] [PubMed]
- Taherzadeh, E.; Shafri, Z. Development of a generic model for the detection of roof materials based on an object-based approach using WorldView-2 satellite imagery. Adv. Remote Sens. 2013, 2, 312–321. [Google Scholar] [CrossRef] [Green Version]
- Fernandes, R.; Aguiar, F.C.; Silva, J.M.; Ferreira, T.; Pereira, M. Optimal attributes for the object-based detection of giant reed in riparian habitats: A comparative study between Airborne High Spatial Resolution and WorldView-2 imagery. Int. J. Appl. Earth Obs. Geoinf. 2014, 32, 79–91. [Google Scholar] [CrossRef]
- United Nations. United Nations Launches Appeal for Iran Earthquake. 2004. Available online: http://www.un.org/News/Press/docs/2004/iha852.doc.htm (accessed on 1 March 2021).
- Solaymani Azad, S.; Saboor, N.; Moradi, M.; Ajhdari, A.; Youssefi, T.; Mashal, M.; Roustaei, M. Preliminary Report on Geological Features of the Ezgaleh-Kermanshah Earthquake (M~7.3), November 12, 2017, West Iran; SSD of GSI Preliminary Report; Geological Survey & Mineral Explorations of Iran: Tehran, Iran, 2017; Volume 17, p. 1.
- Karimzadeh, S.; Matsuoka, M.; Miyajima, M.; Adriano, B.; Fallahi, A.; Karashi, J. Sequential SAR Coherence Method for the Monitoring of Buildings in Sarpole-Zahab, Iran. Remote Sens. 2018, 10, 1255. [Google Scholar] [CrossRef] [Green Version]
- Pourghasemi, H.R.; Gayen, A.; Edalat, M.; Zarafshar, M.; Tiefenbacher, J.P. Is multi-hazard mapping effective in assessing natural hazards and integrated watershed management? Geosci. Front. 2020, 11, 1203–1217. [Google Scholar] [CrossRef]
- Pourghasemi, H.R.; Gayen, A.; Panahi, M.; Rezaie, F.; Blaschke, T. Multi-hazard probability assessment and mapping in Iran. Sci. Total Environ. 2019, 692, 556–571. [Google Scholar] [CrossRef]
- Central Office of Natural Resources and Watershed Management in the Jahrom Township. Hydrology and Flood; Technical Report; Central Office of Natural Resources and Watershed Management in the Jahrom Township: Jahrom, Iran, 2015; Volume 1, pp. 121–122.
- Khosravi, K.; Pourghasemi, R.; Chapi, K.; Bahri, M. Flash flood susceptibility analysis and its mapping using different bivariate models in Iran: A comparison between Shannon’s entropy, statistical index, and weighting factor models. Environ. Monitor. Assess. 2016, 188, 1–21. [Google Scholar] [CrossRef] [PubMed]
- Hoshyar, S.; Zargar, A.; Fallahi, A. Temporary housing pattern based on grounded theory method (Case study: Sarpol-Zahab city after the earthquake 2017). Environ. Hazard Manag. 2020, 6, 287–300. [Google Scholar]
- Washaya, P.; Balz, T. SAR coherence change detection of urban areas affected by disasters using sentinel-1 imagery. Int. Arch. Photogramm. Remote Sens. Spat. Inf. Sci. 2018, XLII-3, 1857–1861. [Google Scholar] [CrossRef] [Green Version]
- Hajeb, M.; Karimzadeh, S.; Fallahi, A. Seismic damage assessment in Sarpole-Zahab town (Iran) using synthetic aperture radar (SAR) images and texture analysis. Nat. Hazards 2020, 103, 1–20. [Google Scholar] [CrossRef]
- Mouthereau, F.; Lacombe, O.; Vergés, J. Building the Zagros collisional orogen: Timing, strain distribution and the dynamics of Arabia/Eurasia plate convergence. Tectonophysics 2012, 532, 27–60. [Google Scholar] [CrossRef]
- Hasanlou, M.; Shah-Hosseini, R.; Seydi, S.; Karimzadeh, S.; Matsuoka, M. Earthquake Damage Region Detection by Multitemporal Coherence Map Analysis of Radar and Multispectral Imagery. Remote Sens. 2021, 13, 1195. [Google Scholar] [CrossRef]
- Feng, W.; Samsonov, S.; Almeida, R.; Yassaghi, A.; Li, J.; Qiu, Q.; Zheng, W. Geodetic constraints of the 2017 Mw7. 3 Sarpol Zahab, Iran earthquake, and its implications on the structure and mechanics of the northwest Zagros thrust-fold belt. Geophys. Res. Lett. 2018, 45, 6853–6861. [Google Scholar] [CrossRef]
- Karimzadeh, S.; Matsuoka, M.; Kuang, J.; Ge, L. Spatial Prediction of Aftershocks Triggered by a Major Earthquake: A Binary Machine Learning Perspective. ISPRS Int. J. Geoinf. 2019, 8, 462. [Google Scholar] [CrossRef] [Green Version]
- Tian, J.; Wang, L.; Li, X.; Gong, H.; Shi, C.; Zhong, R.; Liu, X. Comparison of UAV and WorldView-2 imagery for mapping leaf area index of mangrove forest. Int. J. Appl. Earth Obs. Geoinf. 2017, 61, 22–31. [Google Scholar] [CrossRef]
- Geo-Informatics and Space Technology Development Agency. Worldview-2. 2020. Available online: https://www.gistda.or.th/main/system/files_force/satellite/104/file/2534-m-worldview2-datasheet.pdf?download=1.pdf (accessed on 9 September 2019).
- WorldView-2. WorldView-2 Satellite Sensor. 2019. Available online: https://www.satimagingcorp.com/satellite-sensors/worldview-2/ (accessed on 4 April 2019).
- Digital Globe. The Benefits of the 8 Spectral Bands of WorldView-2. 2009. Available online: http://worldview2.digitalglobe.com/docs/WorldView-2_8-Band_Applications_Whitepaper.pdf (accessed on 20 July 2011).
- Zhou, H.; Liu, Q.; Xu, Q.; Wang, Y. Pan-Sharpening with a CNN-Based Two Stage Ratio Enhancement Method. In Proceedings of the IGARSS IEEE International Geoscience and Remote Sensing Symposium, Waikoloa, HI, USA, 26 September–2 October 2020; pp. 216–219. [Google Scholar] [CrossRef]
- Wang, P.; Alganci, U.; Sertel, E. Comparative Analysis on Deep Learning based Pan-sharpening of Very High-Resolution Satellite Images. Int. J. Environ. Geoinform. 2021, 8, 150–165. [Google Scholar] [CrossRef]
- Pendyala, V.G.K.; Kalluri, H.K.; Rao, V.C. Assessment of Suitable Image Fusion Method for CARTOSAT-2E Satellite Urban Imagery for Automatic Feature Extraction. Adv. Model. Anal. B 2020, 63, 26–32. [Google Scholar] [CrossRef]
- Janalipour, M.; Mohammadzadeh, A. Building Damage Detection Using Object-Based Image Analysis and ANFIS From High-Resolution Image (Case Study: BAM Earthquake, Iran). IEEE J. Sel. Top. Appl. Earth Obs. Remote Sens. 2015, 9, 1937–1945. [Google Scholar] [CrossRef]
- Fallatah, A.; Jones, S.; Mitchell, D. Object-based random forest classification for informal settlements identification in the Middle East: Jeddah a case study. Int. J. Remote Sens. 2020, 41, 4421–4445. [Google Scholar] [CrossRef]
- Kuffer, M.; Pfeffer, K.; Sliuzas, R. Slums from Space—15 Years of Slum Mapping Using Remote Sensing. Remote Sens. 2016, 8, 455. [Google Scholar] [CrossRef] [Green Version]
- Bendini, N.; Fonseca, M.; Soares, R.; Rufin, P.; Schwieder, M.; Rodrigues, A.; Hostert, P. Applying A Phenological Object-Based Image Analysis (Phenobia) for Agricultural Land Classification: A Study Case in the Brazilian Cerrado. In Proceedings of the IGARSS, IEEE International Geoscience and Remote Sensing Symposium, Brussels, Belgium, 26 September–2 October 2020; pp. 1078–1081. [Google Scholar]
- Blaschke, T. Object based image analysis for remote sensing. ISPRS J. Photogramm. Remote Sens. 2010, 65, 2–16. [Google Scholar] [CrossRef] [Green Version]
- Lang, S. Object-based image analysis for remote sensing applications: Modeling reality—Dealing with complexity. In Object-Based Image Analysis; Springer: Berlin/Heidelberg, Germany, 2008; pp. 3–27. [Google Scholar] [CrossRef]
- Belgiu, M.; Csillik, O. Sentinel-2 cropland mapping using pixel-based and object-based time-weighted dynamic time warping analysis. Remote Sens. Environ. 2018, 204, 509–523. [Google Scholar] [CrossRef]
- Najafi, P.; Navid, H.; Feizizadeh, B.; Eskandari, I. Object-based satellite image analysis applied for crop residue estimating using Landsat OLI imagery. Int. J. Remote Sens. 2018, 39, 6117–6136. [Google Scholar] [CrossRef]
- Feizizadeh, B. A Novel Approach of Fuzzy Dempster–Shafer Theory for Spatial Uncertainty Analysis and Accuracy Assessment of Object-Based Image Classification. IEEE Geosci. Remote Sens. Lett. 2017, 15, 18–22. [Google Scholar] [CrossRef]
- Qiu, B.; Zhang, K.; Tang, Z.; Chen, C.; Wang, Z. Developing soil indices based on brightness, darkness, and greenness to improve land surface mapping accuracy. GISci. Remote Sens. 2017, 54, 759–777. [Google Scholar] [CrossRef]
- Blaschke, T.; Feizizadeh, B.; Holbling, D. Object-Based Image Analysis and Digital Terrain Analysis for Locating Landslides in the Urmia Lake Basin, Iran. IEEE J. Sel. Top. Appl. Earth Obs. Remote Sens. 2014, 7, 4806–4817. [Google Scholar] [CrossRef]
- Desheng, L.; Xia, F. Assessing object-based classification: Advantages and limitations. Remote Sens. Lett. 2010, 4, 187–194. [Google Scholar]
- Ghamisi, P.; Benediktsson, J.A.; Cavallaro, G.; Plaza, A. Automatic Framework for Spectral–Spatial Classification Based on Supervised Feature Extraction and Morphological Attribute Profiles. IEEE J. Sel. Top. Appl. Earth Obs. Remote Sens. 2014, 7, 2147–2160. [Google Scholar] [CrossRef]
- Zehtabian, A.; Ghassemian, H. Automatic Object-Based Image Classification Using Complex Diffusions and a New Distance Metric. IEEE Trans. Geosci. Remote Sens. 2016, 54, 4106–4114. [Google Scholar] [CrossRef]
- Xu, H. Rule-based impervious surface mapping using high spatial resolution imagery. Int. J. Remote Sens. 2012, 34, 27–44. [Google Scholar] [CrossRef]
- Hamedianfar, A.; Shafri, M. Detailed intra-urban mapping through transferable OBIA rule sets using WorldView-2 very-high-resolution satellite images. Int. J. Remote Sens. 2015, 36, 3380–3396. [Google Scholar] [CrossRef]
- Qiu, B.; Liu, Z.; Tang, Z.; Chen, C. Developing indices of temporal dispersion and continuity to map natural vegetation. Ecol. Indic. 2016, 64, 335–342. [Google Scholar] [CrossRef]
- Stumpf, A.; Kerle, N. Object-oriented mapping of landslides using Random Forests. Remote Sens. Environ. 2011, 115, 2564–2577. [Google Scholar] [CrossRef]
- Blaschke, T.; Hay, G.J.; Kelly, M.; Lang, S.; Hofmann, P.; Addink, E.; Feitosa, R.Q.; van der Meer, F.; van der Werff, H.; van Coillie, F.; et al. Geographic Object-Based Image Analysis—Towards a new paradigm. ISPRS J. Photogramm. Remote Sens. 2013, 87, 180–191. [Google Scholar] [CrossRef] [PubMed] [Green Version]
- Feizizadeh, B.; Blaschke, T.; Tiede, D.; Moghaddam, M.H.R. Evaluating fuzzy operators of an object-based image analysis for detecting landslides and their changes. Geomorphology 2017, 293, 240–254. [Google Scholar] [CrossRef]
- Wright, J.; Lillesand, T.M.; Kiefer, R.W. Remote Sensing and Image Interpretation. Geogr. J. 1980, 146, 448. [Google Scholar] [CrossRef]
- Karimzadeh, S.; Miyajima, M.; Hassanzadeh, R.; Amiraslanzadeh, R.; Kamel, B. A GIS-based seismic hazard, building vulnerability and human loss assessment for the earthquake scenario in Tabriz. Soil Dyn. Earthq. Eng. 2014, 66, 263–280. [Google Scholar] [CrossRef]
- Karimzadeh, S.; Mastuoka, M. Building Damage Assessment Using Multisensor Dual-Polarized Synthetic Aperture Radar Data for the 2016 M 6.2 Amatrice Earthquake, Italy. Remote Sens. 2017, 9, 330. [Google Scholar] [CrossRef] [Green Version]
- Karimzadeh, S.; Matsuoka, M. A Weighted Overlay Method for Liquefaction-Related Urban DamageDetection: A Case Study of the 6 September 2018 Hokkaido Eastern Iburi Earthquake, Japan. Geosciences 2018, 8, 487. [Google Scholar] [CrossRef] [Green Version]
- Miura, H.; Midorikawa, S.; Matsuoka, M. Building Damage Assessment Using High-Resolution Satellite SAR Images of the 2010 Haiti Earthquake. Earthq. Spectra 2016, 32, 591–610. [Google Scholar] [CrossRef]
- Dong, L.; Shan, J. A comprehensive review of earthquake-induced building damage detection with remote sensing techniques. ISPRS J. Photogramm. Remote Sens. 2013, 84, 85–99. [Google Scholar] [CrossRef]


| Sensor | Date | Orbit Altitude | Bands | Spatial Resolution | Wave Length |
|---|---|---|---|---|---|
| WorldView-2 | 18 November 2017 | 770 km | Blue | 2 × 2 m | 655–690 nm |
| Green | 2 × 2 m | 510–580 nm | |||
| Red | 2 × 2 m | 655–690 nm | |||
| NIR | 2 × 2 m | 780–920 nm | |||
| Panchromatic | 0.5 × 0.5 m | 450–800 nm |
| Description | Equation | Components |
|---|---|---|
| Overall Accuracy | Pi = number of correctly classified pixels N = total number of pixels compared | |
| User Accuracy | ||
| Producer Accuracy | number of sample pixels in a category | |
| Kappa Coefficient | predicted compromise (random compromise) observations with no errors |
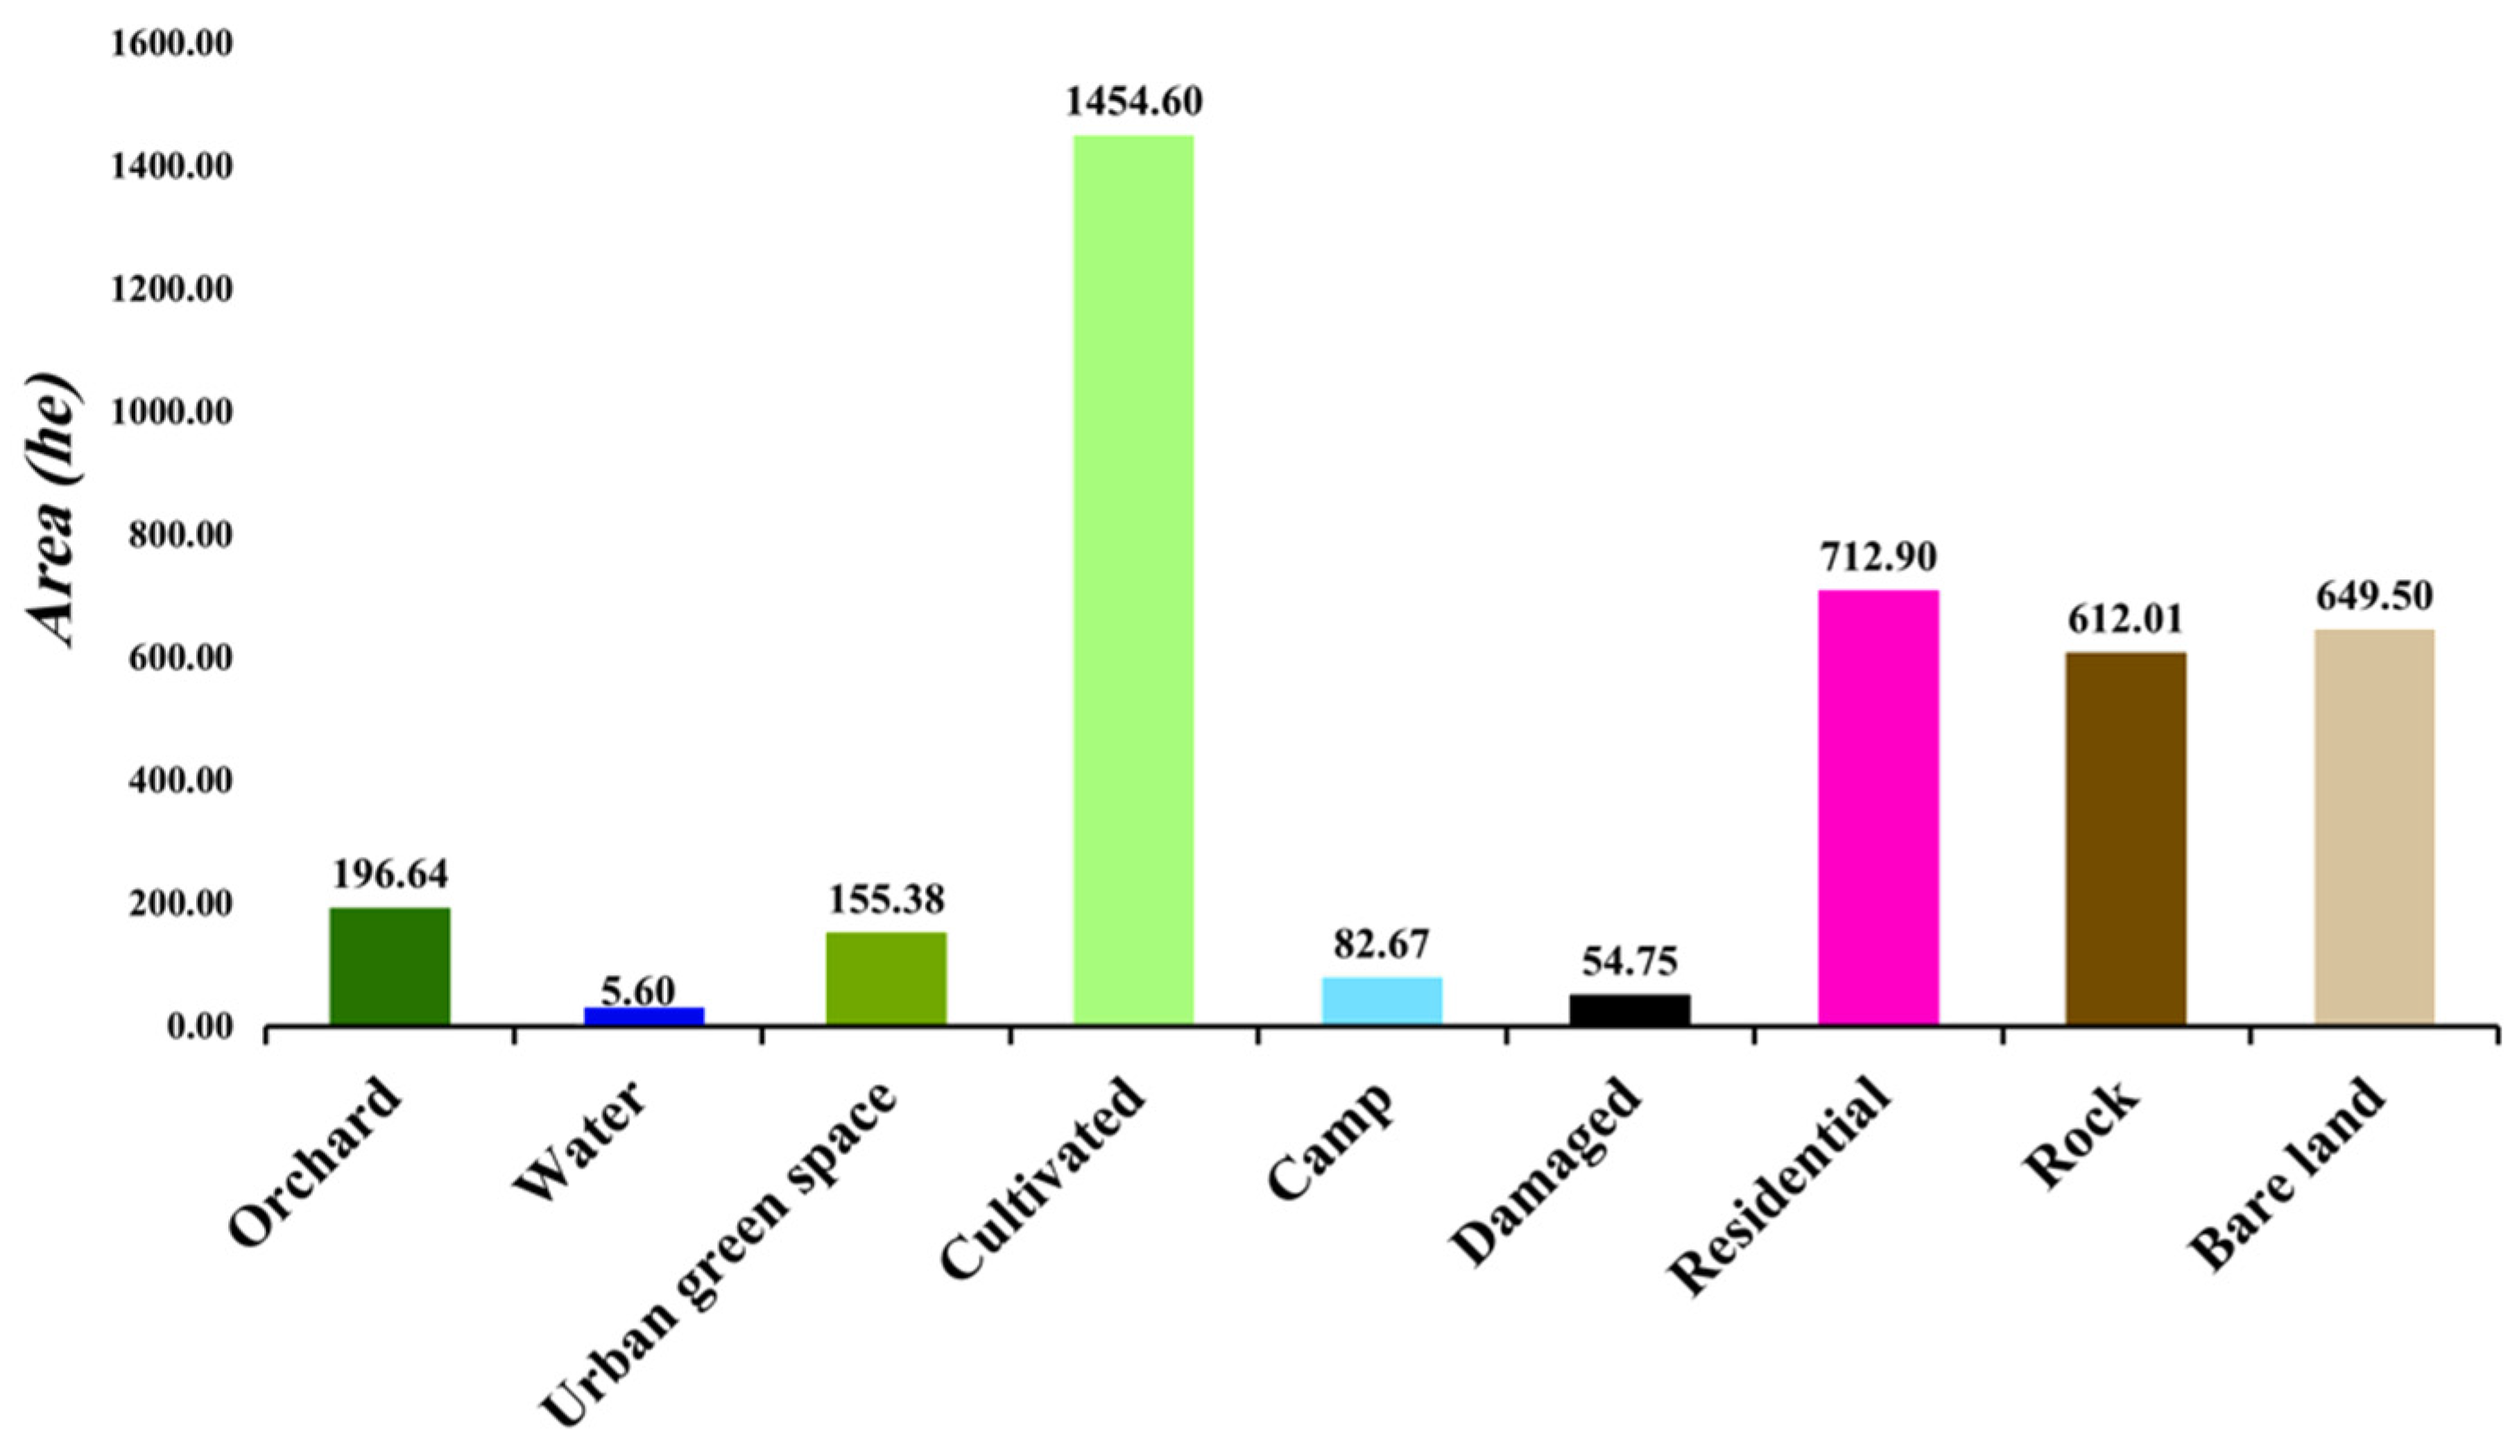
| Type of Vegetation | Area (He) | NDVI |
|---|---|---|
| Orchard | 196.64 | 0.6–1 |
| Cultivated | 1454.60 | 0.3–0.6 |
| Urban green space | 155.38 | 0–0.3 |
| Non vegetation | 2117.42 | 0> |
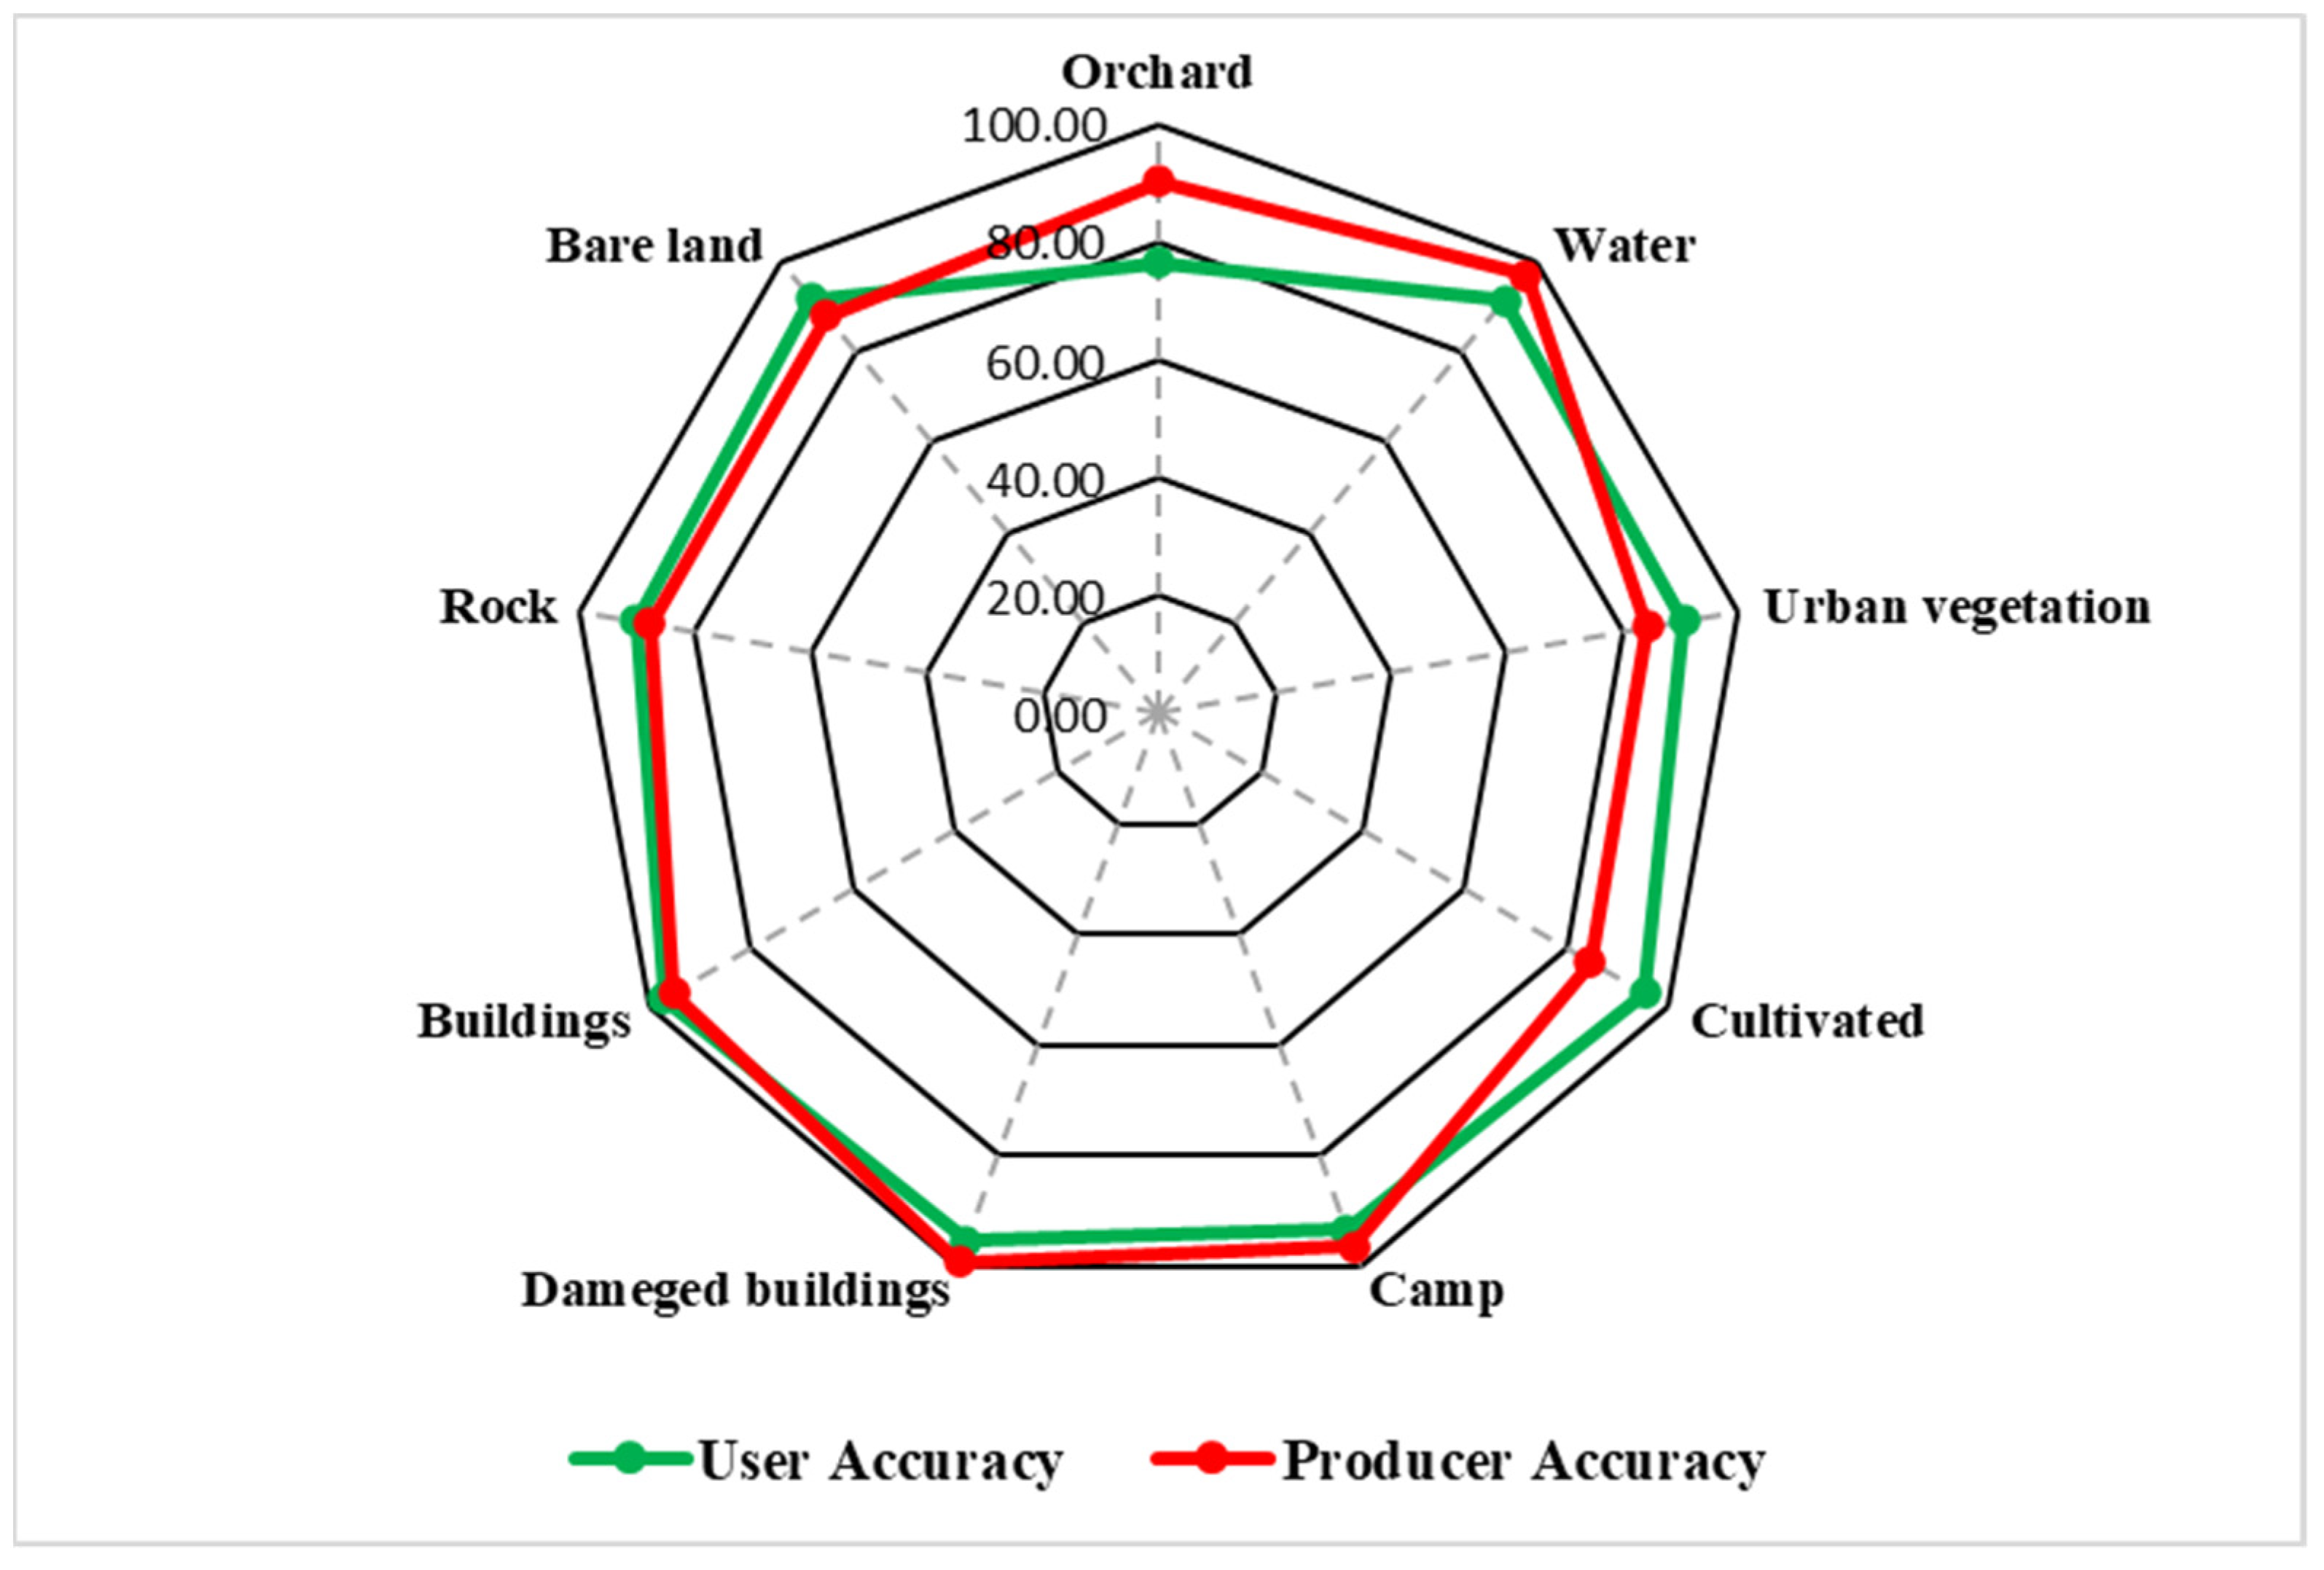
| Class | Orchard | Water | Urban Veg | Cultivated | Camp | Destroyed | Buildings | Rock | Bare Land | SUM | User Accuracy |
|---|---|---|---|---|---|---|---|---|---|---|---|
| Orchard | 167 | 1 | 3 | 6 | 1 | 0 | 1 | 0 | 4 | 183 | 91.26 |
| Water | 0 | 127 | 3 | 0 | 0 | 0 | 0 | 0 | 9 | 139 | 91.37 |
| Urban veg | 0 | 3 | 155 | 3 | 2 | 1 | 4 | 0 | 3 | 171 | 90.64 |
| Cultivated | 7 | 0 | 0 | 198 | 0 | 0 | 0 | 2 | 1 | 208 | 95.19 |
| Camp | 0 | 0 | 12 | 0 | 356 | 2 | 7 | 1 | 3 | 381 | 93.44 |
| Destroyed | 0 | 0 | 1 | 0 | 2 | 715 | 23 | 0 | 9 | 750 | 95.33 |
| Buildings | 0 | 0 | 9 | 0 | 6 | 3 | 765 | 0 | 6 | 789 | 96.96 |
| Rock | 0 | 0 | 0 | 3 | 1 | 0 | 0 | 101 | 7 | 112 | 90.18 |
| Bare land | 6 | 0 | 1 | 6 | 1 | 0 | 2 | 11 | 305 | 332 | 91.87 |
| SUM | 174 | 131 | 173 | 207 | 359 | 3 | 5 | 3 | 134 | 3065 | |
| Producer Accuracy | 92.78 | 96.95 | 84.24 | 91.67 | 96.48 | 99.17 | 95.39 | 87.83 | 87.90 |
| Interpreted Information | Formulation | Calculated Parameter |
|---|---|---|
| Total damaged population (TDP) | Total population − dead people | 45,481 − 600 = 44,881 |
| Emergency toilet | TDP/20 | 44,881/20 = 2244 |
| Emergency bath | TDP/20 | 44,881/20 = 2244 |
| Drinking water bottles (/day) | TDP × 3 | 44,881 × 3 = 134,643 |
| Canned food (/day) | TDP × 4 | 44,881 × 4 = 179,524 |
| Bread pieces (/day) | TDP × 2 | 44,881 × 2 = 89,762 |
| Blanket | TDP × 1 | 44,881 × 1 = 44,881 |
Publisher’s Note: MDPI stays neutral with regard to jurisdictional claims in published maps and institutional affiliations. |
© 2021 by the authors. Licensee MDPI, Basel, Switzerland. This article is an open access article distributed under the terms and conditions of the Creative Commons Attribution (CC BY) license (https://creativecommons.org/licenses/by/4.0/).
Share and Cite
Omarzadeh, D.; Karimzadeh, S.; Matsuoka, M.; Feizizadeh, B. Earthquake Aftermath from Very High-Resolution WorldView-2 Image and Semi-Automated Object-Based Image Analysis (Case Study: Kermanshah, Sarpol-e Zahab, Iran). Remote Sens. 2021, 13, 4272. https://doi.org/10.3390/rs13214272
Omarzadeh D, Karimzadeh S, Matsuoka M, Feizizadeh B. Earthquake Aftermath from Very High-Resolution WorldView-2 Image and Semi-Automated Object-Based Image Analysis (Case Study: Kermanshah, Sarpol-e Zahab, Iran). Remote Sensing. 2021; 13(21):4272. https://doi.org/10.3390/rs13214272
Chicago/Turabian StyleOmarzadeh, Davoud, Sadra Karimzadeh, Masashi Matsuoka, and Bakhtiar Feizizadeh. 2021. "Earthquake Aftermath from Very High-Resolution WorldView-2 Image and Semi-Automated Object-Based Image Analysis (Case Study: Kermanshah, Sarpol-e Zahab, Iran)" Remote Sensing 13, no. 21: 4272. https://doi.org/10.3390/rs13214272