Article

Connectivity Analysis Applied to Mesoscale Eddies in the Western Mediterranean Basin

1
Department of Science and Technology, University of Naples “Parthenope”, 80143 Naples, Italy
2
Institute of Marine Sciences, National Research Council (ISMAR-CNR), 19100 La Spezia, Italy
3
Institute for the Study of Anthropogenic Impacts and Sustainability in the Marine Environment, National Research Council (IAS-CNR), 09170 Oristano, Italy
4
Institute of Atmospheric Sciences and Climate, National Research Council, (ISAC-CNR), 09042 Monserrato, Italy
5
Department of Life and Environmental Sciences, Marche Polytechnic University, 60121 Ancona, Italy
*
Author to whom correspondence should be addressed.
Remote Sens. 2021, 13(21), 4228; https://doi.org/10.3390/rs13214228
Submission received: 17 September 2021 / Revised: 18 October 2021 / Accepted: 20 October 2021 / Published: 21 October 2021

Abstract

:
The Western Mediterranean basin (WMED) is characterized by the presence of energetic and dynamic mesoscale cyclonic and anticyclonic eddies. They mainly originate along the Algerian and the Northern currents and have a large influence on the basin circulation. Eddies can last for months, with longer lifetimes associated with the anticyclones, which can move far from their areas of origin. As they partially isolate and transfer water masses, they also have an impact on water properties (physical, chemical and biological), pollutant’s dispersion and transport of eggs, larvae and planktonic organisms. In this study, a connectivity analysis method is applied to the anticyclonic eddies (AEs) identified by an automated hybrid detection and tracking algorithm south of 42°N in the WMED. The same methodology is also applied to the trajectories of Lagrangian surface drifters available in the study area. The purpose is to highlight the connections between different areas of the basin linked to eddy activities in addition to the connectivity due to the mean surface circulation. Drifter data analysis showed that all the WMED sub-basins are strongly interconnected, with the mean surface circulation allowing a shortcut connection among many areas of the basin. The connectivity analysis of the AEs tracks shows that although AEs are ubiquitous in the WMED, their connectivity is limited to well-defined regions, depending on their origin location. Three main regions: the south-western, the south-eastern and the northern parts of the basin are characterized by AEs recirculation, with sporadic export of eddies to the other WMED zones.

Graphical Abstract

1. Introduction

The Mediterranean Sea is a mid-latitude semi-enclosed evaporation basin, characterized by an outstanding thermohaline circulation [1]. Its circulation and properties are usually represented according to its division between an Eastern (EMED) and a Western (WMED) basin, separated by the Sicily Strait.
The surface layer of the WMED is occupied by the relatively fresher and colder Atlantic Water (AW) entering the Alborán Sea through the Strait of Gibraltar. After crossing the strait, the AW flows eastward through the Alborán Sea and the Algerian Basin (AB) along the northern coast of Africa, originating the Algerian Current (AC; Figure 1; [2,3]).
Due to the complex hydrodynamical processes and the high density gradients between the AC and the surrounding waters, the AC becomes unstable then meandering and generating mesoscale eddies (e.g., [4,5]). These features can last for months, with longer lifetimes associated with the anticyclones, which move far from their areas of origin [6,7] and with characteristics associated with their spawning area.
In the northern part of the WMED, the surface circulation is characterized by the presence of the Northern Current (NC), mainly constituted by AW flowing along the slope from the Ligurian Sea to the Balearic Sea [8,9].
Between the AC and the NC, lies the North Balearic Front (NBF), a thermal front separating the northern Liguro–Provençal Basin from the southern AB. The NBF dynamics is strongly connected with the mesoscale and sub-mesoscale structures crossing the area and with their seasonal variability [10] also impacting on biological response [11].
In the central part of the AB, at around 39.5°N, the Western Mid-Mediterranean Current (WMMC) appears in the surface layer after multi-year averaging [12]. This wide eastward meandering jet has also been detected in the hindcast and historical experiments yet it has never been well documented in observational datasets [13].
Further east, the southward Western Sardinian Current (WSC) is identified at the boundary of the WMED as a longshore current reinforced by the action of the eddies approaching the continental slope. [14].
Mesoscale eddies are detected everywhere in the ocean [15,16] and dominate the kinetic energy [17,18]. They can influence the global ocean circulation at all the scales, the mixing processes as well as the transport of water masses, heat, salt, and substances at great distance from the formation area. Additionally, eddies can disperse pollutants (e.g., marine litter [19]) or have a significant impact on marine ecosystem, through the vertical displacement of nutrients and biomass. At global scale, eddies may also have an impact on global climate change and on air-sea interaction [20].
The formation, propagation and properties of the mesoscale eddies in the AB were largely studied in the past to describe surface properties like sea surface temperatures (SST), ocean colour observations, altimetry data and sea surface salinity (SSS). On the other hand, in situ data [21,22,23] and numerical models [24] provided a description of their vertical structure. More recently, merging data from different platforms has proven to be efficient in describing the 3D eddy structure ([25,26,27,28,29,30,31,32,33] Poulain et al. this issue).
Pessini et al. [7] showed that anticyclonic eddies (AEs) have remarkably longer lifetime than the cyclonic ones in the study area and their Eddy Kinetic Energy (EKE) is generally larger than for cyclones. Furthermore, due to their shorter lifetime, cyclonic eddies do not move far from their origin area and do not considerably influence the connection between different areas of the basin. The same study shows that the lifetime limit of 90 days is a suitable boundary between short and long-living AEs. Accordingly, we argue that only long-living AEs generate a stronger impact on the mesoscale circulation of the basin and can realize significant connections among different regions of the WMED.
For these reasons, only long-life AEs south of 42°N formed in the AB and in the Balearic Sea and with a lifespan longer than 90 days were considered in this work and connections realized through them was compared to the mean surface circulation depicted by drifter data.
To reach this aim, a combination of satellite and drifter data were used to estimate the mean transit time (MTT), connectivity percentage and number of drifters and AEs moving across the WMED. Even if the metrics are based on the same mathematical procedures, the two datasets describe different dynamical processes: AEs describe the connectivity realized only through mesoscale anticyclonic eddies, while drifter-based connectivity is associated to the effects of the mean surface currents in the area.
The paper is organized as follows: data and methods used to compute the statistical connectivity analysis are described in Section 2; results and discussions are presented in Section 3; the concluding remarks are summarized in Section 4.

2. Data and Methods

2.1. Drifter Data and Pseudo-Eulerian Analysis of Drifter Velocities

Lagrangian drifter data were used to investigate the large-scale circulation of the WMED basin and the connection between the different areas of the basin at different spatial scales, following the methodology described in previously published papers (e.g., [19,34,35,36,37]).
The database containing the drifter data is accessible through the Mediterranean Surface Velocity Programme website [38]. All data are managed and pre-processed by the National Institute of Geophysics and Oceanography in Trieste, Italy (OGS). In this work, all the drifter data available in the WMED study area for the period 1985–2016 were used to ensure reliable statistics and spatial coverage for each bin of the WMED.
The analysis of drifters’ trajectories provides an overview of the surface transport during last 30 years. The observations include the effects of the oceanic processes from basin scale to the sub-mesoscale [19,32,36]. This large drifter dataset has been used to provide a quantitative and statistically robust representation of the basin-scale circulation, like previously realized for the whole Mediterranean Sea [39] and its two main sub basins [40,41,42,43].
To reach this aim, a characterization in Eulerian terms is thus needed [33]. The pseudo-Eulerian analysis of Lagrangian data consists of averaging Lagrangian quantities over regularly sized spatial bins (for a review on methods for processing Lagrangian data in the ocean see [44]). The mean surface flow can be then estimated when bins are large enough to guarantee the statistics and small enough to have a sufficient spatial resolution [45]. In order to study the mean velocities obtained by the pseudo-Eulerian analysis, a regular grid of bins having dimensions of 0.5° × 0.5° (about 55 km in latitude and 40 km in longitude) was designed (Figure 2) to obtain a good compromise between spatial resolution and statistical accuracy [46].
Furthermore, to obtain a correct representation of the mean surface flow, bins with less of 20 drifter data were removed [47,48].
The data coverage is obtained computing the number of the trajectories through each bin. Results show some inhomogeneity in the data distribution, with peaks of about 100 drifters north of the Balearic Archipelago, and about 80 drifters along the AC. Nevertheless, some under-sampled areas are present. Despite this inhomogeneity, the total number of observations in the period 1985–2016 in each bin is large enough to guarantee the reliability of the results on several scales ([46] and references therein).
When calculating pseudo-Eulerian velocity statistics from drifter data, the robustness and accuracy of the statistics have to be assessed due to the possible scarcity and inhomogeneity (both in space and time) in the data distribution over the study area. However, Poulain et al. [46] showed that with the exclusion of some areas characterized by strong currents and strong variability, the mean surface circulation over the Mediterranean Sea for the period 1992–2011 can be well represented by means of the drifter data.
The classical method followed to obtain the mean current field using drifter data assumes that the velocity field “U” obtained from the drifter positions can be decomposed in a mean flow “Ū” representative of the mean advection and in a turbulent mesoscale flow “u”. The former describes spatial scales of 50–100 km and the latter from the mesoscale (10–100 km) down to the sub-mesoscale (<10 km). Generally, the turbulent part is parameterized in various ways [49], while the mean current “Ū” is determined by averaging the velocity components over each drifter trajectory crossing a bin. The procedure then consists in the computation of the average Ū of the nk values of velocity Uk measured by all the drifters passing through the k-th bin [50].
Figure 3 represents the mean velocity “Ū” resulting from the pseudo-Eulerian analysis of the drifter trajectories available in the Mediterranean Surface Velocity Programme (medSVP) database. The red arrows indicate mean surface current field. The main flow calculated through the drifter dataset well represents the mean surface circulation in the study area. Higher velocities are found in correspondence of the AC and of the Liguro–Provençal current along the basin boundaries.
Here, the signal of the WMMC, described by Pinardi et al. [12] as a residual current after multi-year averaging and of the WSC [14], is observed.

2.2. Eddy Detection and Tracking Routines Outputs

The tracks of the AEs formed and moving in the WMED south of 42°N are obtained through a hybrid eddy detection and tracking method [51], adapted to the area and applied to 24 years of altimetry data from 1993 to 2016 [7].
The methodology consists in the detection of the largest closed Sea Level Anomaly (SLA) contours through a geometric criterion [52] and in the computation of the Okubo-Weiss parameter through a traditional physical method [53] within the closed contours.
Furthermore, an eddy continuity routine was designed and applied to the tracking algorithm, to avoid any fragmentation of the eddy-trajectories due to the temporal heterogeneity of the altimetric tracks as observed by Le Vu et al. [54].
The eddy detection and tracking routines are coded in MATLAB and are freely available for download thanks to Penven [55]. The outputs consist of a large dataset describing the daily position of the barycentre and of the surface properties of the eddies calculated through altimetry data. As both the geometrical and physical criteria are applied, the method can identify all the mesoscale AEs in the study area and provides data needed for a statistical analysis of their properties [7].
The tracking method was applied covering the same period of 24 years of delayed-time gridded maps of optimally interpolated SLA, with a horizontal resolution of 0.125° × 0.125° (about 14 km), distributed by the Copernicus Marine Environment Monitoring Service (CMEMS). Details on data, products and processing procedures are available on the SSALTO/DUACS User Handbook [56].
According to Pessini et al. [7], cyclonic eddies are characterized by lifespan shorter than 90 days in the 98% of cases with a lifespan close to the drifter life cycle, while anticyclonic eddies can last up to 3 years [6]. As this work aims at highlighting the larger spatial scale of the eddy driven connections, between non-adjacent areas of the WMED and according to the comparable speed of cyclones and anticyclones (a few km per day), it focuses on long-living AEs as they are expected to propagate for longer distances within the basin.
Furthermore, the EKE of anticyclones is generally larger than for cyclones, therefore they can have a stronger impact on the mesoscale circulation of the Algerian Basin and consequently on the WMED.
The diameter of AEs is around 60–100 km and their origin is mainly associated with the baroclinic/barotropic instabilities of the AC, of the NC and, probably, of the NBF.

2.3. Connectivity Analysis

An innovative aspect of this study is the computation of the connectivity analysis based on both drifter and AE tracks. The connectivity is estimated through the computation of the number, percentage and transit time of eddies/drifters connecting a set of previously defined boxes (Figure 4).
To this end, the WMED study area has been divided into 7 sectors (colored areas in Figure 4) characterized by similar dynamics and water properties, based on existent literature. Then each sector has been split into a variable number (3 to 12) of boxes of 1° × 1°, used for the connectivity analysis (Figure 4).
The dimension of the boxes was defined to be larger than the expected dimension of mesoscale eddies in the area and to allow a significant drifter data density in each box.
For each dataset, we analyze and discuss the number of drifters/AEs connecting the different boxes. This variable is defined as the number of drifters/eddies moving from a specific i-th source box toward a j-th specific destination box.
Then, the percentage of drifters/AEs connecting the different boxes was computed as the ratio between the number of drifters/AEs that reach a j-th specific destination box and the total number of drifters/AEs leaving a specific i-th box.
Finally, we calculated the transit time of the drifters/AEs among the N resulting boxes.
Holzer and Hall [57] defined the transit time as that when the particles of a generic substance are transported from a region to another one in a three-dimensional domain. In this case, considering that the available data only provide surface positions of drifters and eddies, the transport takes place in a two-dimensional domain. For this reason, the approach proposed by Carlson et al. [37] and Celentano et al. [58] to compute the transit time statistics was adopted. It identifies a series of source boxes from which each drifter/eddy begins its track and a series of destination boxes where the track can finish (for earlier exit/discrete time approaches see also [59,60]). The time to follow this path represents the transit time of the eddy or the drifter to reach a specific destination box. Furthermore, it is worth noticing that a drifter and/or an eddy can cross a box several times, entering and exiting the source and destination boxes. In such cases, the transit time has been computed as the time from the first exit from a source box to the time of first entry into the destination box according to Carlson et al. [37] and Celentano et al. [58].
The MTT is then calculated following Berline et al. [61] through the formula:
M T T ( i , j ) = 1 m n = 1 m t t n ( i , j )
where ttn(i,j) is the transit time from box “i” to box ”j”, and “m” is the number of eddies or drifters moving from “i” to “j”.
According to this formula, the MTT calculated for adjacent boxes is 0 (zero), as the exit from the source box occurs exactly at the same time as the drifter/AE enters the adjacent box.

3. Results

The results of the connectivity analysis on the drifters and AE tracks are presented in the following figures in the form of square matrices (Figure 5, Figure 6 and Figure 7). The 1° × 1° boxes that represent the source areas are reported on the y-axis, the destination ones on the x-axis.
In each panel, the colour code describes the number, the percentage, or the transit time of drifters/AEs from an origin box on the y-axis to the destination box on the x-axis.
All the values along the main diagonal of these matrices, represented in white, are zeros as they refer to the same area.
Results are discussed for each one of the 7 homogeneous sectors into which we divided the WMED study area.
It is worth remembering that all the variables are calculated considering each source box individually. Therefore, for each couple of boxes, the results obtained for a drifter/eddy moving from the first to the second box are different from the results associated with drifter/eddy moving from the second box to the first.
Moreover, as already introduced, the MTT calculation describes different dynamical processes: associated to AEs (eddy tracking method) or the mean surface currents in the area (drifter data).

3.1. Drifter Connectivity Analysis

The connectivity matrix shows the existence of many connections among the different areas (Figure 5). Sectors of the Western Algerian Basin (A, B) and of the Balearic Sea (G) can export drifters toward all the WMED areas. The same happens for the C9 and C10 areas. Only few areas are not connected: for instance, most of the boxes included in the south-eastern C sector; the D3, E1 and E2 areas that do not export toward the western Algerian Basin (A,B) and in many boxes of the Balearic Sea (G). These results agree with the mean circulation of the basin showed in Figure 3 and described in previous studies (e.g., [62]).
Many drifters are found to move from sector A toward B and C along the AC path; here, the coastal boxes are characterized by high numbers and high percentages, up to 100%, of drifters moving eastward. Additionally, MTT (Figure 6) are short to indicate a high-speed eastward drift direction as supported by the mean drifter velocities (Figure 3).
High connectivity is also found inside the south-eastern Algerian Basin macro-areas (e.g., in the C sector), referring to drifter displacements at sub-basin scale across different boxes of the same sector. The highest values are detected once again in the eastward direction (i.e., from C1 and C4 to C2 and C5). High drifter percentage values (about 40%) are also detected from C1, to C5, C6, C10 and vice-versa (Figure 7). This indicates that while many drifters move eastward, along the Algerian coast, a significant number of them can drift toward the open ocean (i.e., toward C6 and C10). This pattern is probably due to the strong mesoscale activity in the area, with large, long-life and intense eddies, that impact and deviate the AC currents from its path [63]. Additionally, the open ocean boxes of the C sector (C6–C10), show a significant number and percentage of drifters arriving from the northern sector F (i.e., from F4 and F5- to C7 and C8). Even the boxes E1 and D3 are highly connected with boxes C5, C6 with percentage value greater than 50% (Figure 7). Therefore, the connectivity matrix shows that drifters from the northern boxes can move eastward or south-eastward, in agreement with the mean current field associated with WMMC and WSC.
The Balearic sector (G) has an almost internal symmetry, respect to the diagonal. This is probably due to the mesoscale activity. Anyway, the highest number of drifters and percentage are detected approximately along the NC (from G1, G2 to G5, G6).
Despite most of these results being expected and easily explained through the general circulation of the basin, the connectivity analysis highlights and quantifies some links not explained by the mean circulation pattern. In fact, drifter trajectories include contributions at spatial scales different from the mean flow scale. This happens, for example, in A6 area that exports about 40 drifters from the Algerian Basin toward the northern G6 and G7 boxes, or from G1 and F3 that are highly connected to F3 and F6 boxes respectively. Some authors [64,65,66] associated this path with the strong mesoscale circulation of the AB, characterized by high level of EKE and turbulence, that deviates the southern Algerian water northward through the Ibiza or Mallorca Channel.
The MTT matrix (Figure 6) describes relatively quick connection between most of the WMED areas. Most of the connections last less than 200 days. Longer MTT (about 400 days) are only found for drifters moving from sector A to G or from F to A. MTT matrix is directly linked to the mean surface flow as represented by the drifter velocities.
The AC flowing along and through the sectors A, B and C provides a relatively high-speed current connecting the three sectors and the nearby areas.
In the northern part of the basin, a similar connection, even if characterized by lower speed and longer MTT, is provided by the NC transporting the drifters from the eastern areas (sector F) westward and even toward the A sector.

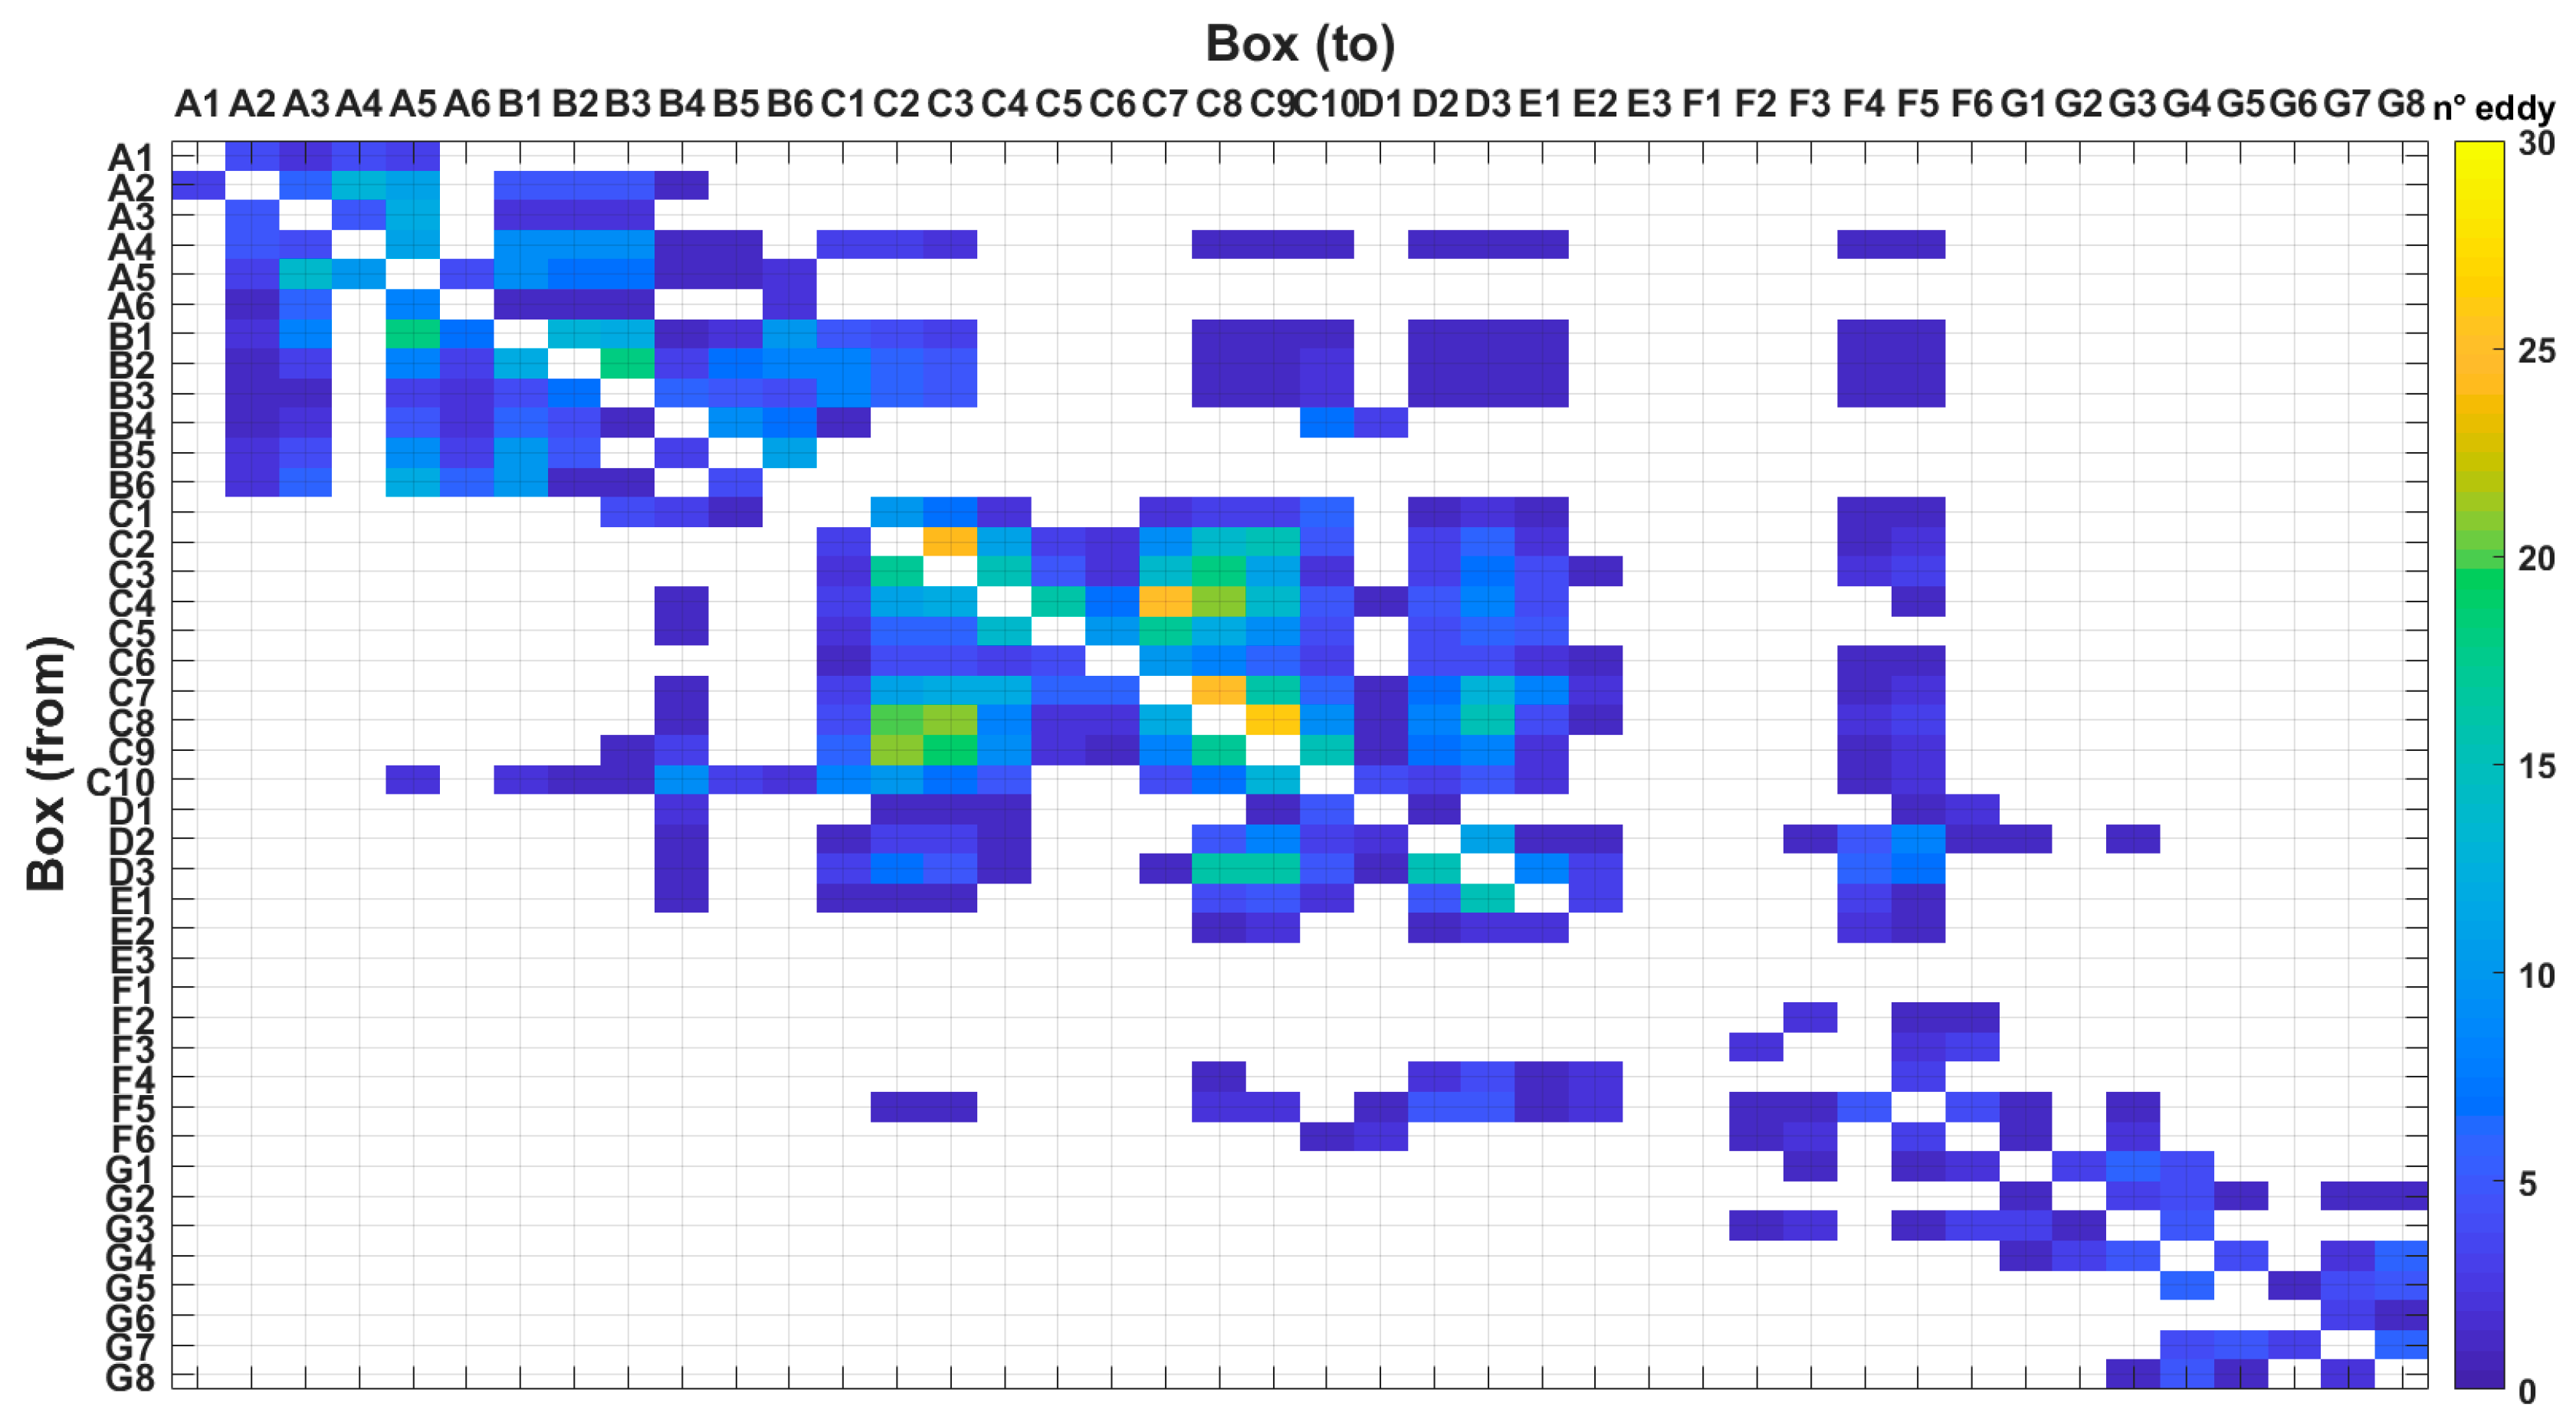
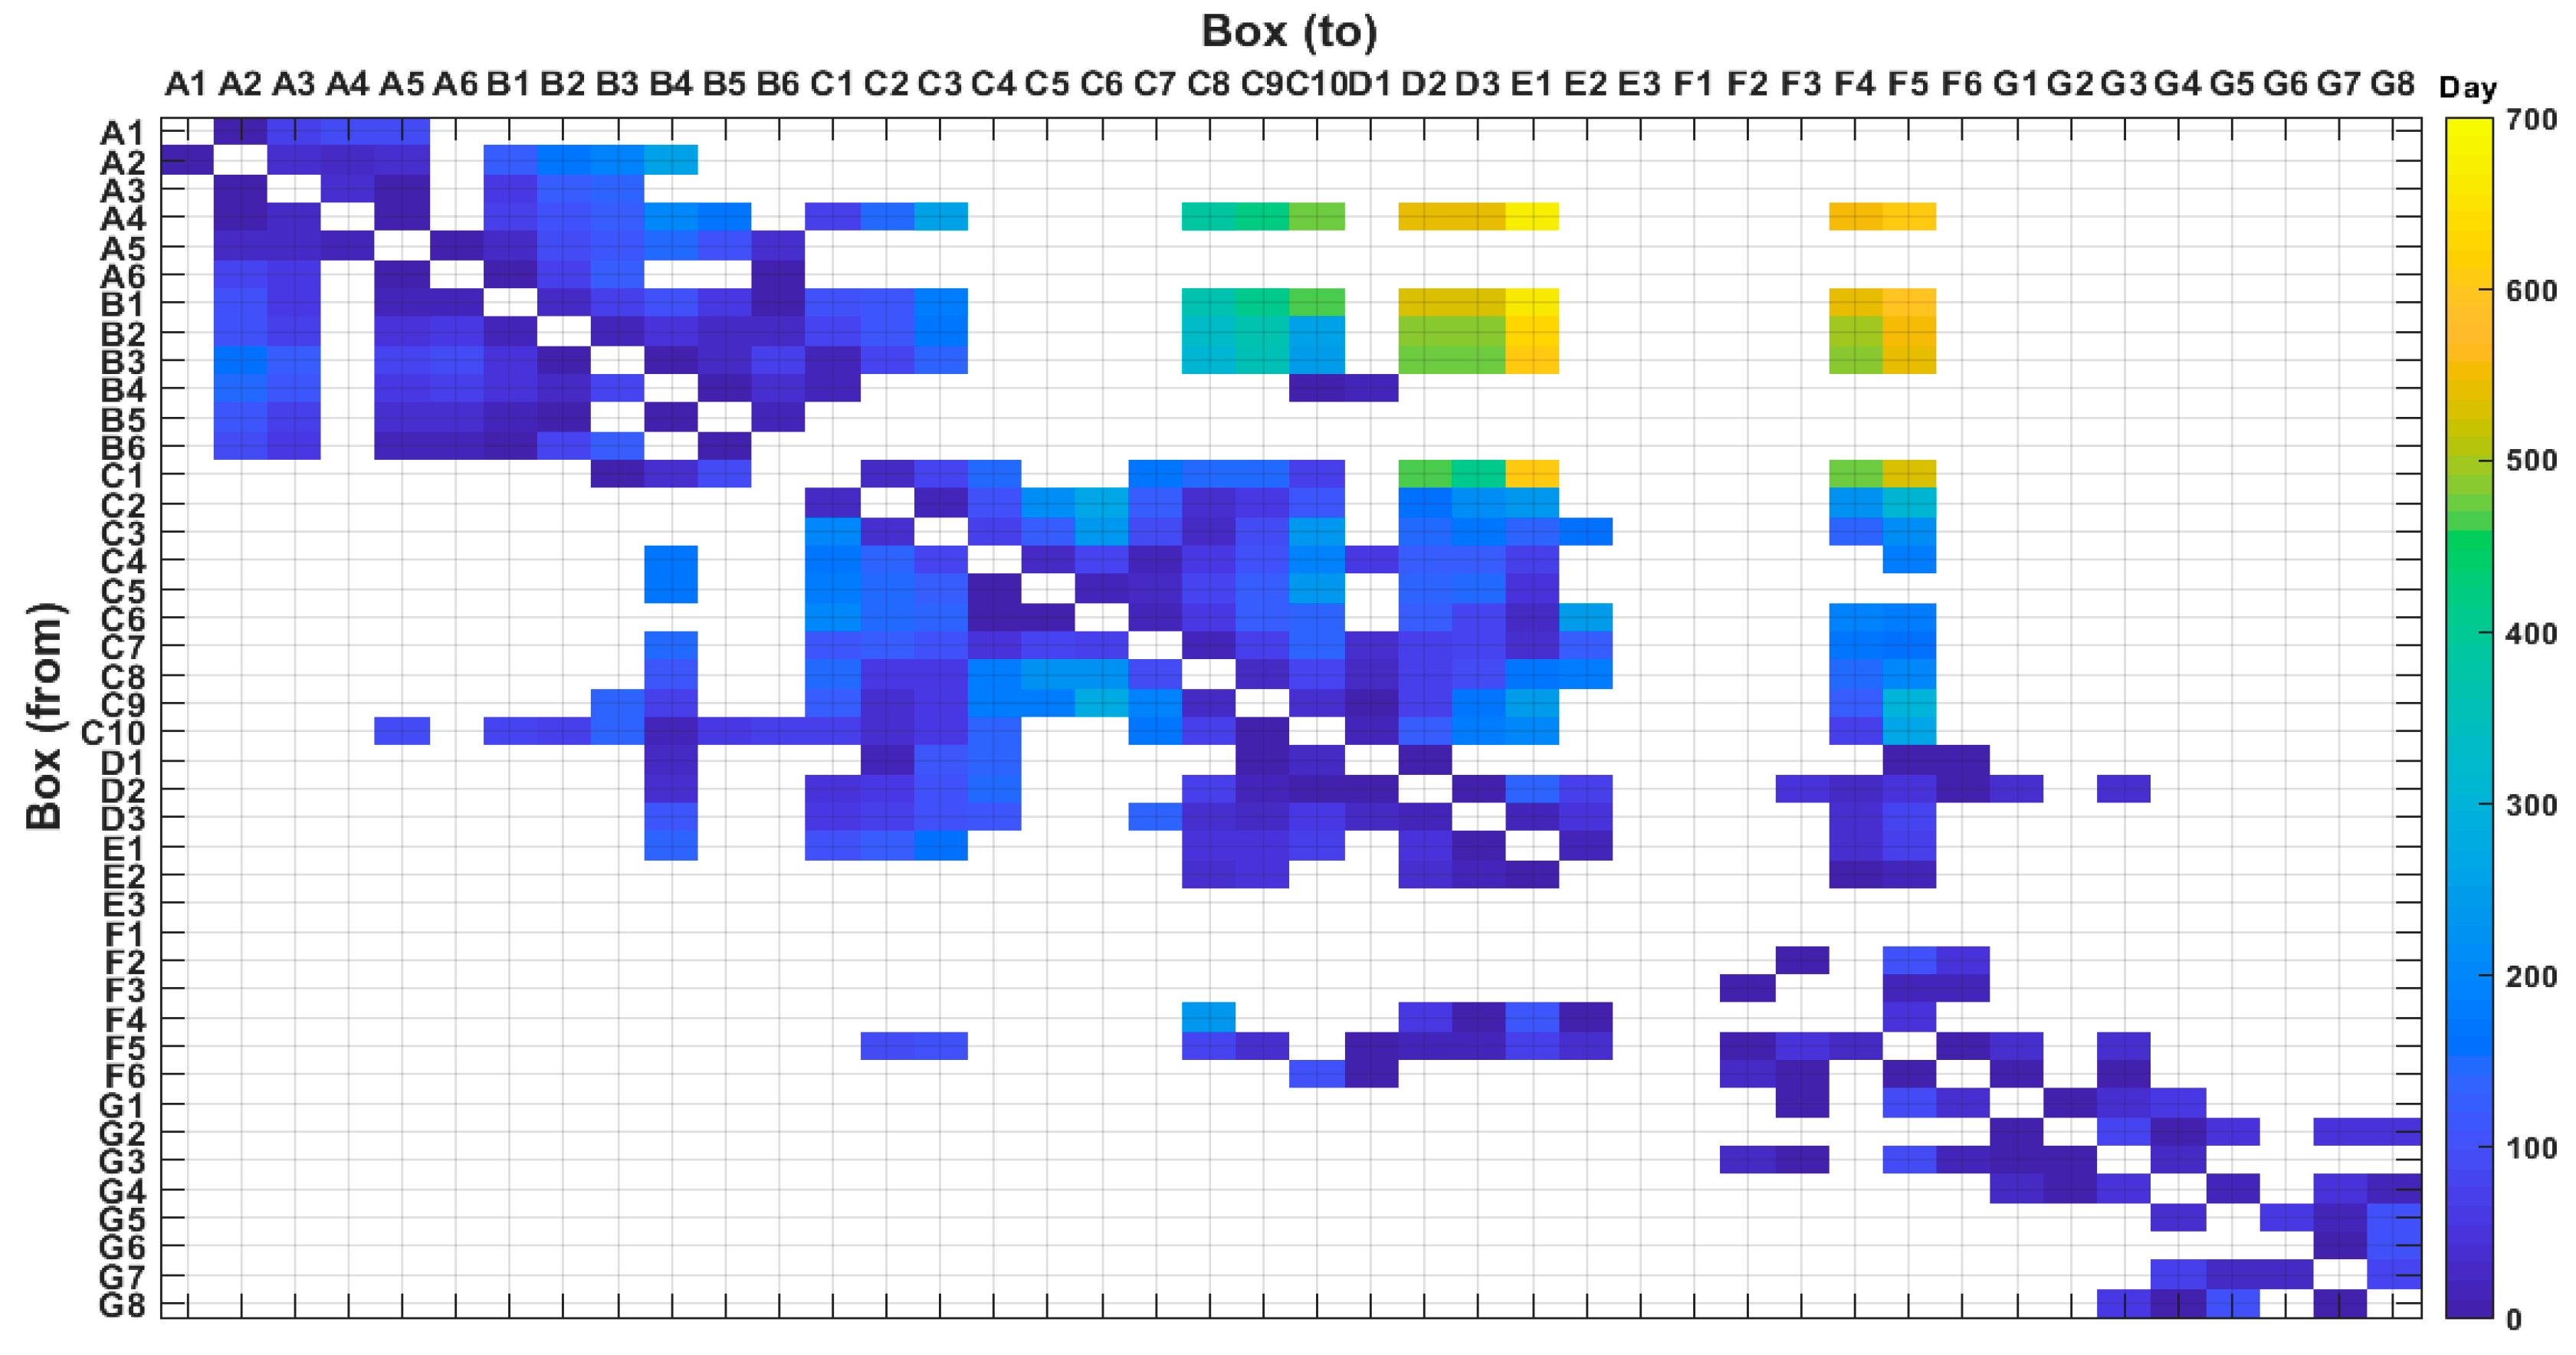
3.2. Anticyclonic Eddies Connectivity Analysis

The comparison between drifter and eddy connectivity matrices, points out significant differences.
Although AEs are ubiquitous in the WMED, AE-connectivity analysis shows that their connectivity is limited to well-defined regions (Figure 8, Figure 9 and Figure 10).
Results suggest that WMED sectors can be grouped into three independent macro-regions (i.e., the southern, the south-eastern and the northern parts of the study area), which are internally connected through eddies but isolated from the others. They are characterized by AEs recirculation, with sporadic export of eddies to the other WMED zones.
In particular, the sectors A and B, located in the southern Algerian Basin, are connected to each other with limited exchanges with adjacent C, D and F areas. This agrees with the presence of the Algerian Current in these sectors that mainly connects the areas in the West-East direction. Additionally, in these sectors of the western AB, the large number of eddies circulating in the AB in the eastward and westward direction generates high internal connectivity values. This is again in accordance with the expected cyclonic path of the eddies in this area, mainly corresponding to the Western Algerian Gyre (WAG).
Sectors C and D, together with areas E1 and E2 form a second macro-region, located in the South-Eastern Algerian Basin. In these sectors, some of the boxes are the destination boxes for AEs coming from several areas belonging to the other sectors. The highest number of connections realized through eddies is found here. Results show up to 25 AEs connecting different areas of the C sector and creating one of the highest connected regions of the WMED. This is the area between the Balearic Islands and Sardinia, where recirculation of eddies is well known to exist e.g., [5,6,22,41,46,64].
A third macro-region is composed of the F and G sectors which are mostly isolated from the rest of the basin, except for the areas from F4 to F6 that connect the southern and northern part of the WMED and are the destination boxes for many AEs. In this context, a key role is played by the F5 area that can represent a boundary between the northern (G) and southern (D) sectors of the basin.
Furthermore, it is worth mentioning that long-living anticyclonic eddies never crossed the areas E3 and F1 over all the 24 years analyzed.
Drifter data are used often in literature to study mesoscale [45] and sub-mesoscale dynamics [46]. Drifter data can be used efficiently to determine mean EKE distributions in the ocean (e.g., [62,67]) but, due to the limited lifetime (the longer drifter lifetime is around 570 days [46]) and to the superposition of motion at different time/spatial scales on drifters’ trajectories, drifters cannot track continuously AEs that are known to last up to 3 years [6]. Even if drifters can be captured by an eddy, following and describing its path from spawning to decay, this happens in a limited number of cases, and cannot provide a description of all the eddy trajectories in the study area.
On the other hand, thanks to 25 years of satellite progresses [68], altimetry data provide a continuous record in both space and time to observe and identify mesoscale structures and the eddy tracking algorithm can follow the mesoscale AEs from their spawning to their decay.
The percentage of AEs shows that the destination of eddies from each box is, in most of cases, a precise and defined area (Figure 9). Eddies formed in sectors A and B generally move along the Algerian coast, sometimes reaching C3, and recirculate in A and B, following the path of the WAG [69]. Eddies formed at the eastern part of the AC, i.e., inside the boxes from C1 to C5, reach the northern areas of the C sector, and recirculate toward the African coast (from C4 to C7 and C8 and from C7 and C8 toward C1, C2 and C3) following the clockwise Eastern Algerian Gyre (EAG). A similar result was reported by Pessini et al. [7], who analyzed the track of mesoscale structures in the Algerian Basin. Connections realized by AEs can be identified also in sector G, north of the Balearic Archipelago.
According to the connectivity results AEs, originated in one of the three macro-regions, never cross the boundaries of these regions with direct implication on the spreading of physical and biochemical properties of the water masses, that cannot thus be transported across different sub-regions by the eddies.
As for the MTT of AEs, Figure 10 shows values up to 700 days in agreement with the lifetime of the long-living anticyclones in the basin [7]. The higher values are found for the AEs originating in sectors A and B and travelling to E and F. Differently from what observed through the drifter connectivity analysis, the northern part of the WMED is characterized by shorter MTT associated with the AEs. This can be once again a consequence of the different spatial scales described by drifters and AEs tracking. The longer MTT values showed in the drifter-connectivity results for the F to A transit may suggest that drifters spend some time trapped in mesoscale or sub-mesoscale structures before entering the destination box or that a drifter can follow a faster (i.e., along the coast) or slower (i.e., on the western side of the Balearic Archipelago) according to the variability of velocities shown in this area (Figure 3).
The eddy-connectivity analysis also allowed the realization of an exporting and importing ranking of the areas (Table 1 and Figure 11) over the 24-year study period (1993–2016).
C and B sectors are the most connected (both in export and import) areas with maximum values registered in the C8 box (139 AEs exported and 158 AEs imported). Groups F and G are characterized by the lowest numbers of AEs exported (four eddies for F2 and G6) and imported (three eddies for G6 and F4), even if the lowest value of imported AEs is found in the boundary A1 box (1 eddy).
Some of the observed outcomes are also summarized in Figure 12 where the number of areas reached by the eddies originating in a specific box (upper panel) and the number of areas from which a specific box receives the eddies (lower panel) are reported.
Results show that several areas included in the A, B and C sectors (i.e., A4, B1, B2, B3 and C10) exported AEs to about 20 different areas during the studied period. At same time, C, D and E boxes are characterized by imports from a higher number of regions (e.g.: C8, C9, C10, D2, D3, E1). The effect of the strong zonal signal of the AC over the basin circulation can be also argued from this information as areas importing a high number of eddies from a higher number of areas are mainly located downflow of the high-exporting areas of the AC.
The northern part of the WMED (mainly F and G sectors) is characterized by lower connection values both in import and export. One exception is represented by the F5 box that exports AEs to about 15 areas and is also the area that imports more eddies. This box is located along the boundary between the northern and southern part of the basin, thus being often close to the NBF, characterized by a strong seasonal variability in its meridional averaged position [70]. The F5 area is associated with the long-life eddies coming from the eastern and south-eastern AB (sectors A and B), and to eddies formed in the Balearic Sea.

4. Summary and Conclusions

The present work combines two different types of data to analyze and describe the surface connectivity in the WMED, realized through both mean flow and mesoscale structures. The two sets of data are: (i) drifter observations collected between 1985 and 2016 provided by medSVP; (ii) AEs tracks obtained from the output of a hybrid eddy detection and tracking method [51] adapted to the WMED by Pessini et al. [7] and applied to altimetry data from 1993 to 2016. In the framework of the connectivity studies, our combined analysis of drifter and satellite data (the latter used to retrieve AEs tracks) provides different and complementary information of the connectivity driven by different processes acting at different scales, namely mean and transient currents.
Connectivity analysis performed separately on drifters and anticyclonic eddy trajectories show significantly different results. Drifters’ connectivity depicts a highly interconnected WMED where a pivotal role on the connectivity is played by the general surface circulation. This implies that some connection routes among different areas are dominated by the surface advection. However, drifter data alone do not allow us to estimate the evolution in space and time of the AEs. Therefore, the connectivity associated with these structures has to be analysed by resorting to observations that continuously trace the AEs, as satellite observations.
When AEs are identified and followed, applying a tracking algorithm to the altimetric data, the connectivity analysis points out that three main WMED macro-regions exist. High values of connectivity were found in these three macro-regions while low AE-driven connectivity values are found in the remaining macro-regions. This may have a direct implication on the spreading of physical and biogeochemical properties carried by eddy dynamics.
The WMED general circulation defines the general pattern of the AEs connectivity through the AC and the NC forcing. Over the analysed 24 years period, the southern sectors of the basin are the most active in importing and exporting AEs across the 1° × 1° regular boxes. As expected, areas of strong activity are mostly located along the AC, the NC and the NBF. Nevertheless, some exceptions, with AE tracks opposed to the general circulation, exist.
In this scenario, the role of AEs acquires a strategic importance, as they can trap and transport isolated water masses across different macro-regions. Furthermore, numerical model studies [71,72], have shown that eddies are responsible for a superdiffusive regime and that they have an impact on the turbulent properties of the study area at depths between 0 and 100 m.
Eddies also have an impact on the biological activity and fishing stocks distribution all around the global ocean [73,74,75,76,77]. They also represent a unique and powerful system for larvae and juvenile dispersal during their early pelagic life stages [78,79,80] providing significant opportunities/limitations for habitat expansion, maintenance of sustainable population sizes, and the exchange of genetic material between geographically distant populations. Additionally, recent studies assessed that the Mediterranean Sea is very vulnerable to possible accumulation of floating litter e.g., [81,82,83], and that a general tendency of floating matter to collect in the southern portion of the WMED basin is realistic [19]. In fact, the calculation of MTT values suggests that the presence/disappearance of transient litter accumulation in specific WMED locations can be related to AEs dynamics and decay.
The connectivity analysis presented here has significantly integrated previous studies based on drifter data. Our analyses on AEs connectivity can further help us to understand the distribution of physical and bio-geochemical signals, including the fate of marine litter, the spatial pattern of pelagic larval stages or the shaping of nutrients, and their transport inside isolated water masses across different macro-regions.

Author Contributions

Contributions provided by each author follow: Conceptualization, Y.C., F.P., A.P., G.A., P.F., P.C., A.O.; Methodology, Y.C., F.P., A.P., G.A., P.F., P.C., A.O.; Formal Analysis, Y.C., P.C., G.A., A.P., A.O., P.F., F.P.; Investigation, Y.C., P.C., G.A., A.P., A.O., P.F., R.S., A.R., G.B., G.F., F.P.; Writing—Original Draft Preparation, Y.C., F.P., A.P., G.A., P.F., P.C., A.O.; Writing—Review and Editing, Y.C., P.C., G.A., A.P., A.O., P.F., R.S., A.R., G.B., G.F., F.P. All authors have read and agreed to the published version of the manuscript.

Funding

This research received no external funding.

Institutional Review Board Statement

Not applicable.

Informed Consent Statement

Not applicable.

Data Availability Statement

Drifter observations have been provided by the Mediterranean Surface Velocity Programme website (medSVP database; see [38] in Bibliography) available at http://nodc.ogs.trieste.it/nodc/metadata/doidetails?doi=10.6092/7a8499bc-c5ee-472c-b8b5-03523d1e73e9 (accessed on 16 June 2021). Sea Level Anomaly (SLA) data have been provided by the Copernicus Marine Environment Monitoring Service (CMEMS) at https://marine.copernicus.eu/ (accessed on 21 February 2021).

Acknowledgments

G.A. work was realized in the framework of the PON R&I 2014–2020 “AIM—Attraction and International Mobility” at Università degli Studi di Napoli Parthenope. F.P. work was realized in the framework of the Italian project “SOS-Piattaforme & Impatti Offshore” (Servizio Di Previsione Numerica Della Dispersione Di Idrocarburi Dalle Piattaforme Petrolifere Del Canale Di Sicilia E Medio/Basso Adriatico) funded by the Italian Ministry of Environment (MATTM; Division III–Sea Defence; Reg. Uff. U. 0000939.17-01-2017).

Conflicts of Interest

The authors declare no conflict of interest.

References

  1. Bergamasco, A.; Malanotte-Rizzoli, P. The circulation of the Mediterranean Sea: A historical review of experimental investigations. Adv. Ocean. Limn. 2010, 1, 11–28. [Google Scholar] [CrossRef]
  2. Millot, C.; Taupier-Letage, I. Circulation in the Mediterranean Sea. In The Mediterranean Sea, The Handbook of Environmental Chemistry; Saliot, A., Ed.; Springer Publ.: Berlin, Germany, 2005; Volume 5K, pp. 29–66. [Google Scholar] [CrossRef]
  3. Fusco, G.; Manzella, G.M.R.; Cruzado, A.; Gačić, M.; Gasparini, G.P.; Kovačević, V.; Millot, C.; Tziavos, C.; Velasquez, Z.R.; Walne, A.; et al. Variability of mesoscale features in the Mediterranean Sea from XBT data analysis. Ann. Geophys. 2003, 21, 21–32. [Google Scholar] [CrossRef]
  4. Millot, C. Some features of the Algerian Current. J. Geophys. Res. Oceans. 1985, 90, 7169–7176. [Google Scholar] [CrossRef]
  5. Salas, J.; Millot, C.; Font, F.; García-Ladona, E. Analysis of mesoscale phenomena in the Algerian basin from drifting buoys and infrared images. Deep-Sea Res. 2002, 49, 245–266. [Google Scholar] [CrossRef]
  6. Puillat, I.; Taupier-Letage, I.; Millot, C. Algerian Eddies lifetime can near 3 years. J. Mar. Syst. 2002, 31, 245–259. [Google Scholar] [CrossRef] [Green Version]
  7. Pessini, F.; Olita, A.; Cotroneo, Y.; Perilli, A. Mesoscale eddies in the Algerian Basin: Do they differ as a function of their formation site? Ocean Sci. 2018, 14, 669–688. [Google Scholar] [CrossRef] [Green Version]
  8. Millot, C. Circulation in the Western Mediterranean Sea. J. Mar. Syst. 1999, 20, 423–442. [Google Scholar] [CrossRef] [Green Version]
  9. Send, U.; Font, J.; Krahmann, G.; Millot, C.; Rhein, M.; Tintoré, J. Recent advances in observing the physical oceanography of the western Mediterranean Sea. Prog. Oceanogr. 1999, 44, 37–64. [Google Scholar] [CrossRef]
  10. García, E.; Tintoré, J.; Pinot, J.M.; Font, J.; Manriquez, M. Surface circulation and dynamic of the Balearic Sea. In Seasonal and Interannual Variability of the Western Mediterranean Sea; La Viollette, P.E., Ed.; Coastal and Estuarine Studies Series; AGU Publ.: Washington, DC, USA, 1994; Volume 46, pp. 73–91. [Google Scholar] [CrossRef]
  11. Olita, A.; Sparnocchia, S.; Cusí, S.; Fazioli, L.; Sorgente, R.; Tintoré, J.; Ribotti, A. Observations of a phytoplankton spring bloom onset triggered by a density front in NW Mediterranean. Ocean Sci. 2014, 10, 657–666. [Google Scholar] [CrossRef] [Green Version]
  12. Pinardi, N.; Zavatarelli, M.; Adani, M.; Coppini, G.; Fratianni, C.; Oddo, P.; Simoncelli, S.; Tonani, M.; Lyubartsev, V.; Dobricic, S.; et al. The Mediterranean Sea large scale low frequency ocean variability from 1987 to 2007: A retrospective analysis. Prog. Oceanogr. 2015, 132, 318–332. [Google Scholar] [CrossRef]
  13. Sannino, G.; Carillo, A.; Iacono, R.; Napolitano, E.; Palma, M.; Pisacane, G.; Struglia, M.V. Modelling Present and Future Climate in the Mediterranean Sea: A Focus on Sea-Level Change. Clim. Dyn. 2021. [Google Scholar] [CrossRef]
  14. Olita, A.; Iermano, I.; Fazioli, L.; Ribotti, A.; Tedesco, C.; Pessini, F.; Sorgente, R. Impact of currents on surface flux computations and their feedback on dynamics at regional scales. Ocean Sci. 2015, 11, 657–666. [Google Scholar] [CrossRef] [Green Version]
  15. Cotroneo, Y.; Budillon, G.; Fusco, G.; Spezie, G. Cold core eddies and fronts of the Antarctic Circumpolar Current south of New Zealand from in situ and satellite data. J. Geophys. Res. Ocean. 2013, 118, 2653–2666. [Google Scholar] [CrossRef]
  16. Chen, G.; Han, G. Contrasting short-lived with long-lived mesoscale eddies in the global ocean. J. Geophys. Res. Ocean. 2019, 124, 3149–3167. [Google Scholar] [CrossRef]
  17. Morrow, R.; Le Traon, P.-Y. Recent advances in observing mesoscale ocean dynamics with satellite altimetry. Adv. Space Res. 2012, 50, 1062–1076. [Google Scholar] [CrossRef] [Green Version]
  18. Menna, M.; Cotroneo, Y.; Falco, P.; Zambianchi, E.; Di Lemma, R.; Poulain, P.-M.; Fusco, G.; Budillon, G. Response of the Pacific Sector of the Southern Ocean to wind stress variability from 1995 to 2017. J. Geophys. Res. Oceans. 2020, 125, e2019JC015696. [Google Scholar] [CrossRef]
  19. Zambianchi, E.; Trani, M.; Falco, P. Lagrangian Transport of Marine Litter in the Mediterranean Sea. Front. Environ. Sci. 2017, 5, 5. [Google Scholar] [CrossRef] [Green Version]
  20. Zhang, Z.; Wang, W.; Qiu, B. Oceanic mass transport by mesoscale eddies. Science 2014, 345, 322–324. [Google Scholar] [CrossRef]
  21. Tarry, D.R.; Essink, S.; Pascual, A.; Ruiz, S.; Poulain, P.-M.; Özgökmen, T.; Centurioni, L.R.; Farrar, J.T.; Shcherbina, A.; Mahadevan, A.; et al. Frontal convergence and vertical velocity measured by drifters in the Alboran Sea. J. Geophys. Res. Ocean. 2021, 126, e2020JC016614. [Google Scholar] [CrossRef]
  22. Fuda, L.; Millot, C.; Taupier-Letage, I.; Send, U.; Bocognano, J.M. XBT monitoring of a meridian section across the Western Mediterranean Sea. Deep-Sea Res. I 2000, 47, 2191–2218. [Google Scholar] [CrossRef]
  23. Troupin, C.; Ruiz, S.; Olita, A.; Casas, B.; Margirier, F.; Poulain, P.-M.; Notarstefano, G.; Torner, M.; Fernàndez, J.; Rùjula, M.; et al. The AlborEX dataset: Sampling of sub-mesoscale features in the Alboran Sea. Earth Syst. Sci. Data 2019, 11, 129–145. [Google Scholar] [CrossRef] [Green Version]
  24. Lévy, M.; Mémery, L.; Madec, G. Combined effects of mesoscale processes and atmospheric high-frequency variability on the spring bloom in the MEDOC area. Deep Sea Res. I 2000, 47, 27–53. [Google Scholar] [CrossRef]
  25. Stegner, A.; Briac, L.V. Atlas of 3D Eddies in the Mediterranean Sea from 2000 to 2017, 2019. ESPRI/IPSL, MISTRALS Database. Available online: https://mistrals.sedoo.fr/ (accessed on 8 July 2021).
  26. Cotroneo, Y.; Aulicino, G.; Ruiz, S.; Pascual, A.; Budillon, G.; Fusco, G.; Tintorè, J. Glider and satellite high resolution monitoring of a mesoscale eddy in the Algerian basin: Effects on the mixed layer depth and biochemistry. J. Mar. Syst. 2016, 162, 73–88. [Google Scholar] [CrossRef] [Green Version]
  27. Cotroneo, Y.; Aulicino, G.; Ruiz, S.; Sánchez Román, A.; Torner Tomàs, M.; Pascual, A.; Fusco, G.; Heslop, E.; Tintoré, J.; Budillon, G. Glider data collected during the Algerian Basin Circulation Unmanned Survey from 2014 to 2016. Earth Syst. Sci. Data. 2019, 11, 147–161. [Google Scholar] [CrossRef] [Green Version]
  28. Aulicino, G.; Cotroneo, Y.; Ruiz, S.; Sanchez Roman, A.; Pascual, A.; Fusco, G.; Tintorè, J.; Budillon, G. Monitoring the Alge-rian Basin through glider observations, satellite altimetry and numerical simulations along a SARAL/AltiKa track. J. Mar. Syst. 2018, 179, 55–71. [Google Scholar] [CrossRef]
  29. Barceló-Llull, B.; Pascual, A.; Sánchez-Román, A.; Cutolo, E.; d’Ovidio, F.; Fifani, G.; Ser-Giacomi, E.; Ruiz, S.; Mason, E.; Cyr, F.; et al. Fine-Scale Ocean Currents Derived From in situ Observations in Anticipation of the Upcoming SWOT Altimetric Mission. Front. Mar. Sci. 2018, 8, 679844. [Google Scholar] [CrossRef]
  30. Pessini, F.; Cotroneo, Y.; Olita, A.; Sorgente, R.; Ribotti, A.; Jendersie, S.; Perilli, A. Life history of an anticyclonic eddy in the Algerian basin from altimetry data, tracking algorithm and in situ observations. J. Mar. Syst. 2020, 207, 103346. [Google Scholar] [CrossRef]
  31. Aulicino, G.; Cotroneo, Y.; Lacava, T.; Sileo, G.; Fusco, G.; Carlon, R.; Satriano, V.; Pergola, N.; Tramutoli, V.; Budillon, G. Results of the first wave glider experiment in the southern Tyrrhenian Sea. Adv. Oceanogr. Limnol. 2016, 7, 16–35. [Google Scholar] [CrossRef] [Green Version]
  32. Aulicino, G.; Cotroneo, Y.; Olmedo, E.; Cesarano, C.; Fusco, G.; Budillon, G. In Situ and Satellite Sea Surface Salinity in the Algerian Basin Observed Through ABACUS Glider Measurements and SMOS Enhanced Products. Remote Sens. 2019, 11, 1361. [Google Scholar] [CrossRef] [Green Version]
  33. Rio, M.-H.; Pascual, A.; Poulain, P.-M.; Menna, M.; Barceló, B.; Tintoré, J. Computation of a new mean dynamic topography for the Mediterranean Sea from model outputs, altimeter measurements and oceanographic in situ data. Ocean Sci. 2014, 10, 731–744. [Google Scholar] [CrossRef] [Green Version]
  34. Davis, R.E. Drifter observations of coastal surface currents during CODE: The statistical and dynamical views. J. Geophys. Res. Ocean. 1985, 90, 4756–4772. [Google Scholar] [CrossRef]
  35. Olascoaga, M.J.; Miron, P.; Paris, C.; Pérez-Brunius, P.; Pérez-Portela, R.; Smith, R.H.; Vaz, A. Connectivity of pulley ridge with remote locations as inferred from satellite-tracked drifter trajectories. J. Geophys. Res. Ocean. 2018, 123, 5742–5750. [Google Scholar] [CrossRef]
  36. Miron, P.; Beron-Vera, F.J.; Olascoaga, M.J.; Sheinbaum, J.; Pérez-Brunius, P.; Froyland, G. Lagrangian dynamical geography of the Gulf of Mexico. Sci. Rep. 2017, 7, 7021. [Google Scholar] [CrossRef] [Green Version]
  37. Carlson, D.; Griffa, A.; Zambianchi, E.; Suaria, G.; Corgnati, L.; Magaldi, M.; Poulain, P.-M.; Russo, A.; Bellomo, L.; Mantovani, C.; et al. Observed and modeled surface Lagrangian transport between coastal regions in the Adriatic Sea with implications for marine protected areas. Cont. Shelf Res. 2016, 118, 23–48. [Google Scholar] [CrossRef]
  38. medSVP. Available online: http://nodc.ogs.trieste.it/nodc/metadata/doidetails?doi=10.6092/7a8499bc-c5ee-472c-b8b5-03523d1e73e9 (accessed on 2 July 2021).
  39. Mauerhan, T.A. Drifter Observations of the Mediterranean Sea Surface Circulation. Master’s Thesis, Naval Postgraduate School, Monterey, CA, USA, 2000; p. 111. Available online: http://hdl.handle.net/10945/26496 (accessed on 16 June 2021).
  40. Gerin, R.; Poulain, P.-M.; Taupier-Letage, I.; Millot, C.; Ben Ismail, S.; Sammari, C. Surface circulation in the Eastern Mediterranean using Lagrangian drifters (2005–2007). Ocean Sci. 2009, 5, 559–574. [Google Scholar] [CrossRef] [Green Version]
  41. Salas, J.; Garcia-Ladona, E.; Font, J. Statistical analysis of the surface circulation in the Algerian Current using Lagrangian buoys. J. Mar. Syst. 2001, 29, 69–85. [Google Scholar] [CrossRef]
  42. Poulain, P.-M.; Gerin, R.; Rixen, M.; Zanasca, P.; Teixeira, J.; Griffa, A.; Molcard, A.; De Marte, M.; Pinardi, N. Aspects of the surface circulation in the Liguro-Provençal basin and Gulf of Lion as observed by satellite-tracked drifters (2007–2009). Boll. Geofis. Teor. Appl. 2012, 53, 261–279. [Google Scholar]
  43. Menna, M.; Poulain, P.-M.; Zodiatis, G.; Gertman, I. On the surface circulation of the Levantine sub-basin derived from Lagrangian drifters and satellite altimetry data. Deep-Sea Res. I 2012, 65, 46–58. [Google Scholar] [CrossRef]
  44. La Casce, J.H. Statistics from Lagrangian observations. Prog. Oceanogr. 2008, 77, 1–29. [Google Scholar] [CrossRef]
  45. Falco, P.; Zambianchi, E. Near-surface structure of the Antarctic Circumpolar Current derived from World Ocean Circulation Experiment drifter data. J. Geophys. Res. Ocean. 2011, 116, C05003. [Google Scholar] [CrossRef] [Green Version]
  46. Poulain, P.-M.; Bussani, A.; Gerin, R.; Jungwirth, R.; Mauri, E.; Menna, M.; Notarstefano, G. Mediterranean surface currents measured with drifters: From basin to subinertial scales. Oceanography 2013, 26, 38–47. [Google Scholar] [CrossRef] [Green Version]
  47. Falco, P.; Griffa, A.; Poulain, P.-M.; Zambianchi, E. Transport properties in the Adriatic Sea as deduced from drifter data. J. Phys. Oceanogr. 2000, 30, 2055–2071. [Google Scholar] [CrossRef]
  48. Poulain, P.-M.; Zambianchi, E. Surface circulation in the central Mediterranean Sea as deduced from Lagrangian drifters in the 1990s. Cont. Shelf Res. 2007, 27, 981–1001. [Google Scholar] [CrossRef]
  49. Zambianchi, E.; Griffa, A. Effects of finite scales of turbulence on dispersion estimates. J. Mar. Res. 1994, 52, 129–148. [Google Scholar] [CrossRef]
  50. Poulain, P.-M.; Niiler, P.P. Statistical analysis of the surface circulation in the California Current System using satellite-tracked drifters. J. Phys. Oceanogr. 1989, 19, 1588–1603. [Google Scholar] [CrossRef] [Green Version]
  51. Halo, I.; Backeberg, B.; Penven, P.; Ansorge, I.; Reason, C.; Ullgren, J.E. Eddy properties in the Mozambique Channel: A comparison between observations and two numerical ocean circulation models. Deep-Sea Res. I 2014, 100, 38–53. [Google Scholar] [CrossRef]
  52. Chelton, D.B.; Schlax, M.G.; Samelson, R.M. Global observations of nonlinear mesoscale eddies. Prog. Oceanogr. 2011, 91, 167–216. [Google Scholar] [CrossRef]
  53. Chelton, D.B.; Schlax, M.G.; Samelson, R.M.; De Szoeke, R.A. Global observations of large oceanic eddies. Geophys. Res. Lett. 2007, 34, L15606. [Google Scholar] [CrossRef]
  54. Le Vu, B.; Stegner, A.; Arsouze, T. Angular Momentum Eddy Detection and tracking Algorithm (AMEDA) and its application to coastal eddy formation. J. Atmos. Ocean. Tech. 2017, 35, 739–762. [Google Scholar] [CrossRef]
  55. Penven, P. Detection and Tracking Algorithm. 2011. Available online: https://sourceforge.net/projects/eddydetect/ (accessed on 15 May 2021).
  56. SSALTO/DUACS User Handbook. Available online: http://cmems-resources.cls.fr/documents/PUM/CMEMS-SL-PUM-008-032-051.pdf (accessed on 2 July 2021).
  57. Holzer, M.; Hall, T.M. Transit-time and tracer-age distributions in geophysical flows. J. Atmos. Sci. 2000, 57, 3539–3558. [Google Scholar] [CrossRef] [Green Version]
  58. Celentano, P.; Falco, P.; Zambianchi, E. Surface connection between the Ionian Sea and different areas of the Mediterranean derived from drifter data. Deep-Sea Res. I 2020, 166, 103431. [Google Scholar] [CrossRef]
  59. Castiglione, P.; Cencini, M.; Vulpiani, A.; Zambianchi, E. Transport in finite size systems: An exit time approach. Chaos 1999, 9, 871–879. [Google Scholar] [CrossRef] [Green Version]
  60. López, C.; Hernández-García, E.; Piro, O.; Vulpiani, A.; Zambianchi, E. Population dynamics advected by chaotic flows: A discrete-time map approach. Chaos 2001, 11, 397. [Google Scholar] [CrossRef] [Green Version]
  61. Berline, L.; Rammou, A.-M.; Doglioli, A.; Molcard, A.; Petrenko, A. A Connectivity-Based Eco-Regionalization Method of the Mediterranean Sea. PLoS ONE 2014, 9, e111978. [Google Scholar] [CrossRef] [Green Version]
  62. Poulain, P.-M.; Menna, M.; Mauri, E. Surface geostrophic circulation of the Mediterranean Sea derived from drifter and satellite altimeter data. J. Phys. Oceanogr. 2012, 42, 973–990. [Google Scholar] [CrossRef]
  63. Taupier-Letage, I.; Millot, C. Surface circulation in the Algerian basin during 1984. Oceanol. Acta 1984, 9, 79–85. Available online: https://archimer.ifremer.fr/doc/00267/37811/ (accessed on 7 May 2021).
  64. Pinot, J.-M.; López-Jurado, J.L.; Riera, M. The CANALES experiment (1996–98). Interannual, seasonal, and mesoscale variability of the circulation in the Balearic Channels. Prog. Oceanogr. 2002, 55, 335–370. [Google Scholar] [CrossRef]
  65. Pujol, M.-I.; Larnicol, G. Mediterranean Sea eddy kinetic energy variability from11 years of altimetric data. J. Mar. Syst. 2005, 58, 121–142. [Google Scholar] [CrossRef]
  66. Ruiz, S.; Pascual, A.; Garau, B.; Faugère, Y.; Alvarez, A.; Tintoré, J. Mesoscale dynamics of the Balearic Front, integrating glider, ship and satellite data. J. Mar. Syst. 2009, 78, S3–S16. [Google Scholar] [CrossRef]
  67. Trani, M.; Falco, P.; Zambianchi, E.; Sallée, J.B. Aspects of the Antarctic circumpolar current dynamics investigated with drifter data. Progr. Oceanogr. 2014, 125, 1–15. [Google Scholar] [CrossRef] [Green Version]
  68. Abdalla, S.; Kolahchi, A.A.; Ablain, M.; Adusumilli, S.; Bhowmick, S.A.; Alou-Font, E.; Amarouche, L.; Andersen, O.B.; Antich, H.; Aouf, L.; et al. Altimetry for the future: Building on 25 years of progress. Adv. Space Res. 2021, 68, 319–363. [Google Scholar] [CrossRef]
  69. Testor, P.; Send, U.; Gascard, J.; Millot, C.; Taupier-Letage, I.; Béranger, K. The mean circulation of the southwestern Mediterranean Sea: Algerian Gyres. J. Geophys. Res. 2005, 110, C11017. [Google Scholar] [CrossRef] [Green Version]
  70. Olita, A.; Sorgente, R.; Ribotti, A.; Fazioli, L.; Perilli, A. Pelagic primary production in the Algero-Provençal Basin by means of multisensor satellite data: Focus on interannual variability and its drivers. Ocean Dyn. 2011, 61, 1005–1016. [Google Scholar] [CrossRef]
  71. Elhmaidi, D.; Nefzi, H.; Carton, X.; Lili, T. Particle dispersion in the Western Mediterranean basin. Open Oceanogr. J. 2010, 4, 137–143. [Google Scholar] [CrossRef] [Green Version]
  72. Nefzi, H.; Elhmaidi, D.; Carton, X. Turbulent dispersion properties from a model simulation of the western Mediterranean Sea. Ocean Sci. 2014, 10, 167–175. [Google Scholar] [CrossRef] [Green Version]
  73. Aulicino, G.; Cesarano, C.; Zerrouki, M.; Ruiz, S.; Budillon, G.; Cotroneo, Y. On the use of ABACUS high resolution glider observations for the assessment of phytoplankton ocean biomass from CMEMS model products. Ecol. Modell. 2021, 455, 109619. [Google Scholar] [CrossRef]
  74. Rivaro, P.; Ianni, C.; Langone, L.; Ori, C.; Aulicino, G.; Cotroneo, Y.; Saggiomo, M.; Mangoni, O. Physical and biological forcing of mesoscale variability in the carbonate system of the Ross Sea (Antarctica) during summer 2014. J. Mar. Syst. 2017, 166, 144–158. [Google Scholar] [CrossRef]
  75. Rivaro, P.; Ardini, F.; Grotti, M.; Aulicino, G.; Cotroneo, Y.; Fusco, G.; Mangoni, O.; Bolinesi, F.; Saggiomo, M.; Celussi, M. Mesoscale variability related to iron speciation in a coastal Ross Sea area (Antarctica) during summer 2014. Chem. Ecol. 2019, 35, 1–19. [Google Scholar] [CrossRef]
  76. Rivaro, P.; Ianni, C.; Raimondi, L.; Manno, C.; Sandrini, S.; Castagno, P.; Cotroneo, Y.; Falco, P. Analysis of Physical and Biogeochemical Control Mechanisms on Summertime Surface Carbonate System Variability in the Western Ross Sea (Antarctica) Using in Situ and Satellite Data. Remote Sens. 2019, 11, 238. [Google Scholar] [CrossRef] [Green Version]
  77. Misic, C.; Covazzi Harriague, A.; Mangoni, O.; Aulicino, G.; Castagno, P.; Cotroneo, Y. Effects of physical constraints on the liability of POM during summer in the Ross Sea. J. Mar. Syst. 2017, 166, 132–143. [Google Scholar] [CrossRef]
  78. Chang, Y.-L.; Miyazawa, Y.; Béguer-Pon, M. The dynamical impact of mesoscale eddies on migration of Japanese eel larvae. PLoS ONE 2017, 12, e0172501. [Google Scholar] [CrossRef] [Green Version]
  79. Yu, H.J.; Kim, J.K. Upwelling and eddies affect connectivity among local populations of the goldeye ockfish, Sebastes thompsoni (Pisces, Scorpaenoidei). Ecol. Evol. 2018, 8, 4387–4402. [Google Scholar] [CrossRef] [PubMed]
  80. Devine, B.; Fennell, S.; Themelis, D.; Fisher, J.A.D. Influence of anticyclonic, warm-core eddies on mesopelagic fish assemblages in the Northwest Atlantic Ocean. Deep Sea Res. I 2021, 173, 103555. [Google Scholar] [CrossRef]
  81. Cózar, A.; Sanz-Martín, M.; Martí, E.; González-Gordillo, J.I.; Ubeda, B.; Gálvez, J.Á.; Irigoien, X.; Duarte, C.M. Plastic Accumulation in the Mediterranean Sea. PLoS ONE 2015, 10, e0121762. [Google Scholar] [CrossRef] [Green Version]
  82. Suaria, G.; Aliani, S. Floating debris in the Mediterranean Sea. Mar. Pollut. Bull. 2014, 86, 494–504. [Google Scholar] [CrossRef]
  83. Deudero, S.; Alomar, C. Mediterranean marine biodiversity under threat: Reviewing influence of marine litter on species. Mar. Poll. Bull. 2015, 98, 58–68. [Google Scholar] [CrossRef] [PubMed]
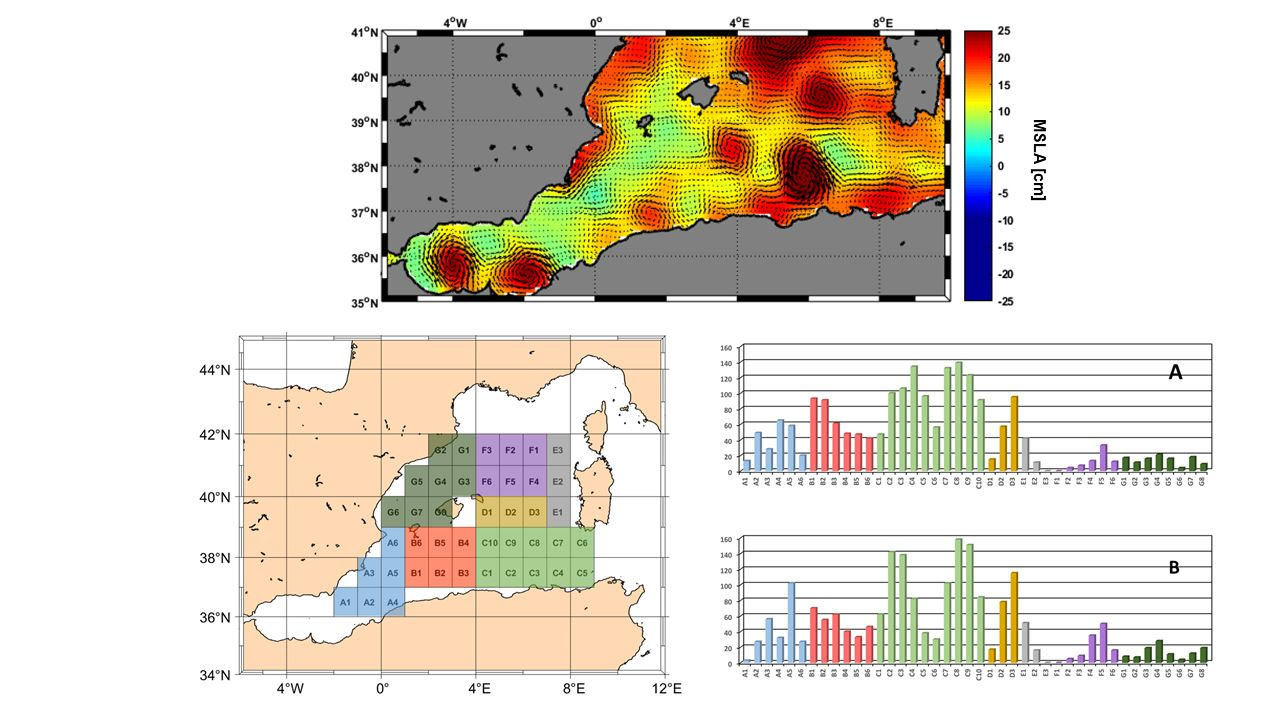
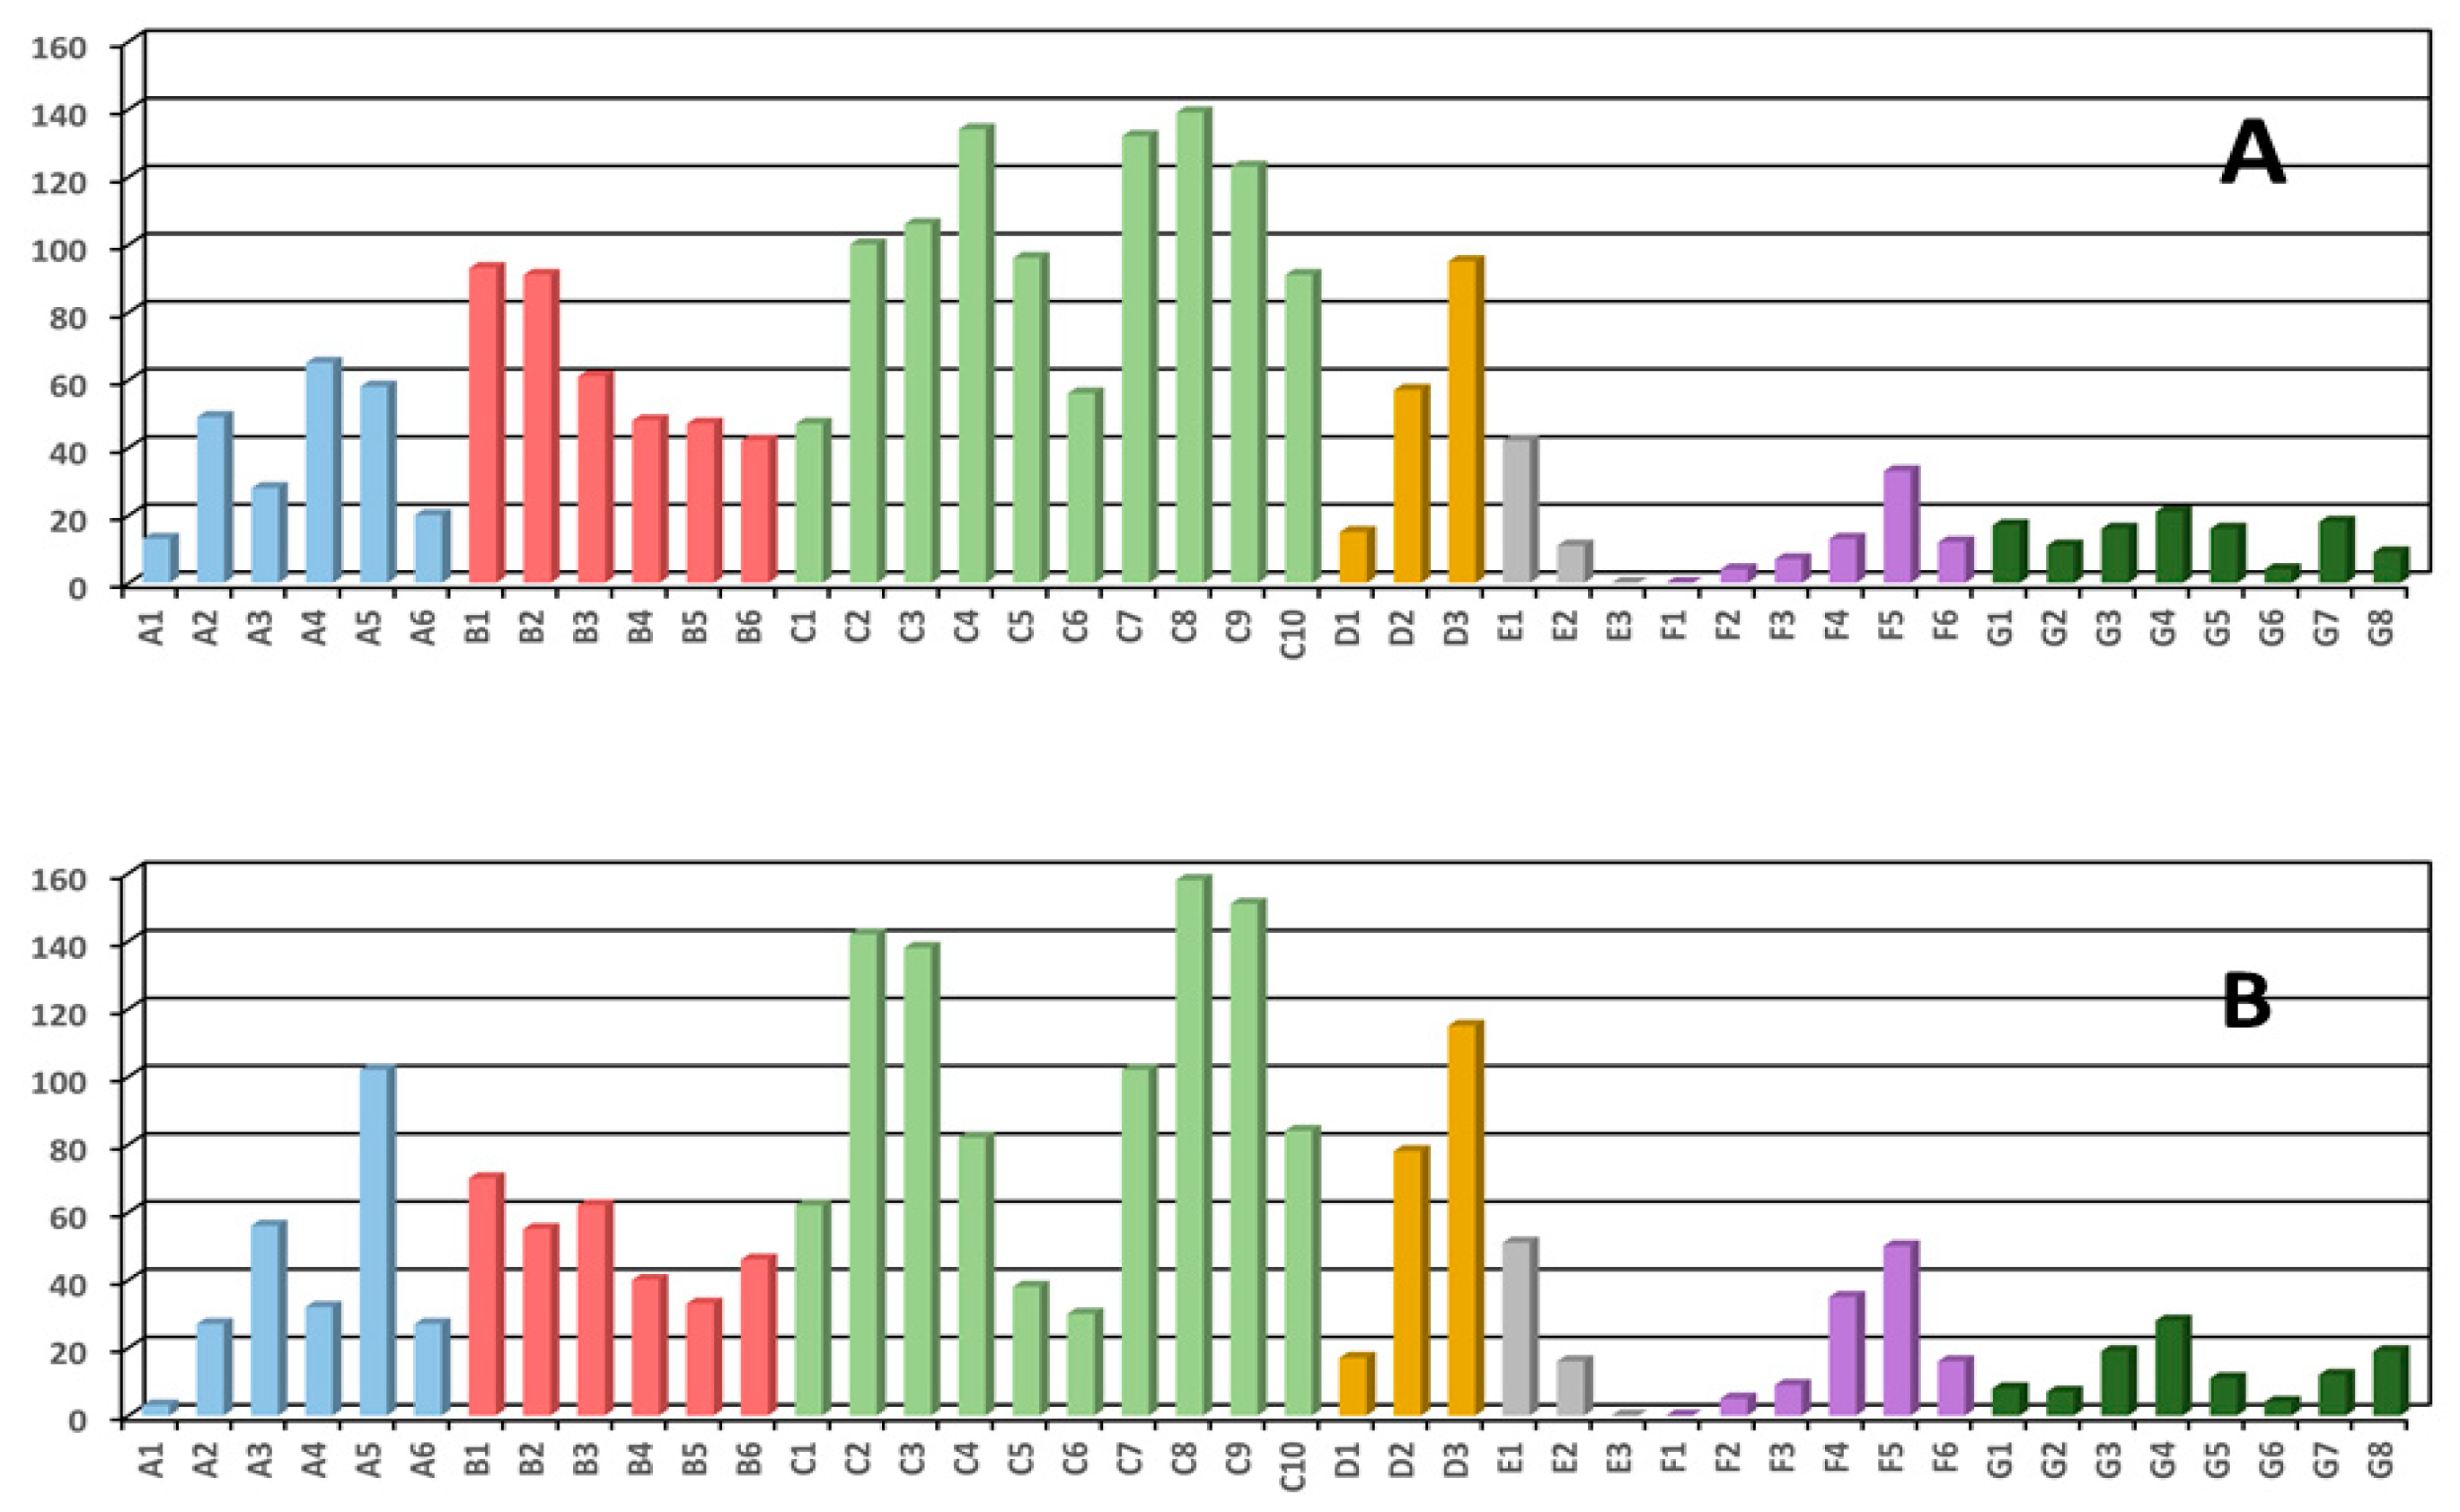
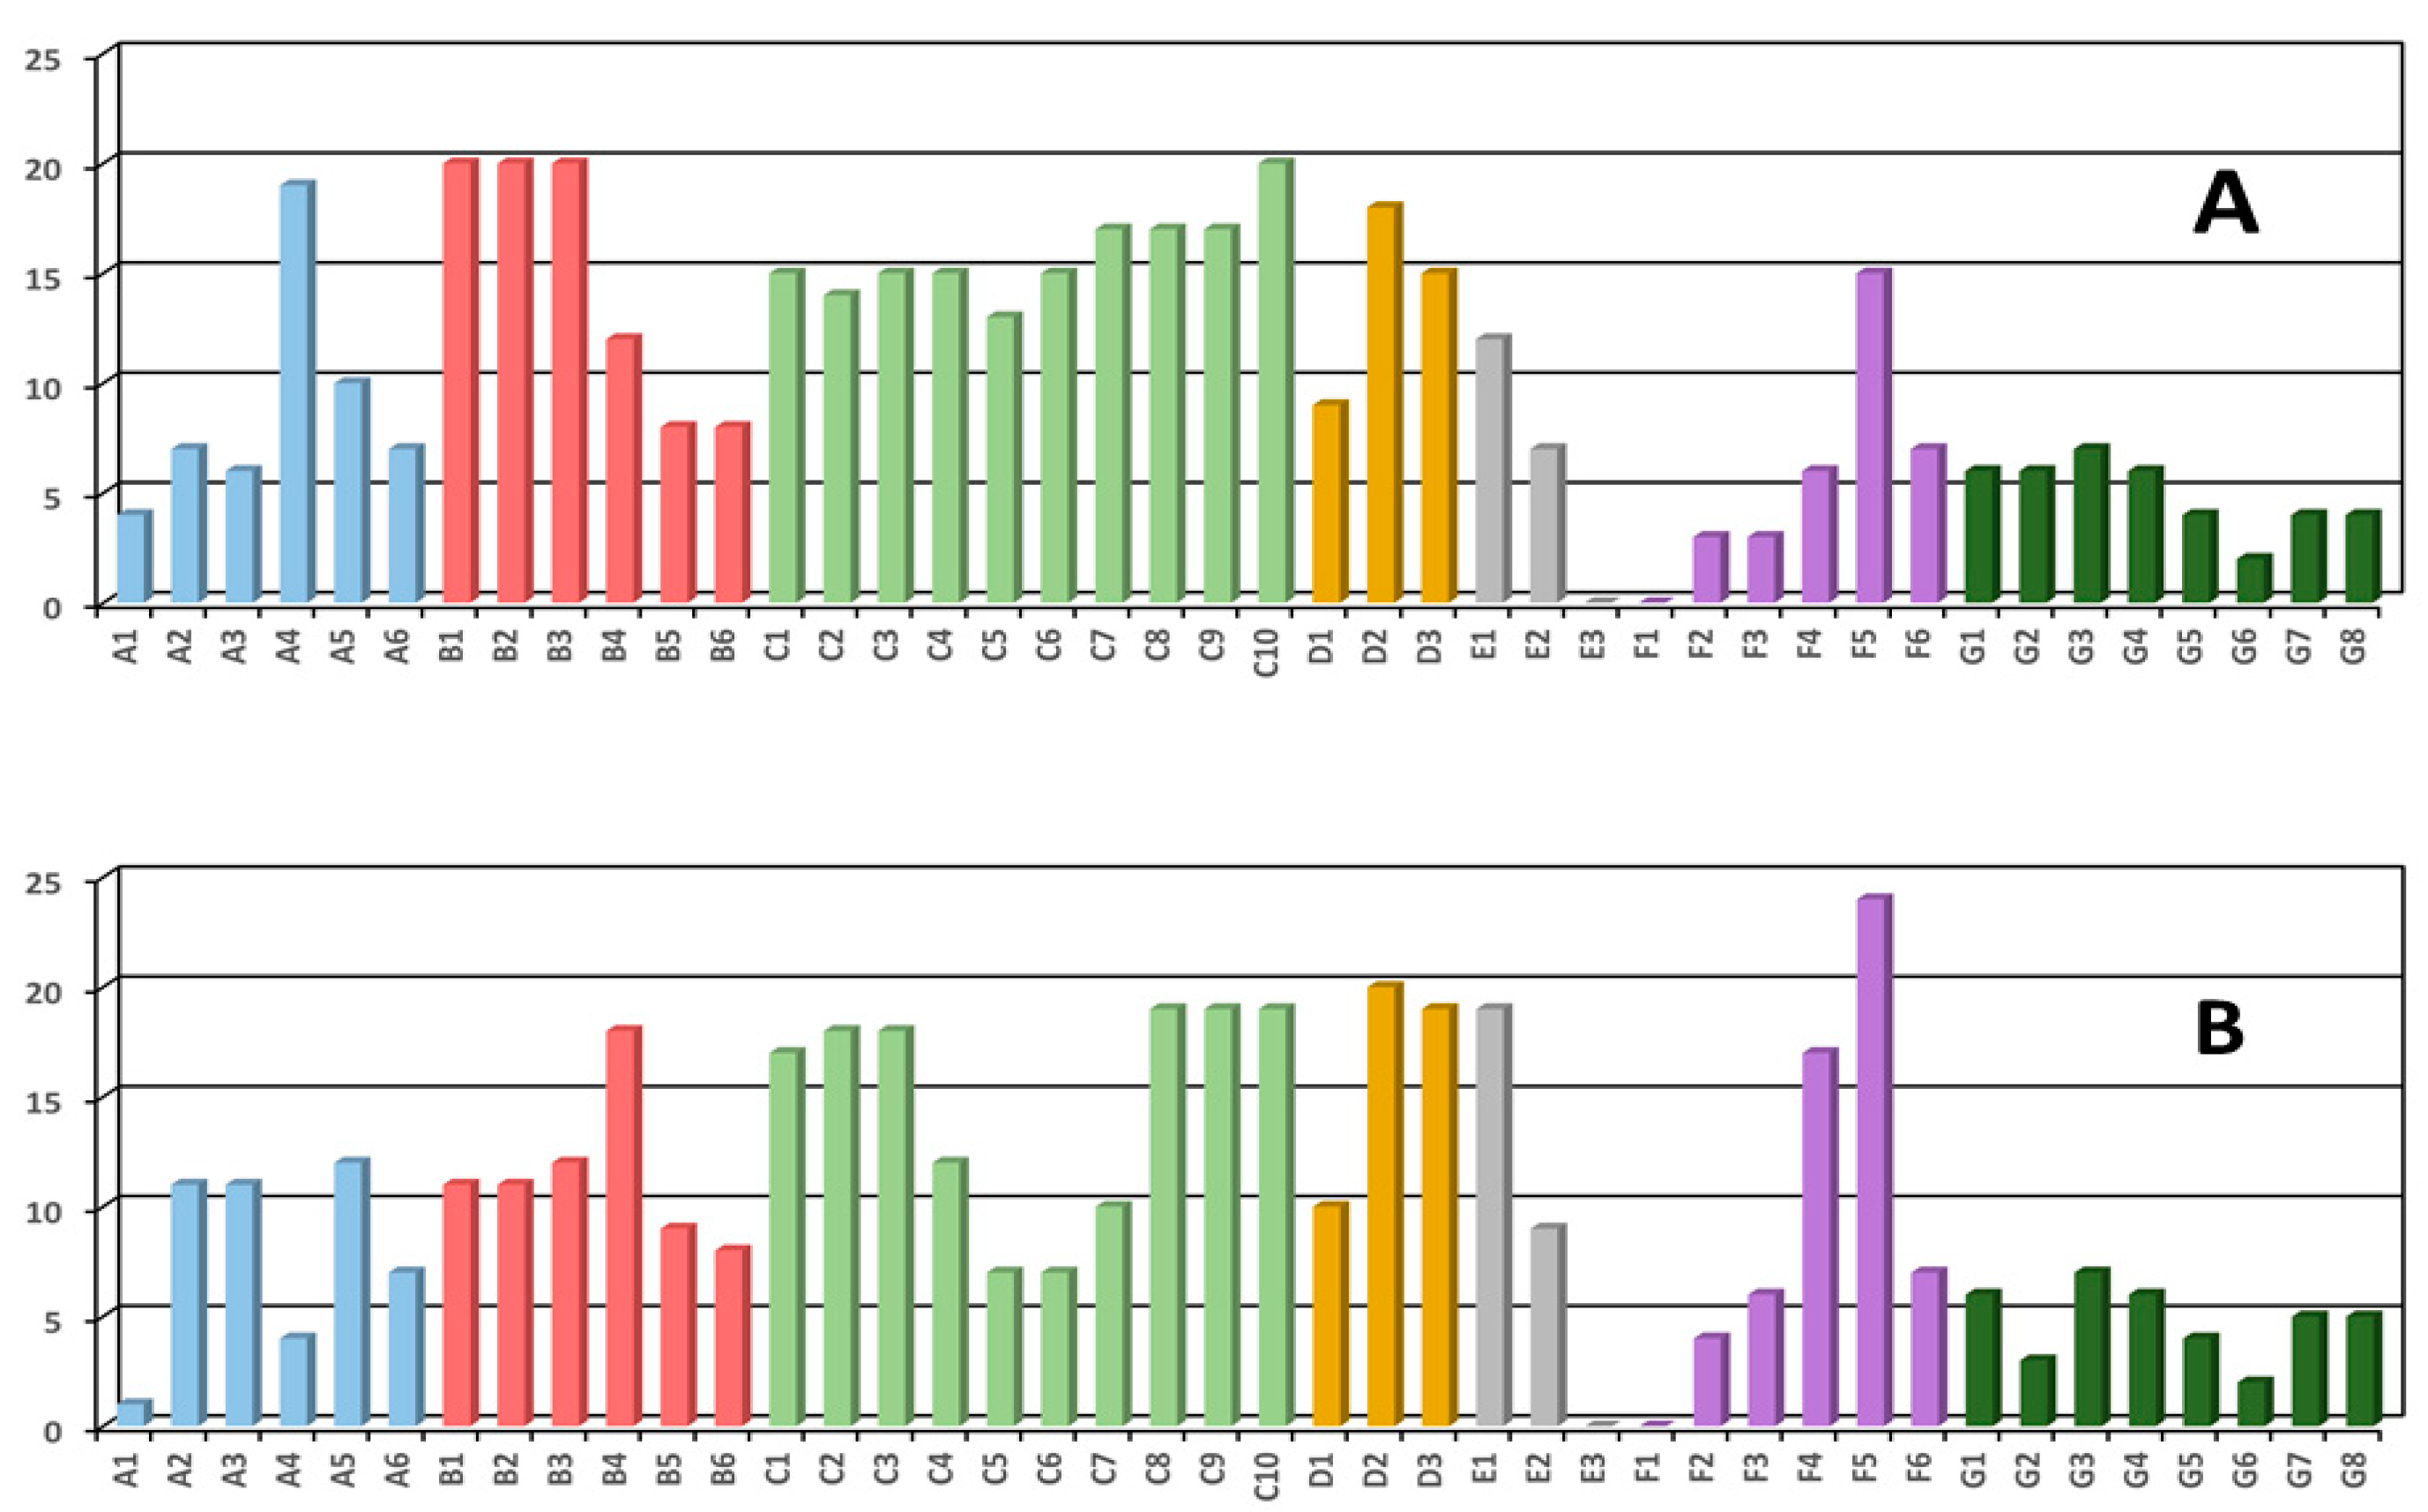
Figure 1. Mean dynamic topography (MDT) of the Western Mediterranean Sea map of the study area (adapted from [7]). Northern Current (NC), Algerian Current (AC), Western Sardinia Current (WSC), Western Mid-Mediterranean Current (WMMC), North Balearic Front (NBF) and mean position of Western Algerian gyre (WAG) and Eastern Algerian gyre (EAG) are labeled. Color scale showing MDT values [m].
Remotesensing 13 04228 g001
Figure 2. Data coverage of the drifters within the area of study for the period 1985–2016.
Remotesensing 13 04228 g002
Figure 3. Mean surface velocities obtained by the pseudo-Eulerian analysis of all the drifter trajectories crossing the area of study from 1985 to 2016. The dimension of the bins is 0.5° × 0.5°.
Remotesensing 13 04228 g003
Figure 4. The division of the Western Mediterranean basin into 7 homogeneous sectors and the regular 1° × 1° box grid used for the connectivity analysis. Color scale highlights the different sectors.
Remotesensing 13 04228 g004
Figure 5. Number of drifters connecting the 42 boxes of the Western Mediterranean basin (WMED). Each box extends over a 1° × 1° cell. Drifter data refer to the 1985–2016 period.
Remotesensing 13 04228 g005
Figure 6. Mean transit time of drifters connecting the 42 boxes of the WMED. Each box extends over a 1° × 1° cell. Drifter data refer to the 1985–2016 period.
Remotesensing 13 04228 g006
Figure 7. Percentage of drifters connecting the 42 boxes of the WMED. Each area extends over a 1° × 1° cell. Drifter data refer to the 1985–2016 period.
Remotesensing 13 04228 g007
Figure 8. Number of anticyclonic eddies connecting the 42 boxes of the WMED. Each box extends over a 1° × 1° cell. Anticyclonic eddy tracks data refer to the 1993–2016 period.
Remotesensing 13 04228 g008
Figure 9. Percentage of anticyclonic eddies connecting the 42 areas of the WMED. Each area extends over a 1° × 1° bin. Anticyclonic eddy tracks data refer to the 1993–2016 period.
Remotesensing 13 04228 g009
Figure 10. Mean transit time of anticyclonic eddies connecting the 42 boxes of the WMED. Each box extends over a 1° × 1° cell. Anticyclonic eddy tracks data refer to the 1993–2016 period.
Remotesensing 13 04228 g010
Figure 11. Number of anticyclonic eddies exported (A) and imported (B) by each 1° × 1° box.
Remotesensing 13 04228 g011
Figure 12. Number of areas (boxes) connected in export (A) or import (B) through anticyclonic eddies across the 1° × 1° cells over the WMED.
Remotesensing 13 04228 g012
Table 1. Number of anticyclonic eddies exported and imported for each 1° × 1° cell of the WMED. The number of bins connected to each cell are also indicated both for the exported and imported eddies. Areas are color coded according to Figure 4.
BOXEXPORTIMPORT
EddiesAREASEddiesAREAS
A113431
A24972711
A32865611
A46519324
A5581010212
A6207277
B193207011
B291205511
B361206212
B448124018
B5478339
B6428468
C147156217
C21001414218
C31061513818
C4134158212
C59613387
C65615307
C71321710210
C81391715819
C91231715119
C1091208419
D11591710
D257187820
D3951511519
E142125119
E2117169
E30000
F10000
F24354
F37396
F41363517
F533155024
F6127167
G117686
G211673
G3167197
G4216286
G5164114
G64242
G7184125
G894195
Publisher’s Note: MDPI stays neutral with regard to jurisdictional claims in published maps and institutional affiliations.

