1. Introduction
Interferometric synthetic aperture radar (InSAR) is the combination of synthetic aperture radar (SAR) and interferometry, which obtains two single look complex (SLC) images of the same area on the ground through two antennas or at different times, which are nearly parallel observations, to obtain ground elevation according to the orbit parameters and interferometric phase information of the sensor during flight [
1]. InSAR, with its all-day, all-weather, high-precision, and wide-range advantages, provides a new tool for acquiring digital elevation models (DEMs) and monitoring surface deformations such as earthquakes [
2,
3], mining areas [
4,
5], landslides [
6,
7], glaciers [
8,
9], and urban infrastructure [
10,
11,
12,
13], etc. However, the interference phase obtained by the interferometric processing of the SAR image is wrapped between
and the entire cycle information is lost. To restore the real phase representing the actual deformation or topography, it is necessary to add or subtract the integer multiple of 2
on the basis of the wrapped phase to restore its real phase, which is called phase unwrapping (PU) [
14]. PU is one of the key technologies of InSAR, and the accuracy of the unwrapped results directly affects the accuracy of the final products. Further work is required to determine how to accurately and efficiently perform PU, being a difficult problem and a hot topic in research.
With the widespread application of InSAR technology, dozens of PU methods have been developed to deal with different patterns in different situations. The classic two-dimensional (2D) PU methods are based on the phase continuity assumption [
15], which can be roughly divided into two types: path-following methods and optimization-based methods.
Path-following methods achieve unwrapping by selecting appropriate integration paths to avoid noise regions; examples include the branch cut method [
16], region growing method [
17], quality-guided method [
18], and minimum discontinuity method [
19], etc. General path-following algorithms have very high accuracy and efficiency for interferograms with good quality. However, it is difficult to find an appropriate unwrapping path in areas seriously affected by noise. Once the unwrapping path passes through the residues, phase jump easily occurs, which causes error transfer or unwrapping islands.
The optimization-based method unwraps phase by solving different objective functions. Among them, the
norm is the classical method [
20]. When
takes a different value, it corresponds to different unwrapping methods. This kind of algorithm transforms the PU problem into an optimization problem based on the condition that the unwrapped phase gradient is equal to the wrapped phase gradient. At present, the least square (LS, when
is equal to two) [
15] method is the most widely used. Various improved LS unwrapping algorithms [
21,
22,
23] markedly improve the accuracy and efficiency of LS PU, and the unwrapped results have good continuity and smoothness, even for interferograms with poor quality. However, due to the LS PU fitting the results, the unwrapped results of any phase point are approximate solutions, which are not accurate enough, and the local noise spreads around in the sense of the least mean square, resulting in the overall unwrapping accuracy being low. When
is equal to two, the
norm method is the minimum-cost flow (mcf) [
24] method, which ensures accuracy and improves efficiency and has the advantages of continuity and limited error transfer. In addition, methods such as snaphu [
25,
26,
27], Kalman filter [
28], ant colony algorithm [
29], simulated annealing algorithm [
30], and deep learning [
31,
32] have also been introduced into PU and achieved various results.
Although the above methods can improve the accuracy of PU, they are still unable to resist noise interference, and the unwrapped results are discontinuous in severe noise areas. Because interferograms inevitably have low-quality areas due to the influence of spatial–temporal decoherence and noise, these low-quality areas not only create large errors in the PU process, but may also spread the error to the high-coherence point areas, affecting the unwrapping accuracy of high-coherence points, thereby affecting the subsequent application of InSAR.
On the basis of existing PU theory, aiming at the problem of large PU error in low-quality areas, this paper proposes a PU method based on hierarchical networking and constrained adjustment (HNCA). According to the quality map, the phase is divided into high-quality first-level points and low-quality second-level points. The appropriate 2D unwrapping method is used for high-quality first-level points, and the error is small, which can ensure the unwrapping accuracy of high-quality points. For low-quality second-level points regions, the unwrapped results of high-quality points are used as control points, and the network adjustment unwrapping method with constraints is used. This constraint can effectively suppress noise and improve the unwrapping accuracy of secondary points. This is the advantage that the classical 2D phase unwrapping does not have; that is, only through the interferogram is the unwrapping accuracy of the low-coherence region considerably improved. In particular, the work in this paper is significant for restoring the low-coherent phase of noise regions such as groundwater centers and mining centers and can provide reliable guidance for the monitoring and management of these regions.
The effectiveness of the proposed method is verified by simulation experiments and real mining data. The experimental results show that the proposed algorithm not only avoids the propagation of noise errors, but also improves the unwrapping accuracy of low-quality points and has strong robustness.
The rest of this paper is structured as follows:
Section 2 introduces the traditional PU method and the improved HNCA PU method.
Section 3 shows the experimental results and accuracy evaluation results of the simulated data. The experimental results and accuracy evaluation results of real data are described in
Section 4. The final discussion and conclusions are provided in
Section 5 and
Section 6, respectively.
2. Phase Unwrapping Principle and Methods
The unwrapped
phase and the wrapped phase
have the following relationship:
where
is an integer, which indicates ambiguity.
The purpose of PU is to obtain an accurate phase ambiguity on the basis of the interference phase , so that the absolute phase can be obtained by integrating the wrapped phase according to a certain path.
Assuming the current unwrapped phase is
, where
and
, the discrete partial derivatives
and
in the row and column directions are expressed as follows:
Ideally, there is no noise interference in the interferogram, and the phase discrete derivative is an irrotational vector field, which can be integrated and unwrapped directly along a certain path. However, due to the influence of noise, some points do not meet the irrotationality; these points are called residues. Because the existence of residues makes it impossible to directly integrate discrete derivatives, different algorithms are needed for processing.
In theory, as shown in Equation (3), the phase gradient before and after unwrapping should be equal everywhere:
However, in practice, there are differences between the two due to noise and other reasons. The LS method is used to minimize this difference for PU. The LS method attributes the PU to the objective function shown in Equation (5), which represents the square sum of the difference between the discrete partial derivative of the unwrapped phase and the discrete partial derivative of the wrapped phase. The optimal solution of this function under the least square constraint is the LS unwrapping result.
where
and
represent the weights in the
x and
y directions, respectively;
is the optimal solution in the global.
The function is finally transformed into solving the Poisson equation with Neumann boundary conditions. The LS method based on DCT transform and the LS method based on FFT transform are efficient methods to solve the Poisson equation. Then, a weighted form of the DCT-based PU algorithm was developed (called WDCT-LS), so its accuracy is higher than other LS unwrapping methods. Because these methods are very mature, we will not elaborate further on them; interested readers can refer to [
15,
21,
22].
The LS method is a stable global algorithm, and there is no regional unwrapped problem when unwrapping. However, due to the idea of global fitting, the unwrapped results obtained by LS are smoother. When the phase quality of some regions is poor, the influence of noise points on local errors cannot be eliminated, and the error of local regions is globally averaged, thus reducing the reliability of the unwrapped results.
The minimum cost flow (mcf), also the optimization method, is different from the LS method, because the mcf method not only provides the objective function, but also an efficient calculation method and adds constraints to it. Its objective function is expressed as [
24]:
Note that Equation (6) is a nonlinear equation and it is difficult to solve. Therefore, Constantini [
24] composed Equations (6) and (7) into a minimum norm problem with constraints and introduced the solution method of network flow, which not only markedly accelerated the speed of solution, but also well constrained the transmission of error, and the unwrapped results were more reliable.
Since Constantini, many scholars have proposed improved network flow algorithms, such as Carballo’s multi-resolution network flow PU algorithm based on statistics [
33], Chen’s statistical cost network flow PU algorithm [
25,
26,
27], and so on. These methods improve the accuracy or efficiency of PU under certain conditions.
3. Phase Unwrapping Based on Hierarchical Networking and Constrained Adjustment
Some of the phase points in the interferogram have high quality and some have low quality. If the whole unwrapping is performed, not only is the unwrapping accuracy of low-quality points low, but the error will also spread continuously, which affects the unwrapping accuracy of high-quality points. In the traditional PU algorithm, all phase points participate in unwrapping at one time; even if the weights are set in different methods, there will be noise pollution. Therefore, considering the similarity between the leveling network solution and the PU, given the large unwrapping error of the traditional PU algorithm in noise-intensive areas and the problem that the unwrapping error is transmitted to high-quality points, a network adjustment unwrapping method based on hierarchical networking is proposed. According to the quality map, the phase is divided into high-quality first-level points and low-quality second-level points. The appropriate 2D unwrapping method is used for high-quality first-level points, and the error is small, which can ensure the unwrapping accuracy of high-quality points. For low-quality second-level points regions, the unwrapped results of high-quality points are used as control points, and the network adjustment unwrapping method with constraints is used.
The proposed method not only ensures the unwrapping precision of high-quality points, but also improves the unwrapping precision of low-quality points.
3.1. Hierarchical Networking
According to the residues’ distribution and quality map of the interferogram, phase points are divided into different levels. Firstly, the residues in the interferogram are detected. The existence of residues is the most direct source of unwrapping error, so the residues are marked. Then, the quality control threshold
is set according to the quality map of coherence, phase standard deviation [
34], or pseudo-coherence coefficient [
15]. According to the quality control threshold
, the phase points are divided into high- and low-quality parts, and the recommended reference value of
is 0.3–0.8 [
35]. It is worth mentioning that only one reference range can be given here, because the quality of the interferogram is good or bad, and the research range of the researcher is also large or small, so the threshold can only be flexibly set according to the actual situation to improve the accuracy as much as possible or to meet actual application requirements. At the same time, in order to avoid the unwrapping error caused by the excessive length of the arc, a certain arc threshold should be set to delete the distant isolated points and islands.
We call the obtained high- and low-quality phase points the first-level points and the second-level points, respectively. The final mask situation is defined by the following equation:
In general, after residues detection, the quality map test, and the phase points selection, the first-level points with relatively uniform and reliable distribution and the second-level points with low-quality are obtained.
3.2. First-Level Points Unwrapping
According to the distribution of the first-level points, the Delaunay triangulation network [
36] is constructed, as shown in
Figure 1. According to the data and research area, the existing classic methods such as LS, mcf, and snaphu, etc., are used to unwrap the first-level network.
3.3. Unwrapping Second-Level Points
During the PU of the second-level points, the first unwrapping points are used as known control points to constrain the PU of the second-level points, so as to improve the unwrapping accuracy of the second-level points. In the second PU, all the phase points involved in the PU construct an irregular triangular network. There are two methods to construct the network according to the image quality.
As shown in
Figure 2, when the first- and second-level points are evenly distributed in the image and cross each other, taking second-level point 1 as an example, for the second-level point to connect with the highest quality around and meet the distance threshold limit of three first-level points, these three first-level points can effectively control the unwrapping error of the second-level points during PU. When the phase quality distribution is uneven, such as the second-level points in the dashed frame, these second-level points are first composed of Delaunay triangulation separately and, then, connect the nearest first-level points that meet the distance threshold limit, such as points 5 and 6.
After the completion of the second-level points construction, the solution process still follows the phase continuity assumption; that is, it is assumed that there is no crossing fringe between the arcs.
In
Figure 2, point 2 is the first-level point that has been unwrapped, and point 1 is the second-level point that has not been unwrapped. The phase relationship between them is:
where
is the second-level point to be solved,
is the first-level control point, and
represents the phase wrapping operation.
Points 3 and 4 in
Figure 2 are both second-level points, and the phase relationship between them is:
According to the above relationship, the following model can be established:
that is:
Equation (12) represents the observation equation and the condition equation on the top and bottom, respectively; the observation equation is the network between the second-level points; the conditional equation expresses the constraint of the first-level points on the second-level points, so as to reduce the noise impact of the second-level points and improve unwrapping accuracy.
In order to further improve the unwrapping accuracy, considering the weighted solution, the weights between arc segments are defined as follows:
where
and
are the coherence values of the starting and ending points of the arc segment, respectively.
According to the least squares criterion, the solution is
where
Through the above steps, the sparse point unwrapping results of low-quality points can be obtained. Finally, the final PU results are obtained by combining the unwrapped results of the first- and second-level points.
The new method in this paper has abundant redundant observations and reliable solution results. The joint construction of high-quality points and low-quality points effectively inhibits the influence of noise and improves the unwrapping accuracy of low-quality points. At the same time, the unwrapping error of noise points is not transmitted to the surrounding.
3.4. Data Processing Flow of the Proposed Method
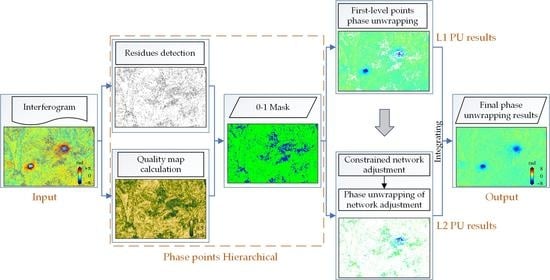
Figure 3 shows the whole process of the new method, which contains the following seven steps.
Step1: obtain the interferogram;
Step2: residues detection and quality map generation;
Step3: determining the grading threshold to obtain high-quality first-level points and low-quality second-level points;
Step4: unwrapping first-level points;
Step5: second-level points’ network construction;
Step6: unwrapping first-level points based on constrained adjustment;
Step7: integrating the unwrapping results of the first- and second-level points to obtain a complete phase unwrapping result.
4. Experiments and Results
4.1. Simulation Experiment
In order to verify the PU ability and anti-noise performance of the proposed algorithm, the Peaks function was used to construct the simulated phase data, the noise calculated by the real coherence [
37,
38] was added to the simulated phase, and then, the simulated interferogram was obtained after the rewrapping operation. Notably, the simulated interferogram was slightly filtered [
34] to improve the quality of the interferogram and obtain more high coherence points. According to the residues’ distribution, pseudo-coherence coefficient, phase standard deviation, and other quality maps, the first- and second-level phase points were generated.
Figure 4 shows the simulated phase and the phase grading results of the high- and low-quality points. Next, the improved method HNCA was applied to the three most commonly used methods for 2D PU: WDCT-LS (the WDCT method is currently the most accurate and fastest in least squares unwrapping, so this method was chosen, which is hereafter referred to as WLS), mcf, and snaphu methods. These traditional methods were used to unwrap the high-quality first-level points, whereas the method proposed in this paper was used to unwrap the low-quality second-level points.
4.1.1. Simulation Experiment Results
Figure 5 depicts a comparison of the results of different unwrapping methods.
Figure 5(a1,b1,c1) is the unwrapped results of the WLS, mcf, and snaphu methods, respectively. These three methods do not use hierarchical networking, so obvious unwrapping errors can be observed; especially in the black ellipse, the unwrapping error is very large.
Figure 5(a2,b2,c2) displays the unwrapping results of the proposed HNCA method. The unwrapping errors in
Figure 5(a2,b2,c2) are not obvious and are significantly improved compared with the traditional methods. The error propagation in the black ellipse is significantly smaller than for the traditional methods.
4.1.2. Results Analysis and Accuracy Assessment
In this study, the error of each method and the root mean square error (RMSE) of error were calculated to evaluate the accuracy. The RMSE was calculated by the following formula:
where
represents the PU result,
represents the simulated phase result, and
represents the number of pixels involved in the statistics.
Figure 6 displays the error comparison diagram of different unwrapping methods. Comparing
Figure 6(a1–a6), it can be seen that, for the WLS method, the accuracy improvement in hierarchical unwrapping is obvious. The black elliptical frame indicates a region seriously polluted by noise. The traditional WLS method not only has a large error in the inner noise region of the ellipse, but also has an obvious error propagation phenomenon on its external edge, that is, not only the error of low-quality points is large, but it is also transmitted to the high-quality point region, reducing the unwrapping accuracy of high-quality points. After unwrapping by the new method proposed in this paper, not only is the error inside the ellipse significantly reduced, but also the periphery of the ellipse is not affected by the error. However, unfortunately, as shown in
Figure 6(a6), there are still some points with large errors because the least squares method is a global algorithm, and even, the first-level points have error transmission, so the accuracy improvement is limited.
Comparing
Figure 6(b1–b6), it can be seen that for the mcf method, the accuracy improvement in the second-level points is also obvious, but the first-level points show almost no improvement. This is because mcf is an unwrapping method with restricted conditions, and it was able to limit the error transmission, so the unwrapping of the first-order points were not improved. However, it cannot suppress noise, so after using the new method, as shown in
Figure 6(b6), the noise inside the ellipse significantly reduced.
Comparing
Figure 6(c1–c6), it can be seen that for the snaphu method, the minimum spanning tree method can also effectively control the error propagation, but also cannot suppress the noise. Therefore, the unwrapped results are similar to those in
Figure 6(b1–b6).
Table 1 shows the RMSE of the different unwrapping methods. For the WLS method, the accuracy of the first-level points increased by 10.34%, indicating that hierarchical network limits error propagation. The accuracy of the second-level points increased by 16.67%, which shows that the method of network adjustment improves the unwrapping accuracy of heavy noise area. For the mcf and snaphu methods, the accuracy of the first-level points was not improved. This is consistent with the previous analysis. It has the ability to limit the propagation of unwrapping errors, which also shows that the mcf and snaphu methods are better than the WSL method. However, the accuracy of the second-level points still increased by 18.44% and 18.00%, respectively, indicating that regardless of the quality of the global PU method, the proposed HNCA method can improve the unwrapping accuracy in heavy noise regions on the basis of the original method.
The above simulation experiments show that the method proposed in this paper can improve the accuracy of PU compared to traditional methods, especially in areas with low coherence and serious noise pollution, and can better resist noise interference and restore the unwrapped results.
4.2. Real Data Experiment and Analysis in Mining Area
4.2.1. Real Experimental Results
The coal mining in Datong, Shanxi Province, China, has caused many problems for many years such as surface subsidence, ecological damage, and air pollution, which have threatened people’s lives and property safety and restricted social and economic development. However, recovering the phase of the central area of the mining area is due to vegetation coverage and serious spatial–temporal decoherence, and direct PU contains large errors. Therefore, the proposed method was applied to this region to restore the phase of the seriously decoherent region.
Two ALOS2 SAR images and the 30 m resolution DEM from SRTM in this area were selected. After baseline estimation, interference, removing the flat-earth phase and the topographic phase, and interferogram filtering, the wrapped interferogram was obtained, and the partially wrapped interferogram was intercepted as the actual verification data.
Table 2 shows basic information of the PALSAR2 data used.
The interferogram, coherence, and phase hierarchical results are shown in
Figure 7, where the local fringes of the interferogram are obvious, the local noise is serious, and the coherence areas are quite different.
Figure 8 shows the unwrapped results of different methods. From a visual point of view, the new HNCA method is more effective than the traditional methods.
Figure 8(a1) shows that the error propagation of the WLS method is very serious, especially in the area indicated by the black ellipse, and the unwrapped results of the deformed region are completely unreliable. The unwrapped results of the mcf and snaphu methods are similar.
Figure 8(b1,c1) show the traditional mcf and snaphu methods. Similar to the simulation experiment, their unwrapped results are similar. Although they can also restore the approximate phase, the unwrapping jump is large in areas with severe noise, and the coherence corresponding to these areas is low, so we think that the unwrapped results in these areas are unreliable.
Figure 8(b2,c2) shows that after using the HNCA method for low-quality points, the unwrapped results are not only more continuous and smoother overall, but the noise in the low-quality regions is also significantly suppressed.
4.2.2. Accuracy Assessment
Due to lack of real data, it was difficult to evaluate the accuracy of the methods, but some quantitative methods can be used to reflect and infer the unwrapping accuracy.
The residues represent the discontinuity of the phase.
Figure 9 compares the distribution of the residues by rewrapping the unwrapping phase. Regardless of the unwrapping method, the number of residues of the new method is much smaller than that of the traditional method, which shows that the new method is effective. Notably, the reason why WLS has the fewest residues is that least squares unwrapping is a global smoothing algorithm. Although there are fewer residues, the accuracy is also low. The mcf and snaphu methods have more reliable control points, so the results are more reliable.
Figure 10 shows the phase standard deviations of the different unwrapping methods. It can be seen that the PSD of the traditional method is relatively scattered, and there are many unusually large values, which correspond to the low-quality region. The PSD of the new method is much smaller than that of the traditional method and is basically symmetrically distributed on both sides of the mean, which also illustrates the reliability of the new method.
The above analysis shows that the proposed new method is superior to the traditional PU method, which not only avoids the propagation of noise errors, but also improves the unwrapping accuracy in areas with severe noise pollution, and has strong robustness. By applying the new method to LS, mcf, and snaphu, which are the three most widely used two-dimensional phase unwrapping methods, it can be seen that the new method has higher accuracy in areas with serious noise and low coherence.
5. Discussion
When the overall quality of interferogram is very high, the proposed method will still be effective, but the accuracy improvement will not be as obvious. However, more complex situations should be considered; that is, when data quality is poor and many conventional methods fail.
According to the above experiments, the threshold of hierarchical networking, noise level, and arc length threshold of the second-level network affect the final phase unwrapping results. Notably, the arc length is very flexible, which is closely related to the quality and resolution of the interferogram and the size of the deformation region. Since only one empirical reference value is provided in this paper, we think that the surface deformation is related within the range of less than 500 m, so the arc length is recommended not to exceed 500 m.
In fact, the filtering intensity of interferogram will also affect the accuracy of the HNCA method, but the filtering actually changes the quality of the interferogram. Therefore, we regard the influence of filtering as the change in the quality of the interferogram and select intensity as low as possible when filtering to ensure the reliability of high-quality points.
Next, we discuss the influence of threshold and noise level of hierarchical networking on the proposed method. In the simulation experiment and real-data experiment, we found that the mcf method has the highest accuracy when used to unwrap the first-level phase point, so only the mcf method is used as an example here. In order to further evaluate the accuracy, we used the simulation data for experiments.
5.1. Influence of Different Hierarchical Networking Thresholds on Unwrapping Results
For a certain interferogram, different hierarchical networking thresholds will affect the accuracy of the final result. Therefore, at the same noise level, the coherence was taken as the quality map on the basis of the masked residues to explore the optimal threshold or threshold range. In order to more clearly show the applicability of the new method, as shown in
Figure 11, we increased the noise level compared with
Section 4.1.
Next, the coherence was taken as the step size of 0.05, increasing from 0.10 to 0.80, to test the new algorithm.
Figure 12 shows the unwrapping errors under different thresholds.
Figure 12(1) shows the mcf method without hierarchical networking, and
Figure 12(2–16) shows the unwrapping errors of the HNCA method under different thresholds.
Figure 13 provides the points hierarchical results under selected partial thresholds, which, respectively, correspond to
Figure 12(3,7,11,15) in
Figure 12.
Figure 12 shows that when the threshold is between 0.10 and 0.45, although the error of the new method is lower compared with the traditional method, the effect is not obvious. Combining
Figure 13a,b shows that this is because a too-small threshold mixes a large number of noise points with high-quality points; that is, the first-level points used to constrain the second-order point contains large errors, so the accuracy improvement is not obvious. When the threshold is between 0.50 and 0.65, the unwrapping effect of this method is ideal, especially when T = 0.55. This is because the high-quality point noise is low and the distribution is relatively uniform (from
Figure 13c), so it can provide a better constraint. When the threshold exceeds 0.70, very large errors appear in some regions because the larger threshold makes the low-quality points appear as very large holes (from
Figure 13d); these holes exceed the range of deformation space correlation. In this case, the constraint of high-quality points increases the error and leads to incorrect unwrapping results.
In order to demonstrate the change in unwrapping accuracy in more detail,
Figure 14 shows the change in RMSE for the different levels of points.
Figure 14a show that under the same threshold, the accuracy of the first-level points of the new method is basically unchanged compared with the traditional method, due to the constraint effect of the mcf method. However, the RMSE of the first-level points decreases because, when the threshold increases, there are increasingly fewer noise points contained in the first-level points, so the accuracy is higher.
With the increase in the threshold, the new method provides considerable improvements in the low-quality point area compared with the traditional method (
Figure 14b). Combined with the blue line in
Figure 14d, it can be seen that the accuracy of the second-level points can be improved by up to 40%, and the proposed method’s results are always better than those the traditional method.
When the threshold is above 0.7, the accuracy is lower (shown in
Figure 14c and the blue line in
Figure 14d). This is consistent with the problems reflected in
Figure 12(15,16), and the answer can be found in
Figure 13d. A high threshold makes the low-quality point appear as a larger hole; too far away from the high-quality point, the phase continuity assumption cannot be met, so it plays an incorrect control role, so the error will be large.
Based on the above analysis, different thresholds have a considerable impact on the unwrapping results, but the selection of grading thresholds is flexible. Therefore, we provide the following suggestions: under the premise of as uniform distribution of high-quality points as possible, the higher the threshold of the hierarchical network, the better.
5.2. Influence of Different Noise Levels on Unwrapping Results
This section discusses the sensitivity of the new method to interferogram quality. By adding different levels of noise, we selected the appropriate threshold for the experiment.
Figure 15 shows the coherence results under four different noise levels. The coherence in
Figure 15 is increasingly worse.
Figure 16 provides a comparison of unwrapped errors under four different noise levels. It can be seen that the method in this paper is better than the traditional method under any noise level. However, with the increase in noise level, the error increases gradually. This is because when the noise is large enough, the first-level points are also affected by the noise. Therefore, the accuracy of the second-level points caused by the phase constraint of the first-level points is naturally not high. Notably, this is not because the unwrapping method is poor, but because the data quality is too poor; the interferogram is basically completely decoherent, so it is difficult to restore the real unwrapping phase.
Table 3 lists the RMSE and its accuracy improvement under four different noise levels. As the noise continually increases, the RMSE of the first-level point unwrapping error also continues to increase from 0.49 to 0.86. This is because reducing the threshold of hierarchical networking can have more first-level points around the second-level point, but the accuracy is also reduced. The unwrapping error of the second-level points increases as the noise increases, as does the RMSE, from 0.87 to 0.95, which shows that as noise increases, the unwrapping accuracy decreases. However, the accuracy improvement gradually increased from 32.83% to 46.29% because, the greater the noise, the more significant the constraint effect of the first-level points, so the accuracy improvement range is also more obvious.
In order to more clearly show the unwrapping effect of the proposed method for low-quality regions,
Figure 17 depicts the distribution of the unwrapping error of the low-quality points under different noise levels. With the increase in noise level, low-quality points also increase, but the error of the new method is far less than that of the traditional method at any noise level. Notably, with the increase in noise level, the error distribution widens, which indicates that the variance in the error increases, which is consistent with the analysis in
Table 2. The improvement in the overall unwrapping accuracy is basically from the second-level points, so the reason for this finding is the same as that for the second-level points.
Overall, the accuracy of the proposed method is higher than that of the traditional method; especially in low-coherent regions with heavy noise pollution, the accuracy can be improved by more than 16–46%.
Although there are errors in the result, the method is more reliable than the traditional method. The improvement in accuracy is of great significance for the deformation recovery of the center of mining areas and funnel centers of groundwater subsidence and can provide the basis of later parameter inversion and disaster warning.
6. Conclusions
PU is one of the key steps of InSAR technology, but serious local noise restricts its application and development. Therefore, on the basis of the traditional two-dimensional PU, we adopted the network adjustment phase unwrapping method based on hierarchical networking to improve the unwrapping accuracy for low-quality regions with heavy noise pollution. Through the hierarchical network, the classic 2D PU method was used for the high-quality first-level points to limit the error transmission of the low-quality points. The network adjustment method was introduced to the low-quality second-level points to limit the influence of noise by taking the surrounding first-level points as the control. This method considerably improves the unwrapping accuracy in areas with heavy noise and low coherence through the interferogram, which is an advantage over the traditional method. According to the verification of the simulation experiments and real experiments, our method generally exhibits much higher accuracy and better anti-noise performance. However, it is unsuitable for large deformation regions, because it struggles to obtain enough stable high-quality points. To address at this shortcoming, we plan to use corner reflectors or GNSS points to assist in unwrapping. Moreover, the integration of this method with a time-series inversion algorithm may further improve the accuracy of long-term deformation monitoring.
Author Contributions
Conceptualization, W.M., S.W. and B.X.; data curation, W.M., Y.Z.; formal analysis, W.M. and S.W.; funding acquisition, B.X. and Z.L.; investigation, W.M., S.W. and B.X.; methodology, W.M. and S.W.; supervision, B.X. and Z.L.; writing—original draft, W.M. and S.W.; writing—review and editing, all authors. All authors have read and agreed to the published version of the manuscript.
Funding
This work was partly supported by the National Science Fund for Distinguished Young Scholars (No. 41925016), the National Key Research and Development Program of China (No. 2018YFC1503603), the National Natural Science Foundation of China (No. 41804008), and the Innovation Foundation for Postgraduate of Central South University under grant 2021zzts0264.
Institutional Review Board Statement
Not applicable.
Informed Consent Statement
Not applicable.
Data Availability Statement
The ALOS2 SAR data were provided by JAXA under the second Research Announcement on the Earth Observations (EO-RA2) for its Earth Observation Satellite Projects (Project No. ER2A2N167).
Acknowledgments
Several figures were plotted using General Mapping Tools (GMT v6.0).
Conflicts of Interest
The authors declare no conflict of interest.
References
- Bamler, R.; Hartl, P. Synthetic aperture radar interferometry. Proc. IEEE 1998, 14, R1–R54. [Google Scholar] [CrossRef]
- Simons, M.; Fialko, Y.; Rivera, L. Coseismic Deformation from the 1999 Mw 7.1 Hector Mine, California, Earthquake as Inferred from InSAR and GPS Observations. Bull. Seismol. Soc. Am. 2002, 92, 1390–1402. [Google Scholar] [CrossRef]
- Jónsson, S.N.; Zebker, H.; Segall, P.; Amelung, F. Fault Slip Distribution of the 1999 Mw 7.1 Hector Mine, California, Earthquake, Estimated from Satellite Radar and GPS Measurements. Bull. Seismol. Soc. Am. 2002, 92, 1377–1389. [Google Scholar] [CrossRef]
- Ng, A.H.-M.; Chang, H.-C.; Ge, L.; Rizos, C.; Omura, M. Assessment of radar interferometry performance for ground subsidence monitoring due to underground mining. Earth Planets Space 2009, 61, 733–745. [Google Scholar] [CrossRef] [Green Version]
- Li, Z.W.; Yang, Z.F.; Zhu, J.J.; Hu, J.; Wang, Y.J.; Li, P.X.; Chen, G.L. Retrieving three-dimensional displacement fields of mining areas from a single InSAR pair. J. Geod. 2015, 89, 17–32. [Google Scholar] [CrossRef]
- Bayer, B.; Schmidt, D.; Simoni, A. The influence of external digital elevation models on PS-InSAR and SBAS results: Implications for the analysis of deformation signals caused by slow moving landslides in the northern apennines (Italy). IEEE Trans. Geosci. Remote Sens. 2017, 55, 2618–2631. [Google Scholar] [CrossRef]
- Singh, L.P.; Van Westen, C.; Ray, P.C.; Pasquali, P. Accuracy assessment of InSAR derived input maps for landslide susceptibility analysis: A case study from the Swiss Alps. Landslides 2005, 2, 221–228. [Google Scholar] [CrossRef]
- Gourmelen, N.; Kim, S.W.; Shepherd, A.; Park, J.W.; Sundal, A.V.; Björnsson, H.; Pálsson, F. Ice velocity determined using conventional and multiple-aperture InSAR. Earth Planet. Sci. Lett. 2011, 307, 156–160. [Google Scholar] [CrossRef] [Green Version]
- Fatland, D.R.; Lingle, C.S. InSAR observations of the 1993–95 Bering Glacier (Alaska, USA) surge and a surge hypothesis. J. Glaciol. 2002, 48, 439–451. [Google Scholar] [CrossRef] [Green Version]
- Xiong, S.; Wang, C.; Qin, X.; Zhang, B.; Li, Q. Time-Series Analysis on Persistent Scatter-Interferometric Synthetic Aperture Radar (PS-InSAR) Derived Displacements of the Hong Kong–Zhuhai–Macao Bridge (HZMB) from Sentinel-1A Observations. Remote Sens. 2021, 13, 546. [Google Scholar] [CrossRef]
- Giardina, G.; Milillo, P.; DeJong, M.J.; Perissin, D.; Milillo, G. Evaluation of InSAR monitoring data for post-tunnelling settlement damage assessment. Struct. Control Health Monit. 2019, 26, e2285. [Google Scholar] [CrossRef] [Green Version]
- Jung, J.; Kim, D.-j.; Palanisamy Vadivel, S.K.; Yun, S.-H. Long-Term Deflection Monitoring for Bridges Using X and C-Band Time-Series SAR Interferometry. Remote Sens. 2019, 11, 1258. [Google Scholar] [CrossRef] [Green Version]
- Gagliardi, V.; Benedetto, A.; Bianchini Ciampoli, L.; D’Amico, F.; Alani, A.; Tosti, F. Health Monitoring Approach for Transport Infrastructure and Bridges by Satellite Remote Sensing Persistent Scatterer Interferometry (PSI); SPIE: Bellingham, WA, USA, 2020; Volume 11534. [Google Scholar] [CrossRef]
- Itoh, K. Analysis of the phase unwrapping algorithm. Appl. Opt. 1982, 21, 2470. [Google Scholar] [CrossRef] [PubMed]
- Ghiglia, D.C.; Pritt, M.D. Two-Dimensional Phase Unwrapping: Theory, Algorithms, and Software. 1998. Available online: https://analyticalscience.wiley.com/do/10.1002/sepspec.9780471249351/full/ (accessed on 15 August 2021).
- Goldstein, R.M.; Zebker, H.A.; Werner, C.L. Satellite radar interferometry: Two-dimensional phase unwrapping. Radio Sci. 1988, 23, 713–720. [Google Scholar] [CrossRef] [Green Version]
- Xu, W.; Cumming, I. A region-growing algorithm for InSAR phase unwrapping. IEEE Trans. Geosci. Remote Sens. 1999, 37, 124–134. [Google Scholar] [CrossRef] [Green Version]
- Arevalillo-Herráez, M.; Villatoro, F.R.; Gdeisat, M.A. A robust and simple measure for quality-guided 2D phase unwrapping algorithms. IEEE Trans. Image Process. 2016, 25, 2601–2609. [Google Scholar] [CrossRef]
- Flynn, T.J. Two-dimensional phase unwrapping with minimum weighted discontinuity. J. Opt. Soc. Am. A 1997, 14, 2692–2701. [Google Scholar] [CrossRef]
- Yu, H.; Lan, Y.; Yuan, Z.; Xu, J.; Lee, H. Phase unwrapping in InSAR: A review. IEEE Geosci. Remote Sens. Mag. 2019, 7, 40–58. [Google Scholar] [CrossRef]
- Pritt, M.D.; Shipman, J.S. Least-squares two-dimensional phase unwrapping using FFT’s. IEEE Trans. Geosci. Remote Sens. 1994, 32, 706–708. [Google Scholar] [CrossRef]
- Ghiglia, D.C.; Romero, L.A. Robust two-dimensional weighted and unweighted phase unwrapping that uses fast transforms and iterative methods. J. Opt. Soc. Am. A 1994, 11, 107–117. [Google Scholar] [CrossRef]
- Kaufmann, G.H.; Galizzi, G.E.; Ruiz, P.D. Evaluation of a preconditioned conjugate-gradient algorithm for weighted least-squares unwrapping of digital speckle-pattern interferometry phase maps. Appl. Opt. 1998, 37, 3076–3084. [Google Scholar] [CrossRef]
- Costantini, M. A novel phase unwrapping method based on network programming. IEEE Trans. Geosci. Remote Sens. 1998, 36, 813–821. [Google Scholar] [CrossRef]
- Chen, C.W.; Zebker, H.A. Network approaches to two-dimensional phase unwrapping: Intractability and two new algorithms. J. Opt. Soc. Am. A 2000, 17, 401–414. [Google Scholar] [CrossRef]
- Chen, C.W.; Zebker, H.A. Two-dimensional phase unwrapping with use of statistical models for cost functions in nonlinear optimization. J. Opt. Soc. Am. A 2001, 18, 338–351. [Google Scholar] [CrossRef] [Green Version]
- Chen, C.W.; Zebker, H.A. Phase unwrapping for large SAR interferograms: Statistical segmentation and generalized network models. IEEE Trans. Geosci. Remote Sens. 2002, 40, 1709–1719. [Google Scholar] [CrossRef] [Green Version]
- Nies, H.; Loffeld, O.; Wang, R. Phase unwrapping using 2D-Kalman filter-potential and limitations. In Proceedings of the IGARSS 2008-2008 IEEE International Geoscience and Remote Sensing Symposium, Boston, MA, USA, 7–11 July 2008; pp. IV-1213–IV-1216. [Google Scholar]
- Wei, Z.Q.; Jin, Y.Q. InSAR Phase Unwrapping Algorithm Based on Ant Colony Algorithm. J. Electron. Inf. Technol. 2008, 3. [Google Scholar] [CrossRef]
- Huang, Q.; Zhou, H.Q.; Dong, S.C.; Xu, S.J. Parallel branch-cut algorithm based on simulated annealing for large-scale phase unwrapping. IEEE Trans. Geosci. Remote Sens. 2015, 53, 3833–3846. [Google Scholar] [CrossRef]
- Spoorthi, G.; Gorthi, S.; Gorthi, R.K.S.S. PhaseNet: A deep convolutional neural network for two-dimensional phase unwrapping. IEEE Signal Process. Lett. 2018, 26, 54–58. [Google Scholar] [CrossRef]
- Zhou, L.F.; Yu, H.W.; Lan, Y. Deep convolutional neural network-based robust phase gradient estimation for two-dimensional phase unwrapping using SAR interferograms. IEEE Trans. Geosci. Remote Sens. 2020, 58, 4653–4665. [Google Scholar] [CrossRef]
- Carballo, G.F.; Fieguth, P.W. Probabilistic cost functions for network flow phase unwrapping. IEEE Trans. Geosci. Remote Sens. 2000, 38, 2192–2201. [Google Scholar] [CrossRef]
- Goldstein, R.M.; Werner, C.L. Radar interferogram filtering for geophysical applications. Geophys. Res. Lett. 1998, 25, 4035–4038. [Google Scholar] [CrossRef] [Green Version]
- Zefa, Y.; Zhiwei, L.; Jianjun, Z.; Huiwei, Y.; Jun, H.; Guangcai, F. Deriving Dynamic Subsidence of Coal Mining Areas Using InSAR and Logistic Model. Remote Sens. 2017, 9, 125. [Google Scholar] [CrossRef] [Green Version]
- Lee, D.-T.; Schachter, B.J. Two algorithms for constructing a Delaunay triangulation. Int. J. Comput. Inf. Sci. 1980, 9, 219–242. [Google Scholar] [CrossRef]
- Lee, J.-S.; Hoppel, K.W.; Mango, S.A.; Miller, A.R. Intensity and phase statistics of multilook polarimetric and interferometric SAR imagery. IEEE Trans. Geosci. Remote Sens. 1994, 32, 1017–1028. [Google Scholar] [CrossRef]
- Lee, J.-S.; Miller, A.R.; Hoppel, K.W. Statistics of phase difference and product magnitude of multi-look processed Gaussian signals. Waves Random Media 1994, 4, 307. [Google Scholar] [CrossRef]
Figure 1.
Schematic diagram of the first-level network. The white points are the phase points that are masked due to poor quality, the green points are the first-level points, the corresponding green solid arrow is the Delaunay triangulation formed by the first-level points, and the green dashed arrow is deleted due to the long distance The yellow points are the second-level points.
Figure 2.
Schematic diagram of the second-level network.
Figure 2.
Schematic diagram of the second-level network.
Figure 3.
The flow chart of the proposed method HNCA.
Figure 3.
The flow chart of the proposed method HNCA.
Figure 4.
(a) Unwrapping phase simulated by Peaks function; (b) phase noise simulated according to coherence; (c) phase obtained by rewrapping after adding (a,b); (d) phase hierarchical results where white represents high-quality first-level phase points, and black represents low-quality second-level phase points.
Figure 5.
Comparison of unwrapped results of different methods: (a1) no hierarchical WLS method; (a2) WLS method for first-level points and HNCA method for second-level points; (b1) PU results of no hierarchical mcf method; (b2) mcf method for first-level points and HNCA method for second-level points; (c1) PU results of no hierarchical snaphu method; (c2) snaphu method for first-level points and HNCA method for second-level points.
Figure 6.
Comparison of unwrapping errors of different methods. Letters a, b, and c represent the WLS, mcf, and snaphu methods, respectively. Numbers 1–6 represent the unwrapping error of the first-level phase points without hierarchical networking, the unwrapping error of the first-level phase points with hierarchical networking, the unwrapping error of the second-level phase points without hierarchical networking, the unwrapping error of the second-level phase points with HNCA, the overall unwrapping error without hierarchical networking, and the overall unwrapping error with hierarchical unwrapping, respectively.
Figure 7.
Data processing results in the Datong area of Shanxi Province. (a) Wrapped interferometric phase images, (b) interferometric coherence images, and (c) phase hierarchical results where white represents high-quality first-level phase points, and black represents low-quality second-level phase points.
Figure 8.
Phase unwrapped results of different methods: (a1) PU results of no hierarchical WLS method; (a2) WLS method for first-level points and HNCA method for second-level points; (b1) PU results of no hierarchical mcf method; (b2) mcf method for first-level points and HNCA method for second-level points; (c1) PU results of no hierarchical snaphu method; (c2) snaphu method for first-level points and HNCA method for second-level points. The black ellipse indicates an area that is heavily polluted by noise and has low coherence.
Figure 9.
The distribution of the residues of different unwrapping methods, where the grey dots indicate the residues and Nres indicates the number of residues.
Figure 9.
The distribution of the residues of different unwrapping methods, where the grey dots indicate the residues and Nres indicates the number of residues.
Figure 10.
The statistical distribution of the PSD between the proposed method and the traditional method: (a) based on the WLS method; (b) based on the mcf method; (c) based on the snaphu method.
Figure 10.
The statistical distribution of the PSD between the proposed method and the traditional method: (a) based on the WLS method; (b) based on the mcf method; (c) based on the snaphu method.
Figure 11.
(a) Simulated phase noise according to coherence; (b) interferogram after adding noise; (c) phase coherence.
Figure 11.
(a) Simulated phase noise according to coherence; (b) interferogram after adding noise; (c) phase coherence.
Figure 12.
Unwrapping error with different coherence thresholds: (1), the error without hierarchical networking; (2)–(16) denote the unwrapping error of the new method under different thresholds; T, the coherence threshold.
Figure 12.
Unwrapping error with different coherence thresholds: (1), the error without hierarchical networking; (2)–(16) denote the unwrapping error of the new method under different thresholds; T, the coherence threshold.
Figure 13.
Point hierarchical results under different thresholds, where white represents high-quality first-level phase points, and black represents low-quality second-level phase points.
Figure 13.
Point hierarchical results under different thresholds, where white represents high-quality first-level phase points, and black represents low-quality second-level phase points.
Figure 14.
RMSE statistics under different hierarchical networking thresholds. (a–c) The RMSE changes in the first-level points, the second-level points, and all points with the increase in the hierarchical networking thresholds, respectively. (d) The accuracy improvement of the second-level points and all points with the increase in the hierarchical networking thresholds.
Figure 15.
Coherence at four different noise levels. (a–d) Noise is continually increasing, and the coherence continually worsens.
Figure 15.
Coherence at four different noise levels. (a–d) Noise is continually increasing, and the coherence continually worsens.
Figure 16.
Comparison of unwrapped errors under different noise levels. (a1–d1) The unwrapping errors of mcf method at four noise levels; (a2–d2) the unwrapping error of HNCA method at four noise levels.
Figure 16.
Comparison of unwrapped errors under different noise levels. (a1–d1) The unwrapping errors of mcf method at four noise levels; (a2–d2) the unwrapping error of HNCA method at four noise levels.
Figure 17.
Distribution statistics of unwrapping error of low-quality second-level points under different noise levels.
Figure 17.
Distribution statistics of unwrapping error of low-quality second-level points under different noise levels.
Table 1.
The RMSE of different unwrapping methods.
Table 1.
The RMSE of different unwrapping methods.
| Methods | Level 1 Points | Level 2 Points | All |
|---|
| WLS | 10.34% | 16.67% | 12.86% |
| mcf | 0% | 18.44% | 9.48% |
| snaphu | 0% | 18.00% | 9.44% |
Table 2.
Basic parameters of PALSAR2 images in the Datong mining area.
Table 2.
Basic parameters of PALSAR2 images in the Datong mining area.
| SAR Images | Acquisition Date | Frame | Orbit | Incidence Angle
| Temporal Baseline (Day) | Perpendicular Baseline (m) |
|---|
| Master | 14 September 2018 | 790 | 23,281 | 40.565 | 28 | 267.80 |
| Slave | 21 October 2018 | 790 | 23,695 | 40.568 |
Table 3.
Comparison of RMSE under four noise levels.
Table 3.
Comparison of RMSE under four noise levels.
| Points Level | Noise 1 | Noise 2 | Noise 3 | Noise 4 |
|---|
| Level 1 | No hierarchical | 0.49 | 0.60 | 0.73 | 0.87 |
| Hierarchical | 0.49 | 0.60 | 0.72 | 0.86 |
| Improvement | 0% | 0% | 0.30% | 0.54% |
| Level 2 | No hierarchical | 1.29 | 1.42 | 1.60 | 1.77 |
| Hierarchical | 0.87 | 0.86 | 0.89 | 0.95 |
| Improvement | 32.83% | 38.91% | 44.46% | 46.29% |
| All points | No hierarchical | 0.54 | 0.71 | 0.89 | 1.07 |
| Hierarchical | 0.51 | 0.62 | 0.74 | 0.87 |
| Improvement | 5.1% | 11.68% | 16.28% | 18.80% |
| Publisher’s Note: MDPI stays neutral with regard to jurisdictional claims in published maps and institutional affiliations. |
© 2021 by the authors. Licensee MDPI, Basel, Switzerland. This article is an open access article distributed under the terms and conditions of the Creative Commons Attribution (CC BY) license (https://creativecommons.org/licenses/by/4.0/).


