Article

Vessel Target Detection in Spaceborne–Airborne Collaborative SAR Images via Proposal and Polarization Fusion

1
School of Electronic Information and Communications, Huazhong University of Science and Technology, Wuhan 430074, China
2
National Key Laboratory of Science and Technology on Multi-Spectral Information Processing, Huazhong University of Science and Technology, Wuhan 430074, China
3
Department of Electronic Engineering, Tsinghua University, Beijing 100084, China
4
School of Electronics and Information Engineering, Harbin Institute of Technology, Harbin 150001, China
*
Author to whom correspondence should be addressed.
Remote Sens. 2021, 13(19), 3957; https://doi.org/10.3390/rs13193957
Submission received: 6 August 2021 / Revised: 23 September 2021 / Accepted: 29 September 2021 / Published: 2 October 2021

Abstract

:
This paper focuses on vessel detection through the fusion of synthetic aperture radar (SAR) images acquired from spaceborne–airborne collaborative observations. The vessel target detection task becomes more challenging when it features inshore interferences and structured and shaped targets. We propose a new method, based on target proposal and polarization information exploitation (TPPIE), to fuse the spaceborne–airborne collaborative SAR images for accurate vessel detection. First, a new triple-state proposal matrix (TSPM) is generated by combining the normed gradient-based target proposal and the edge-based morphological candidate map. The TSPM can be used to extract the potential target regions, as well as filtering out the sea clutter and inshore interference regions. Second, we present a new polarization feature, named the absolute polarization ratio (APR), to exploit the intensity information of dual-polarization SAR images. In the APR map, the vessel target regions are further enhanced. Third, the final fused image with enhanced targets and suppressed backgrounds (i.e., improved target-to-clutter ratio; TCR) is attained by taking the Hadamard product of the intersected TSPM from multiple sources and the composite map exploiting the APR feature. Experimental analyses using Gaofen-3 satellite and unmanned aerial vehicle (UAV) SAR imagery indicate that the proposed TPPIE fusion method can yield higher TCRs for fused images and better detection performance for vessel targets, compared to commonly used image fusion approaches.

1. Introduction

Synthetic aperture radar (SAR) is an active imaging and detection sensor, which usually operates in the microwave/millimeter wave (MMW) bands. SAR systems have been widely investigated and developed in both military and civilian fields, due to their ability to provide local and global scene observations under all time and weather conditions [1,2,3,4,5,6,7]. In particular, vessel target detection using SAR systems has attracted widespread attention and has practical significance in important applications, including maritime security, fishery monitoring, marine transportation, and so on.
In current vessel detection tasks, the SAR data are generally collected solely from a spaceborne or airborne platform. Specifically, spaceborne platforms can achieve global monitoring over a large sea area; however, spaceborne SARs usually need several days to revisit the same local area of interest. Meanwhile, airborne SAR platforms can provide more flexible and fast revisit periods, on the order of several seconds or minutes, and can acquire high-resolution SAR images of local areas of interest; however, the limitations on its observation area size should be noted. The above issues naturally inspired us to jointly use spaceborne and airborne SAR observations, taking advantage of their respective strengths to improve the performance of vessel target detection, compared with the individual use of a spaceborne or airborne SAR system.
The basic implementation of such a spaceborne–airborne collaborative SAR system is as follows. First, the spaceborne SAR makes use of the global monitoring capability, providing observations over a large area. Then, for some particular local area of interest, the airborne platform, such as an unmanned aerial vehicle (UAV), flexibly moves to this local region to achieve a more focused SAR observation. Finally, the data acquired by the collaborative observations are processed, in order to extract more information of the observed scene, helping to improve the vessel detection performance. In the collaborative system, a short time interval between the global large area observation and the local focused observation is preferred to attain an effective collaboration. This demand can be fulfilled by properly designing the spaceborne–airborne SAR collaboration system, especially in scenarios where vessel targets are relatively stationary, such as in inshore environments, or move much slowly than the airborne SAR platform in offshore environments [8,9]. In these scenarios, it is reasonable to assume that the position displacements of vessel targets can be negligible and the conditions of sea clutter do not change obviously between the collaborative observations of the spaceborne and airborne SARs for the local area of interest.

1.1. Related Work

In this paper, we focus on vessel target detection through the fusion of SAR images generated by spaceborne–airborne collaborative observations. The crucial problem is to attain a fused image with enhanced target regions and suppressed backgrounds from the spaceborne and airborne SAR images, in order to increase the target-to-clutter ratio (TCR) and improve the vessel target detection performance. Considering the issue of image fusion, some works have been carried out in the existing literature [10,11,12,13,14,15,16,17,18,19,20,21,22,23]. The most straightforward and computationally efficient fusion methods are arithmetic-based fusion approaches, such as addition fusion and multiplication fusion, but this class of fusion approaches might maintain a high level of background clutter, resulting in false alarms, or excessively suppress relatively weak targets, resulting in missed detections [10]. Some radar image fusion approaches based on the discrete wavelet transform (DWT) and principal component analysis (PCA) have been introduced, in order to highlight spatial detail information in specific applications, such as land-cover classification, bridge detection, and so on [11,12,13]. The fuzzy logic fusion approach and its variations [14,15,16] have been also employed to enhance radar image contrast for target detection and sensing. In [17], a framelet domain-based random walk approach is proposed for multi-band SAR image fusion, by which the target contrast is enhanced and edges are well-preserved. In [18], a non-linear PCA approach based on an auto-associative neural network (AANN) was presented to fuse SAR images from different spaceborne platforms and improve the target classification performance. In [19], a fusion method was proposed to combine the strengths of hyperspectral and multispectral images, in order to achieve spatial resolution enhancement. Although most of the above image fusion approaches have addressed the issues of image smoothing, denoising, or enhancement, it is difficult to directly apply these approaches in spaceborne–airborne SAR collaboration for vessel target detection, which pursues a high TCR (i.e., simultaneously enhanced targets and suppressed backgrounds) in fused images.
In more detail, for inshore environments, there exist inshore interferences induced by coastal land, embankments, and shrubs, which have similar intensities as the target vessel in SAR images. In this case, image processing lacking anticipated target-interference discrimination inevitably results in serious false alarms [24,25,26], accordingly deteriorating the quality of the fused images and the target detection performance. Moreover, it is difficult to accurately detect structured and shaped vessel targets that only contain discrete strong scattering points and whose partial hulls show similar intensities as the sea clutter. Classical constant false alarm rate (CFAR)-based detection approaches easily lead to missed detections for such vessel targets, especially in high-resolution SAR images [26,27]. Several learning-based approaches exploiting convolutional neural networks (CNNs) [28,29] have also been suggested to handle the above difficulties. However, the satisfactory performance of these learning-based approaches heavily relies on a large volume of training data, which cannot be provided at current stage of the fusion of spaceborne–airborne collaborative SAR images for the vessel detection task. Overall, the above related works [24,25,26,27,28,29] have mainly focused on the processing of SAR images from a single platform, but do not consider the fusion of SAR images from multiple platforms for vessel detection.

1.2. Main Contributions

In this paper, we propose a new method based on target proposal and polarization information exploitation (TPPIE), in order to fuse spaceborne–airborne collaborative SAR images for the accurate vessel detection. The main contributions of this paper can be summarized as follows:
(1) On one hand, the target proposals (TPs), which represent the bounding boxes covering most of the potential target areas with small biases [30,31,32], are employed and combined with morphological candidate target regions. In more detail, to efficiently quantify the objectness and generate the TPs in the image, a linear support vector machine (SVM) is utilized, based on the dissimilarity between normed gradient (NG) features [32] of patches occupied by vessel targets and background clutter. Further, the generated NG-based TPs are combined with morphological candidate maps using target edge information. This helps to better achieve target extraction and background suppression, compared to the sole use of TPs.
(2) On the other hand, as motivated by the effectiveness of polarization information exploitation in radar image enhancement [14,15,33], we utilize the intensity information of dual-polarization SAR images and introduce a new polarization feature, named the absolute polarization ratio (APR). The APR feature mainly makes use of the difference of dual-polarization (e.g., horizontal and vertical polarization) characteristics of regions occupied by vessel targets and background clutter. Unlike the existing works based on polarimetric covariance matrix [4,34,35], the APR does not need full polarimetric information, can be constructed more simply, and can effectively enhance the target regions.
The proposed TPPIE method contains three stages: First, a new triple-state proposal matrix (TSPM) is generated, by multiplying the TP based on NG features [32] with the morphological candidate map using target edge information. Second, a new polarization feature, APR, is calculated to exploit the intensity information of dual-polarization SAR images provided by the airborne sensor platform. Third, the final fused image with improved TCR (i.e., enhanced targets and suppressed backgrounds) is attained by the Hadamard product of the intersected TSPM from spaceborne–airborne collaborative observations and the composite map exploiting APR features, as well as the original SAR images.
Throughout the above three stages, the proposed TPPIE fusion method achieves the effective collaboration of multiple SAR sensor platforms, allowing for the extraction of more useful information of the observed scene and improvement of the target detection performance. Experimental analyses using Gaofen-3 satellite and UAV SAR imagery demonstrate that the proposed TPPIE fusion method yields higher TCRs in the fused images and better detection performance of vessel targets, compared with commonly used image fusion approaches and conventional processing methods with single-SAR images.

1.3. Paper Outline

The remainder of the paper is organized as follows: Section 2 describes the process of spaceborne–airborne collaborative SAR observation and the associated vessel target detection problem. Section 3 introduces the proposed TPPIE image fusion method. Section 4 shows the experimental results with Gaofen-3 and UAV SAR images and validates the effectiveness of the proposed TPPIE method for vessel target detection. Section 5 concludes the paper.

2. Vessel Detection through Spaceborne–Airborne Collaborative SAR Observations

This section describes the process of spaceborne–airborne collaborative SAR observation and the associated vessel target detection task, as illustrated in Figure 1. More specifically, in the spaceborne–airborne SAR collaboration system, the spaceborne platform first conducts a global large area observation. For a particular local area of interest, the corresponding image can be extracted, denoted as I s R M s × N s , where M s × N s is the number of pixels in the spaceborne image I s . Next, the airborne platform (e.g., UAV SAR sensor) promptly flies to the local area of interest and achieves a more focused observation. The acquired airborne image is denoted as I a R M a × N a , where M a × N a is the number of pixels in the image I a . Note that the time interval between the spaceborne and airborne observations should be appropriately small, such that the vessel targets do not have large displacements and the sea clutter conditions do not change obviously, with the aim of attaining an effective collaboration. This demand should be reasonably considered in designing such a spaceborne–airborne SAR collaboration system.
Before the image fusion step, the intensities of the images I s and I a are normalized into the range of [ 0 , 1 ] . The image registration between I s and I a is also achieved by using the auxiliary geographic coordinate information. A dedicated discussion on the image registration issue is out of the scope of this paper and, for more details on state-of-the-art image registration methods, we refer the reader to [36,37,38,39]. Moreover, airborne SAR images generally have higher resolution and show more detailed information of the observed scene than the spaceborne SAR images [40]. The nearest-neighbor interpolation technique, which is computationally simple and can avoid the spectral distortion induced by interpolation [41], is employed on the low-resolution spaceborne SAR image I s , to make it have the same size as the corresponding high-resolution airborne SAR image I a (i.e., M a = M s = M and N a = N s = N ).
The next problem involves fusing the spaceborne and airborne SAR images (i.e., I s , I a R M × N ) for vessel target detection, as follows:
( I s , I a ) Fusion Fused Image with Improved TCR Thresh . Satisfactory Detection Results .
The direct use of existing image fusion methods for the problem (1) will lead to limited improvement of TCR and unsatisfactory target detection performance. Thus, we wish to form a fused image with enhanced target regions and suppressed backgrounds (including sea clutter and inshore interferences), in order to increase the image TCR and improve the detection performance of vessel targets in the following thresholding and detection steps.

3. Proposed Method

The flowchart of the proposed TPPIE method is illustrated in Figure 2. The TPPIE method mainly comprises three stages: (1) generation of the TSPMs by combining the TP based on normed gradient (NG) [32] and the morphological candidate map using target edge information for spaceborne and airborne SAR images; (2) exploitation of APR feature based on the intensity information of dual-polarization SAR images provided by the airborne platform; and (3) generation of the fused image by the Hadamard product of the intersected TSPM from spaceborne–airborne collaborative observations and the composite map exploiting APR feature, as well as the original SAR images. Then, the fused image with improved TCR (i.e., enhanced targets and suppressed backgrounds) is used for thresholding and vessel target detection.

3.1. TSPM Generation

In the first stage, we generate a new TSPM by combining the NG-based TP and the edge-based morphological candidate map for spaceborne and airborne SAR images, denoted as I s , I a R M × N . In the generated TSPM, the potential vessel target regions can be extracted well and the background regions including sea clutter and inshore interferences can be filtered out.

3.1.1. NG-Based TP Extraction

The TPs represent the bounding boxes that cover potential targets in the images. We employ a linear support vector machine (SVM) to extract the TPs from I s and I a , by exploiting the difference of NG features between image patches that contain vessel targets and background clutter. The detailed procedure is as follows:
  • SVM Classifier Training Step: Given training SAR images, the number of bounding boxes of vessel targets and non-target backgrounds (e.g., sea clutter and inshore interferences) are set as K 1 and K 2 , respectively. These bounding boxes are resized to a small size D × D . Then, for each resized bounding box, the NG value is calculated as [32]
    G ( x , y ) = g x 2 + g y 2 ,
    where ( x , y ) are the pixel coordinates in the resized bounding box for x , y = 1 , , D , and g x and g y are the image gradients in the horizontal and vertical directions, respectively. According to (2), we denote the obtained NG map as G R D × D . In this training step, the NG maps of target samples (i.e., { G ( k 1 ) : k 1 = 1 , , K 1 } ) and those of background samples (i.e., { G ( k 2 ) : k 2 = 1 , , K 2 } ) are used to train a linear SVM classifier F ( · ) as follows: the bounding box is a target proposal when its corresponding NG map, G , satisfies F ( G ) = 1 ; otherwise, it is not a target proposal if F ( G ) = 1 .
  • TP Extraction Step: Next, the TPs from test SAR images I s and I a are extracted using the SVM classifier trained in the first step. In more detail, the test spaceborne or airborne SAR image is first resized to different pre-defined sizes and, for each resultant image, the corresponding NG map is calculated based on (2). Then, the resized TPs are extracted with the aid of a D × D sliding window on each NG map and the trained SVM classifier. Finally, the normal TPs are obtained by resizing all the NG maps to the size of the original test image. To represent the regions occupied by the TPs for I s and I a , we introduce the proposal matrices P s and P a , respectively. In the proposal matrix P u , u { s , a } , its entry P u ( m , n ) is equal to one if ( m , n ) belongs to any TP in I u ; otherwise, it is equal to zero, where m = 1 , , M and n = 1 , , N .

3.1.2. Construction of Edge-Based Morphological Candidate Map

We employ a morphological closing operation based on target edge information to construct a candidate map for the original SAR image. In the constructed candidate map, the potential target regions are highlighted and the vessel shapes are well delineated. More specifically, given a spaceborne or airborne SAR image I u , u { s , a } , the corresponding candidate image C u is calculated as
C u = MC ( E ( I u ) , SE u ) ,
where E ( · ) denotes calculating the binary edges of the image; any typical edge detection algorithms (e.g., Sobel, Prewitt, Roberts, and so on) can be adopted for this purpose. Furthermore, MC ( · ) denotes the morphological closing operation with the structure element SE u , that should be properly chosen for the edge image E ( I u ) , u { s , a } . The issue regarding the selection of the structure element is discussed in Section 3.3.
Note that, in addition to the target regions, some other regions containing interferences from inshore environments could be also restored in the candidate map C u , u { s , a } . To discriminate these interference regions from the real vessel targets, we combine the candidate map C u with the aforementioned proposal matrix P u , u { s , a } , in order to generate a new TSPM in the following manner:
T u = P u + P u C u 2 ,
where ⊙ denotes the Hadamard product.
Further, we make use of the information provided by the spaceborne and airborne SAR platforms by taking the intersection of the TSPMs T s and T a with a thresholding operation; that is,
T f ( m , n ) = T s ( m , n ) · T a ( m , n ) , if T s ( m , n ) · T a ( m , n ) < 0.5 , 1 , otherwise ,
where T u ( m , n ) is the value of the ( m , n ) -th element in T u for u { f , s , a } , m = 1 , , M , and n = 1 , , N . Here, T f is named the intersected TSPM, whose elements have three states, with values of 1, 0.25, or 0. In this way, we can significantly reduce the number of false alarms induced by the inshore interferences and sea clutter, while retaining the potential target regions in the spaceborne SAR image I s and the airborne SAR image I a . Therefore, the generated intersected TSPM, considering the fusion of TSPMs of I s and I a , can be also used for the vessel target task. This fusion method is denoted ITSPM, and its performance is analyzed in Section 4.

3.2. APR Feature Exploitation

In the second stage, we present a new polarization feature, named APR, based on the intensity information of dual-polarization SAR images provided by the airborne platform. Compared with conventional polarization information processing methods, such as arithmetic-based fusion, PCA, DWT, and fuzzy logic [14,15,33], the APR feature exploits the characteristic polarization difference of background clutter and vessel targets, such that it can better enhance the potential target regions and, thus, improve the image TCR.
The proposed APR is expressed as
A P R ( m , n ) = min P R ( m , n ) β , 1 ,
where P R ( m , n ) denotes the ratio of polarimetric intensity values at the ( m , n ) -th pixel for m = 1 , , M , and n = 1 , , N , which is calculated as
P R ( m , n ) = I a H H ( m , n ) + α I a V V ( m , n ) + α ,
with I a H H ( m , n ) and I a V V ( m , n ) being the intensity values at the ( m , n ) -th pixel of the dual-polarization airborne SAR images, respectively; α is a small positive number; and the parameter β is the shift factor (SF), denoting the shifting degree of the intensity histogram. The SF value can be properly determined based on the highest bin determined through histogram analysis of the PR map. According to (6) and (7), we denote the obtained PR map and APR map as Q R M × N and Q A R M × N , respectively.
Unlike the existing works based on polarimetric covariance matrices [4,34,35], the APR does not need full polarimetric information, can be constructed more simply, and is effective in enhancing the target regions. The idea behind (6) and (7) is to exploit the difference of the dual-polarization (e.g., horizontal and vertical polarization) characteristics of regions occupied by sea clutter and vessel targets. By calculating the ratio of dual-polarization intensity values, as expressed by (7), we find that the PR values corresponding to sea clutter are approximately equal to one, while those for the vessel target regions are obviously smaller or larger than one. Therefore, the areas occupied by the sea clutter and vessel targets appear to be different in the generated PR map, which helps to discriminate the sea clutter and target regions. Next, the SF is introduced, in order to shift the intensity histogram of the PR map according to (6). This histogram shifting operation can make the clutter regions appear with relatively low intensities and, correspondingly, improves the contrast between vessel targets and sea clutter (or, equivalently, the TCR performance).
To make use of the presented APR feature and the information provided by the original (spaceborne or airborne) SAR images, we combine them in an additive manner to generate a composite map, as follows:
Q f = min { Q A + I s + I a H H + I a V V , 1 } .
This composite map not only maintains high contrast between vessel targets and sea clutter, but also better delineates the target boundaries than with the sole use of the APR map. This advantage of the composite map obtained by (8) is confirmed through the comparative results presented in Section 4. Note that both the vessel targets and the inshore interference regions are enhanced in the APR map or the composite map exploiting the APR feature. Such enhanced inshore regions can be effectively suppressed with the aid of the proposed TSPM, as discussed in the following subsection.

3.3. Generation of Fused Image

In the third stage, the final fused image with improved TCR is generated by the Hadamard product of the intersected TSPM from spaceborne–airborne collaborative observations and the composite map exploiting APR feature, as well as the original SAR images.
On one hand, the intersected TSPM expressed by (5) covers the potential target regions by using the TPs from the spaceborne and airborne SAR imagery, as well as filtering out the inshore interferences, to some extent, due to combination with the edge-based morphological candidate map. However, this intersected TSPM might still contain some clutter pixels or inshore interference pixels (which inevitably deteriorate the image contrast), as the TPs are extracted using bounding boxes and the closing operation adopted to construct the morphological candidate map will retain some relatively large connected regions. On the other hand, in the presented composite map exploiting the APR feature expressed by (8) (see, e.g., Figure 5e), although the contrast between vessel targets and sea clutter is significantly improved, the inshore interference regions are also highlighted. The direct utilization of (8) can lead to false alarms in the detection results. Therefore, the combination of the intersected TSPM expressed by (5) and the composite map exploiting APR feature expressed by (8) can take advantage of their respective strengths. The final fused image, I f , is generated as follows:
I f = T f Q f .
In the fused map I f , the target regions are effectively enhanced and the background regions, including sea clutter and inshore interferences, are well-suppressed, thus improving the vessel target detection performance.
The implementation of the proposed new TPPIE image fusion method is summarized in Algorithm 1. Some important implementation details are given in the following.
  • First, we used 22 vessel target samples and 47 non-target samples to train the SVM classifier (i.e., K 1 = 22 and K 2 = 47 ). These training samples were selected from the spaceborne SAR image corresponding to a global large area observation, as shown in the left subgraph of Figure 1. The scattering characteristic differences between target samples and non-target samples can help to extract satisfactory TPs that cover most of the potential target regions and discriminate them from non-target regions, including inshore interferences and sea clutter. Moreover, the size of resized bounding boxes in the training step and the size of sliding window in the TP extraction step were both set to D = 8 , as adopted in [31,32], as this can help the algorithm to work well while maintaining low computational complexity;
  • Then, we considered the shape and size of structure elements in (3). For our experiments, disk-shaped structure elements were used in the morphological closing operation, as they better coincided with the target boundaries than other shapes. Moreover, the size of structure elements was set to be relatively large, comparable to the width of vessel targets (i.e., about 12 m in our datasets). This setting can ensure the extraction of as many of the candidate target regions as possible;
  • Another consideration is the selection of the parameter α in (7) and the SF β in (6). In general, the parameter α is set as a small positive number, helping to discriminate the regions occupied by sea clutter and vessel targets. For our experiments, a proper value of α would be taken within the empirical range of [ 0.01 , 0.05 ] . The SF β can be determined by histogram analysis of the PR map. In more detail, the parameter β was set as the mean of edge values of the highest bin (in the histogram analysis). For our experiments, the values of β were generally within a small neighborhood around one.
Algorithm 1 The proposed TPPIE method.
  Input: 
Original spaceborne SAR image I s and airborne SAR image I a (including horizontal polarization image I a H H and vertical polarization image I a V V ), structure elements, small positive number α , and shift factor (SF) β .
  Output: 
Fused image I f .
• Stage 1—TSPM Generation
1:
Train the SVM classifier based on (2) and extract the TP matrices P s and P a from I s and I a (with the same polarization), respectively.
2:
Construct the edge-based morphological candidate maps C s and C a based on (3).
3:
Generate TSPMs T s and T a based on (4), and obtain the intersected TSPM T f in (5).
• Stage 2—APR Feature Exploitation
4:
Calculate the APR map Q A using intensity information provided by I a H H and I a V V , according to (6) and (7).
5:
Generate the composite map Q f exploiting the APR feature, as well as the original SAR images based on (8).
• Stage 3—Fused Image Generation
6:
Generate the final fused map I f by combining T f and Q f based on (9).

4. Experimental Results

In this section, we evaluate the proposed TPPIE image fusion method using real spaceborne–airborne collaborative SAR images. The parameters of the proposed TPPIE method were properly selected, as per the discussions in Section 3.3. Experimental analyses were conducted by comparing the proposed method with several commonly used image fusion approaches and conventional processing methods using single-SAR images. These comparative image fusion approaches included existing additive and multiplicative fusion approaches [10], PCA [12], DWT [13], fuzzy logic [16], and AANN-based fusion [18]. For more implementation details, we refer the reader to [10,11,12,13,16,18]. For the single-SAR image processing cases, the spaceborne SAR images were used directly; while, for the airborne SAR images, the horizontal and vertical polarization versions were averaged simply and then used in the following comparison.

4.1. Dataset Description

The used spaceborne and airborne SAR images were collected from Gaofen-3 satellite and UAV platforms, respectively, which are shown in Figure 3a–i and whose specifications are summarized in Table 1. The spaceborne SAR images with HH polarization and the airborne SAR images with HH/VV polarization were utilized in the experiments. These images were acquired at the Shanghai port and were registered before the fusion. As expected, the spaceborne SAR image had lower resolution than the airborne SAR image; thus, a nearest-neighbor interpolation technique (which is computationally simple and can avoid the spectrum distortion induced by interpolation [41]) was adopted to resize the spaceborne SAR image, such that it had the same size as the corresponding airborne SAR image. Three observed scenes were considered, which contained inshore interferences, as well as structured and shaped vessel targets. These vessel targets were assumed to be motionless (or to have negligible movements). The target ground truths were labeled by the annotations from technical experts, as illustrated in Figure 3j–l.

4.2. Performance Measures

To evaluate the performances of the above image fusion approaches, some quantitative measures were used. First, the fused images were compared in terms of the TCR and the target improvement factor (TIF). The TCR is defined by [15]
TCR = 10 log 10 ( 1 / W tar . ) R tar . I f ( m , n ) ( 1 / W nontar . ) R nontar . I f ( m , n ) ,
where ( m , n ) denote the coordinates of pixels in the fused map I f , R tar . denotes the target regions, R nontar . denotes the non-target regions (including inshore interferences and sea clutter), and W tar . and W nontar . are the numbers of pixels in R tar . and R nontar . , respectively. In general, a large value of TCR implies that the targets are exactly enhanced and the backgrounds (including inshore interferences and sea clutter) are effectively suppressed, thus improving the target detection performance. The another image quality measure, TIF, denotes the enhancement degree of the target regions [15]:
TIF = 10 log 10 2 R tar . I f ( m , n ) R tar . I s ( m , n ) + R tar . I a ( m , n ) ,
where I s and I a denote the original spaceborne and airborne SAR images, respectively. Next, we compare the detection performances of the aforementioned image fusion approaches. The probability of detection (PD) and the probability of false alarm (PFA) were evaluated as follows [15]
PD = W Dtar . W tar . , PFA = W Dnontar . W nontar . ,
where W Dtar . and W Dnontar . denote the numbers of correctly detected pixels and false alarm pixels in the fused image I f , respectively. Another important measure, the accuracy, was also considered, which can be calculated as
accuracy = W Dtar . + ( W nontar . W Dnontar . ) W tar . + W nontar . .
Moreover, the receiver operator characteristic (ROC) curve, showing the PD as a function of PFA, can be obtained based on (12), in order to indicate the global target detection performances of these approaches in the vessel detection task.

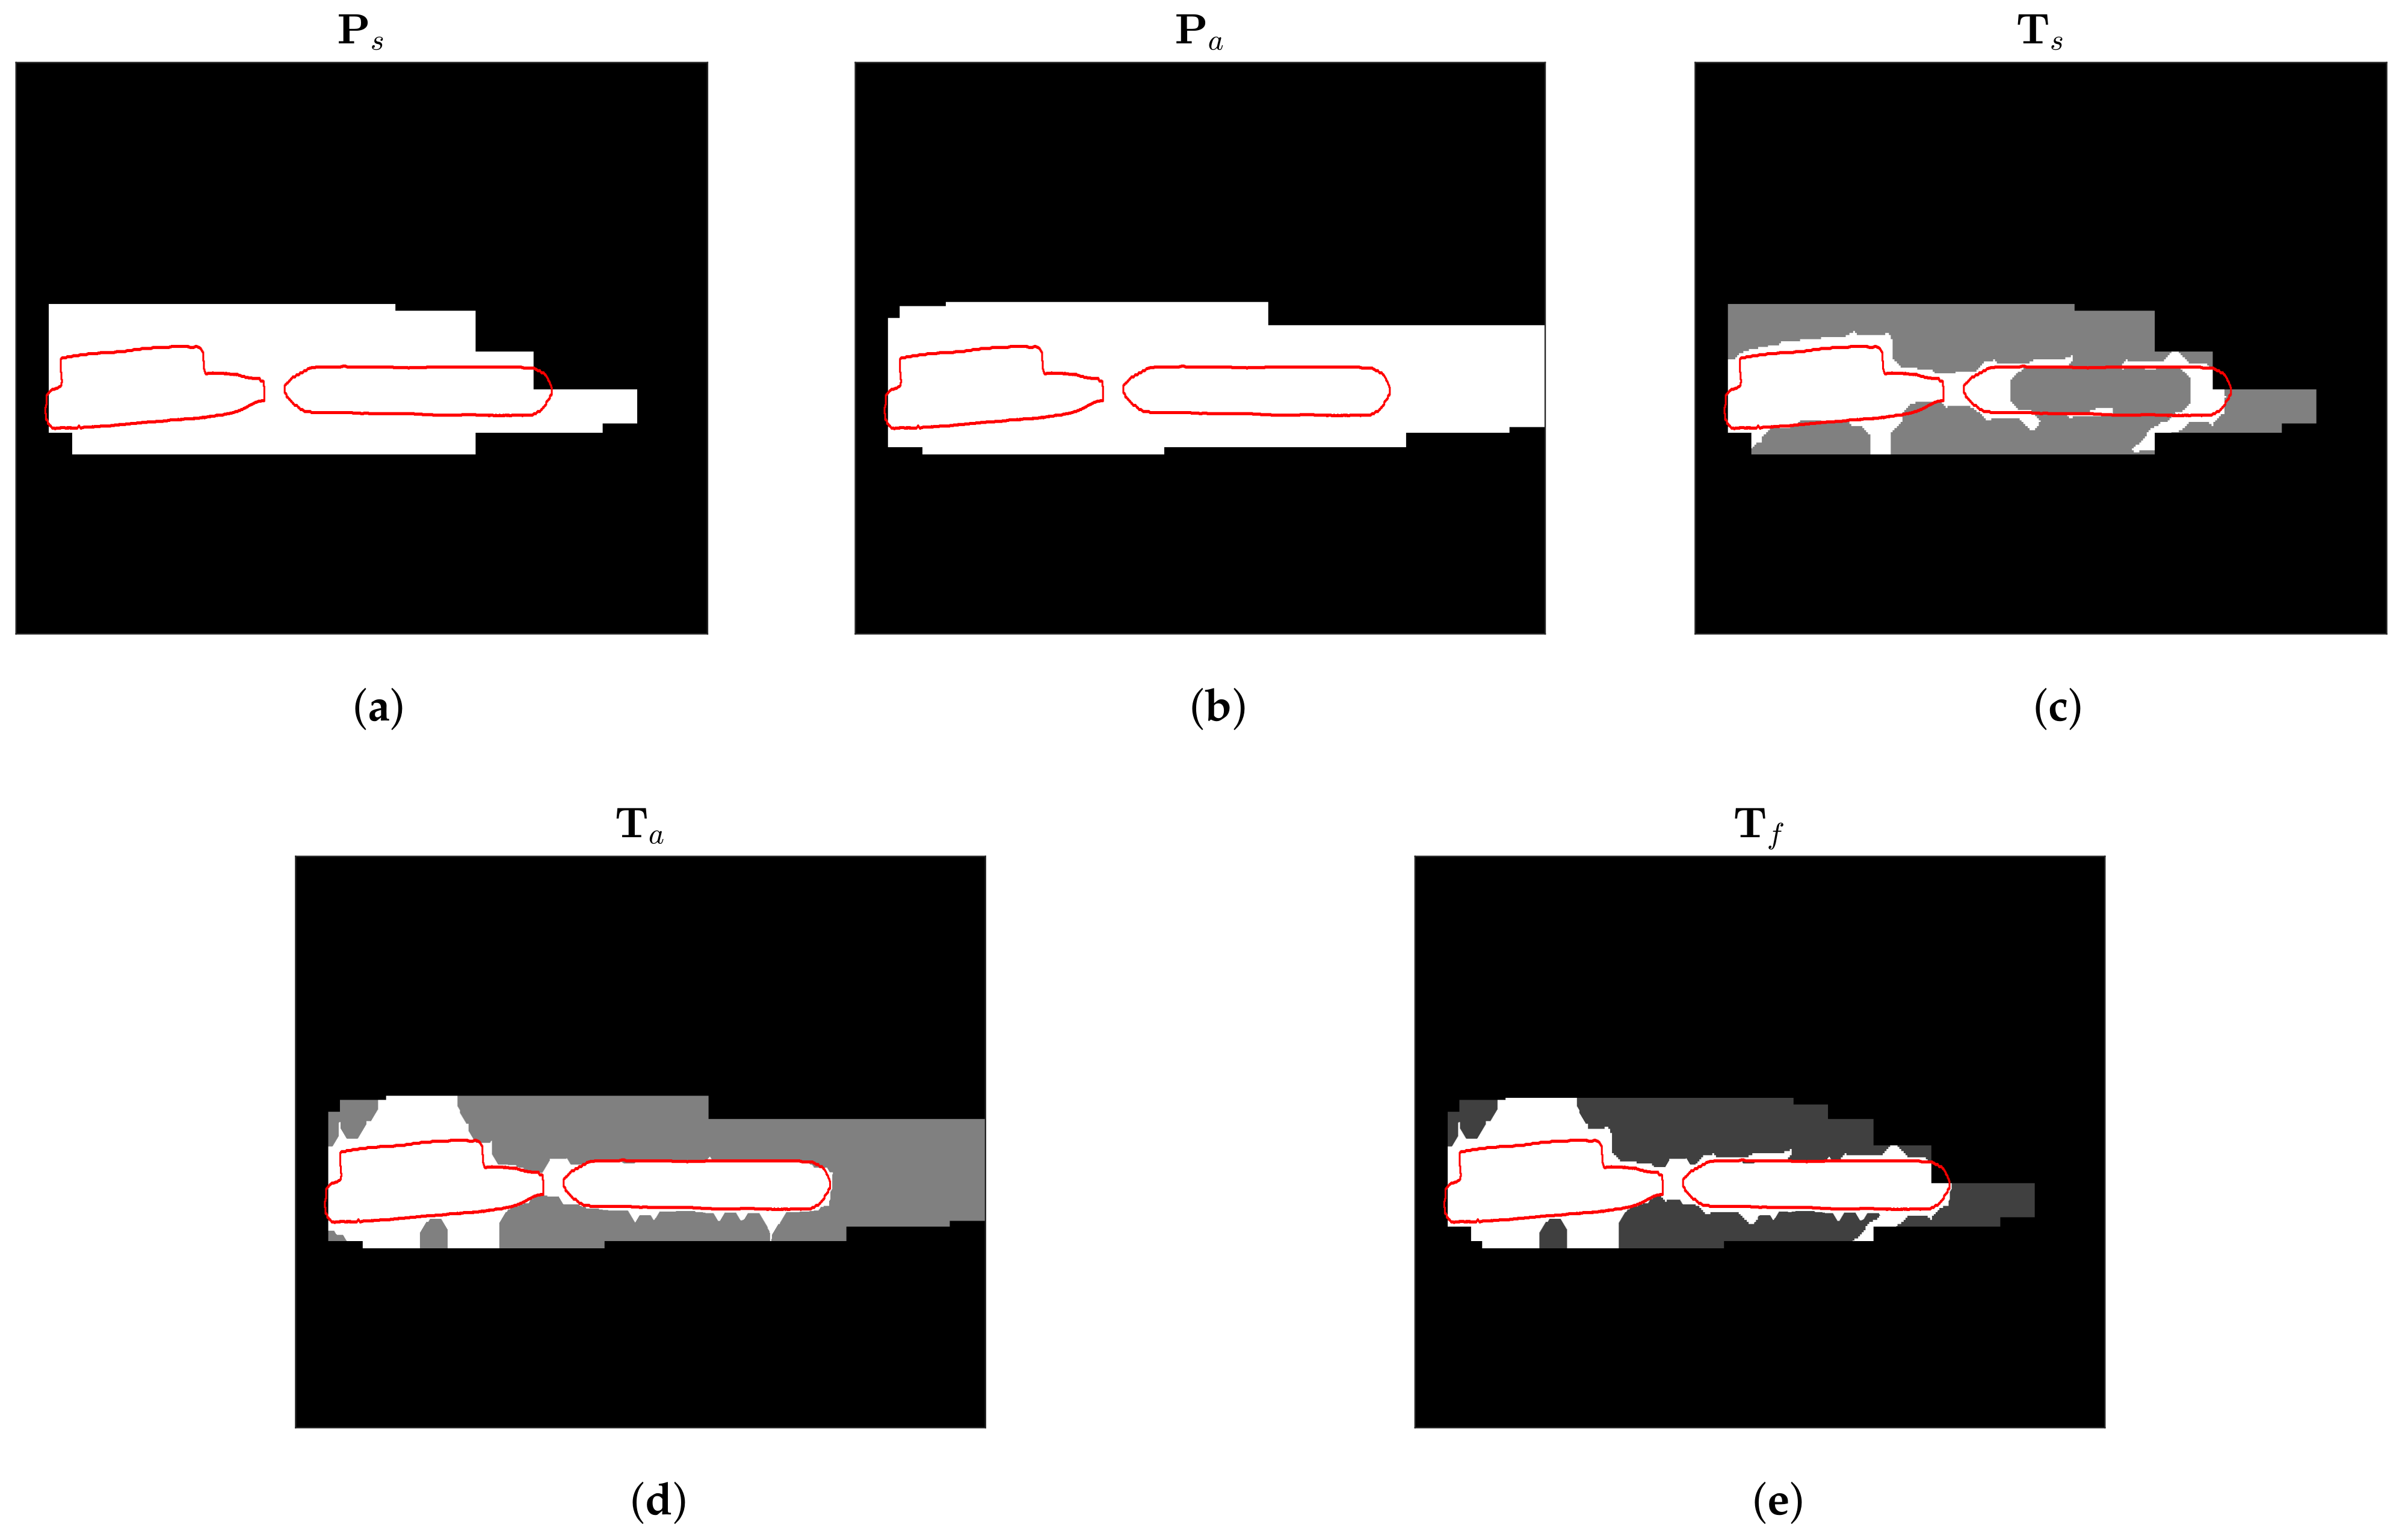
4.3. Illustrative Examples for Intersected TSPM T f in (5) and Composite Map Q f Exploiting APR in (8)

Figure 4a,b show the proposal matrices P s and P a , which contain the TPs from the input SAR images I s and I a for scene 1, respectively. We can see that these TPs captured the potential vessel target regions and can help to reduce the false alarms induced by the sea clutter and inshore interferences. Figure 4c,d illustrate the TSPMs T s and T a , with respect to I s and I a , respectively. Based on (4), considering that the proposal matrix P u and the candidate map C u are both binary-valued, the elements of the generated TSPM have three states (with values of 1, 0.5, and 0), corresponding to three possible regions. More specifically, the elements with state 0 denote the backgrounds (including inshore interferences and sea clutter), those with state 1 denote the potential target regions, and those with state 0.5 denote the regions that are probably the non-target regions, although they have been labeled as TPs. Compared with the sole use of TPs, the advantage of this new generated TSPM combining TPs and the morphological candidate map is to better achieve target extraction and background suppression. Figure 4e shows the intersected TSPM T f based on (5), whose elements have three states, with values of 1, 0.25, and 0. It can be observed that the false alarms induced by the inshore interferences and sea clutter were significantly reduced, while the potential target regions were well-retained.
Next, we take the airborne SAR image with horizontal polarization, denoted as I a H H , and its corresponding vertical polarization image, denoted as I a V V , of scene 1 as an example, as shown in Figure 5a and Figure 5b, respectively. Figure 5c depicts the PR map expressed by (7). It can be seen that the intensity values of most of the pixels (up to about 98%) were within the range of [ 0 , 2 ] . The regions occupied by sea clutter and vessel targets, indeed, appear to be different in this PR map, helping to discriminate the sea clutter and target regions. In Figure 5d, we show the APR map expressed by (6), which introduces the SF to shift the intensity histogram of the PR map. The histogram shifting operation helps to improve the contrast between vessel targets and sea clutter (or, equivalently, the TCR performance). Figure 5e illustrates the composite map exploiting the APR feature, as well as the original SAR images, according to (8). We can see that the composite map not only can maintain high contrast between vessel targets and sea clutter, but also better delineates the target boundaries than with the sole use of the APR map. This advantage of the composite map obtained by (8) can be confirmed by comparing the results shown in Figure 5d,e.

4.4. Image Quality Evaluation

This subsection aims to evaluate the quality of the fused images, in terms of two quantitative measures (i.e., TCR and TIF). Figure 6, Figure 7 and Figure 8 illustrate the fused images obtained by additive fusion, multiplicative fusion, PCA fusion, DWT fusion, fuzzy logic, AANN fusion, and the proposed TPPIE method, as well as the proposed ITSPM fusion method (which combines the NG-based TP and edge-based morphological candidate map).
For scene 1, the fused images in Figure 3a,d,g are shown in Figure 6. Figure 6a depicts the original spaceborne SAR image, and Figure 6b depicts the averaged result of the original airborne SAR images with horizontal and vertical polarizations. As can be seen from Figure 6c, additive fusion did not have an obvious enhancement effect on the target regions, retaining some inshore interferences that can easily result in the false alarms. In contrast, as shown in Figure 6d, multiplicative fusion filtered out the effects of sea clutter and inshore interferences, but the regions occupied by vessel targets were also partially deteriorated. The PCA fusion and AANN fusion approaches combined the principal components of source images in linear and non-linear manners, respectively. The resultant fused images, illustrated in Figure 6e,h, performed to similarly to additive fusion, in terms of maintaining the target and background regions. The DWT fusion approach fuses the high- and low-frequency components of source images. As seen in Figure 6f, the DWT-based fused image did not provide satisfactory performance, concerning target enhancement and background suppression. Figure 6g shows the fused image obtained by fuzzy logic, where both the target regions and the inshore interferences were enhanced, to some extent. The main reason is that the pixel-level fuzzy logic approach has difficulty in discriminating the real targets from background clutter with relatively strong scattering intensity. The above fusion methods lacked the anticipated ability of target–clutter discrimination, and did not fully exploit the polarization characteristics of vessel targets and background clutter. Thus, they had difficult in simultaneously removing the inshore interferences while retaining the structured targets that only contain discrete strong scattering points. These difficulties were effectively handled by the proposed image fusion methods, however. Figure 6i depicts the result obtained by the proposed ITSPM (combining the NG-based TP and edge-based morphological map). Although the target pixels were enhanced, some clutter pixels still remained in the non-zero-state regions, which might deteriorate the detection performance, to some extent. From Figure 6j, it can be seen that the proposed TPPIE method achieved a better fused image with enhanced target regions and suppressed background regions (compared to the existing image fusion approaches), due to the combination of TPs, the edge-based morphological candidate map (as captured by the TSPM), and the exploitation of intensity information of dual-polarization SAR images (as captured by the APR feature).
Figure 7 and Figure 8 show the fused images for Scene 2 [see Figure 3b,e,h] and Scene 3 [see Figure 3c,f,i], respectively. Similar to the results illustrated in Figure 6 for Scene 1, the additive fusion, PCA fusion, DWT fusion, and AANN fusion approaches could only extract a portion of the vessel target regions, and the inshore interference regions were maintained in the fused images. The multiplicative fusion approach obviously suppressed vessel target regions, which can easily lead to missed detections, regardless of removing the effects of sea clutter and inshore interferences. The fuzzy logic-based fusion approach achieved enhancements both in the target regions and the inshore interferences, but the latter will result in false alarms. The proposed ITSPM enhanced the target pixels while still retaining some clutter pixels in the non-zero-state regions. In contrast, the proposed TPPIE fusion method enhanced the vessel targets while, at the same time, suppressing the background regions including sea clutter and inshore interferences, as shown in Figure 7j and Figure 8j, through the TSPM extracting potential target regions and the APR feature exploiting dual-polarization information.
Based on the results in Figure 6, Figure 7 and Figure 8, Table 2, Table 3 and Table 4 list the TCRs and TIFs of the fused images obtained using the different fusion methods. For Scenes 1 and 2, the airborne SAR images had higher TCR than the spaceborne SAR images. Most of the comparative fusion approaches, such as additive fusion, PCA fusion, DWT fusion, and AANN fusion showed higher TCRs than the spaceborne image processing case, but lower TCRs than the airborne image processing case. The multiplicative fusion approach yielded high TCR but had the lowest TIF, as it suppressed not only the background regions but also target vessels. The fuzzy logic fusion approach provided TCR similar to the case of processing the airborne SAR image, but had poor TIF. We also considered Scene 3, which contained more structured and shaped targets. The airborne SAR image had lower TCR than the spaceborne SAR image, as some portions of the vessel hulls and edges appeared to have relatively low scattering intensities, deteriorating the image contrast performance to some extent. All the comparative fusion approaches showed an improvement, in terms of the TCR, compared with the processing cases with single-SAR images. When evaluating the TIF performance, only the fuzzy logic and AANN fusion approaches had a positive enhancement of the target regions. The other fusion approaches (i.e., additive fusion, multiplicative fusion, PCA fusion, and DWT fusion) did not enhance the target regions (i.e., having negative TIF values), where multiplicative fusion provided the lowest TIF, despite its high TCR. With regard to the proposed TPPIE fusion method, it attained the highest TCRs and satisfactory TIFs for these three experimental scenes, due to the extraction and enhancement of target regions and the simultaneous suppression of background regions (including sea clutter and inshore interferences). Compared with the TPPIE method, the proposed ITSPM fusion method performed slightly better, in terms of TIF, as pixels with intensity value of 1 constitute the enhanced target regions in the ITSPM, naturally leading to larger values of TIF, which only concern the target enhancement performance. These advantages for TCR and TIF demonstrate the effectiveness of the proposed ITSPM and TPPIE methods, compared with the existing image fusion approaches, as well as the conventional processing cases with single-SAR images.

4.5. Detection Performance Evaluation

This subsection aims to evaluate the target detection performances of the aforementioned approaches. The original SAR images and the fused images were used in the vessel detection task by a superpixel-based CFAR (SP-CFAR) algorithm. Compared with the conventional pixel-level methods, superpixels can help to better retain the potential target regions and reduce the processing complexity in the detection task [42,43]. More details on the implementation of the SP-CFAR algorithm can be found in [43]. Figure 9, Figure 10 and Figure 11 show the superpixel-based detection results of the aforementioned approaches for three experimental scenes, where the PFA was fixed to 0.03, 0.05, and 0.1, respectively. For the pixels belonging to some superpixel, they are represented by the average intensity of all pixels in the superpixel. The pixel intensities higher than the decision threshold are set to one, while the others are set to zero. The number of superpixels is an important parameter for superpixel-based detection, which determines the size of superpixel. It is expected that the superpixel can only contain either vessel targets or background regions. Herein, the number of superpixels was selected such that the size of the superpixel was comparable to the vessel width [25]; that is, approximately 250. Furthermore, the boundaries of the ground truths of vessel targets are plotted as red lines in Figure 9, Figure 10 and Figure 11.
From Figure 9, Figure 10 and Figure 11, it can be seen that the single spaceborne or airborne SAR image processing could identify the target regions in part, but suffered from missed detections and false alarms to different extents. Given an acceptable PFA, it is difficult to achieve satisfactory detection performance by single-SAR image processing; for example, the PD of airborne image processing was as low as 0.0804 for the Scene 1. Similar predicaments also occurred for the existing image fusion approaches, including additive fusion, multiplicative fusion, PCA fusion, DWT fusion, fuzzy logic, and AANN fusion. Some of these fusion approaches (i.e., additive fusion, PCA fusion, and DWT fusion) even exhibited worse PDs than the single-SAR image processing for Scenes 1 and 2. This is mainly related to the poor TCR and TIF performances of their fused images. Compared with the aforementioned image fusion approaches, the proposed TPPIE and ITSPM fusion methods better retained and enhanced the target regions while, at the same time, suppressing sea clutter and inshore interference regions. More specifically, the TPPIE method had higher PD values than the ITSPM method, as the ITSPM method only exploits the TSPM (extracting potential target regions), whereas the TPPIE method considers both the TSPM and the APR feature (thus exploiting dual-polarization information). Therefore, the TPPIE fusion method showed the best target detection performance, with respect to the given FPAs. As can be seen in Figure 9j, Figure 10j and Figure 11j, the PDs of TPPIE fusion were 0.9853, 0.9909, and 0.9796, respectively, significantly outperforming the existing image fusion approaches and the single-SAR image processing cases. It can also be observed that the extracted vessel regions were connected. The main reason might lie in the small spacings between observed vessels, which could be comparable with the inherent spatial resolution determined by SAR sensor performance. This was a common problem for all the aforementioned fusion methods. A dedicated investigation to further separation and extraction of each target vessel could be addressed in future research.
Table 5 summarizes the accuracy performance of the different methods, based on (13), for the three experimental scenes with respect to detection results shown in Figuires Figure 9, Figure 10 and Figure 11. It can be seen that the proposed TPPIE fusion method also attained the best accuracy performance. Concerning the proposed ITSPM method, which combines NG-based TP and edge-based morphological candidate map, it also outperformed the other existing methods and performed only slightly worse than the TPPIE method.
Figure 12, Figure 13 and Figure 14 depict the ROC curves based on the original and fused images shown in Figure 6, Figure 7 and Figure 8, in order to investigate the global detection performance. We can see that some image fusion approaches did not always attain improved detection performance, compared with the single-SAR image processing cases, such as additive fusion, PCA fusion, and DWT fusion, for Scene 1 (see Figure 12). This was because these existing approaches had difficulty in simultaneously attaining the enhancement of target regions (especially for structured and shaped vessels containing only discrete strong scattering points) and the suppression of background regions (including sea clutter and inshore interferences). Considering the proposed TPPIE fusion method, it provided significantly better global detection performance than the single-SAR image processing cases and the other existing image fusion approaches. In comparison with the proposed ITSPM method, this TPPIE method also performed better, due to considering both the TSPM, extracting potential target regions, and the APR feature, exploiting dual-polarization information. In particular, when we pursued a satisfactory PD (e.g., larger than 0.96), the PFAs of the proposed TPPIE and ITSPM fusion methods were far less than those of the other comparative approaches.

5. Conclusions

In this paper, we introduced a new perspective for vessel target detection, through the collaboration of observations from spaceborne and airborne SAR platforms. To make use of their respective strengths, we also proposed a new TPPIE method for fusing the spaceborne–airborne collaborative SAR images. The TPPIE image fusion method mainly exploits target–clutter discrimination and dual-polarization information to improve the TCR of the fused image. In more detail, we first generate a new TSPM by combing the NG-based TP and the edge-based morphological candidate map. This generated TSPM can help to better extract the potential target regions and filter out the background regions, including sea clutter and inshore interferences, compared to the sole use of TP. Next, we exploit the intensity information of dual-polarization SAR images and present a new polarization feature, called the APR. By making use of the polarization characteristic differences of background clutter and vessel targets, this APR feature can further enhance the target regions. Finally, we take the Hadamard product of the intersected TSPM from spaceborne–airborne collaborative observations and the composite map exploiting the APR feature (as well as the original SAR images) to generate the final fused image, having enhanced targets and suppressed backgrounds (or, equivalently, improved TCR performance).
Experimental results using Gaofen-3 satellite and UAV SAR images demonstrated that the proposed TPPIE method has better image fusion qualities, in terms of TCR and TIF, than existing fusion approaches, including arithmetic, PCA, DWT, fuzzy logic, and AANN fusion. Moreover, the proposed TPPIE method presented improved target detection performance (e.g., higher PDs, with respect to fixed acceptable PFAs) and better accuracy performance for three experimental scenes containing inshore interferences and structured targets. ROC analyses also demonstrated the superiority of the proposed TIPPIE method on the global detection performance of vessel targets, compared with existing, commonly used image fusion approaches.

Author Contributions

Conceptualization, D.Z.; methodology, D.Z.; software, D.Z., X.W., and Y.C.; validation, D.Z.; formal analysis, D.Z.; investigation, D.Z. and X.W.; resources, G.L.; data curation, D.Z.; writing—original draft preparation, D.Z.; writing—review and editing, X.W. and Y.C.; visualization, D.Z. and Y.C.; supervision, G.L.; project administration, G.L.; funding acquisition, G.L. All authors have read and agreed to the published version of the manuscript.

Funding

This research was funded in part by the National Natural Science Foundation of China grant numbers 61901244, 61790551, 61925106, 61901242, and 62101303, and in part by the Fundamental Research Funds for the Central Universities (Huazhong University of Science and Technology), the National Postdoctoral Program for Innovative Talents grant number BX20200195, the Shuimu Tsinghua Scholar Program, and the China Postdoctoral Science Foundation grant number 2020M680561.

Data Availability Statement

The data presented in this study are available on request from the corresponding author.

Acknowledgments

The authors would like to thank the editors and anonymous reviewers for their constructive comments and suggestions, which greatly contributed to improving this paper.

Conflicts of Interest

The authors declare no conflict of interest.

References

  1. Rosen, P.A.; Hensley, S.; Wheeler, K.; Sadowy, G.; Miller, T.; Shaffer, S.; Muellerschoen, R.; Jones, C.; Madsen, S.; Zebker, H. UAVSAR: New NASA airborne SAR system for research. IEEE Aerosp. Electron. Syst. Mag. 2007, 22, 21–28. [Google Scholar] [CrossRef]
  2. Solimene, R.; Catapano, I.; Gennarelli, G.; Cuccaro, A.; Dell’Aversano, A.; Soldovieri, F. SAR imaging algorithms and some unconventional applications: A unified mathematical overview. IEEE Signal Process. Mag. 2014, 31, 90–98. [Google Scholar] [CrossRef]
  3. Tan, Z.; Zhang, Z.; Xing, T.; Huang, X.; Gong, J.; Ma, J. Exploit Direction Information for Remote Ship Detection. Remote Sens. 2021, 13, 2155. [Google Scholar] [CrossRef]
  4. Zhang, T.; Jiang, L.; Xiang, D.; Ban, Y.; Pei, L.; Xiong, H. Ship detection from PolSAR imagery using the ambiguity removal polarimetric notch filter. ISPRS J. Photogramm. Remote Sens. 2019, 157, 41–58. [Google Scholar] [CrossRef]
  5. Rodger, M.; Guida, R. Classification-Aided SAR and AIS Data Fusion for Space-Based Maritime Surveillance. Remote Sens. 2021, 13, 104. [Google Scholar] [CrossRef]
  6. Yang, Z.; Li, Z.; Zhu, J.; Wang, Y.; Wu, L. Use of SAR/InSAR in Mining Deformation Monitoring, Parameter Inversion, and Forward Predictions: A Review. IEEE Geosci. Remote Sens. Mag. 2020, 8, 71–90. [Google Scholar] [CrossRef]
  7. Iancu, B.; Soloviev, V.; Zelioli, L.; Lilius, J. ABOships-An Inshore and Offshore Maritime Vessel Detection Dataset with Precise Annotations. Remote Sens. 2021, 13, 988. [Google Scholar] [CrossRef]
  8. Pelich, R.; Longépé, N.; Mercier, G.; Hajduch, G.; Garello, R. Vessel refocusing and velocity estimation on SAR imagery using the fractional Fourier transform. IEEE Trans. Geosci. Remote Sens. 2015, 54, 1670–1684. [Google Scholar] [CrossRef]
  9. Ao, D.; Datcu, M.; Schwarz, G.; Hu, C. Moving ship velocity estimation using TanDEM-X data based on subaperture decomposition. IEEE Geosci. Remote Sens. Lett. 2018, 15, 1560–1564. [Google Scholar] [CrossRef]
  10. Salentinig, A.; Gamba, P. A general framework for urban area extraction exploiting multiresolution SAR data fusion. IEEE J. Sel. Top. Appl. Earth Obs. Remote Sens. 2016, 9, 2009–2018. [Google Scholar] [CrossRef]
  11. Gupta, S.; Singh, D.; Kumar, S. Fusion of texture and wavelet features of PALSAR image using LDA and PCA for land cover classification. Int. J. Image Data Fusion 2017, 8, 354–374. [Google Scholar] [CrossRef]
  12. Wu, T.; Ren, Q.; Chen, X.; Niu, L.; Ruan, X. Highway bridge detection based on PCA fusion in airborne multiband high resolution SAR images. In Proceedings of the 2011 International Symposium on Image and Data Fusion, Tengchong, China, 9–11 August 2011; pp. 1–3. [Google Scholar]
  13. Yue, J.; Yang, R.; Huan, R. Pixel level fusion for multiple SAR images using PCA and wavelet transform. In Proceedings of the 2006 CIE International Conference on Radar, Shanghai, China, 16–19 October 2006; pp. 1–4. [Google Scholar]
  14. Chen, X.; Chen, W. Double-layer fuzzy fusion for multiview through-wall radar images. IEEE Geosci. Remote Sens. Lett. 2015, 12, 2075–2079. [Google Scholar] [CrossRef]
  15. Seng, C.H.; Bouzerdoum, A.; Amin, M.G.; Phung, S.L. Probabilistic fuzzy image fusion approach for radar through wall sensing. IEEE Trans. Image Process. 2013, 22, 4938–4951. [Google Scholar] [CrossRef] [PubMed]
  16. Filippidis, A.; Jain, L.C.; Martin, N. Fuzzy rule based fusion technique to automatically detect aircraft in SAR images. In Proceedings of the 1st International Conference on Conventional and Knowledge Based Intelligent Electronic Systems, Adelaide, SA, Australia, 21–23 May 1997; Volume 2, pp. 435–441. [Google Scholar]
  17. Yang, X.; Wang, J.; Zhu, R. Random walks for synthetic aperture radar image fusion in framelet domain. IEEE Trans. Image Process. 2017, 27, 851–865. [Google Scholar] [CrossRef] [PubMed]
  18. Fasano, L.; Latini, D.; Machidon, A.; Clementini, C.; Schiavon, G.; Del Frate, F. SAR Data Fusion Using Nonlinear Principal Component Analysis. IEEE Geosci. Remote Sens. Lett. 2019, 17, 1543–1547. [Google Scholar] [CrossRef]
  19. Ghasrodashti, E.K.; Karami, A.; Heylen, R.; Scheunders, P. Spatial resolution enhancement of hyperspectral images using spectral unmixing and bayesian sparse representation. Remote Sens. 2017, 9, 541. [Google Scholar] [CrossRef] [Green Version]
  20. Mao, Q.; Peng, J.; Wang, Y. Resolution Enhancement of Remotely Sensed Land Surface Temperature: Current Status and Perspectives. Remote Sens. 2021, 13, 1306. [Google Scholar] [CrossRef]
  21. Zare, M.; Helfroush, M.S.; Kazemi, K.; Scheunders, P. Hyperspectral and Multispectral Image Fusion Using Coupled Non-Negative Tucker Tensor Decomposition. Remote Sens. 2021, 13, 2930. [Google Scholar] [CrossRef]
  22. Ghassemian, H. A review of remote sensing image fusion methods. Inf. Fusion 2016, 32, 75–89. [Google Scholar] [CrossRef]
  23. Shuangao, W.; Padmanaban, R.; Mbanze, A.A.; Silva, J.; Shamsudeen, M.; Cabral, P.; Campos, F.S. Using satellite image fusion to evaluate the impact of land use changes on ecosystem services and their economic values. Remote Sens. 2021, 13, 851. [Google Scholar] [CrossRef]
  24. Yu, Y.; Wang, B.; Zhang, L. Hebbian-based neural networks for bottom-up visual attention and its applications to ship detection in SAR images. Neurocomputing 2011, 74, 2008–2017. [Google Scholar] [CrossRef]
  25. Zhai, L.; Li, Y.; Su, Y. Inshore ship detection via saliency and context information in high-resolution SAR images. IEEE Geosci. Remote Sens. Lett. 2016, 13, 1870–1874. [Google Scholar] [CrossRef]
  26. Wang, S.; Wang, M.; Yang, S.; Jiao, L. New hierarchical saliency filtering for fast ship detection in high-resolution SAR images. IEEE Trans. Geosci. Remote Sens. 2017, 55, 351–362. [Google Scholar] [CrossRef]
  27. Li, T.; Liu, Z.; Xie, R.; Ran, L. An improved superpixel-level CFAR detection method for ship targets in high-resolution SAR images. IEEE J. Sel. Top. Appl. Earth Obs. Remote Sens. 2018, 11, 184–194. [Google Scholar] [CrossRef]
  28. An, Q.; Pan, Z.; Liu, L.; You, H. DRBox-v2: An improved detector with rotatable boxes for target detection in SAR images. IEEE Trans. Geosci. Remote Sens. 2019, 57, 8333–8349. [Google Scholar] [CrossRef]
  29. Liu, Y.; Zhang, M.; Xu, P.; Guo, Z. SAR ship detection using sea-land segmentation-based convolutional neural network. In Proceedings of the 2017 International Workshop on Remote Sensing with Intelligent Processing (RSIP), Shanghai, China, 18–21 May 2017; pp. 1–4. [Google Scholar]
  30. Liu, N.; Cao, Z.; Cui, Z.; Pi, Y.; Dang, S. Multi-scale proposal generation for ship detection in SAR images. Remote Sens. 2019, 11, 526. [Google Scholar] [CrossRef] [Green Version]
  31. Dai, H.; Du, L.; Wang, Y.; Wang, Z. A modified CFAR algorithm based on object proposals for ship target detection in SAR images. IEEE Geosci. Remote Sens. Lett. 2016, 13, 1925–1929. [Google Scholar] [CrossRef]
  32. Cheng, M.M.; Zhang, Z.; Lin, W.Y.; Torr, P. BING: Binarized normed gradients for objectness estimation at 300fps. In Proceedings of the IEEE Conference on Computer Vision and Pattern Recognition, Columbus, OH, USA, 23–28 June 2014; pp. 3286–3293. [Google Scholar]
  33. Seng, C.H.; Bouzerdoum, A.; Amin, M.G.; Phung, S.L. Two-stage fuzzy fusion with applications to through-the-wall radar imaging. IEEE Geosci. Remote Sens. Lett. 2013, 10, 687–691. [Google Scholar] [CrossRef]
  34. Zhang, T.; Yang, Z.; Xiong, H. PolSAR Ship Detection Based on the Polarimetric Covariance Difference Matrix. IEEE J. Sel. Top. Appl. Earth Obs. Remote Sens. 2017, 10, 3348–3359. [Google Scholar] [CrossRef]
  35. Liu, T.; Yang, Z.; Marino, A.; Gao, G.; Yang, J. PolSAR Ship Detection Based on Neighborhood Polarimetric Covariance Matrix. IEEE Trans. Geosci. Remote Sens. 2021, 59, 4874–4887. [Google Scholar] [CrossRef]
  36. Hong, Y.; Leng, C.; Zhang, X.; Pei, Z.; Cheng, I.; Basu, A. HOLBP: Remote Sensing Image Registration Based on Histogram of Oriented Local Binary Pattern Descriptor. Remote Sens. 2021, 13, 2328. [Google Scholar] [CrossRef]
  37. Cao, S.Y.; Shen, H.L.; Chen, S.J.; Li, C. Boosting Structure Consistency for Multispectral and Multimodal Image Registration. IEEE Trans. Image Process. 2020, 29, 5147–5162. [Google Scholar] [CrossRef]
  38. Zimmer, V.A.; Ballester, M.Á.G.; Piella, G. Multimodal image registration using Laplacian commutators. Inf. Fusion 2019, 49, 130–145. [Google Scholar] [CrossRef]
  39. Li, Z.; Zhang, H.; Huang, Y. A Rotation-Invariant Optical and SAR Image Registration Algorithm Based on Deep and Gaussian Features. Remote Sens. 2021, 13, 2628. [Google Scholar] [CrossRef]
  40. Reigber, A.; Scheiber, R.; Jager, M.; Prats-Iraola, P.; Hajnsek, I.; Jagdhuber, T.; Papathanassiou, K.P.; Nannini, M.; Aguilera, E.; Baumgartner, S.; et al. Very-high-resolution airborne synthetic aperture radar imaging: Signal processing and applications. Proc. IEEE 2013, 101, 759–783. [Google Scholar] [CrossRef] [Green Version]
  41. Dodgson, N.A. Quadratic interpolation for image resampling. IEEE Trans. Image Process. 1997, 6, 1322–1326. [Google Scholar] [CrossRef] [PubMed]
  42. Wang, X.; Li, G.; Zhang, X.P.; He, Y. Ship Detection in SAR Images via Local Contrast of Fisher Vectors. IEEE Trans. Geosci. Remote Sens. 2020, 58, 6467–6479. [Google Scholar] [CrossRef]
  43. Yu, W.; Wang, Y.; Liu, H.; He, J. Superpixel-based CFAR target detection for high-resolution SAR images. IEEE Geosci. Remote Sens. Lett. 2016, 13, 730–734. [Google Scholar] [CrossRef]
Figure 1. Process of spaceborne–airborne collaborative SAR observation and the associated vessel target detection task. In more detail, the spaceborne platform achieves the global large area observation and the airborne platform achieves the local focused observation. For the local area of interest, the collaborative spaceborne SAR image I s and airborne SAR image I a are fused in a certain manner. Then, the fused image is used for thresholding and vessel target detection.
Remotesensing 13 03957 g001
Figure 2. Flowchart of the proposed TPPIE image fusion method.
Remotesensing 13 03957 g002
Figure 3. Experimental data acquired from the spaceborne–airborne SAR collaboration system. Subgraphs (ac) are the spaceborne SAR images, subgraphs (di) are the dual-polarization airborne SAR images, and subgraphs (jl) are the corresponding ground truths. Three scenes are considered in our experiments, which correspond to the three rows; that is, (a,d,g,j), (b,e,h,k), and (c,f,i,l), respectively.
Remotesensing 13 03957 g003
Figure 4. Illustrative example of TSPM generation: (a) Proposal matrix P s extracted from the spaceborne SAR image I s ; (b) Proposal matrix P a extracted from the airborne SAR image I a ; (c) TSPM T s with respect to I s ; (d) TSPM T a with respect to I a ; and (e) Intersected TSPM T f . The ground truth boundaries of vessel targets are also plotted as red lines. By using the intersected TSPM T f , we can significantly reduce the false alarms induced by the inshore interferences and sea clutter, while retaining the potential target regions in I s and I a .
Remotesensing 13 03957 g004
Figure 5. Illustrative example of APR feature exploitation: (a) Airborne SAR image with horizontal polarization, denoted as I a H H ; (b) Airborne SAR image with vertical polarization, denoted as I a V V ; (c) PR map with respect to I a H H and I a V V ; (d) APR map with respect to I a H H and I a V V ; and (e) Composite map exploiting the APR feature, as well as the original SAR images. This composite map achieves high contrast between vessel targets and sea clutter, thus improving the TCR performance.
Remotesensing 13 03957 g005
Figure 6. Experimental results for scene 1: (a) Spaceborne image; (b) airborne image; (c) additive fusion [10]; (d) multiplicative fusion [10]; (e) PCA fusion [12]; (f) DWT fusion [13]; (g) fuzzy fusion [16]; (h) AANN fusion [18]; (i) proposed ITSPM fusion; and (j) proposed TPPIE fusion. The proposed methods can achieve better fused images with enhanced target regions and suppressed background regions, compared to the other image fusion approaches.
Remotesensing 13 03957 g006
Figure 7. Experimental results for scene 2: (a) Spaceborne image; (b) airborne image; (c) additive fusion [10]; (d) multiplicative fusion [10]; (e) PCA fusion [12]; (f) DWT fusion [13]; (g) fuzzy fusion [16]; (h) AANN fusion [18]; (i) proposed ITSPM fusion; and (j) proposed TPPIE fusion. The proposed methods can achieve better fused images with enhanced target regions and suppressed background regions, compared to the other image fusion approaches.
Remotesensing 13 03957 g007
Figure 8. Experimental results for scene 3: (a) Spaceborne image; (b) airborne image; (c) additive fusion [10]; (d) multiplicative fusion [10]; (e) PCA fusion [12]; (f) DWT fusion [13]; (g) fuzzy fusion [16]; (h) AANN fusion [18]; (i) proposed ITSPM fusion; and (j) proposed TPPIE fusion. The proposed methods can achieve better fused images with enhanced target regions and suppressed background regions, compared to the other image fusion approaches.
Remotesensing 13 03957 g008
Figure 9. Superpixel-based detection results of different methods for Experimental Scene 1 with respect to PFA = 0.03 : (a) Spaceborne image processing ( PD = 0.0804 ); (b) airborne image processing ( PD = 0.4549 ); (c) additive fusion [10] ( PD = 0.4191 ); (d) multiplicative fusion [10] ( PD = 0.5464 ); (e) PCA fusion [12] ( PD = 0.5356 ); (f) DWT fusion [13] ( PD = 0.3249 ); (g) fuzzy fusion [16] ( PD = 0.4314 ); (h) AANN fusion [18] ( PD = 0.4704 ); (i) proposed ITSPM fusion ( PD = 0.8956 ); and (j) proposed TPPIE fusion (PD = 0.9853). The red lines denote the boundaries of target vessels. The proposed TPPIE fusion method had the best detection performance.
Remotesensing 13 03957 g009
Figure 10. Superpixel-based detection results of different methods for Experimental Scene 2 with respect to PFA = 0.05 : (a) Spaceborne image processing ( PD = 0.2009 ); (b) airborne image processing ( PD = 0.3922 ); (c) additive fusion [10] ( PD = 0.3181 ); (d) multiplicative fusion [10] ( PD = 0.6167 ); (e) PCA fusion [12] ( PD = 0.3478 ); (f) DWT fusion [13] ( PD = 0.2762 ); (g) fuzzy fusion [16] ( PD = 0.3261 ); (h) AANN fusion [18] ( PD = 0.4741 ); (i) proposed ITSPM fusion ( PD = 0.9492 ); and (j) proposed TPPIE fusion (PD = 0.9909). The red lines denote the boundaries of target vessels. The proposed TPPIE fusion method had the best detection performance.
Remotesensing 13 03957 g010
Figure 11. Superpixel-based detection results of different methods for Experimental Scene 3 with respect to PFA = 0.1 : (a) Spaceborne image processing ( PD = 0.6133 ); (b) airborne image processing ( PD = 0.3960 ); (c) additive fusion [10] ( PD = 0.7253 ); (d) multiplicative fusion [10] ( PD = 0.6850 ); (e) PCA fusion [12] ( PD = 0.7420 ); (f) DWT fusion [13] ( PD = 0.7243 ); (g) fuzzy fusion [16] ( PD = 0.7528 ); (h) AANN fusion [18] ( PD = 0.7305 ); (i) proposed ITSPM fusion ( PD = 0.8998 ); and (j) proposed TPPIE fusion (PD = 0.9796). The red lines denote the boundaries of target vessels. The proposed TPPIE fusion method had the best detection performance.
Remotesensing 13 03957 g011
Figure 12. ROC curves of different methods for Experimental Scene 1. When pursuing a relatively high PD (e.g., larger than 0.98), the PFAs of the proposed ITSPM and TPPIE fusion methods were far less than those of the other methods, including spaceborne image processing, airborne image processing, additive fusion [10], multiplicative fusion [10], PCA fusion [12], DWT fusion [13], fuzzy fusion, and AANN fusion [18].
Remotesensing 13 03957 g012
Figure 13. ROC curves of different methods for Experimental Scene 2. When pursuing a relatively high PD (e.g., larger than 0.98), the PFAs of the proposed ITSPM and TPPIE fusion methods were far less than those of the other methods, including spaceborne image processing, airborne image processing, additive fusion [10], multiplicative fusion [10], PCA fusion [12], DWT fusion [13], fuzzy fusion, and AANN fusion [18].
Remotesensing 13 03957 g013
Figure 14. ROC curves of different methods for Experimental Scene 3. When pursuing a relatively high PD (e.g., larger than 0.96), the PFAs of the proposed ITSPM and TPPIE fusion methods were far less than those of the other methods, including spaceborne image processing, airborne image processing, additive fusion [10], multiplicative fusion [10], PCA fusion [12], DWT fusion [13], fuzzy fusion, and AANN fusion [18].
Remotesensing 13 03957 g014
Table 1. Specifications of spaceborne and airborne SAR images.
Experimental SceneFigure 3a–cFigure 3d–i
PlatformGaofen-3 (Spaceborne platform)UAV (Airborne platform)
Frequency bandCKu
Center frequency 5.4 GHz 14.5 GHz
PolarizationHHHH, VV
Incidence angle 30 . 32 ° 31 . 23 ° 25 °
Center look angle 27 . 17 ° 25 °
Imaging modeSpotlightStrip map
Resolution 1 × 1 m 2 0.3 × 0.15 m 2
Center imaging time27 September 2019 06:01:0327 September 2019 06:02:56
Observed areaShanghai portShanghai port
Image sizeScene 1, Figure 3a: 282 × 365 Scene 1, Figure 3d,g: 1105 × 2243
Scene 2, Figure 3b: 245 × 325 Scene 2, Figure 3e,h: 965 × 2200
Scene 3, Figure 3c: 288 × 404 Scene 3, Figure 3f,i: 1132 × 2580
Table 2. TCR and TIF (in dBs) Comparisons for Experimental Scene 1. The proposed TPPIE method attained the highest TCR, and the proposed ITSPM method attained the highest TIF.
Experimental Scene 1TCR [dBs]TIF [dBs]
Spaceborne image only 3.99
Airborne image only 7.96
Additive fusion [10] 6.75 0.21
Multiplicative fusion [10] 11.23 5.86
PCA fusion [12] 7.19 0.08
DWT fusion [13] 5.96 1.17
Fuzzy fusion [16] 8.42 1.42
AANN fusion [18] 7.20 0.19
Proposed ITSPM 12.11 7.51
Proposed TPPIE13.73 5.99
Table 3. TCR and TIF (in dBs) comparisons for Experimental Scene 2. The proposed TPPIE method attained the highest TCR and the proposed ITSPM method attained the highest TIF.
Experimental Scene 2TCR [dBs]TIF [dBs]
Spaceborne image only 3.32
Airborne image only 6.86
Additive fusion [10] 5.22 0.03
Multiplicative fusion [10] 8.42 6.93
PCA fusion [12] 5.77 0.13
DWT fusion [13] 4.68 1.40
Fuzzy fusion [16] 6.60 0.68
AANN fusion [18] 5.30 1.05
Proposed ITSPM 11.29 7.95
Proposed TPPIE12.02 6.22
Table 4. TCR and TIF (in dBs) comparisons for Experimental Scene 3. The proposed TPPIE method attained the highest TCR and the proposed ITSPM method attained the highest TIF.
Experimental Scene 3TCR [dBs]TIF [dBs]
Spaceborne image only 6.01
Airborne image only 4.54
Additive fusion [10] 6.35 0.67
Multiplicative fusion [10] 9.05 6.89
PCA fusion [12] 6.23 0.20
DWT fusion [13] 6.24 1.71
Fuzzy fusion [16] 8.17 1.72
AANN fusion [18] 6.26 0.15
Proposed ITSPM 8.84 6.25
Proposed TPPIE9.45 4.86
Table 5. Accuracy comparison for three experimental scenes, with respect to the detection results shown in Figure 9, Figure 10 and Figure 11. The proposed TPPIE method attained the best accuracy performance.
Scene 1Scene 2Scene 3
Spaceborne image only 0.9127 0.8811 0.8617
Airborne image only 0.9396 0.9025 0.8301
Additive fusion [10] 0.9346 0.8934 0.8787
Multiplicative fusion [10] 0.9403 0.9191 0.8726
PCA fusion [12] 0.9418 0.8940 0.8792
DWT fusion [13] 0.9283 0.8889 0.8777
Fuzzy fusion [16] 0.9375 0.8940 0.8826
AANN fusion [18] 0.9423 0.9065 0.8768
Proposed ITSPM 0.9659 0.9503 0.8989
Proposed TPPIE0.97190.95330.9089
Publisher’s Note: MDPI stays neutral with regard to jurisdictional claims in published maps and institutional affiliations.

