Article

Ir-UNet: Irregular Segmentation U-Shape Network for Wheat Yellow Rust Detection by UAV Multispectral Imagery

1
School of Automation and Electrical Engineering, University of Science and Technology Beijing, Beijing 100083, China
2
Shunde Graduate School, University of Science and Technology Beijing, Foshan 528000, China
3
School of Computer Science and Electronic Engineering, University of Essex, Colchester CO4 3SQ, UK
4
Department of Aeronautical and Automotive Engineering, Loughborough University, Loughborough LE11 3TU, UK
*
Author to whom correspondence should be addressed.
Remote Sens. 2021, 13(19), 3892; https://doi.org/10.3390/rs13193892
Submission received: 18 August 2021 / Revised: 21 September 2021 / Accepted: 23 September 2021 / Published: 28 September 2021
(This article belongs to the Special Issue Proximal and Remote Sensing for Precision Crop Management)

Abstract

:
Crop disease is widely considered as one of the most pressing challenges for food crops, and therefore an accurate crop disease detection algorithm is highly desirable for its sustainable management. The recent use of remote sensing and deep learning is drawing increasing research interests in wheat yellow rust disease detection. However, current solutions on yellow rust detection are generally addressed by RGB images and the basic semantic segmentation algorithms (e.g., UNet), which do not consider the irregular and blurred boundary problems of yellow rust area therein, restricting the disease segmentation performance. Therefore, this work aims to develop an automatic yellow rust disease detection algorithm to cope with these boundary problems. An improved algorithm entitled Ir-UNet by embedding irregular encoder module (IEM), irregular decoder module (IDM) and content-aware channel re-weight module (CCRM) is proposed and compared against the basic UNet while with various input features. The recently collected dataset by DJI M100 UAV equipped with RedEdge multispectral camera is used to evaluate the algorithm performance. Comparative results show that the Ir-UNet with five raw bands outperforms the basic UNet, achieving the highest overall accuracy (OA) score (97.13%) among various inputs. Moreover, the use of three selected bands, Red-NIR-RE, in the proposed Ir-UNet can obtain a comparable result (OA: 96.83%) while with fewer spectral bands and less computation load. It is anticipated that this study by seamlessly integrating the Ir-UNet network and UAV multispectral images can pave the way for automated yellow rust detection at farmland scales.

1. Introduction

Crop diseases are widely considered as one of the most pressing challenges for food crops, seriously threatening crop quality and safety because a safe food supply begins with protecting crops from diseases and toxins. It is acknowledged that the crop diseases account for 20–40% yield loss globally each year, resulting in significant economic losses [1]. The conventional crop disease control method is mainly calendar-based pesticide application regardless of the current disease development and risks. However, this method not only leads to a high cost but also generates adverse environmental impact. Therefore, it is paramount to use a decision-based disease control method to improve the detection accuracy for crop disease control and management.
Wheat is one main crop in the world (particularly in north China), providing 20% of protein and food calories for 4.5 billion people [2]. However, wheat production is facing serious problems, such as abiotic stresses, pathogens and pests, inducing a severe yield loss. In particular, yellow rust disease is one of the main challenges, which is caused by Puccinia striiformis f. sp. tritici (Pst) [3,4]. This kind of disease spreads very quickly under a temperature of 5–24 °C and significantly affects wheat production. It is reported that near 5.5 million tons per year wheat yield loss is mainly caused by yellow rust disease [5]. To this end, a reliable and robust method for yellow rust detection is highly desirable for disease management, which is beneficial for sustainable crop production and food safety.
It is necessary that the detection method is rapid, specific to a particular disease and sensitive enough for early disease symptom. Visual perception is capable of interpreting the environment through image analysis of light reflected by objects and now finds a great number of applications including crop disease detection [6,7]. Various platforms are available to collect sensing data, such as satellite/manned-aircraft based and Unmanned Aerial Vehicles (UAV) based ones [8,9]. However, crop disease detection by satellite data is sometimes restricted by its poor spatial and temporal resolutions in farm-scale applications. On the contrary, UAV sensing technology is now receiving an ever-increasing research interest for farm-scale data acquisition because of its attractive features, such as a relatively affordable cost, a high spatial and user-defined temporal resolution, and a good flexibility [10,11,12], presenting a high-efficiency approach on crop remote sensing data collection. There are a lot of studies on using UAV platform with different sensors for rust disease sensing, for example, Liu used RGB camera at an altitude of 100 m to monitor stripe rust disease and concluded that Red band is the most informative one among three visible bands [13]. UAV with five-band multispectral camera is adopted in yellow rust detection, showing that RedEdge and near infrared (NIR) band can bring extra information on yellow rust detection and achieve a relatively high accuracy [2].
In addition to sensing platforms and sensors, the selection of algorithms also significantly affects yellow rust detection performance. Different from image level classification method, semantic segmentation aims to discriminate each class at a pixel level, increasing the classification performance. Recently, the challenging crop disease detection problem is formulated as a semantic segmentation task, and Convolutional Neural Network (CNN) method is adopted because of its fine properties in automatically extracting spectral-spatial features [14,15]. Many prior studies innovate the CNN architecture in the disease detection. For example, Jin proposed a two-dimensional CNN model to classify the healthy and diseased wheat in a rapid and non-destructive manner [16]. Zhang proposed a novel Deep CNN based approach for an automatic crop disease detection by using UAV hyperspectral images with a very high spatial resolution [17]. A 3D-CNN is also developed in [18] for soybean charcoal rot disease identification by using hyperspectral images with 240 different wavelengths and achieves a classification accuracy of 95.73%.
However, there are still some particular problems not being considered but generally occurring in yellow rust disease detection, where the final segmentation performance can be improved once being addressed. In practical scenarios, the shape of the yellow rust disease infected area is irregular where the middle infected area is more serious and the situation near boundary gradually decreases, bringing irregular boundary problem. In addition, due to the sensor restrictions, some noise sometimes is brought to collected images, resulting in blurred boundary problems of yellow rust area. There are some designs to improve the segmentation performance dealing with the boundary problem. For example, Yang proposed edge-aware network for the extraction of buildings and demonstrated the effectiveness on Wuhan University (WHU) building benchmark [19]. Xu combined a high-resolution network with the boundary-aware loss to gradually rebuild the boundary details, achieving the state-of-the-art performance on the Potsdam and Vaihingen datasets [20]. Dai and Zhu made improvements on the convolution by introducing learnable offsets in deformable convolutional network, enabling the network to deal with irregular objects and further indirectly improving the segmentation performance [21,22]. Wang innovated a new upsampling method called content-aware reassembly of features module to upsample the feature maps using learnable parameters, which introduced global guidance of contextual information and further sharpened the boundaries [23].
Although the aforementioned literature demonstrated useful designs to extract sharp boundary in urban landscape segmentation problems, very little work has been considered in crop disease detection applications. As a consequence, an Irregular Segmentation U-Shape Network (Ir-UNet) is proposed to deal with irregular and blurred boundary problems for yellow rust disease detection, which can further improve rust segmentation performance. In this work, the irregular encoder module (IEM) is applied and fused in UNet to handle irregular boundary because it can adaptively adjust the weight of the convolution kernel for different directions according to the shape of segmented objects, meaning that such a convolution kernel can adapt well for irregular objects. Secondly, the irregular decoder module (IDM) is utilized in UNet as this method can adopt different sampling strategies for different regions according to the semantic information of the feature map, so that it can pay more attention to the global information and solve blurred boundary problem. Finally, the content-aware channel re-weight module (CCRM) is introduced in the basic UNet to optimize the feature weight, maximizing the final segmentation performance based on Ir-UNet. Therefore, this work aims to develop an automatic yellow rust detection method by integrating UAV multispectral imagery and Ir-UNet algorithms. The proposed algorithm is validated by real-life field experiments with promising results, where aerial images are collected on a field infected with wheat yellow rust disease. To be more clear, the main contributions are summarized as follows:
(1)
An automatic yellow rust disease detection framework is proposed to integrate UAV multispectral imagery and Ir-UNet deep learning architecture;
(2)
The Ir-UNet architecture is proposed by integrating IEM and IDM to cope with irregular and blurred boundary problems in yellow rust disease detection;
(3)
The CCRM is proposed to re-allocate the weight of each feature to maximize the Ir-UNet segmentation performance;
(4)
Field experiments are to validate the proposed algorithm against different existing algorithms and results.
The remainder of this paper is organized as follows: Section 2 introduces related experiment design including field experiment and UAV system design; Section 3 details the Ir-UNet network design; Section 4 demonstrates the comparative results of different algorithms and inputs; Section 5 presents a discussion; finally, conclusion and future work are presented in Section 6.

2. Field Experiment

In this section, experiment materials regarding this study are introduced, which include experiment design, UAV multispectral imaging system, data pre-processing and labelling (see Figure 1).

2.1. Experiment Design

Experiments were carried out in Caoxinzhuang experiment field (latitude: 34° 306 N, longitude: 108° 090 E, 499 m a.s.l.) of Northwest A&F University, Yangling, Shanxi Province, China. Some background details such as geographic location, soil property and climate are referenced in [2]. Xiaoyan 22 is a cultivar developed by Northwest A&F university, which is vulnerable/susceptible to yellow rust disease. It is therefore chosen for this study so that the wheat is able to be infected by yellow rust disease for the purpose of UAV remote monitoring. This experiment started from 2019 and wheat seeds were sown with a row spacing of 16 cm and at a rate of 30 g seeds/m2. To inoculate yellow rust inoculum in the selected wheat fields, the mixed Pst races (CYR 29/30/31/32/33) were adopted to wheat seedlings in March/2019 by following the approach in [13]. It can be found in Figure 2 that each plot is designed as 2 m × 2 m and three replicates (region A, B, C) with level 0–5 yellow rust inoculum being achieved after randomly inoculating with six levels of yellow rust inoculum: 0 g (healthy wheat), 0.15 g, 0.30 g, 0.45 g, 0.6 g and 0.75 g respectively. Finally, these 18 plots are separated from each other ensuring the minimisation of disease cross-infection.

2.2. UAV Multispectral Imaging System

In this study, a five-band multispectral camera named RedEdge (MicaSense Company, Seattle, WA, USA) is equipped on DJI M100 Quadcopter (DJI Company, Shenzhen, China) for wheat yellow rust disease sensing (see Figure 3). RedEdge camera owns extra RedEdge and NIR bands in comparison with conventional RGB camera so that it is more robust against illumination variations in crop disease detection task (see detailed spectral information in Table 1). When the rust disease is visible, the extra RedEdge and NIR bands are more accurate and reliable to show the differences between healthy and rust pixels compared with the RGB bands. The specifications of this UAV such as weight, dimensions and image size are referenced in [11].
The aim of this section is to design UAV survey system so that Pix4DMapper can go through the follow-up image processing. The framework of this UAV multispectral imaging system can be found in Figure 4, including UAV hardware settings, pre-settings and field sensing. First, RedEdge camera equipped with GPS module can obtain five raw band information simultaneously. Second, Pix4DCapture planning software (Polygon for 2D maps) is installed on a smartphone enabling to plan, monitor and control the UAV. The UAV forward speed is set to be 1 m/s and camera triggering is designed to ensure the overlap and sidelap are up to 75%, leading to an accurate orthomosaic after image pre-processing. In addition, before the flight, calibration panel is adopted to calibrate the camera to guarantee reflectance data can be obtained even under environmental variations. Finally, the selected farmland field can be surveyed by this UAV and the output imagery can be put into Pix4DMapper for the follow-up image processing.
Key developmental (management) stages of wheat include tillering stage, green-up stage, jointing stage, anthesis stage and grain filling stage [8]. It is noted that data in early April are not presented as yellow rust symptom is not visible after inoculation and no big differences can be observed from UAV image. Visible yellow rust symptoms on wheat leaf can be observed approximately 25 days after inoculation. As a result, data collection was conducted on 2 May 2019 as the yellow rust symptoms were visible and the wheat was in jointing stage. In practical scenarios, the most influential parameter affecting image quality is altitude. This is because it determines the pixel size on the registered images, flight duration and cover area. Very low-altitude UAV flight generates images with a very high spatial resolution; however, this results in limited area coverage and a safety problem. Very high altitude UAV flight reduces the spatial resolution and is likely to lose important information [24,25]. Therefore, these images were captured at an altitude of about 20 m to enable the ground resolution is about 1.3 cm/pixel, providing appropriate spatial information for yellow rust disease detection. Moreover, a RedEdge camera was fixed on a gimbal to attenuate the adverse effects of wind, so that high-quality images can be captured during the survey. An image of a reflectance calibration panel was taken (at about 1 m height) before and after each flight and used in the process of image calibration to account for the side effects of environmental variations.

2.3. Data Pre-Processing and Labelling

After collecting raw images, some steps need to be accomplished for pre-processing. These steps can be performed offline to generate calibrated and georeferenced reflectance data for each spectral band. Structure-from-motion (SfM) combined with multi-view-stereo (MVS) algorithms in Pix4Dmapper software can increase point cloud densities which is based on the same photogrammetric principles of image bundle adjustment and the 3D localization of the single pixels. In this study, commercial Pix4Dmapper software of version 4.3.33 was utilised for follow-up pre-processing, including initial processing (e.g., keypoint computation for image matching), orthomosaic generation and reflectance calibration for each band [26]. After that, the output image can be in the format of GeoTIFF covering the whole survey area, where the whole image can be cropped into several tailored regions for the follow-up analysis.
The problem of detecting and quantifying wheat yellow rust disease can be treated as a semantic segmentation task. According to the required task, there are totally three classes to be discriminated, including healthy wheat (Healthy), rust lesions (Rust) and field background (Background). It is acknowledged that segmentation performance relies on labelled data and segmentation algorithm; therefore, the overall labelling processing shown in the Algorithm 1 of Reference [2] is used to label these classes accurately and effectively in pixel-level. The rust regions (polygons) are first labelled on the false-colour RGB orthomasic image by simultaneously observing the high-resolution RGB images collected by Parrot Anafi Drone at a height of 1 m above wheat canopy and the false-color RGB orthomasaic image. Then the wheat pixels are segmented from the background pixels by using the OSAVI spectral vegetation index. As a result, the wheat pixels with yellow rust infection, the healthy wheat pixels and the background pixels can be labelled accordingly. Matlab 2019b was also used in data labelling and the labelled results can be found in Figure 5. To avoid the misunderstanding of the main contributions in this paper, the details of multispectral image labelling can be referenced in [2].

3. Methodology

In this section, the methodology to design an automatic wheat yellow rust detection system is introduced. The basic UNet [27] is firstly presented, and on its basis, IEM and IDM are then proposed for our wheat dataset to deal with irregular and blurred boundary problems of rust region. In addition, to evaluate the contribution of different spectral bands of the RedEdge camera, a CCRM is also designed to adjust the weight of each feature automatically in the proposed method. The framework of the automatic wheat yellow rust detection system is displayed in Figure 6.

3.1. Basic Unet Network

The UNet based models are widely used in remote sensing imagery analysis since it introduces the most important design called skip connection in the FCN style CNN architecture [28,29]. It can be seen from Figure 7 that the skip connection creates a bridge between encoder and decoder, which is capable of rebuilding the spatial information from the shadow layers. In addition, the encoder adopts convolution and max pooling layer to decrease the resolution and extract high-level semantic information, which could be used for an accurate segmentation. The decoder upsamples the semantic features with deconvolution and fuses the features from skip connection to restore high resolution information step by step. The final output called segmentation map represents the classification probability of each pixel in the corresponding position of the input images. Detailed information of the features is displayed in Figure 7. The number on the top represents dimension (channel), the number below means the size (height and width) and the number behind the convolution layer denotes the kernel size (e.g., 3 × 3). In particular, three modules are designed (e.g., IEM, IDM and CCRM) at first attempt on the basis of UNet to cope with irregular and blurred boundary problems of different classes and feature weight allocation problem (see the dotted box in Figure 7) for achieving state-of-the-art segmentation performance.

3.2. Proposed Ir-Unet Network

3.2.1. Irregular Encoder Module (IEM)

IEM is particularly designed to get the feature of irregular object, since it adds learnable position information to the basic convolution. By learning the irregular boundary of the rust wheat, the improved IEM can automatically adapt the weight of neighbourhood pixels to achieve a more accurate segmentation result. Detailed architecture is displayed in Figure 8, where the input is compressed by a 3 × 3 convolution, then the multi branches architecture with different offsets size is particularly designed to obtain multi-scale information. Offset field represents the learned position information being added to the original convolution. It can also be explained by the following formula:
y ( p 0 ) = p n R w ( p n ) · x ( p 0 + p n + Δ p n )
where R denotes the element set of a conv kernel (usually being set as 3 × 3), p n enumerates the locations in R. To obtain the output value of position p 0 , we need to multiply the positions’ value x ( p 0 + p n ) (n { 1 , 9 } ) with the corresponding weight w ( p n ) and make an addition of the results. Meanwhile, to obtain the irregular boundary, a learnable parameter Δ p n is added to the position p n to represent the offsets of the irregular boundary. By adding this learnable parameter, the rectangular conv can be expanded to random shapes.

3.2.2. Irregular Decoder Module (IDM)

For a segmentation task, the encoder-decoder architecture is widely used to get the feature representations via convolutions in the encoder and reconstruct the segmentation results by upsampling modules in the decoder. IDM is applied as an upsampling module in the decoder to replace the original one in UNet to achieve better segmentation results. To be specific, UNet adopts deconvolution to upsample the features, containing trainable parameters to tune the boundary [30,31]. The other commonly used method is bilinear interpolation without parameters but being resource efficient [32]. However, the aforementioned methods are not suitable to cope with the task in this study [23]. First, the deconvolution learns the same upsample strategy for the features because of the shared parameters of convolution kernel, which ignores the specificity of different regions. Second, the bilinear interpolation is weak at dealing with complex structures since there are no parameter settings.
Different from the above mentioned methods, IDM enables instance-specific content-aware handling to generate adaptive kernels on-the-fly, which is lightweight and fast to compute. There are two steps being applied in Figure 9, the first step generates a reassembly kernel for each target location according to its content, and the second step is to reassemble the features with predicted kernels. The parameters of the IDM are shown in Equation (2) with the original deconvolution in Equation (3).
P a r a m s ( I D M ) = C × C m + C m × σ 2 × k u p 2 × k e n c 2
P a r a m s ( d e c o n v ) = C × C × k d e c o n v 2
It can be seen from the parameter calculation formula of IDM that Equation (2) means the sum of parameters of conv 1 × 1 and 3 × 3. C m , σ , k u p 2 and k e n c 2 represent the compressed channel, up ratio, kernel size of the conv 3 × 3, size of the generated kernel, respectively. These parameters are set as 16, 2, 5, 3 for a trade-off between the computational efficiency and accuracy according to our experience. As a result, the total parameters of IDM are counted as 16,448, and the parameters of deconvolution are 65,536. In addition, a 1 × 1 convolution behind IDM with additional 8192 parameters can be added to make the operation smooth. Therefore, only 1/3 of the parameters of the traditional deconvolution are utilised but it achieves a better performance. The introduction of IDM helps rebuild the blurred boundary.

3.2.3. Content-Aware Channel Re-Weight Module (CCRM)

Multispectral images are widely used for segmentation because of the sufficient spectral information, which is useful to distinguish similar classes. However, conventional feature weight selection methods are set equally, impairing the final segmentation performance. As a consequence, it is necessary to re-allocate the weight by different values and thus feature re-weight is one promising way to optimise weight settings and maximise the final segmentation performance [33,34]. Inspired by Hu’s work [33], CCRM is designed where the detailed architecture is shown in Figure 10. The bottleneck design is firstly utilised to get the feature, which is followed by an global pooling to obtain global representation of the channels. Then, a sigmoid function is adopted to normalise the results and get the weights of each channel. Finally, the multispectral inputs multiplying the weights can get the re-weighted inputs. By applying the end-to-end CCRM, a better performance can be achieved attributing to the more efficient spectral combinations.

3.3. Performance Metrics

In this paper, different metrics including P r e c i s i o n , R e c a l l , F 1 score and Overall Accuracy ( O A ) are utilised to quantitatively evaluate the performance of various approaches, where are defined as follows [20]:
O A = T P + T N P + N , P r e c i s i o n = T P T P + F P , R e c a l l = T P T P + F N
F 1 = 2 × P r e c i s i o n × R e c a l l P r e c i s i o n + R e c a l l .
where P, N, T and F are the abbreviations of positive, negative, true, and false pixels in the prediction map, respectively. Particularly, True Positive ( T P ) denotes the correctly predicted positive values; False Positive ( F P ) is the value where actual class is negative and the predicted class is positive; False Negative ( F N ) means the scenario where the actual class is positive but the predicted class is negative; True negative ( T N ) is the truly predicted negative values. Overall Accuracy ( O A ) is the mainly reference metric in our experiments; metrics of P r e c i s i o n , R e c a l l and F 1 are counted in the average among the three classes.

3.4. Ir-Unet Algorithm Settings

The image size is 1336 × 2991, which is divided into training set (1000 × 2991), validation set (336 × 1495) and testing set (336 × 1496) in Figure 11. The dataset division obeys the commonly used ratio of training:validation:testing being 3:1:1. These images are cut to patches with a size of 256 × 256 because of the memory limitation. To avoid the incompleteness of the patches’ boundary, we adopt a half overlap. The experiments are operated on a GPU server with an Intel(R) Core(TM) i9-9900K CPU and a NVIDIA RTX 2080Ti-11 GB GPU. All of the detailed experiment settings are displayed in Table 2, where TrS, VaS, TeS denote training size, validation size and testing size, respectively.

4. Experimental Results

This section displays the comparative results, including data augmentation, ablation studies with different modules, various feature inputs and optimised band weight. In particular, we compared our results of various inputs with the existing results in [2].

4.1. Data Augmentation Results

Data augmentation is paramount to increase the training data because the lack of training data will lead to overfitting problems. In this study, morphological transformation is adopted to augment the training data. The commonly used morphological transformation in image processing, such as rotate, flip and scale transformation are applied. It can be found in Table 3 that the aforementioned three approaches are discussed, where rotate means the input with random rotation in 0, 90, 180 and 270 angles, flip refers to flipping the image horizontally and vertically with a 50% probability and scale refers to scaling the image with a range of ratios.
It can be observed from Table 3 that the three methods play a positive role in OA score, where the increase of rotation, flip and scale (0.75, 1.0) method are 0.21%, 0.22% and 0.20%, respectively. In particular, different scale ratios affecting OA result are discussed. It is apparent that scale (0.75 1.0), scale (1.0, 1.25) and scale (0.75 1.0 1.25) show that both larger and smaller scales can promote the OA score. The reason is that a larger scale can help discern the details and a smaller scale provides global content. However, when adding the scale value as 0.25 and 2.0 or using the continuous scale ratio from 0.5 to 1.5, the OA will decrease. According to the results, the scale (0.5 0.75 1.0 1.25 1.5) is set as default in the following experiments. In this study, scale (0.5 0.75 1.0 1.25 1.5) along with rotate and flip method are adjusted for data augmentation.

4.2. Ablation Studies

Ablation studies are performed to verify the effectiveness of the proposed modules (IEM and IDM) by using UAV imagery. All experiments are conducted on UNet baseline using encoder-decoder architecture. On the baseline of UNet with the aforementioned data augmentation methods ( U N e t a u g ), we set the IEM in encoder block 3, 4 and 5 as shown in Figure 7 to achieve better performance, since the IEM can replace the original convolution to better recognise the irregular boundary. IDM is also used to rebuild the blurred boundary by replacing the up-conv in the decoder and one IDM is set between decoder block 1 and 2 to dynamically upsample the features and get great performance. The comparative results are displayed in Table 4.
It follows from Table 4 that IEM and IDM modules are able to promote the OA score up to 93.72% and 93.79% respectively. The integration of IEM and IDM even increases 1.18% to 94.55% in comparison with U N e t a u g method, showing that the involvement of these two modules can result in the best performance. These conclusions can also be drawn from the visualized image shown in Figure 12, intuitively displaying the advantages of the two modules. Segmentation map by the proposed method in yellow rust detection gets a sharper boundary which is closer to the ground truth.

4.3. Ir-Unet with Various Inputs

A comparative study is also conducted by using three inputs, where inputs A include five bands information from RedEdge camera (R, G, B, NIR and RedEdge), inputs B include RGB bands information and inputs C consist of top five useful indices in [2] including index OSAVI (Red-NIR), SCCCI (Red-RedEdge-NIR), CVI (Green-Red-NIR), TGI (Green-NIR) and GI (Green-Red). Table 5, Table 6 and Table 7 show the results by adopting three different inputs and also compare the results with the existing work [2].
It follows from Table 5, Table 6 and Table 7 that the proposed Ir-UNet segmentation performance outperforms the existing results [2] in terms of precision, recall, F1 and OA score. In particular, the segmentation results using inputs A achieve the best performance on OA up to 96.95%, whereas inputs B obtaining 94.55% and inputs C obtaining 95.16% on OA score. First comparing the results of inputs A and inputs B of our results, the extra information of NIR and RedEdge bands can bring great improvement of OA from 94.55% to 96.95%, especially for rust detection accuracy (from 81.47% to 88.32%). By comparing the results with literature [2], given inputs A, the proposed Ir-UNet outperforms the basic UNet in terms of precision, recall and F1 score, leading to a 3.42%, 2.0% and 2.66% increase respectively. Particularly, the proposed method yields a 6.42% improvement on rust precision score. Given inputs B, the proposed method achieves a 20.37% improvement on precision score of rust class in comparison with reference [2].
Second, comparing our results of inputs B and inputs C, the introduction of particular indices brings a 0.61% improvement than original RGB band features on OA score. Finally, by comparing our results of inputs A and inputs C, selected vegetation indices (SVIs) based features result in a decrease than the five raw band features. This is mainly due to the fact that the Ir-UNet algorithm is capable of adjusting original raw band information automatically to maximise the segmentation performance, but the selected indices are variants from these raw bands. All of the improved results compared with the existing work [2] are shown in Table 5, Table 6 and Table 7 in bold text.
To evaluate whether the combination of raw bands and useful indices can further promote the segmentation performance, inputs D is also designed (five raw bands and SVIs in Table 8). It follows from Table 9 that the precision of three classes has great improvement, but the OA score employing inputs D can only increase 0.02% in comparison with inputs A (from 96.95% to 96.97%). Therefore, it can be concluded that the combination of all raw bands and their variant indices can marginally improve the final segmentation performance.
Table 8. List of all SVI details in this study.
Vegetation IndexFormulaReferences
Nitrogen Reflectance Index (NRI ) ( R g R r ) / ( R g + R r ) [35]
Greenness Index (GI ) R g / R r [36]
Green Leaf Index (GLI ) ( 2 R g R r R b ) / ( 2 R g + R r + R b ) [37]
Anthocyanin Reflectance Index (ARI) R g 1 R r e 1 [38]
Green NDVI (GNDVI ) ( R n i r R g ) / ( R n i r + R g ) [39]
Triangular Vegetation Index (TVI ) 0.5 [ 120 ( R n i r R g ) 200 ( R n i r R g ) ] [40,41]
ChlorophyII Index-Green (CIG) R n i r / R g 1 [42]
Triangular Greenness Index (TGI) 0.5 ( λ r λ b ) ( R r R g ) ( λ r λ g ) ( R r R b ) [43]
Normalized Difference RedEdge Index (NDREI) ( R n i r R r e ) / ( R n i r + R r e ) [44]
Normalized Difference Vegetation Index (NDVI ) ( R n i r R r ) / ( R n i r + R r ) [45]
Soil Adjusted Vegetation Index (SAVI) 1.5 ( R n i r R r ) / ( R n i r + R r + 0.5 ) [46]
Ratio Vegetation Index (RVI) R n i r / R r [47]
Optimized Soil Adjusted Vegetation Index (OSAVI ) 1.16 ( R n i r R r ) / ( R n i r + R r + 0.16 ) [48]
ChlorophyII Index-RedEdge (CIRE) R n i r / R r e 1 [42]
Enhanced Vegetation Index (EVI) 2.5 ( R n i r R r ) / ( R n i r + 6 R r 7.5 R b + 1 ) [49]
Transformed ChlorophyII Absorption and Reflectance Index (TCARI) 3 [ ( R r e R r ) 0.2 ( R r e R g ) ( R r e / R r ) ] [50]
ChlorophyII Vegetation Index (CVI) R n i r R r / R g 2 [51]
Simplified Canopy ChlorophyII Content Index (SCCCI)NDREI/NDVI[52]

4.4. Optimised Band Weight Results

Previous evaluation is based on the assumption that the feature weight settings are equal. According to literature [33,53], feature re-weight is one promising way to optimise weight settings and maximise the final segmentation performance. CCRM can learn a dynamic weight of each feature, further improving the state-of-the-art segmentation results. Thus, five raw bands using CCRM module are conducted to optimise each band weight in our deep learning network, where band R, G, B, NIR and RedEdge are optimised to get a set of weights of 1.0220, 0.9698, 1.0168, 0.9559, 0.8775, respectively. As a consequence, by adopting these optimised weights for each band, the OA score of this segmentation task can reach up to 97.13%, improving 0.18% than using Ir-UNet network only (see Table 10). Therefore, optimising the band weights before training in a dynamic learnable way can be very helpful even if on an extremely powerful baseline.
To intuitively understand the segmentation performance, the results of different inputs are visualised in Figure 13. It can be observed that (f) achieves the best results in visualisation compared with (b) to (e), bringing less noise and a clear boundary. Moreover, a comparative visualisation result (see Figure 14) is also compared with previous work in [2]; nearly half of the results from infected plot are far from the proposed method using the same inputs, where red rectangles mean obvious improvements for different regions among various inputs. Therefore, it can be concluded that the proposed method generates the best yellow rust segmentation results after coping with irregular and blurred boundary problems and with fewer noises by comparing the areas highlighted by red rectangles.

5. Discussion

The proposed Ir-UNet achieves state-of-the-art performance in yellow rust segmentation task in terms of precision, recall, 
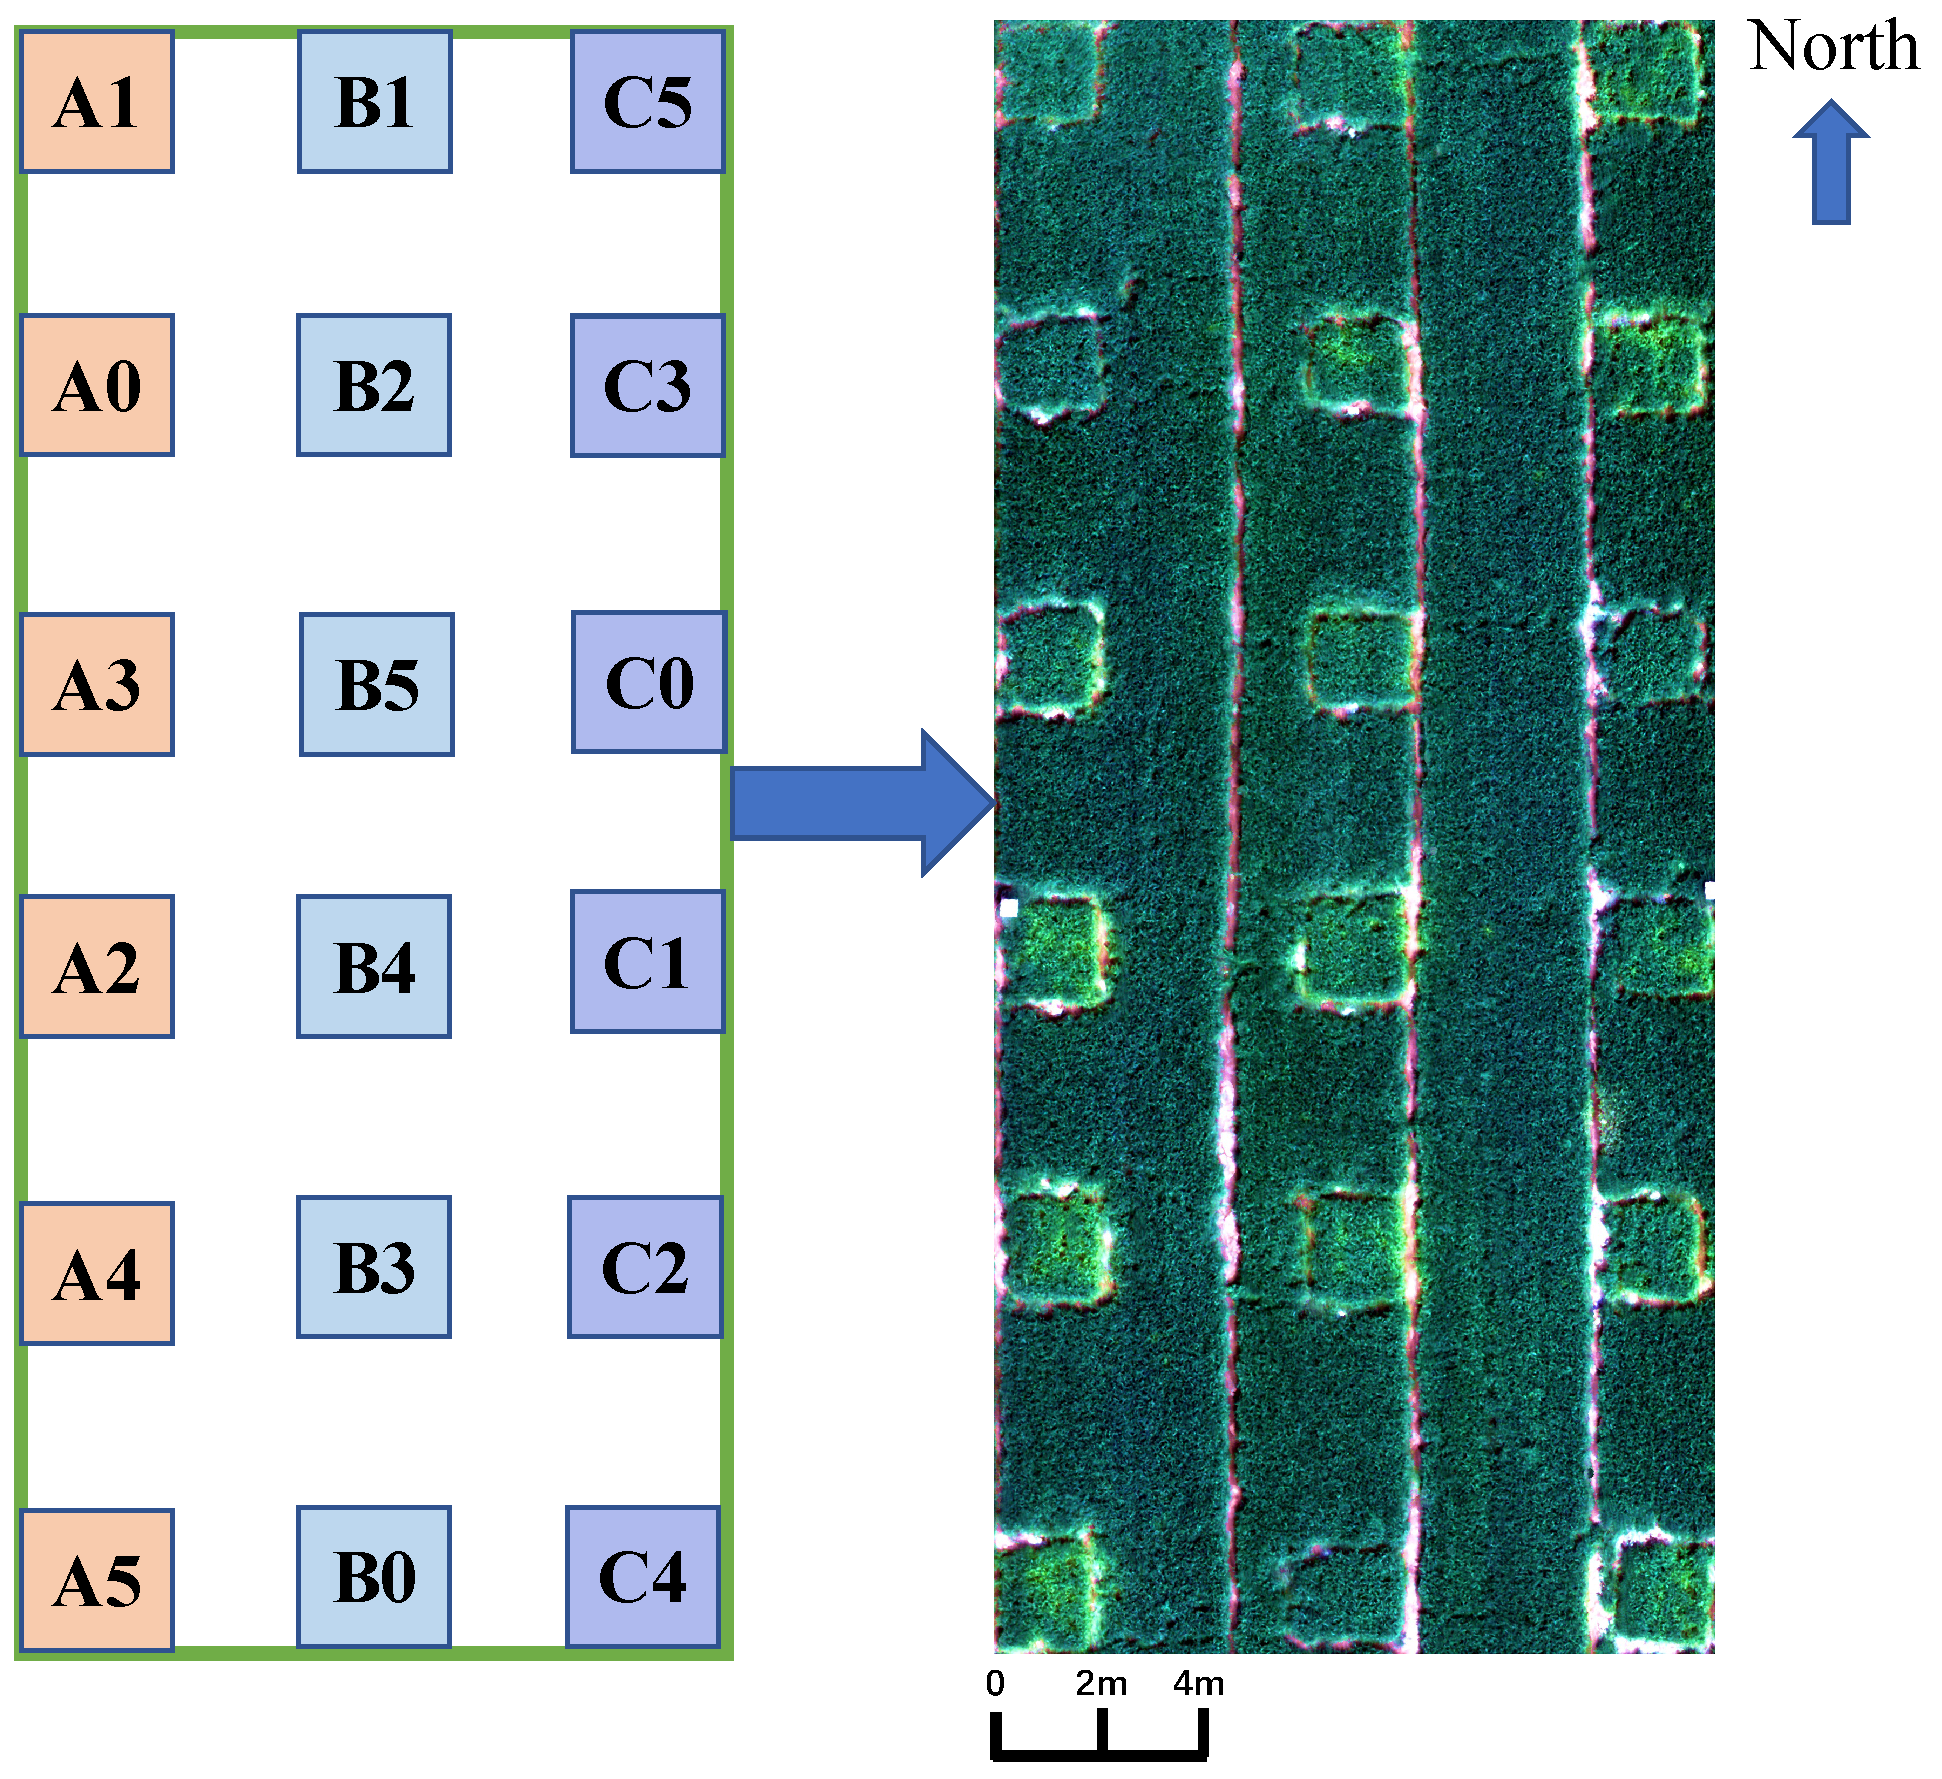
F1 score and overall accuracy. However, there are still two main problems. First, the dataset from one flight for deep learning network seems limited; it is necessary to consider the k-fold validation method to evaluate the algorithm robustness. As is shown in Figure 15, this field is divided into three parts for k-fold validation (as there are three replicates of the experiment), where area 2 and 3 are first for training and 1 for testing, 1, 3 for training and 2 for testing, 1, 2 for training and 3 for testing. A comparative study using a different training and testing dataset by various inputs is displayed in Table 11. Precision, Recall and F1 score are the mean value of each class, including healthy, background and rust. It can be seen the mean values of OA using input A, B, C are 97.66%, 95.35% and 97.03% respectively, where input A is the best and input B is the worst, providing a more reliable and robust result by our proposed method. As a result, the proposed method is robust and accurate under k-fold validation settings.
Second, excessive spectral information of remote sensing images is not always helpful because some noise may be brought, leading to the increase of computation load and less robustness. Therefore, some particular features (e.g., band and index) can be selected to achieve the same performance with less computation load. In order to evaluate the performance of different feature selection methods, here a band-based feature selection method and index-based feature selection method are enumerated to compare with each other. First, five raw bands (treated as network inputs) are tested in the proposed method respectively, where the results are presented and compared by using OA. It follows from Table 12 that RedEdge band obtains the highest OA score among five raw bands reaching up to 92.54%. In addition, Red and NIR band information also promote the results to 91.06% and 91.44%, respectively. Therefore, it can be concluded that the extra two bands (NIR and RedEdge) information of the RedEdge camera can effectively promote the yellow rust segmentation performance. Second, the selected indices from [2] shown in Table 13 are also tested by our proposed method. It is apparent that corresponding indices of the top three OA are Index 11, Index 13 and Index 15, where the OA score of all three indices are higher than band-based features.
To evaluate whether these top ranked features are useful after their combination, a comparative study is also carried out. The combination of three band information and three indices are compared by referring to the metrics of precision, recall, F1 and OA. It follows from Table 14 that band-based feature selection method is more superior than index-based feature selection method. In addition, it only gets 0.14% decrease in the OA score compared with the results with inputs D (5 bands + 18 indices) and gets 2.28% promotion of the OA score compared with inputs A (R,G,B). Therefore, it is convincing that we can take the Red-NIR-RE bands to replace the combination of 5 bands and 18 indexes and get the same performance. The findings in this section are drawn as follows:
(1)
In 3-fold validation, the proposed method by different training and testing data can overcome original limited data problem, providing accurate and robust segmentation results in yellow rust detection.
(2)
Overall, OA using individual index as input outperforms the original raw band information input as indices are formulated by various raw bands.
(3)
Some particular indices, such as index 13, achieve almost the same OA score in comparison with inputs D, showing that the OA score is not positively correlated to the amount of inputs.
(4)
The top 3 indices, index 11 (SAVI with Red-NIR bands), index 13 (OASVI with Red-NIR bands) and index 15 (EVI with Blue-Red-NIR bands) have the same components of Red and NIR bands, revealing that the combination of Red and NIR bands is extremely useful in index based feature.
(5)
Red, NIR and Rededge band information play a paramount role and is much accurate and robust than RGB information in solving wheat yellow rust detection problem.

6. Conclusions and Future Work

This paper investigates the challenging problem of wheat yellow rust detection by integrating UAV multispectral imaging and deep learning method. In particular, IEM and IDM are fused into the basic UNet network to cope with irregular and blurred boundary problems of remote sensing dataset so that a more reliable and accurate Ir-UNet network is proposed for yellow rust disease detection automatically. Meanwhile, CCRM is also designed to optimise the feature weights and maximise the segmentation performance. All of the methods are validated on real-world UAV multipsectral wheat yellow rust disease dataset collected in Yangling experiment field. In performance evaluation, the proposed algorithm is compared with the basic UNet network and various network inputs, yielding the best segmentation performance among others (97.13% on OA score). Moreover, it is also shown that the use of three selected bands Red-NIR-RE in the proposed Ir-UNet can reach a comparative performance (OA: 96.83%).
Although the presented results are quite promising, there is still much room for further improvement. For example, in this study, only a small training dataset is used to evaluate the proposed algorithm performance. With the advert of a more labelled dataset, the performance can be assessed in a more accurate manner. Moreover, in addition to CNN network, the popular deep learning network such as Transformer [54,55] can also be drawn to learn the spectral, spatial and temporal information in an end-to-end manner and possibly further improve the final wheat yellow rust segmentation performance.

Author Contributions

Conceptualisation, T.Z., J.S., W.-H.C., and J.L.; methodology, T.Z., Z.X., and J.L.; software, T.Z., Z.X., and Z.Y.; validation, T.Z., and Z.X.; formal analysis, T.Z., Z.X., and Z.Y.; investigation, T.Z., and Z.X.; resources, T.Z., and J.S.; data curation, J.S.; writing—original draft preparation, T.Z.; writing—review and editing, J.S., J.L., Z.X., and Z.Y.; visualisation, T.Z., and Z.X.; supervision, J.L., and C.L.; project administration, J.L., and C.L.; funding acquisition, J.L., C.L., and W.-H.C. All authors have read and agreed to the published version of the manuscript.

Funding

This work was supported by the Fundamental Research Funds for the China Central Universities of USTB (FRF-DF-19-002), Scientific and Technological Innovation Foundation of Shunde Graduate School, USTB: BK20BE014. This work was also partially supported by UK Science and Technology Facilities Council (STFC) under Newton fund with Grant ST/V00137X/1.

Institutional Review Board Statement

Not applicable.

Informed Consent Statement

Not applicable.

Data Availability Statement

No new data were created or analyzed in this study. Data sharing is not applicable to this article.

Conflicts of Interest

The authors declare no conflict of interest.

References

  1. Savary, S.; Ficke, A.; Aubertot, J.N.; Hollier, C. Crop Losses Due to Diseases and Their Implications for Global Food Production Losses and Food Security. Food Secur. 2012, 4, 519–537. [Google Scholar] [CrossRef]
  2. Su, J.; Yi, D.; Su, B.; Mi, Z.; Liu, C.; Hu, X.; Xu, X.; Guo, L.; Chen, W.H. Aerial Visual Perception in Smart Farming: Field Study of Wheat Yellow Rust Monitoring. IEEE Trans. Ind. Inform. 2020, 17, 2242–2249. [Google Scholar] [CrossRef] [Green Version]
  3. Xiao, J.; Dong, L.; Jin, H.; Zhang, J.; Zhang, K.; Liu, N.; Han, X.; Zheng, H.; Zheng, W.; Wang, D. Reactions of Triticum urartu accessions to two races of the wheat yellow rust pathogen. Crop J. 2018, 6, 509–515. [Google Scholar] [CrossRef]
  4. Vergara-Diaz, O.; Kefauver, S.C.; Elazab, A.; Nieto-Taladriz, M.T.; Araus, J.L. Grain yield losses in yellow-rusted durum wheat estimated using digital and conventional parameters under field conditions. Crop J. 2015, 3, 200–210. [Google Scholar] [CrossRef] [Green Version]
  5. El Jarroudi, M.; Lahlali, R.; Kouadio, L.; Denis, A.; Belleflamme, A.; El Jarroudi, M.; Boulif, M.; Mahyou, H.; Tychon, B. Weather-based predictive modeling of wheat stripe rust infection in Morocco. Agronomy 2020, 10, 280. [Google Scholar] [CrossRef] [Green Version]
  6. Bock, C.; Poole, G.; Parker, P.; Gottwald, T. Plant disease severity estimated visually, by digital photography and image analysis, and by hyperspectral imaging. Crit. Rev. Plant Sci. 2010, 29, 59–107. [Google Scholar] [CrossRef]
  7. Liu, J.; Wang, X. Plant diseases and pests detection based on deep learning: A review. Plant Methods 2021, 17, 1–18. [Google Scholar] [CrossRef]
  8. Zhang, T.; Su, J.; Liu, C.; Chen, W.H. Bayesian calibration of AquaCrop model for winter wheat by assimilating UAV multi-spectral images. Comput. Electron. Agric. 2019, 167, 105052. [Google Scholar] [CrossRef]
  9. Deng, L.; Mao, Z.; Li, X.; Hu, Z.; Duan, F.; Yan, Y. UAV-based multispectral remote sensing for precision agriculture: A comparison between different cameras. ISPRS J. Photogramm. Remote Sens. 2018, 146, 124–136. [Google Scholar] [CrossRef]
  10. Xu, Y.; Ma, K.; Zhao, Y.; Wang, X.; Zhou, K.; Yu, G.; Li, C.; Li, P.; Yang, Z.; Xu, C.; et al. Genomic selection: A breakthrough technology in rice breeding. Crop J. 2021, 9, 669–677. [Google Scholar] [CrossRef]
  11. Zhang, T.; Su, J.; Liu, C.; Chen, W.H. State and parameter estimation of the AquaCrop model for winter wheat using sensitivity informed particle filter. Comput. Electron. Agric. 2021, 180, 105909. [Google Scholar] [CrossRef]
  12. Al-Ali, Z.; Abdullah, M.; Asadalla, N.; Gholoum, M. A comparative study of remote sensing classification methods for monitoring and assessing desert vegetation using a UAV-based multispectral sensor. Environ. Monit. Assess. 2020, 192, 1–14. [Google Scholar] [CrossRef]
  13. Liu, W.; Yang, G.; Xu, F.; Qiao, H.; Fan, J.; Song, Y.; Zhou, Y. Comparisons of detection of wheat stripe rust using hyper-spectrometer and UAV aerial photography. Acta Phytopathol. Sin. 2018, 48, 223–227. [Google Scholar]
  14. Jin, X.; Li, Z.; Feng, H.; Ren, Z.; Li, S. Deep neural network algorithm for estimating maize biomass based on simulated Sentinel 2A vegetation indices and leaf area index. Crop J. 2020, 8, 87–97. [Google Scholar] [CrossRef]
  15. Yu, L.; Shi, J.; Huang, C.; Duan, L.; Wu, D.; Fu, D.; Wu, C.; Xiong, L.; Yang, W.; Liu, Q. An integrated rice panicle phenotyping method based on X-ray and RGB scanning and deep learning. Crop J. 2021, 9, 42–56. [Google Scholar] [CrossRef]
  16. Jin, X.; Jie, L.; Wang, S.; Qi, H.J.; Li, S.W. Classifying wheat hyperspectral pixels of healthy heads and Fusarium head blight disease using a deep neural network in the wild field. Remote Sens. 2018, 10, 395. [Google Scholar] [CrossRef] [Green Version]
  17. Zhang, X.; Han, L.; Dong, Y.; Shi, Y.; Huang, W.; Han, L.; González-Moreno, P.; Ma, H.; Ye, H.; Sobeih, T. A deep learning-based approach for automated yellow rust disease detection from high-resolution hyperspectral UAV images. Remote Sens. 2019, 11, 1554. [Google Scholar] [CrossRef] [Green Version]
  18. Nagasubramanian, K.; Jones, S.; Singh, A.K.; Singh, A.; Ganapathysubramanian, B.; Sarkar, S. Explaining hyperspectral imaging based plant disease identification: 3D CNN and saliency maps. arXiv 2018, arXiv:1804.08831. [Google Scholar]
  19. Yang, G.; Zhang, Q.; Zhang, G. EANet: Edge-aware network for the extraction of buildings from aerial images. Remote Sens. 2020, 12, 2161. [Google Scholar] [CrossRef]
  20. Xu, Z.; Zhang, W.; Zhang, T.; Li, J. HRCNet: High-Resolution Context Extraction Network for Semantic Segmentation of Remote Sensing Images. Remote Sens. 2021, 13, 71. [Google Scholar] [CrossRef]
  21. Dai, J.; Qi, H.; Xiong, Y.; Li, Y.; Zhang, G.; Hu, H.; Wei, Y. Deformable convolutional networks. In Proceedings of the IEEE International Conference on Computer Vision, Venice, Italy, 22–29 October 2017; pp. 764–773. [Google Scholar]
  22. Zhu, X.; Hu, H.; Lin, S.; Dai, J. Deformable convnets v2: More deformable, better results. In Proceedings of the IEEE/CVF Conference on Computer Vision and Pattern Recognition, Long Beach, CA, USA, 15–20 June 2019; pp. 9308–9316. [Google Scholar]
  23. Wang, J.; Chen, K.; Xu, R.; Liu, Z.; Loy, C.C.; Lin, D. Carafe: Content-aware reassembly of features. In Proceedings of the IEEE/CVF International Conference on Computer Vision, Seoul, Korea, 27 October–3 November 2019; pp. 3007–3016. [Google Scholar]
  24. Mesas-Carrascosa, F.J.; Notario García, M.D.; Meroño de Larriva, J.E.; García-Ferrer, A. An analysis of the influence of flight parameters in the generation of unmanned aerial vehicle (UAV) orthomosaicks to survey archaeological areas. Sensors 2016, 16, 1838. [Google Scholar] [CrossRef] [PubMed] [Green Version]
  25. Anders, N.; Smith, M.; Suomalainen, J.; Cammeraat, E.; Valente, J.; Keesstra, S. Impact of flight altitude and cover orientation on Digital Surface Model (DSM) accuracy for flood damage assessment in Murcia (Spain) using a fixed-wing UAV. Earth Sci. Inform. 2020, 13, 391–404. [Google Scholar] [CrossRef] [Green Version]
  26. Smith, M.; Carrivick, J.; Quincey, D. Structure from motion photogrammetry in physical geography. Prog. Phys. Geogr. 2016, 40, 247–275. [Google Scholar] [CrossRef] [Green Version]
  27. Ronneberger, O.; Fischer, P.; Brox, T. U-net: Convolutional networks for biomedical image segmentation. In Proceedings of the International Conference on Medical Image Computing and Computer-Assisted Intervention, Munich, Germany, 5–9 October 2015; Springer: Berlin/Heidelberg, Germany; pp. 234–241. [Google Scholar]
  28. Long, Y.; Gong, Y.; Xiao, Z.; Liu, Q. Accurate object localization in remote sensing images based on convolutional neural networks. IEEE Trans. Geosci. Remote Sens. 2017, 55, 2486–2498. [Google Scholar] [CrossRef]
  29. Song, J.; Gao, S.; Zhu, Y.; Ma, C. A survey of remote sensing image classification based on CNNs. Big Earth Data 2019, 3, 232–254. [Google Scholar] [CrossRef]
  30. Zhou, Z.; Siddiquee, M.M.R.; Tajbakhsh, N.; Liang, J. Unet++: A nested u-net architecture for medical image segmentation. In Proceedings of theDeep Learning in Medical Image Analysis and Multimodal Learning for Clinical Decision Support, Granada, Spain, 20 September 2018; Springer: Berlin/Heidelberg, Germany, 2018; pp. 3–11. [Google Scholar]
  31. Çiçek, Ö.; Abdulkadir, A.; Lienkamp, S.S.; Brox, T.; Ronneberger, O. 3D U-Net: Learning dense volumetric segmentation from sparse annotation. In Proceedings of the International Conference on Medical Image Computing and Computer-Assisted Intervention, Athens, Greece, 17–21 October 2016; Springer: Berlin/Heidelberg, Germany; pp. 424–432. [Google Scholar]
  32. Oktay, O.; Schlemper, J.; Folgoc, L.L.; Lee, M.; Heinrich, M.; Misawa, K.; Mori, K.; McDonagh, S.; Hammerla, N.Y.; Kainz, B.; et al. Attention u-net: Learning where to look for the pancreas. arXiv 2018, arXiv:1804.03999. [Google Scholar]
  33. Hu, J.; Shen, L.; Sun, G. Squeeze-and-excitation networks. In Proceedings of the IEEE Conference on Computer Vision and Pattern Recognition, Salt Lake City, UT, USA, 18–23 June 2018; pp. 7132–7141. [Google Scholar]
  34. Woo, S.; Park, J.; Lee, J.Y.; Kweon, I.S. Cbam: Convolutional block attention module. In Proceedings of the European Conference on Computer Vision (ECCV), Munich, Germany, 8–14 September 2018; pp. 3–19. [Google Scholar]
  35. Filella, I.; Serrano, L.; Serra, J.; Penuelas, J. Evaluating wheat nitrogen status with canopy reflectance indices and discriminant analysis. Crop Sci. 1995, 35, 1400–1405. [Google Scholar] [CrossRef]
  36. Zarco-Tejada, P.J.; Berjón, A.; López-Lozano, R.; Miller, J.R.; Martín, P.; Cachorro, V.; González, M.; De Frutos, A. Assessing vineyard condition with hyperspectral indices: Leaf and canopy reflectance simulation in a row-structured discontinuous canopy. Remote Sens. Environ. 2005, 99, 271–287. [Google Scholar] [CrossRef]
  37. Louhaichi, M.; Borman, M.M.; Johnson, D.E. Spatially located platform and aerial photography for documentation of grazing impacts on wheat. Geocarto Int. 2001, 16, 65–70. [Google Scholar] [CrossRef]
  38. Gitelson, A.A.; Merzlyak, M.N.; Chivkunova, O.B. Optical properties and nondestructive estimation of anthocyanin content in plant leaves. Photochem. Photobiol. 2001, 74, 38–45. [Google Scholar] [CrossRef]
  39. Gitelson, A.A.; Kaufman, Y.J.; Merzlyak, M.N. Use of a green channel in remote sensing of global vegetation from EOS-MODIS. Remote Sens. Environ. 1996, 58, 289–298. [Google Scholar] [CrossRef]
  40. Broge, N.H.; Leblanc, E. Comparing prediction power and stability of broadband and hyperspectral vegetation indices for estimation of green leaf area index and canopy chlorophyll density. Remote Sens. Environ. 2001, 76, 156–172. [Google Scholar] [CrossRef]
  41. Abdulridha, J.; Batuman, O.; Ampatzidis, Y. UAV-based remote sensing technique to detect citrus canker disease utilizing hyperspectral imaging and machine learning. Remote Sens. 2019, 11, 1373. [Google Scholar] [CrossRef] [Green Version]
  42. Gitelson, A.A.; Gritz, Y.; Merzlyak, M.N. Relationships between leaf chlorophyll content and spectral reflectance and algorithms for non-destructive chlorophyll assessment in higher plant leaves. J. Plant Physiol. 2003, 160, 271–282. [Google Scholar] [CrossRef]
  43. Hunt Jr, E.R.; Doraiswamy, P.C.; McMurtrey, J.E.; Daughtry, C.S.; Perry, E.M.; Akhmedov, B. A visible band index for remote sensing leaf chlorophyll content at the canopy scale. Int. J. Appl. Earth Obs. Geoinf. 2013, 21, 103–112. [Google Scholar] [CrossRef] [Green Version]
  44. Gitelson, A.; Merzlyak, M.N. Quantitative estimation of chlorophyll-a using reflectance spectra: Experiments with autumn chestnut and maple leaves. J. Photochem. Photobiol. Biol. 1994, 22, 247–252. [Google Scholar] [CrossRef]
  45. Rouse, J., Jr.; Haas, R.; Schell, J.; Deering, D. Monitoring Vegetation Systems in the Great Plains with ERTS; NASA Special Publication: Washington, DC, USA, 1974.
  46. Huete, A.R. A soil-adjusted vegetation index (SAVI). Remote Sens. Environ. 1988, 25, 295–309. [Google Scholar] [CrossRef]
  47. Pearson, R.L.; Miller, L.D. Remote mapping of standing crop biomass for estimation of the productivity of the shortgrass prairie. Remote Sens. Environ. 1972, VIII, 1355. [Google Scholar]
  48. Rondeaux, G.; Steven, M.; Baret, F. Optimization of soil-adjusted vegetation indices. Remote Sens. Environ. 1996, 55, 95–107. [Google Scholar] [CrossRef]
  49. Huete, A.; Didan, K.; Miura, T.; Rodriguez, E.P.; Gao, X.; Ferreira, L.G. Overview of the radiometric and biophysical performance of the MODIS vegetation indices. Remote Sens. Environ. 2002, 83, 195–213. [Google Scholar] [CrossRef]
  50. Haboudane, D.; Miller, J.R.; Tremblay, N.; Zarco-Tejada, P.J.; Dextraze, L. Integrated narrow-band vegetation indices for prediction of crop chlorophyll content for application to precision agriculture. Remote Sens. Environ. 2002, 81, 416–426. [Google Scholar] [CrossRef]
  51. Vincini, M.; Frazzi, E.; D’Alessio, P. A broad-band leaf chlorophyll vegetation index at the canopy scale. Precis. Agric. 2008, 9, 303–319. [Google Scholar] [CrossRef]
  52. Raper, T.; Varco, J. Canopy-scale wavelength and vegetative index sensitivities to cotton growth parameters and nitrogen status. Precis. Agric. 2015, 16, 62–76. [Google Scholar] [CrossRef] [Green Version]
  53. Fu, J.; Liu, J.; Tian, H.; Li, Y.; Bao, Y.; Fang, Z.; Lu, H. Dual attention network for scene segmentation. In Proceedings of the IEEE/CVF Conference on Computer Vision and Pattern Recognition, Long Beach, CA, USA, 15–20 June 2019; pp. 3146–3154. [Google Scholar]
  54. Vaswani, A.; Shazeer, N.; Parmar, N.; Uszkoreit, J.; Jones, L.; Gomez, A.N.; Kaiser, L.; Polosukhin, I. Attention is all you need. arXiv 2017, arXiv:1706.03762. [Google Scholar]
  55. Cheng, H.; Liao, W.; Yang, M.Y.; Rosenhahn, B.; Sester, M. Amenet: Attentive maps encoder network for trajectory prediction. ISPRS J. Photogramm. Remote Sens. 2021, 172, 253–266. [Google Scholar] [CrossRef]
Figure 1. Flowchart of field experiment design in this study.
Remotesensing 13 03892 g001
Figure 2. Wheat yellow rust disease inoculation: experiment design and visual layout with RGB imagery.
Remotesensing 13 03892 g002
Figure 3. M100 UAV with the RedEdge camera.
Remotesensing 13 03892 g003
Figure 4. ColorblueFlowchart of UAV based multispectral imaging system.
Remotesensing 13 03892 g004
Figure 5. Labelling the image with three different classes: Rust, Healthy and Background.
Remotesensing 13 03892 g005
Figure 6. Framework of the construction of automatic wheat yellow rust detection system.
Remotesensing 13 03892 g006
Figure 7. Overall framework of the proposed Ir-UNet in this study.
Remotesensing 13 03892 g007
Figure 8. Detailed IEM design of the Ir-UNet.
Remotesensing 13 03892 g008
Figure 9. Detailed IDM design of the Ir-UNet.
Remotesensing 13 03892 g009
Figure 10. Detailed CCRM design of the Ir-UNet.
Remotesensing 13 03892 g010
Figure 11. Dataset division for training, validation and test.
Remotesensing 13 03892 g011
Figure 12. Segmentation maps of input image, ground truth, results without modules (w/o) and results with modules (w/) (left to right).
Remotesensing 13 03892 g012
Figure 13. Segmentation maps of different inputs using Ir-UNet.
Remotesensing 13 03892 g013
Figure 14. Segmentation maps of the baseline U-net in [2].
Remotesensing 13 03892 g014
Figure 15. Data division used in k-fold validation.
Remotesensing 13 03892 g015
Table 1. Detailed spectral information of the RedEdge camera.
Band No.NameCenter WavelengthBandwidthPanel Reflectance
1Blue475 nm20 nm0.57
2Green560 nm20 nm0.57
3Red668 nm10 nm0.56
4NIR840 nm40 nm0.51
5RedEdge717 nm10 nm0.55
Table 2. Details of experiment settings.
DatasetsPlatformTraining Settings
TrS/patches1000 × 2991/161CPUIntel(R) Core(TM) i9-9900KOptimizerSGDM
VaS/patches336 × 1495/22GPUNVIDIA RTX 2080Ti-11GBLR schedulerPoly
TeS/patches336 × 1496/22DL FrameworkPytorch V1.6.0Loss functionSoft CE
Patches size256 × 256CompilerPycharm 2020.1LR0.01
Overlap ratio1/2ProgramPython V3.6.12Mini-Batch size16
No. Class3 Epoch20
Table 3. The effects of data augmentation on segmentation performance.
MethodPrecision (%)Recall (%)F1 (%)OA (%)
UNet84.0890.0486.9592.70
+Rotate84.6690.4887.4792.91
+Flip84.9590.1787.4892.92
+Scale(0.75 1.0)84.6990.2487.3892.90
+Scale(1.0 1.25)85.1090.3187.6393.04
+Scale(0.75 1.0 1.25)85.4790.2987.8193.13
+Scale(0.5 0.75 1.0 1.25 1.5)86.6689.4488.0393.13
+Scale(0.25 0.5 0.75 1.0 1.25 1.5 2.0)86.3889.2987.8193.04
+Scale(0.5–1.5)85.7889.9187.8093.09
+Rotate + Flip + Scale(0.5 0.75 1.0 1.25 1.5)87.2390.1088.6593.37
Table 4. The ablation studies about IEM and IDM.
MethodIEMIDMPrecision (%)Recall (%)F1 (%)OA (%)
U N e t a u g 87.2390.1088.6593.37
U N e t a u g 87.1891.1089.1093.72
U N e t a u g 87.9090.5389.2093.79
U N e t a u g 90.5591.0290.7994.55
Table 5. Performance with inputs A.
MethodsMetric/ClassRust (%)Healthy (%)Background (%)Average (%)
Ref [2]Precision81.997.994.291.3
Recall85.596.396.092.6
F184.097.095.092.0
OA////
OursPrecision88.3298.1097.7594.72
Recall87.4098.0298.3794.60
F187.8698.0698.0694.66
OA///96.95
Table 6. Performance with inputs B.
MethodsMetric/ClassRust (%)Healthy (%)Background (%)Average (%)
Ref [2]Precision61.197.896.385.1
Recall91.493.287.790.8
F173.095.092.087.0
OA////
OursPrecision81.4797.6392.5590.55
Recall82.7797.0793.2291.02
F182.1197.3592.8890.79
OA///94.55
Table 7. Performance with inputs C.
MethodsMetric/ClassRust (%)Healthy (%)Background (%)Average (%)
Ref [2]Precision64.896.191.384.1
Recall77.494.388.086.6
F171.095.090.085.0
OA////
OursPrecision64.0399.2498.1587.14
Recall96.3894.9795.3295.56
F176.9497.0696.7291.15
OA///95.16
Table 9. Performance with inputs D.
MethodsMetric/ClassRust (%)Healthy (%)Background (%)Average (%)
oursPrecision87.7498.2397.7394.57
Recall87.9797.8598.5494.79
F187.8698.0498.1394.68
OA///96.97
Table 10. Performance with inputs A using CCRM.
MethodsMetric/ClassRust (%)Healthy (%)Backgound (%)Avearage (%)
oursPrecision87.0698.2598.6094.63
Recall89.8898.2797.2995.15
F188.4598.2697.9494.89
OA///97.13
Table 11. 3-fold validation results by using various training-validation combinations.
InputTrainTestPrecision (%)Recall (%)F1 (%)OA (%)
A2 3195.6295.9095.7698.06
1 3294.2694.8594.5597.22
1 2393.5095.3994.4497.70
AverageAverage94.4695.3894.9297.66
B2 3190.0691.0290.5495.15
1 3292.4590.5291.4895.09
1 2390.6691.2390.9595.82
AverageAverage91.0690.9290.9995.35
C2 3194.4893.6994.0997.11
1 3293.0094.4393.7196.77
1 2393.1094.0393.5697.21
AverageAverage93.5394.0593.7997.03
Table 12. Performance with single input of 5 raw bands.
InputOA Score (%)
Blue89.44
Green90.84
Red91.06
NIR91.44
Red Edge92.54
Table 13. Performance with single input of 18 indices.
InputOA Score (%)InputOA Score (%)
Index 191.48Index 291.51
Index 391.05Index 490.66
Index 592.58Index 693.33
Index 792.42Index 891.70
Index 991.58Index 1092.92
Index 1194.85Index 1292.99
Index 1396.33Index 1491.83
Index 1594.62Index 1691.61
Index 1790.77Index 1891.43
Table 14. Comparison of Red-NIR-RE inputs and the top 3 index inputs.
MethodsMetric/ClassRust (%)Healthy (%)Background (%)Average (%)
Top 3 indicesPrecision88.8996.9898.8594.90
Recall83.6198.4497.9093.32
F186.1797.7198.3794.10
OA///96.60
Red-NIR-RE bandsPrecision86.3198.0798.1594.18
Recall88.0897.8497.9294.61
F187.1997.9698.0394.39
OA///96.83
Publisher’s Note: MDPI stays neutral with regard to jurisdictional claims in published maps and institutional affiliations.

