Article

Global Sensitivity Analysis of a Water Cloud Model toward Soil Moisture Retrieval over Vegetated Agricultural Fields

1
Key Laboratory of Remote Sensing of Gansu Province, Heihe Remote Sensing Experimental Research Station, Northwest Institute of Eco-Environment and Resources, Chinese Academy of Sciences, Lanzhou 730000, China
2
School of Geography, Geomatics and Planning, Jiangsu Normal University, Xuzhou 221116, China
3
Lanzhou Information Center, Northwest Institute of Eco-Environment and Resources, Chinese Academy of Sciences, Lanzhou 730000, China
*
Author to whom correspondence should be addressed.
Remote Sens. 2021, 13(19), 3889; https://doi.org/10.3390/rs13193889
Submission received: 22 July 2021 / Revised: 11 September 2021 / Accepted: 23 September 2021 / Published: 28 September 2021
(This article belongs to the Special Issue Advances on Radar Scattering of Terrain and Applications)

Abstract

:
The release of high-spatiotemporal-resolution Sentinel-1 Synthetic Aperture Radar (SAR) data to the public has provided an unprecedented opportunity to map soil moisture at watershed and agricultural field scales. However, the existing retrieval algorithms fail to derive soil moisture with expected accuracy. Insufficient understanding of the effects of soil and vegetation parameters on the backscatters is an important reason for this failure. To this end, we present a Sensitivity Analysis (SA) to quantify the effects of parameters on the dual-polarized backscatters of Sentinel-1 based on a Water Cloud Model (WCM) and multiple global SA methods. The identification of the incidence angle and polarization of Sentinel-1 and the description scheme of vegetation parameters (A, B and α) in WCM are especially emphasized in this analysis towards an optimal estimation of parameters. Multiple SA methods derive identical parameter importance ranks, indicating that a highly reasonable and reliable SA is performed. Comparison between two existing vegetation description schemes shows that the scheme using Vegetation Water Content (VWC) outperforms the scheme combing particle moisture content and VWC. Surface roughness, soil moisture, VWC, and B, are most sensitive on the backscatters. Variation of parameter sensitivity indices with incidence angle at different polarizations indicates that VV- and VH- polarized backscatters at small incidence angles are the optimal options for soil moisture and surface roughness estimation, respectively, while VV-polarized backscatter at larger incidence angles is well-suited for VWC and B estimation and HH-polarized backscatter is well suited for roughness estimation. This analysis improves the understanding of the effects of vegetated surface parameters on multi-angle and multi-polarized backscatters of Sentinel-1 SAR, informing improvement in SAR-based soil moisture retrieval.

1. Introduction

Retrieving soil moisture using high-spatiotemporal-resolution Synthetic Aperture Radar (SAR) allows for an insight into the spatial distribution of soil moisture details at field scale and temporal variety within a weekly scale, which greatly benefits precision agriculture [1]. This unique scientific and practical prospect has gradually become a reality, especially since the launch of Sentinel-1 satellites [2]. However, insufficient understanding of the microwave backscattering mechanism is one of the most challenging issues for retrieving highly accurate soil moisture from SAR [3]. A comprehensive understanding of the response of SAR observations to the surface permittivity and geometric properties is key to estimating soil moisture accurately because of the complicity of the interaction between radar observations and soil surface variables, that is, the SAR observations are jointly determined by various surface properties, such as soil moisture, surface roughness, vegetation parameters, and others. Under this background, various surface backscattering models, such as the Integral Equation Model (IEM) [4], Advanced IEM [5], and Oh model [6], have been proposed and widely applied in soil moisture retrieval algorithms. These models serve as key tools that reproduce the radar observation from the surface parameters, quantitatively interpreting the dependence of SAR observations on multiple surface parameters and providing prior information for soil moisture retrieval. However, not all surface parameters of the model equally contribute to the model outputs due to the complicity of the model structure and distinct contribution of the parameters; thus, quantitatively evaluating the effect of each input parameter into the model output is important to understand the model mechanism and hence, to retrieve these parameters by inverting the models.
Over the vegetated surface, the backscattering by the vegetation canopy and the soil surface beneath is much more complicated than that by the soil surface. Thus, modeling vegetated surface backscattering is more difficult. A Water Cloud Model (WCM) is frequently used in vegetation canopy modeling and parameter estimation because it simplifies the complex canopy backscattering process [7,8]. To assess the effects of the surface parameters on the SAR observations, many efforts have been made by using local and/or global Sensitivity Analysis (SA) to identify and quantify parameter sensitivities and screen the influential parameters on SAR observations. However, the effects of soil and vegetation parameters on backscatters under a vegetated surface, which is important to soil moisture retrieval in planted agricultural fields, are still unclear and have not attracted attention. To this end, we analyze the parameter sensitivity of a WCM. Particularly, the canopy backscattering contribution/component in the WCM can be described by various indexes, such as Vegetation Water Content (VWC) or canopy height [9], Normalized Difference Vegetation Index (NDVI) [10], and Leaf Area Index (LAI) [11,12]. However, there is no consensus on the optimal index (or vegetation description scheme) to better describe the vegetation canopy backscattering contribution and best soil moisture retrieval. For example, Kumar et al. [12] demonstrated that the LAI-based descriptor results in the best soil moisture retrieval from C-band SAR, while EI Hajj [13] found that the VWC, LAI, and NDVI resulted in equal accuracy of soil moisture retrievals from X-band SAR. Thus, it is necessary to find an optimal selection of vegetation description schemes for the retrieval of soil moisture. The global SA presented in this paper can rank the parameter importance and hence provide prior knowledge for the optimal selection of vegetation description scheme.
Moreover, as the first free-access high-spatiotemporal-resolution SAR satellite mission, the Sentinel-1 satellites provide an unprecedented opportunity for soil moisture retrieval at an agricultural field scale within a weekly-revisit temporal frame. In addition to the merit of the high spatiotemporal resolution, the incidence angle of Sentinel-1 spans a wide variety of ranges (from 20 to 46 degrees) under different orbit directions (ascending and descending orbit). The dual-polarization (VV+VH or HH+HV) combination is also an important merit of Sentinel-1, which provides an additional option for surface parameter estimation and monitoring. Although plenty of research on the retrieval of soil moisture based on Sentinel-1 observations has been reported, such as the work of Amazirh et al. [14], Ma et al. [15], and Attarzadeh et al. [16], the optimal selection of incidence angle for soil moisture retrieval is still not clear. Previous research found that VV-polarized backscatter is better than VH-polarized backscatter in soil moisture retrieval over agricultural fields [15], but neither discusses the influence of incidence angle on soil moisture retrieval nor discuss the influence of polarization and incidence angle on the estimations of other parameters, such as surface roughness and VWC. Thus, searching for the best incidence angle and polarization for retrieval of soil moisture and other surface parameters is of importance, as is feasibility from the parameter sensitivity aspect.
This paper aims to comprehensively understand the effects of the soil surface and vegetation parameters on backscatters by the vegetation canopy, hence to provide prior information for accurately estimating soil moisture and other surface parameters based on high-resolution Sentinel-1 data at the precision agricultural scale. Specifically, two key issues are addressed: (1) which vegetation description scheme is better to represent the canopy backscattering component in WCM, and (2) which incidence angle (range) and polarization are better for soil moisture retrieval? To answer these questions, an SA of WCM is conducted under two vegetation description schemes proposed by Bindlish and Barros [8] and Park et al. [17], respectively. For each scheme, five SA approaches are deployed to ensure the reasonability of the analysis result. The SA experiments are conducted under various VWC and SAR configurations (in terms of incidence angles and polarization) to select the optimal option for corresponding surface parameter estimation. The parameter Sensitivity Indices (SIs) are quantified for parameter importance ranking. This work advances original knowledge involving the following aspects: (1) the SA is conducted for a coupled soil-vegetation backscattering model that combines a bare soil backscattering model and a canopy backscattering model, and the model embraces two different vegetation description schemes that may influence the forward modeling and surface parameters retrieval; (2) multiple SA methods with different mathematical principles are deployed to ensure the reasonability and reliability of the analysis, which also provides an opportunity to test these methods; and (3) special experiments are designed according to different vegetation description schemes, VWC ranges and the configuration of Sentinel-1 SAR towards a better application of the WCM model and SAR data to precision agriculture.

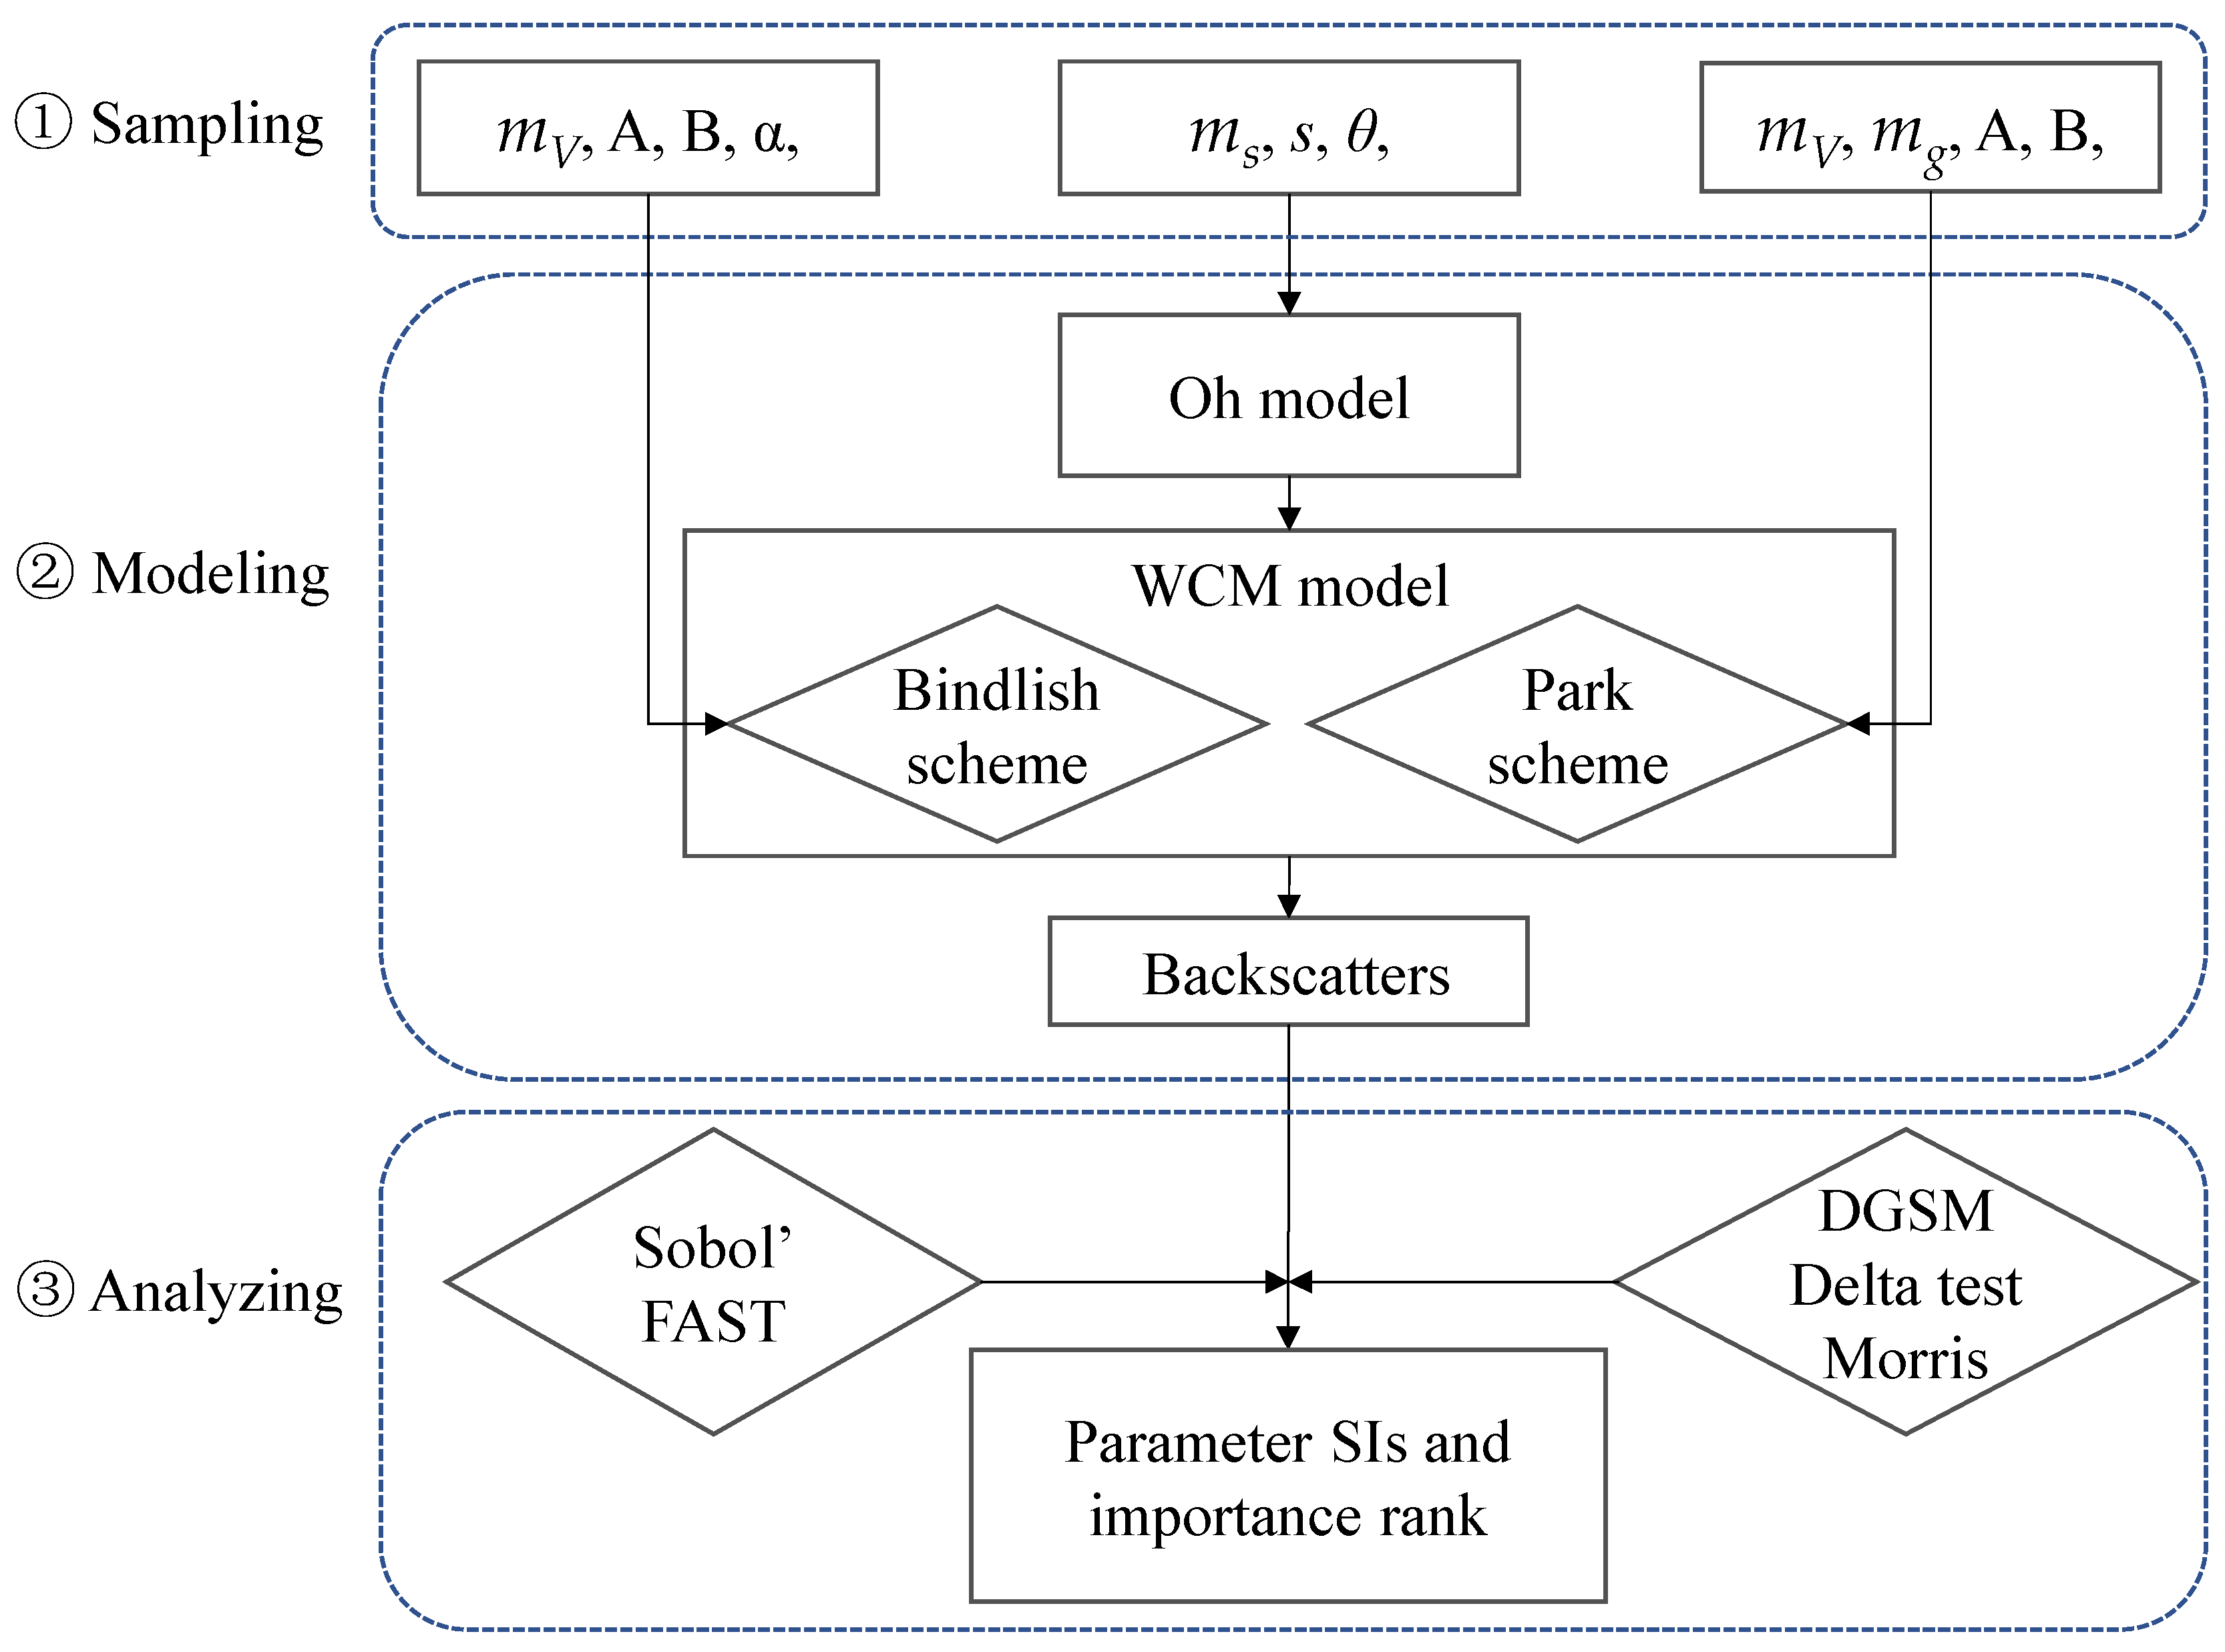
2. Models and Methods

2.1. Backscattering Models

Among many backscattering models for vegetation canopy, the WCM [7] proved to be simple and effective in modeling non-woody vegetation canopy and widely applied in soil moisture retrieval algorithms [15,18]. With consideration of simulating cross-polarized backscatters corresponding to the configuration of Sentinel-1 SAR, this paper used the Oh model [6] (hereinafter called Oh-2004) to simulate bare soil backscatter and to integrate the simulations into WCM.

2.1.1. Oh-2004 Model

The Oh-2004 model [6] is an improved version of a semiempirical backscattering model that was proposed in 2002 [19] based on the physical scattering models and database of ground parameters and airborne scatter meter backscatter over the bare soil surface. The cross-polarized backscatter σ V H 0 , the co-polarized ratio p and cross-polarized ratio q for bare soil surface are formulated as:
σ V H 0 = 0.11 m s 0.7 ( c o s θ ) 2 ( 1 e 0.32 ( k s ) 1.8 )
p = σ H H 0 σ V V 0 = 1 ( θ 90 o ) 0.35 m s 0.65 e 0.4 ( k s ) 1.4
q = σ V H 0 σ V V 0 = 0.095 ( 0.13 + s i n ( 1.5 θ ) ) 1.4 ( 1 e 1.3 ( k s ) 0.9 )
where m s , θ , k ,   s are soil moisture, incidence angle, wave number, and surface roughness, respectively; σ V V 0 and σ H H 0 are the backscatters at vertical and horizontal co-polarization, respectively, and are calculated as:
σ V V 0 = σ V H 0 q
σ H H 0 = p σ V V 0
The model is valid in the condition of ks < 3.5 and ms > 0.068 m3/m3. This is the baseline for determining the ranges of soil moisture and roughness in SA experiments.

2.1.2. Water Cloud Model

The WCM was proposed to describe the backscattering from vegetation canopy, with a general form as:
σ T 0 = σ v 0 + γ 2 σ s 0  
where σ T 0 , σ v 0 and σ s 0 are the total backscatter, contribution of vegetation canopy and that of the soil surface, respectively, and γ 2 is the two-path vegetation attenuation (note that the multiple scattering involving vegetation and soil interaction is not included in the equation because it can be neglected in many cases [17]). The soil contribution is simulated by the Oh-2004 model. The vegetation contribution and the vegetation attenuation are computed as:
σ v 0 = AV 1 ( 1 γ 2 ) c o s θ
γ 2 = e 2 BV 2 / c o s θ
where θ is the incidence angle; A and B are the are empirical parameters depending on the canopy type; V 1 and V 2 are the vegetation descriptors, which are usually described with VWC or canopy height [9], NDVI [10], LAI [11,12] and so forth. A most recent paper by Park et al. [17] demonstrated that particle moisture content and VWC were the best descriptors for V 1 and V 2 , respectively. Thus, we use Park’s scheme as one vegetation description scheme here. Moreover, to account for possible heterogeneity of canopy, Bindlish and Barros [8] introduced a radar-shadow coefficient (α) and parameterized the vegetation contribution σ   v 0 as:
σ   v 0 = AV 1 ( 1 e 2 BV 2 / c o s θ ) ( 1 e α ) c o s θ
In the parameterized model of Bindlish and Barros [8], V 1 = V 2 = VWC   ( denoted   in   m V ) . We called this scheme here the Bindlish scheme. Thus, two σ   v 0 schemes were applied in this paper to analyze their impacts on parameter sensitivity.
To summarize, Table 1 lists the input parameters to be analyzed of the coupled Oh–WCM model and parameter validity range under the two vegetation description schemes. The model under both schemes has 7 parameters to perform SA, of which four are common parameters (ms, s, θ and mV) with the same meaning and ranges. Although parameters A and B have the same meaning under the two schemes, they are with different ranges according to the corresponding references [17] and [8], respectively. The mg under Park scheme denotes the second vegetation descriptor, while α under Bindlish scheme is introduced to describe the radar-shadow.

2.2. Global Sensitivity Analysis Methods

The global SA methods applied in this paper include Sobol’ [21,22], Fourier Amplitude Sensitivity Test (FAST) [23,24,25,26], Derivative based Global Sensitivity Measures (DGSM) [27], Delta test [25,28,29], and Morris methods [30,31], of which FAST and Sobol’ methods are quantitative while the rest are qualitative methods. This section briefly introduces the main principles of the methods.

2.2.1. Sobol’ Method

Sobol’ method is a variance decomposition-based quantitative SA method that can quantify the parameter SIs, including the first-order effect (main sensitivity index, MSI) and total effect (total sensitivity index, TSI), on model outputs [21,22], with the equations of:
M S I i = V i V ( Y ) = V [ E ( Y | X i ) ] V ( Y )
T S I i = V [ E ( Y | X i ) ] V ( Y ) = 1 V i V
where V i , V i and V are the first-order variance, variance without considering the ith parameter, and total variance of the model outputs, respectively; the subscript i refers to all the parameters except parameter i ; the E ( . ) operator represents the mathematic expectation. The relation between V i and V is described as:
V = i = 1 n V i + 1 < i < j < n n V i , j + + V 1 , 2 , n
The second-order sensitivity is therefore formulated as:
S 2 = S i , j = V [ E ( Y | X i , X j ) ] V i V j V ( Y )

2.2.2. FAST Method

The FAST [23,24,25,26] applied here is the new version [32] that combines the merit of the 1973 version [33] and the Sobol’ method [21,22]. Compared to the Sobol’ method, the FAST computes the SIs by scanning the parameter space with periodic functions such that the entire sample space can be analyzed. A multidimensional integration is reduced to 1D integration along a curve by associating each variable with a sampling frequency of the system in the Fourier transform space. Thus, the sampling efficiency of the new FAST is significantly improved. The calculation of SIs (both MSI and TSI) in the FAST method uses the same formulation as the Sobol’ method; detailed information regarding the principle and usage of the FAST method can be found in the literature [23,24,25,26].

2.2.3. DGSM Method

DGSM was initially proposed by Sobol’ regarding linking derivative-based and variance-based SA [27]. The method assumes the differentiable and square-integrable function f ( x 1 ,   x n ) that depends on f / x i as an estimator for the influences of parameter x i on the values of the function. An integral function and the SI are defined in Equations (14) and (15), respectively.
v i = H n ( f / x i ) 2 d x
S i t o t v i σ i 2 D
In both equations, σ i 2 is the variance of x i and D is the model output. Larger values of v i and S i t o t represent the larger sensitivity of the parameters on the model output. However, the former represents a derivative-based sensitivity, and the latter represents a synthetical sensitivity that links the derivative- and variance-based sensitivity. Thus, the S i t o t was applied in this analysis to describe the parameter sensitivity in the coupled Oh–WCM model.

2.2.4. Delta Test Method

The Delta test method is a moment-independent SA method, which is based on the nearest neighbor approach for estimating the variance of the residuals [25,28,29]. The method assumes the residuals of a model function to be independent and identically distributed with a zero mean, and the residual is defined as the difference between the entire model simulations and its subset (S) as:
δ ( S ) = 1 N i = 1 N ( Y i Y N s ( i ) ) 2
where Y i is the model function (here refers to the coupled Oh–WCM model) and N is the sample size; Y N s ( i ) = argmin k i | | X i X k | | 2 denotes the nearest neighbors of ith samples of the parameters.

2.2.5. Morris Method

The Morris method is an efficient SA approach that identifies the influential parameter(s) from those insensitive to the model outputs [31]. The method is based on computing for incremental ratios named elementary effects [30], which is defined as:
d i ( X ) = [ f ( X 1 ,   X i 1 , X i + Δ , X i + 1 , X k ) f ( X ) ] / Δ
where Δ is a value in [1/(p-1),...,1-1/(p-1)], p is the number of levels, X is any selected values in the parameter space. In the coupled Oh–WCM model, X represents the selected values of parameter and f ( X ) represents one of the model outputs. To overcome the limitation of the original methods failing to simultaneously measure the parameter sensitivity, Campolongo et al. [30] proposed a revised measure (μ*) that is sufficient to provide a reliable ranking to estimate the mean of the distribution of the absolute values of the elementary effects. This paper utilized the newly proposed measures (μ*) to describe the parameter SI.

2.3. Design of Experiment

The general workflow of the presented SA experiment consisted of three main steps (Figure 1): sampling, modeling, and analyzing. In the sampling step, the ranges and distributions of the parameters were investigated, and parameter samples were generated within their ranges. Determining the parameters to be analyzed and setting their ranges and distributions are the first key tasks for a global SA. In this analysis, seven parameters were analyzed (see Table 1). Notably here, we regarded all the inputs, including soil and vegetation variables (soil moisture, surface roughness, VWC, particle moisture content), radar configuration parameter (incidence frequency and angle), and empirical parameters in WCM (A, B, and α), as model parameters. The ranges of soil and vegetation parameters were determined according to their physically valid ranges and model validity range. The radar frequency and range of incidence angles were set according to those of the Sentinel-1 configuration, with the incidence angle ranging from 29 to 46 degrees (interferometric wide swath mode) and the frequency being 5.405 GHz. Ranges of parameters A, B, and α were determined according to the corresponding literature of Park et al. [17] and Bindlish and Barros [8]. All parameters were uniformly distributed within the given ranges. Details of parameter ranges and corresponding references are listed in Table 1.
In the modeling step, the generated parameter samples were input into the coupled Oh–WCM model to reproduce SAR backscatter ensembles. Three of the seven parameters (ms, s, θ) were input into the Oh model to reproduce the backscatters of bare soil surface. The rest of the four parameters were directly input into the WCM. Because two different vegetation description schemes were utilized in the WCM, slightly different parameters were used in each scheme (see details in Table 1 and Figure 1).
The analyzing step is the core of the presented global SA, in which the parameter SIs are calculated based on the simulated backscatter ensembles. To systematically evaluate the effects of parameters on the Sentinel-1-like SAR observations, various numeric experiments were performed, and the following four specific issues were addressed: (1) The SA ensuring that the performed SA is reliable and reasonable as the SA results are usually difficult to directly validate. (2) As we introduced in Section 2.1.2, various vegetation descriptors/schemes were applied in WCM and surface parameter retrieval, but there was no consensus on which one was the best descriptor/scheme. (3) Theoretically, the parameters can reach the maximum and minimum values within their validity ranges; however, in the actual surface conditions, their value ranges maybe not be so wide. For example, most mV values fall into the extremely small values range (e.g., close to 0 kg/m2) over a bare to sparsely vegetated surface, while most values may fall into the very large values range (e.g., close to 6 kg/m2) over a densely vegetated surface; thus, how the parameter ranges influence their SIs and ranks needs to be clear. (4) The incidence angle of Sentinel-l SAR can range from 20 to 46 degrees (extra wide swath mode). In soil moisture retrieval practice, the local incidence angles usually need to be normalized to a reference angle; however, no consensus has been reached on which reference incidence angle is most suitable for soil moisture retrieval. Additionally, Sentinel-1 has a dual-polarization configuration (VV+ VH or HH+HV), which provides an opportunity to retrieve surface parameters with multiple channels, but the SIs of parameters on the cross-polarized backscatters (HV, VH) are still not clear and have yet to be reported.
Specifically, the SA experiments were performed with the following considerations: (1) In order to address the reliability issue of the SA results, five global SA methods were exploited to see whether the SA results were consistent with each other. (2) In order to provide information for optimal selection of vegetation description, we respectively conducted SA experiments under the Park scheme and Bindlish scheme, hence suggesting an optimal descriptor towards the retrieval of parameters in future work. (3) In order to address the influence of parameter ranges on their SIs and ranks, an experiment was performed to see the parameter SIs and their importance rank under various VWC ranges, which was expected to provide an implication as to the feasibility of soil moisture retrieval at various surface conditions; the full range of VWC (0–6.0 kg/m2) was artificially divided into four sub-ranges, 0–1.5 kg/m2, 1.5–3.0 kg/m2, 3.0–4.5 kg/m2, 4.5–6.0 kg/m2, and SA tests were conducted under each subrange to see the variation of the parameter SIs. 4) To address the issue of selecting an optimal SAR configuration for parameter estimation, an experiment was designed to search the optimal incidence angle and polarization for key parameters retrieval through analyzing parameter SIs under different polarizations and incidence angles; through changing the incidence angle from 20 to 46 degrees (note this range is set according to the configuration of extra wide swath mode, which is slightly larger than the range of 29 to 46 degrees of interferometric wide mode) with a step of 1 degree, we computed parameter SIs at each incidence angle and observed the changes in them.

3. Results

The results of various SA experiments are presented here. First, the parameter SIs under two vegetation description schemes are presented in Section 3.1 and Section 3.2, respectively. Within each scheme, five SA methods were exploited to ensure that the parameter SIs and their rank derived from different SA methods are reliable. Through comparison of the parameter SIs and their ranks under the two vegetation description schemes, we can judge which vegetation description scheme is better to describe the vegetation backscattering contribution towards the retrieval of soil moisture. Section 3.3 is presented to answer the issues regarding the influence of VWC ranges on parameter SIs. Section 3.4 is presented to check the influence of incidence angle and polarization of Sentinel-1 SAR on parameter SI, hence, to provide suggestions for optimal selection of the SAR configurations for corresponding surface parameter estimation.

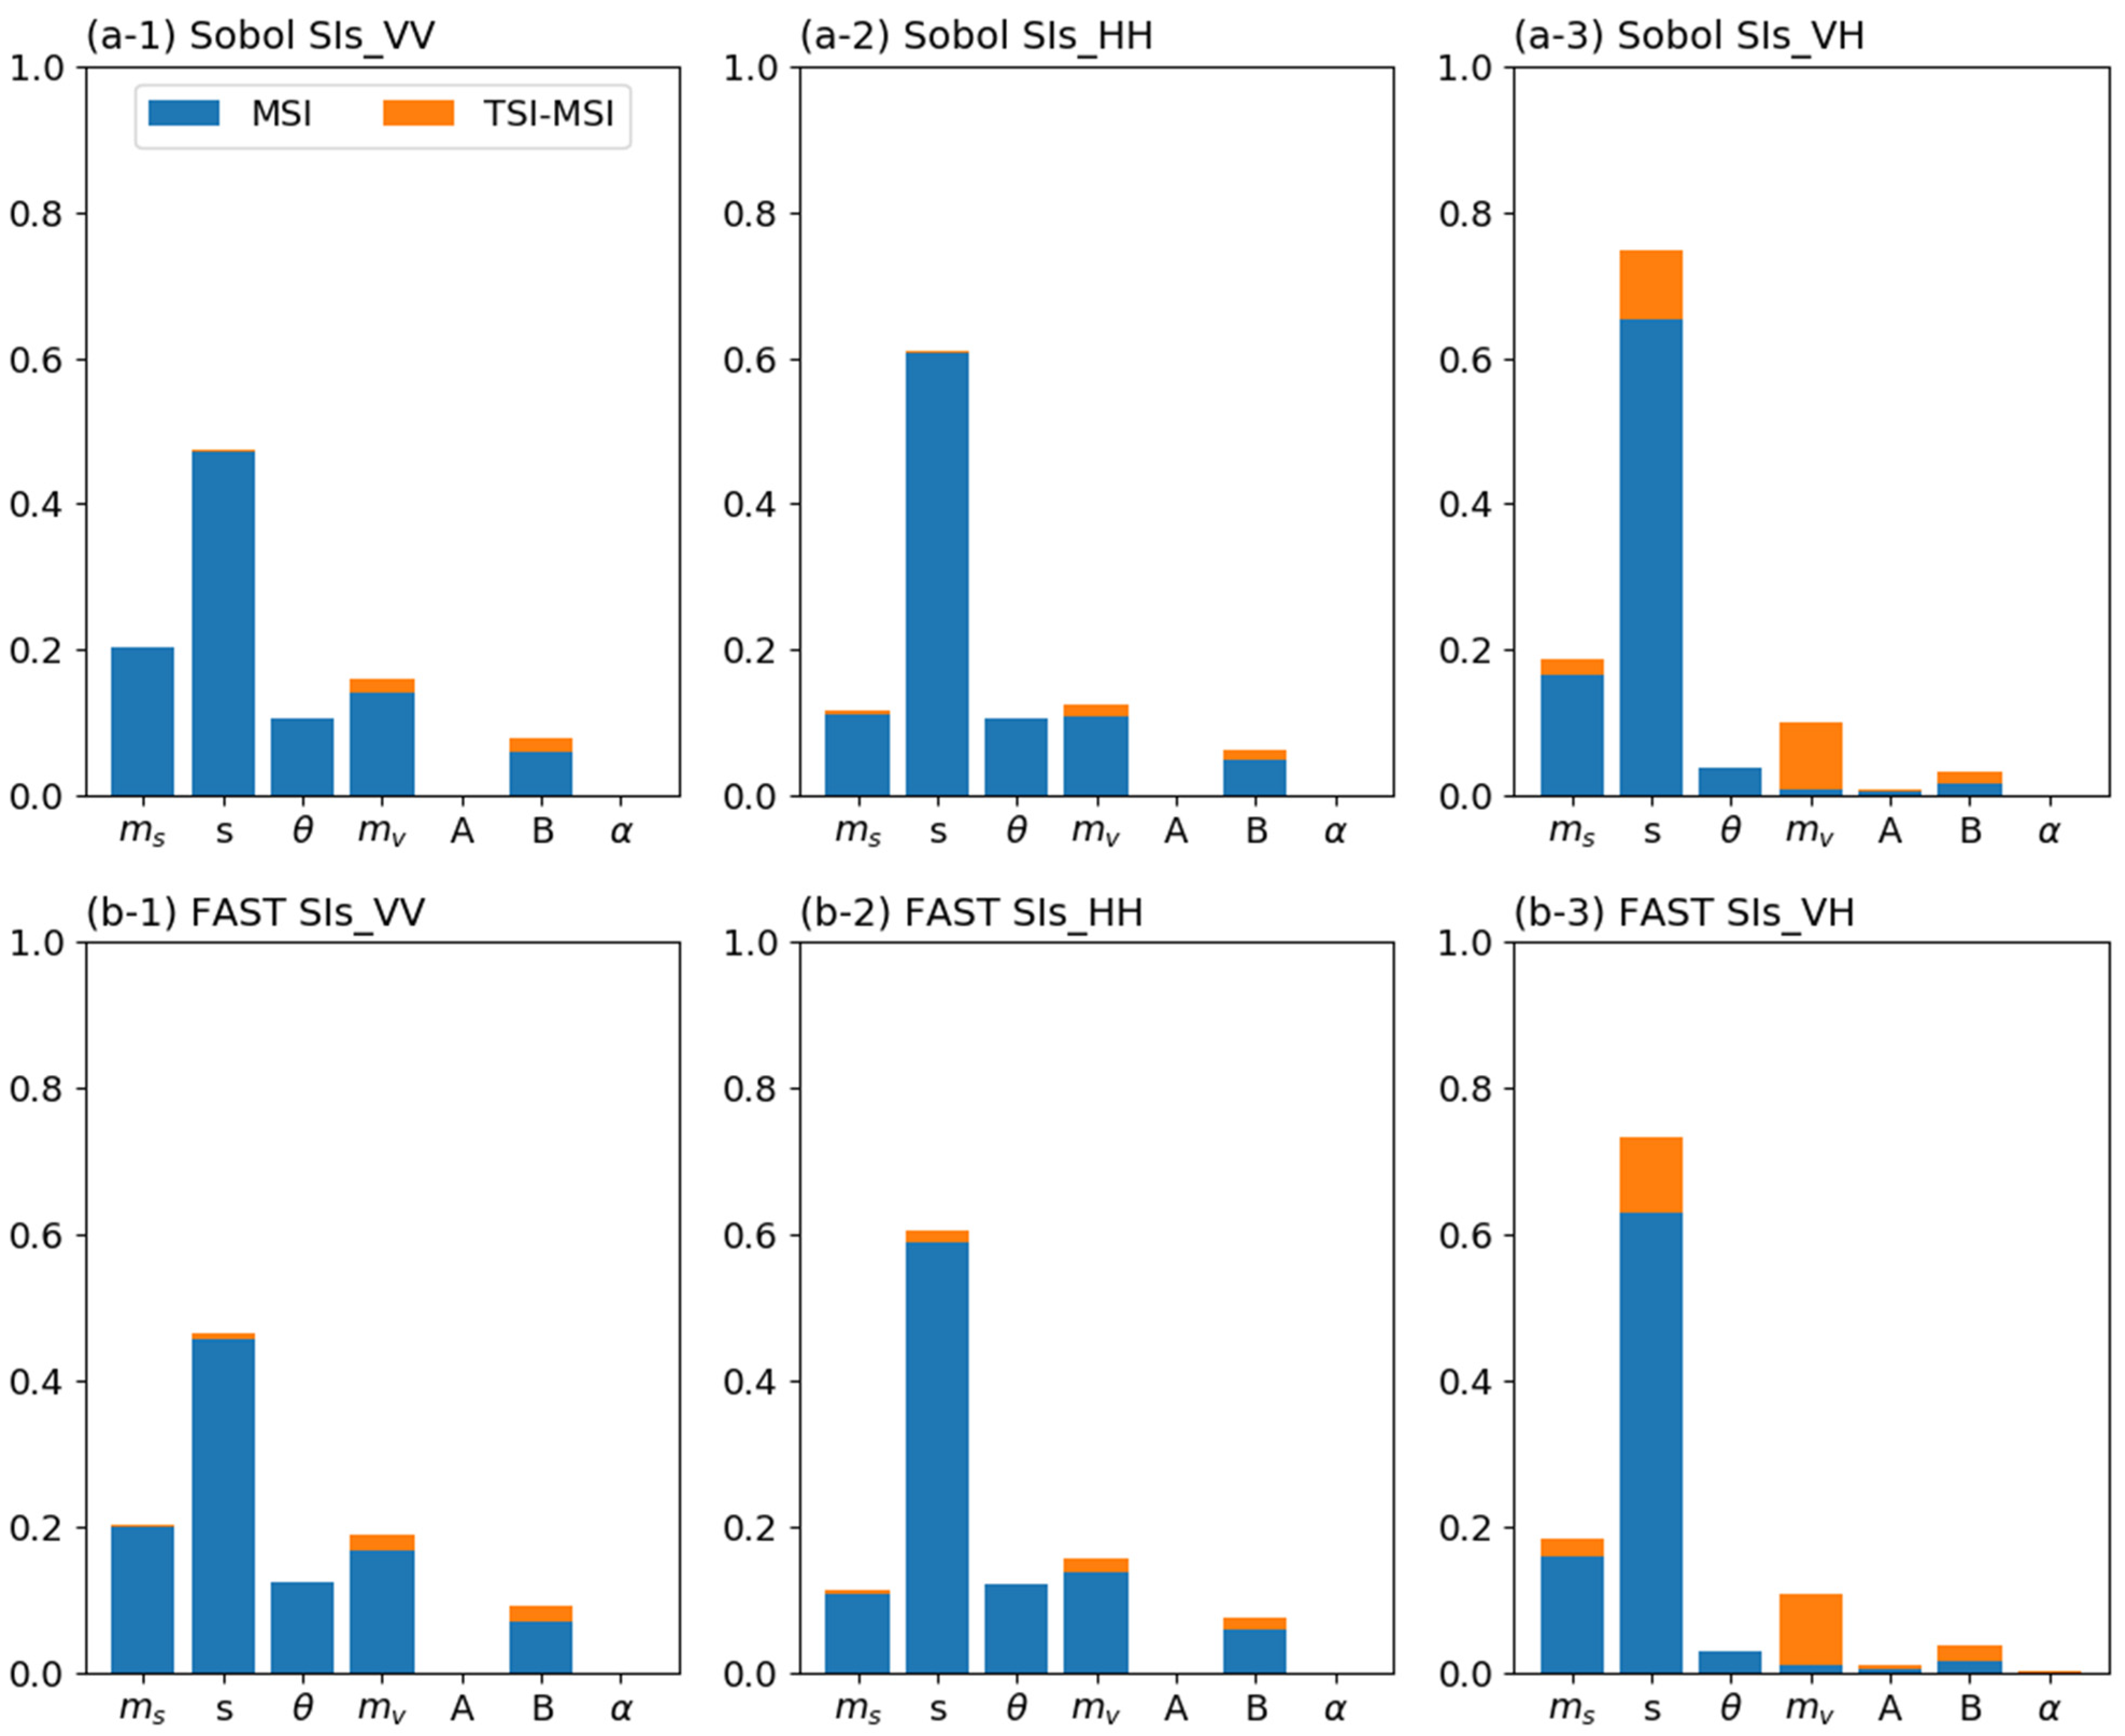
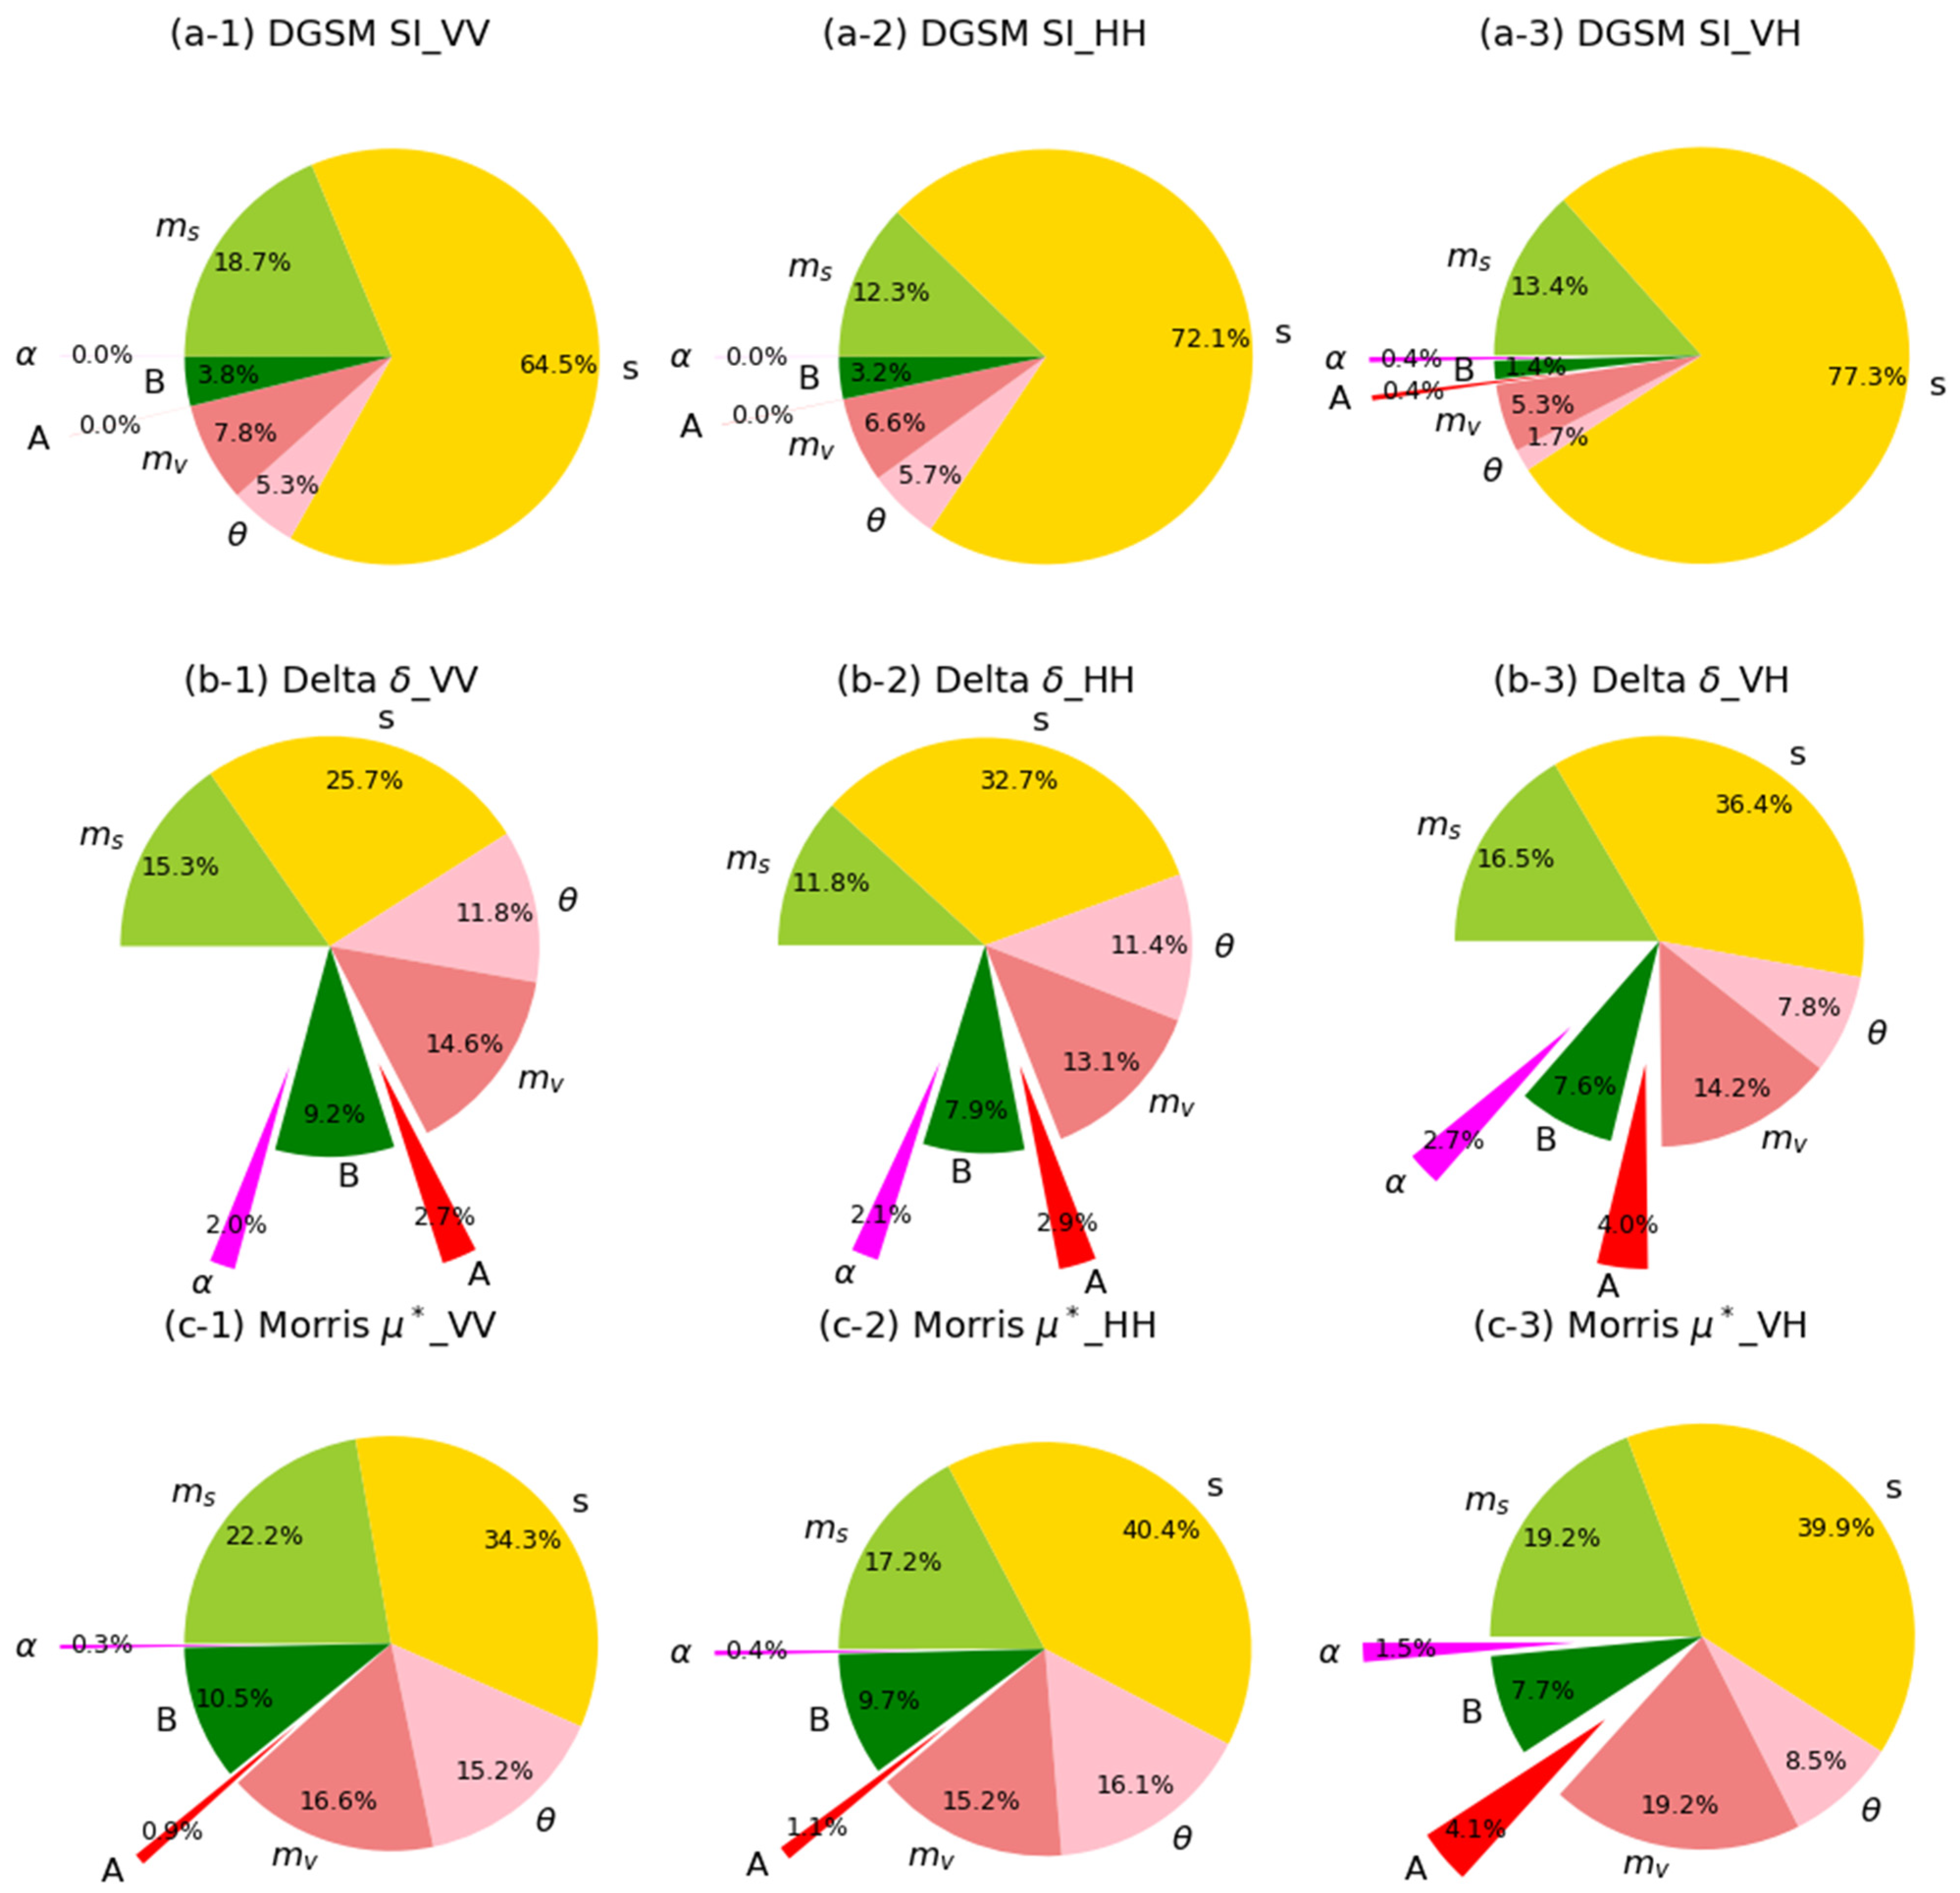
3.1. Parameter SIs under Bindlish Vegetation Description Scheme

Generally, observable differences in SI parameters but highly consistent parameter ranks were shown from five methods under the Bindlish scheme (i.e., V1 = V2 = mV) as shown in Figure 2 and Figure 3, respectively. The two quantitative methods (Sobol’ and FAST, Figure 2) consistently showed that the surface roughness s was the most sensitive parameter to VV-, HH-, and VH-polarized backscatters, with its MSIs to three polarized backscatters greater than 0.45. Soil moisture ms was the second most sensitive parameter. Additionally, soil moisture was more sensitive to VV- than to VH- and HH-polarized backscatters, while roughness was more sensitive to HH- and VH- than to VV-polarized backscatter. These observations are consistent with the previous findings in the SA of AIEM [26]. Following roughness and soil moisture, VWC mV acted as the third sensitive parameter to the backscatters at all three polarizations, with its SIs closed to those of soil moisture. Empirical parameter B was also sensitive, while A and α were insensitive to the backscatter. This observation is consistent with a recent finding of local sensitivity analysis [15]. Under this scheme, almost no interactions between parameters (TSI-MSI) were observed to co-polarized backscatter, except that a small interaction between roughness and VWC was observed to the VH-polarized backscatter. This observation might be potentially helpful for the future application of VH-polarized backscatter in surface roughness and vegetation water content estimation. Relatively, the SIs derived from Sobol’ method were slightly larger than the those derived from the FAST method, but this small difference did not influence the parameter importance rank.
Although three qualitative methods (DGSM, Delta test, and Morris) showed different values of the parameter SIs, they showed high consistency in parameter importance ranks. These ranks were also consistent with those derived from the two quantitative methods (Figure 3). Surface roughness s, soil moisture ms, VWC mV were still the most sensitive parameters to the backscatters at three polarizations. Taking the results of DGSM as an example, the sums of the SIs of s, ms, mV to three polarized backscatters were up to 91%, 91%, and 96%, respectively, which means these parameters absolutely dominate the behavior of the model outputs. All three methods showed that the empirical parameters A and α were the least sensitive parameters to the backscatters, which indicates that they can be set to constant when conducting forward modeling and/or the inversion procedure.
Overall, the high consistency in parameter ranks among the two quantitative and three qualitative methods demonstrated the reliability and reasonableness of the SA results presented here. Additionally, ranks of s and ms in present SA were consistent with previous findings in AIEM SA [26], which can further demonstrate that the presented SA was reliable and reasonable. The relative rank among the empirical parameters A and α was consistent with findings in [15], which suggests that Bindlish’s scheme can reasonably describe the vegetation backscattering components and be helpful for soil moisture retrieval, with parameters A and α being able to be fixed to constant due to their insensitivity to the backscatters.

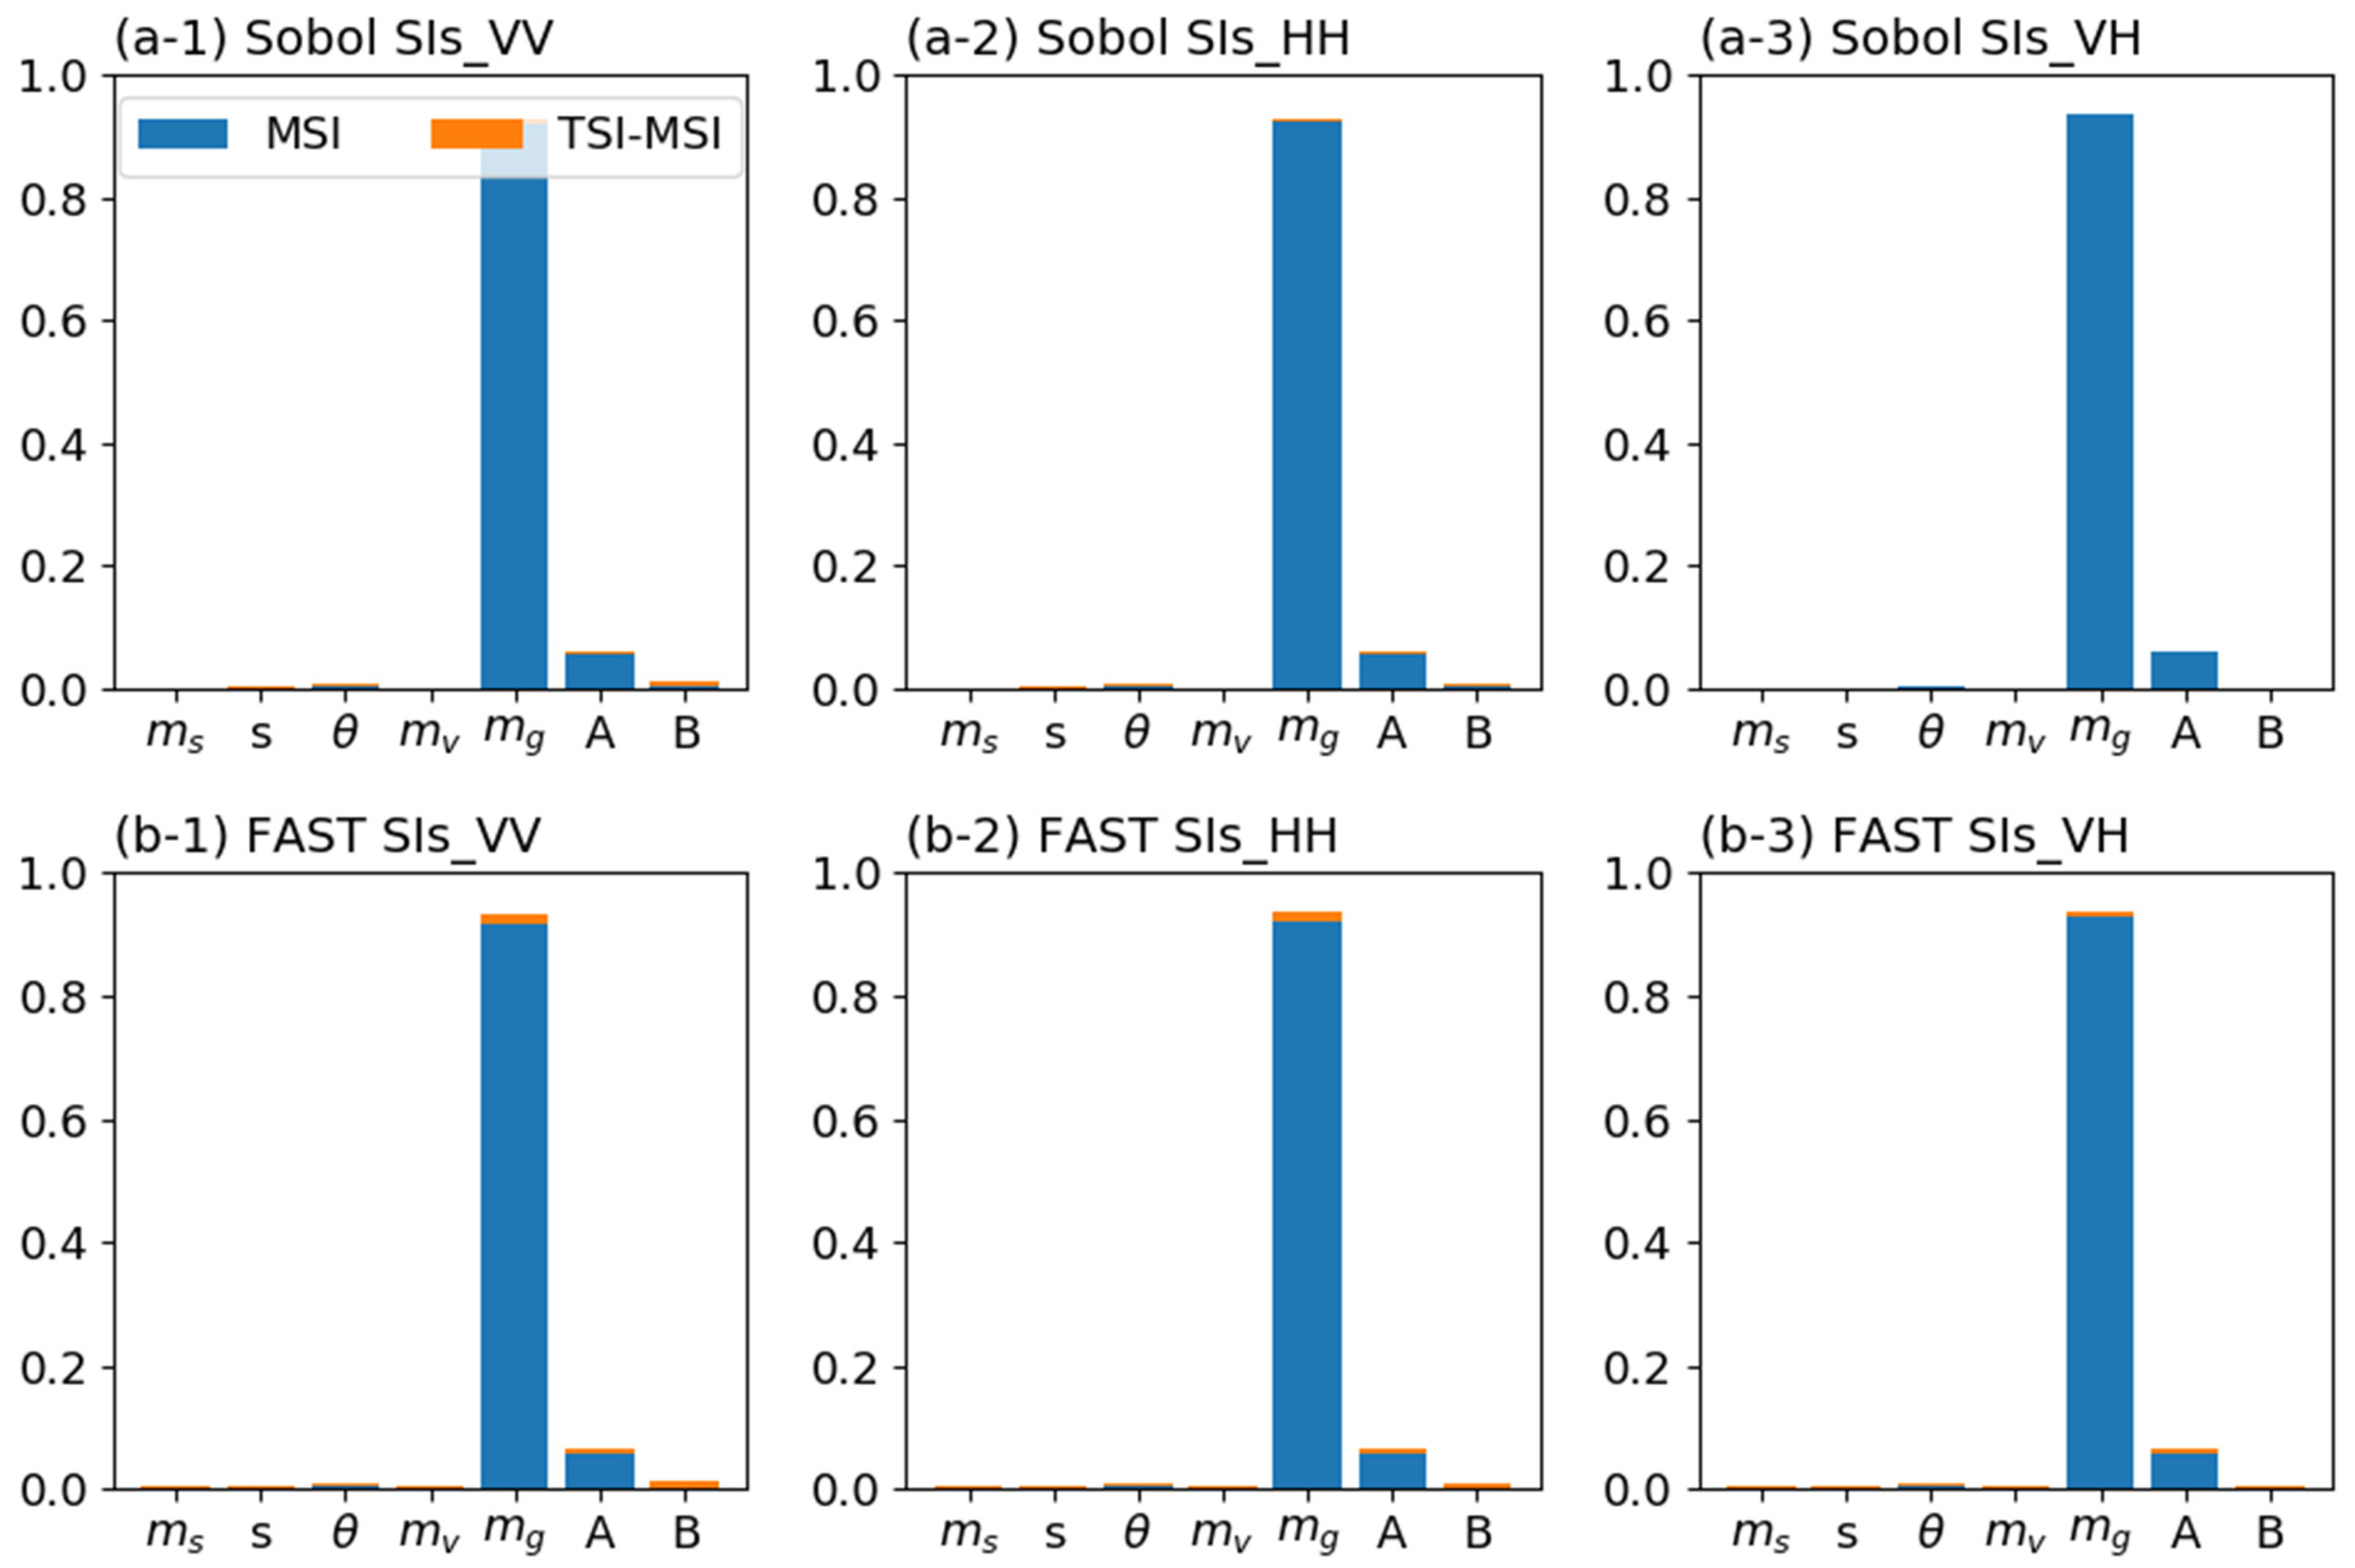
3.2. Parameter SIs under Park Vegetation Description Scheme

Under the Park scheme (i.e., V1 = mg, V2 = mV), the SA results of the two quantitative methods are shown in Figure 4. The vegetation parameter mg dominated the backscatters at all three polarizations, with its MSIs to VV-, HH- and VH-polarized backscatters greater than 0.92 (taking FAST result as an example). The empirical parameter A had a certain sensitivity to the backscatters, while soil moisture ms and roughness s almost had no effects on backscatters. This observation is inconsistent with our existing understanding. In a large vegetation parameter range (0–6 kg/m2 for VWC and 0.1–0.9 g/g for particle moisture content) under the uniform distribution, bare and vegetated soil surface (VWC close to 6) samples can be basically obtained with equal possibility. Leaving the SIs of roughness aside, for the bare and sparsely vegetated surface, soil moisture dominated backscatter, while for the densely vegetated surface, the main contribution of backscatter came from vegetation. In a large VWC range, soil moisture and vegetation parameters (mg and mV) should have similar effects on the backscatters, rather than the effect of vegetation being much greater than that of soil moisture and surface roughness.
As has been shown in the two quantitative methods, the three qualitative methods also consistently showed high sensitivity of mg to the backscatters under the Park scheme (Figure 5). The high consistency in parameter ranks among five methods demonstrated the reliability of the SA result, and this result indicated that the Park vegetation description scheme failed to describe the contribution of the parameters, especially soil moisture and surface roughness, to backscatters.

3.3. Parameter SIs under Varied VWC Ranges

The original range (0.0–6.0 kg/m2) of VWC was artificially divided into four equal sub-ranges, and the parameter SIs under each sub-range was calculated (Table 2). The FAST method, having the merit of Sobol’ method, was used for SIs calculation in this analysis. When the range of VWC was divided into narrow sub-ranges, almost no change was observed in parameter importance rank under both Bindlish and Park vegetation description schemes, e.g., s and ms were always the most sensitive parameters under Bindlish’s scheme. The rank of mV decreased from third- to fourth-place, which is because the range of mV decreased sharply. Although the rank of mV and mg was exchanged under the Park scheme, both parameters were vegetation descriptors, and the contributions of soil moisture and roughness were still rather small.
With the values of VWC increasing, SIs of s and ms decreased under both vegetation description schemes, while SIs of mg under Park scheme and of B under Bindlish scheme increased dramatically. This means that the valuation range of VWC can influence the SIs of itself and other parameters. Such decreasing in SIs of s and ms and increasing in SIs of mg can be easily understood. In the smaller value region of VWC (e.g., VWC in 0–1.5 kg/m2), the backscatters can be dominated by soil surface parameters s and ms, and vegetation parameters (e.g., mV) had limited/no effect on the backscatters. On the contrary, when the surface was fully covered by dense vegetation (e.g., VWC in 4.5–6.0 kg/m2), the effect of soil surface parameters gradually decreased, and that of vegetation parameters increased.
Notably, s and ms rank second and third, respectively, when VWC was less than 1.5 kg/m2, under Park scheme, and mg ranked fifth. However, when VWC was greater than 1.5 kg/m2, mg ranked first, while s and ms ranked the last two positions. The range of VWC strongly influenced the contribution of the soil surface and vegetation canopy to the backscatters. Too much influence of mg with almost no effect of soil surface parameter to backscatters should not be the real backscattering processing over sparsely vegetated and/or bare soil surface. This issue may lead to a failure of the Park scheme for modeling the backscatters at a low-to-mid frequency (e.g., P-, L-, and C-band) because the sparse vegetation canopy can be penetrated by the low-to-mid frequency microwave, and the soil surface can be sensed.

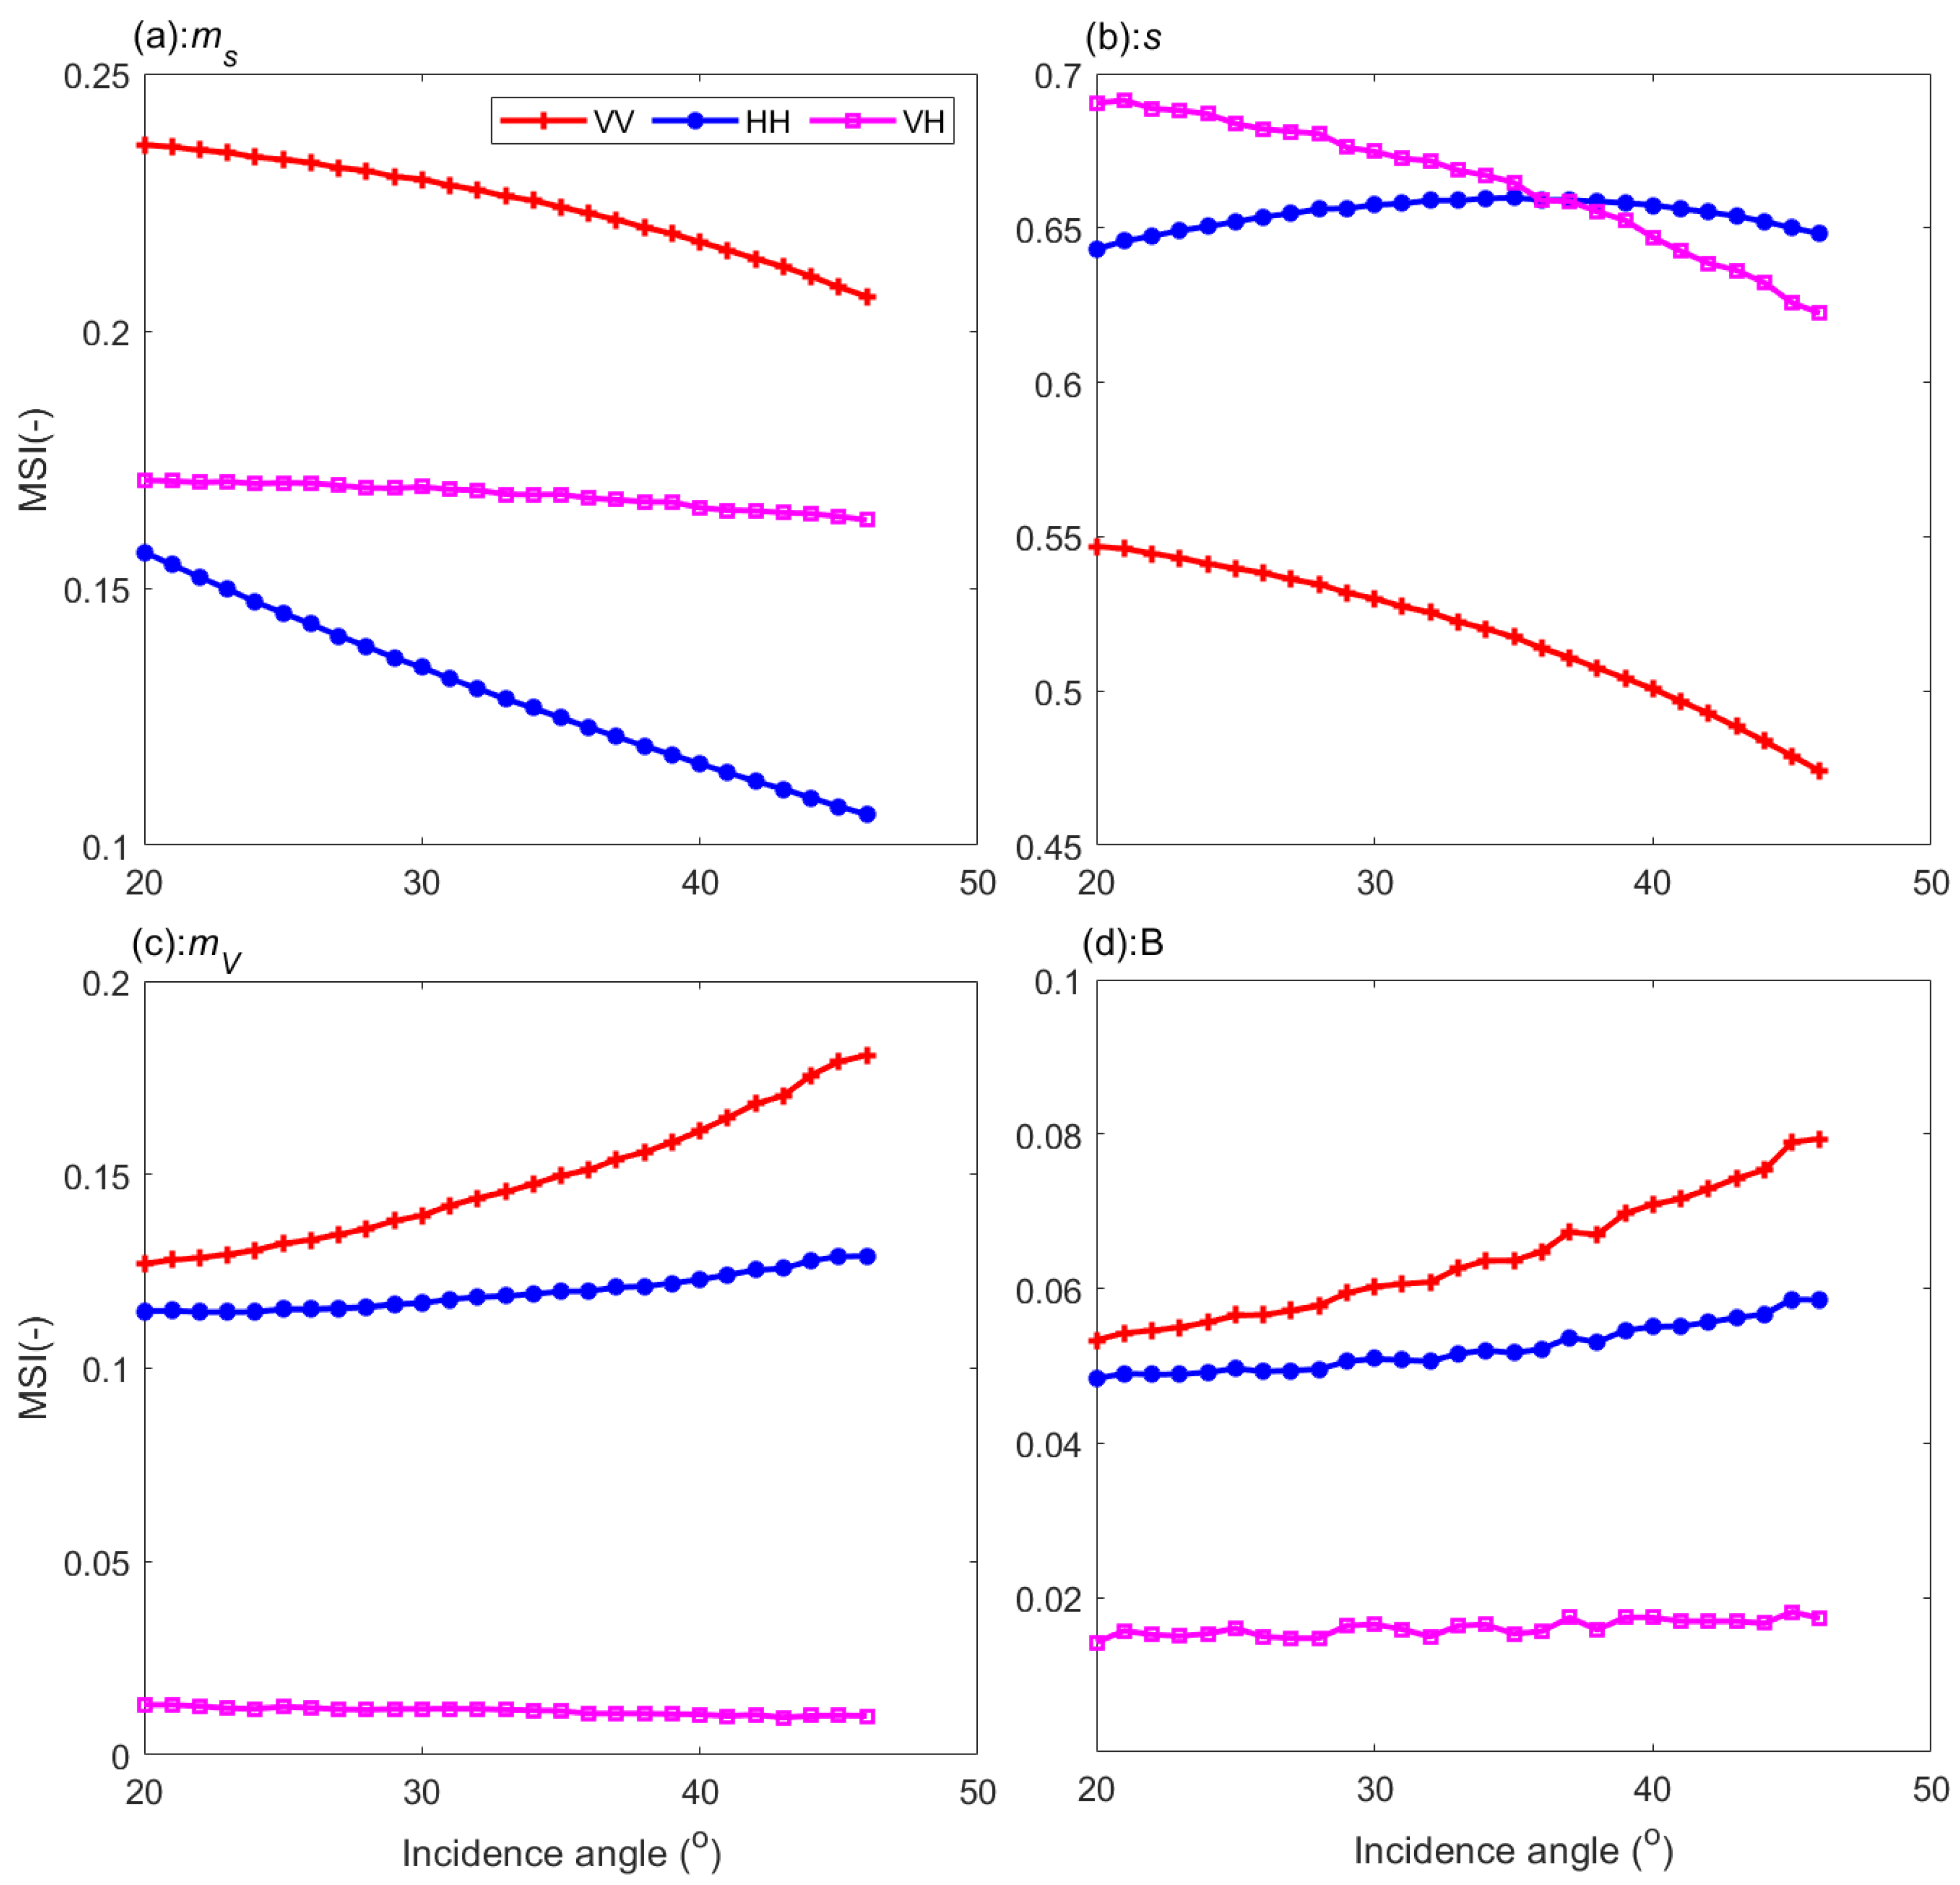
3.4. Parameter SIs on Different Incidence Angles and Polarizations

In view of the findings in Section 3.1 and Section 3.2 that the Bindlish vegetation description scheme can better describe the backscattering characteristics over the vegetated surface, the discussion of the influences of incidence angle and polarization on parameter SIs in this analysis is conducted under the Bindlish scheme. Parameter MSIs were computed based on FAST method due to its advantage in combining the merits of the original FAST and Sobol’ method. Variation of the four most sensitive parameters (ms, s, mV, B) MSIs with the changing of incidence angle was analyzed here to search for the optimal incidence angle for surface variable estimation (Figure 6).
In addition to the previous observation that soil moisture was more sensitive to VV- than to VH-polarized backscatter and more sensitive to VH- than to HH-polarized backscatter, we observed here that the sensitivity of soil moisture to all three polarized backscatters decreased as the incidence angle increased (Figure 6a). Relatively, the decrease in MSIs of soil moisture to VV- and HH-polarized backscatters were more significant than that to VH-polarized backscatter. This means that when VV- and HH-polarized backscatters are applied for soil moisture retrieval, it is better to use the backscatters at a smaller incidence angle, while when VH-polarized backscatter is used for soil moisture retrieval, the incidence angle has a limited effect on the performance of the retrieval.
The MSIs of s to VV- and VH-polarized backscatters decreased dramatically as incidence angle increased (Figure 6b), while MSI of s to HH-polarized backscatters did not show a significant decrease with increasing of incidence angle. The MSI of s to VH-polarized backscatter was larger than both that to HH- and VV-polarized backscatter at small incidence angles, but MSI of s to VH-polarized backscatter became smaller than that to HH-polarized backscatter when the incidence angle was larger than 37 degrees. Surface roughness s was most sensitive to VH-polarized backscatter at incidence angles less than 37 degrees, while it is most sensitive to HH-polarized backscatter at incidence angles greater than 37 degrees. This observation provides an optionable opportunity for surface roughness estimation from VH- and HH-polarized backscatters at varied incidence angles.
The MSIs of mV and B to VV- and HH-polarized backscatters increased as incidence angle increased, while that to VH-polarized backscatter did not show an increase or decrease (Figure 6c,d). Both mV and B were most sensitive on VV-polarized backscatter, followed by HH- and had almost no effect on VH-polarized backscatters. These observations indicate that VWC and B can be better estimated by using VV-polarized backscatter at a greater incidence angle.

4. Discussion

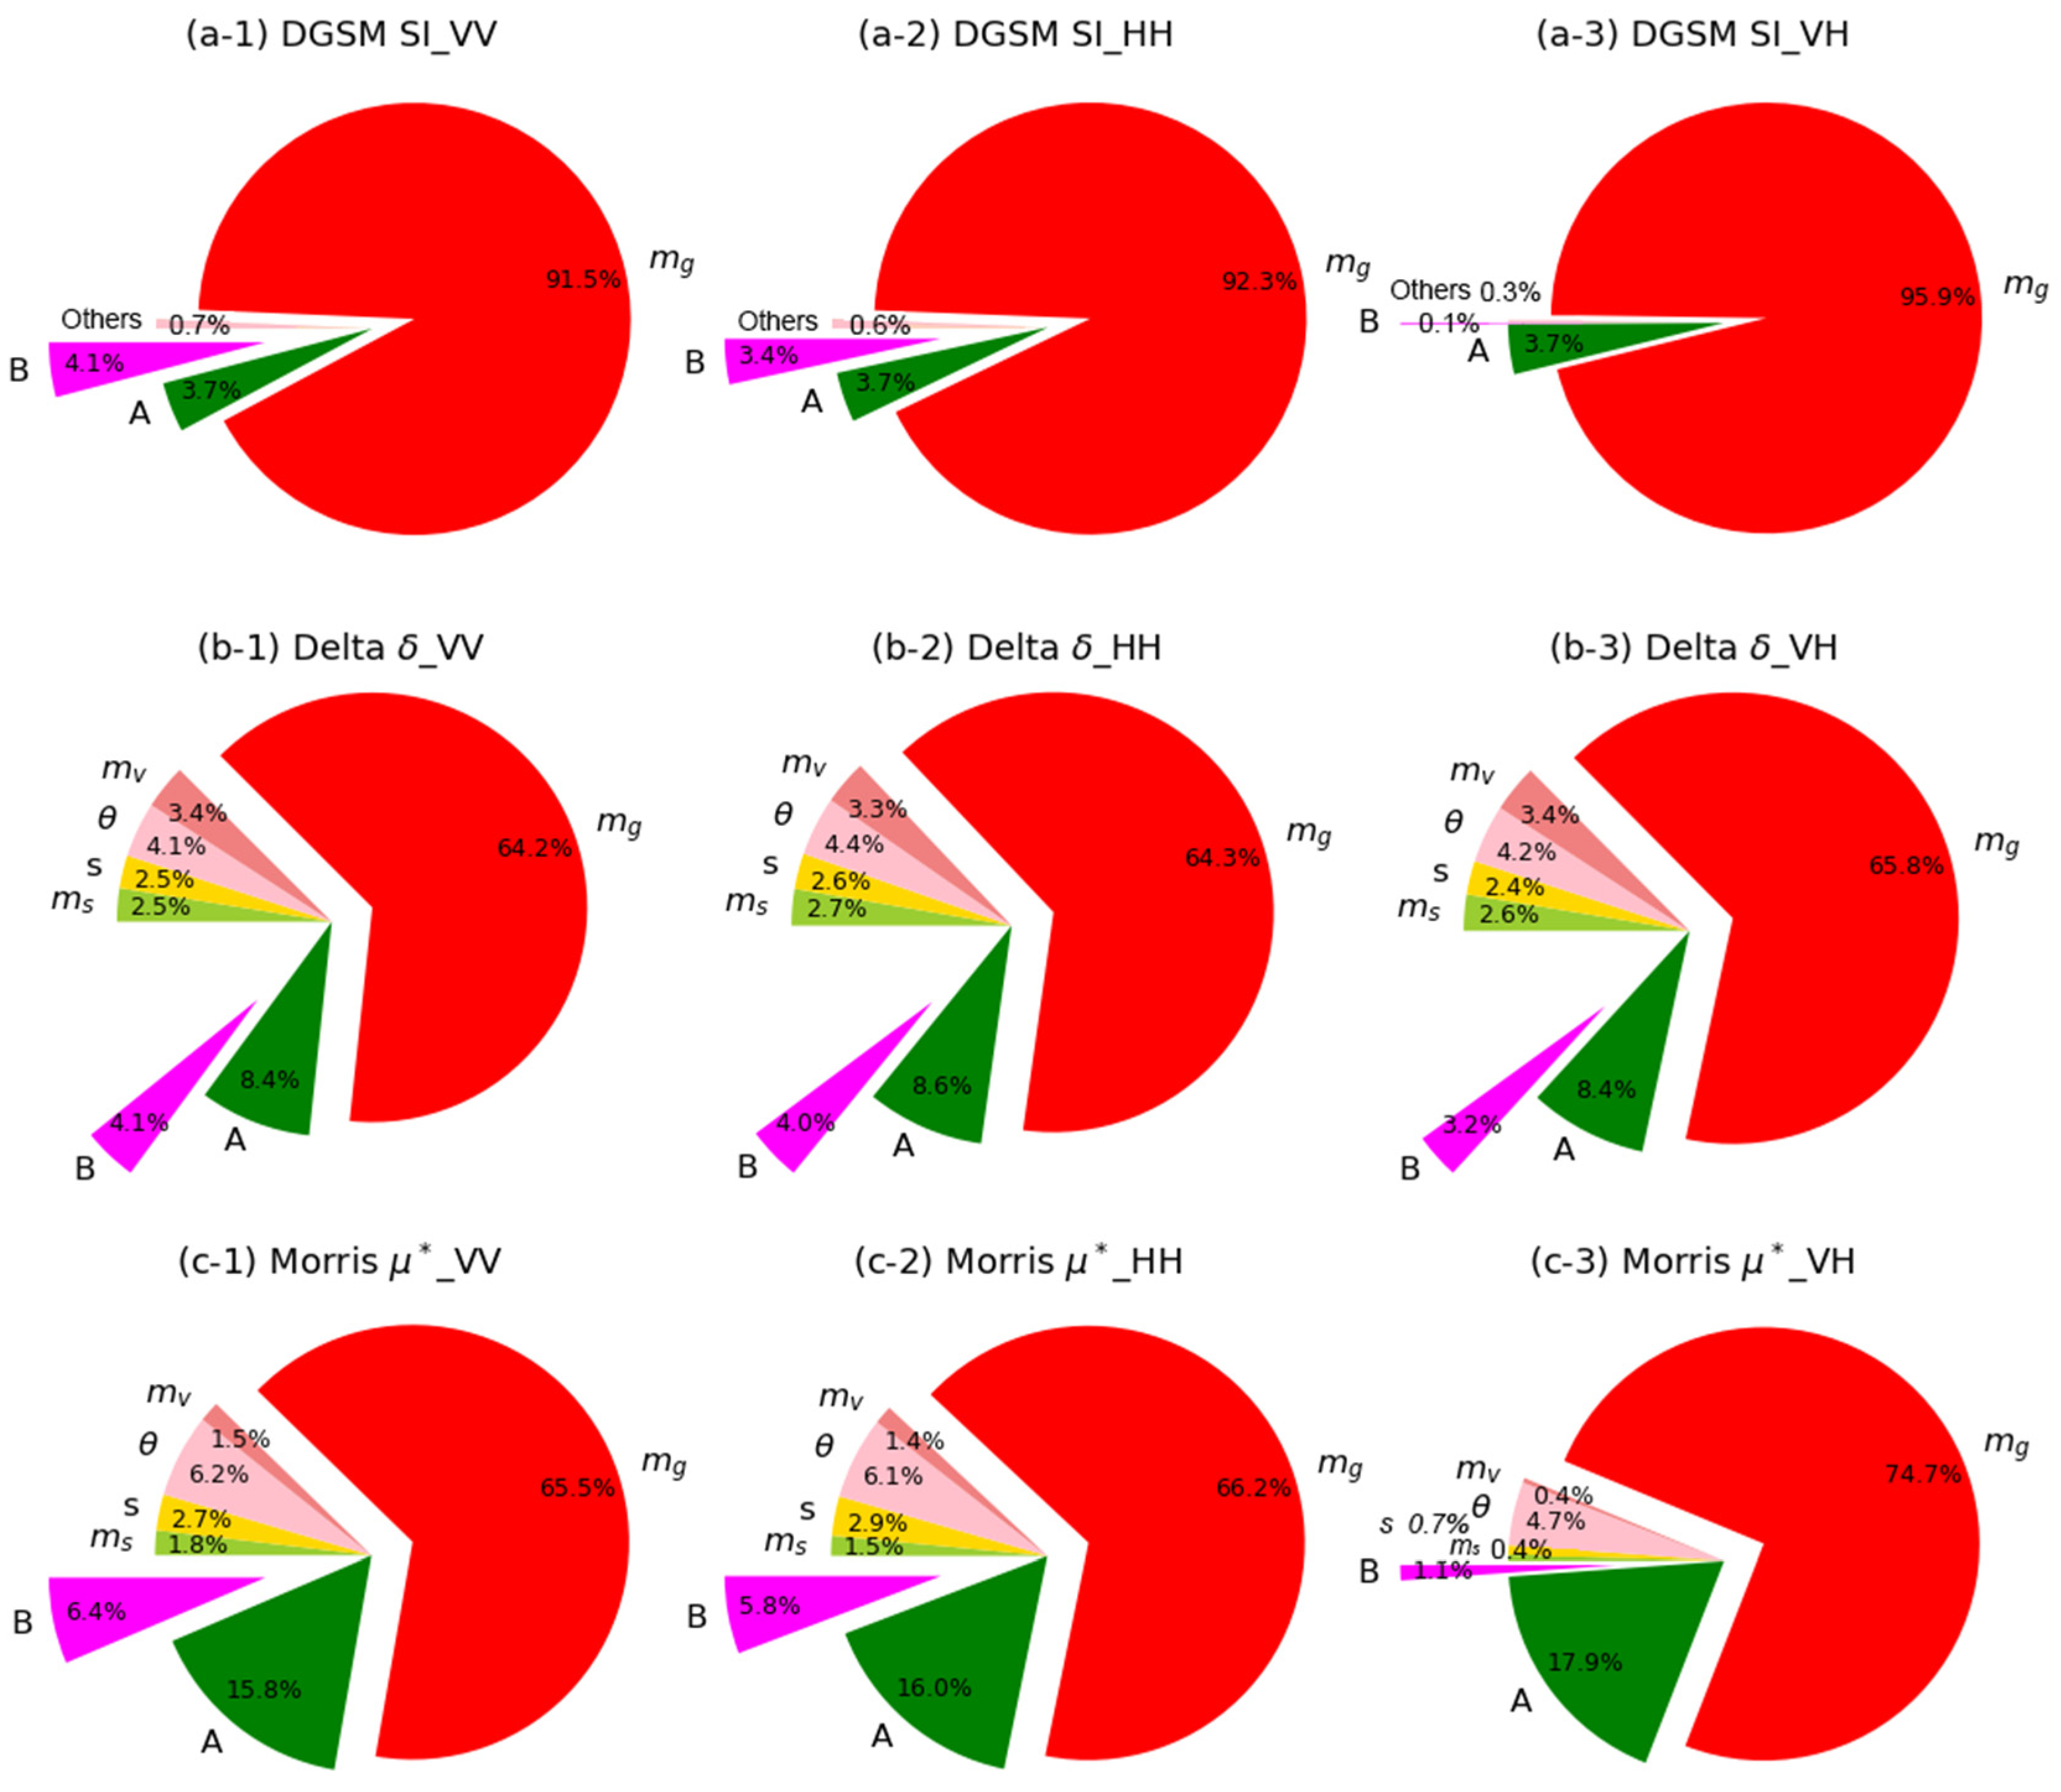
4.1. SA with Multiple Methods

The results of SA, especially those of global SA for complicated non-linear models, are usually hard to directly validate, which makes it challenging to ensure the reasonability and reliability of the SI parameters and their importance ranks. However, several indirect approaches can be utilized to validate the reliability of the SA results. (1) Referring to the previous knowledge from literature is often the most intuitive method. For example, the finding that the surface roughness is the most sensitive to the SAR backscatters has been extensively reported in previous research papers [26,34,35,36], which could provide a reference for our present results (e.g., Figure 2, Figure 3, Figure 4 and Figure 5). (2) Comparing with the local SA-based results can also provide evidence for global SA results; that is, one can judge the local sensitivity of an independent variable by observing the slope of the dependent variable against the independent variable. However, some local method-based SA results in previous research showed that soil moisture is more sensitive to HH- polarized than to VV-polarized backscatter [37]. Nevertheless, most recent global SA research reported the opposite results, i.e., soil moisture is more sensitive to VV- than to HH-polarized backscatter [26,34,35]. The results presented in this paper showed that soil moisture is more sensitive to VV- that to HH-polarized backscatter, which is supported by the findings in [26,34,35]. Thus, not all the local methods can be utilized to support the results of the global SA methods.
Here we utilized multiple global SA methods to estimate the parameter sensitivity. Since the methods were with different mathematic principles, we can demonstrate that the present SA is reasonable if most methods derive the same parameter importance ranks. Five methods derived identical parameter importance ranking, enabling a reasonable SA result. The derived parameter importance rank is also partly supported by the previous findings [26], i.e., surface roughness is the most sensitive parameter to the backscatters, and soil moisture stands at the second most sensitive parameter position. Parameter (especially the vegetation and empirical parameters in WCM) SIs on VH-polarized backscatter were estimated, and their ranks were witnessed to be identical based on different SA methods. To the best knowledge of the authors, this is the first attempt on the global SA of soil, vegetation, and empirical parameters on cross-polarized backscatters, so it cannot be validated by using previous references, and application of multiple SA methods is a feasible option. Therefore, ensemble application of multiple SA methods to estimate parameter sensitivity cannot only test the SA methods themselves but also ensure the reasonability and reliability of the SA result through comparison with each other.

4.2. Vegetation Descriptors for WCM

Describing the backscatter component of vegetation canopy in WCM has long been an important research topic in model improvement and application. Various descriptors or description schemes are reported, but no consensus has been reached on the best descriptor/scheme. The present SA provides a feasible approach to identify the optimal descriptor through quantifying the parameter sensitivity. Taking the Park and Bindlish schemes as examples, this paper demonstrated that the Bindlish scheme is reasonable to describe the vegetation backscatter components, while the Park scheme unreasonably exaggerates the effect of particle moisture content on the backscatters at multiple polarizations. The reason why we drew this inference is due first to the parameter results derived under the Bindlish scheme being partly supported by previous findings in [26,34,35,36]. Second and more generally, over bare to vegetated crop field (i.e., VWC ranges from 0 to 6.0 kg/m2), both soil and vegetation parameters had an equal possibility to affect the backscatter at C-band that can penetrate across the canopy and sense the soil surface, i.e., the backscatter cannot be controlled only by the vegetation canopy without being affected by the soil parameters. Notably, only two description schemes are discussed in this paper, which impossibly concluded the best description by exhausting all descriptions. However, we provide here an SA-based approach to select the optimal vegetation description scheme for WCM.

4.3. Optimal SAR Configuration for Parameter Estimaiton

The present SA provides an approach to select optimal SAR configuration for surface parameter estimation. In addition to reiterating the previous statement that HH-polarized backscatter is better than VV-polarized backscatter in surface roughness retrieval [26,34,35,36], this paper also found that the cross-polarized backscatter at incidence angle less than 37 degrees was more sensitive than HH- polarized backscatter to surface roughness, which indicates that surface roughness can also be estimated by VH-polarized backscatter at the smaller incidence angle.
In retrieval of soil moisture using SAR observations, the local incidence angle is usually normalized into a reference angle to improve the performance of the retrieval algorithm. For example, Bauer-Marschallinger et al. [38] normalized the local incidence angle into 40 degrees, while Zribi et al. [39] normalized the local incidence angle into 30 degrees. Obviously, it is not clear how to select the optimal reference angle, nor is the principle behind the selection of reference angle clear. The SA provides an option to address this issue. The presented analysis for the influence of incidence angle on parameter SIs demonstrated that backscatters at the smaller incidence angle were better than those at the larger incidence angle to estimate soil moisture and surface roughness, while those at larger incidence angle were better to estimate VWC and parameter B. This observation can be partly supported by findings in [35].

4.4. Implication for Backscattering Modeling and Parameter Estimation

In microwave forward modeling and surface parameter estimation, an SA is an important step to understand the mechanism and process of backscattering and/or emission. For forward modeling, an SA provides information for the simplification and calibration of the backscattering/emission models [25,26]. Through SA, the sensitive and insensitive parameters were identified, and their importance was ranked. The sensitive parameters that dominate the model behavior should be carefully calibrated or estimated, and the insensitive parameters can be fixed as constant, and hence reduce the number of the parameters and simplify the model. The presented SA on the coupled Oh–WCM model suggests that surface roughness, soil moisture, vegetation water content, and empirical parameter B are sensitive to the backscatters and should be carefully estimated, while empirical parameters A and α can be set to constant. Moreover, an additional suggestion provided by the presented SA for the WCM is the selection of an optimal vegetation description scheme. Overall, the presented SA informs the calibration/simplification and optimal vegetation description scheme of coupled Oh–WCM model.
For parameter estimation, an SA can inform the retrievability of the parameters from SAR backscatters. If a parameter is identified as sensitive to backscatters, it can be easily estimated based on backscatters. On the contrary, if a parameter is not influential to the backscatters, it is hard to retrieve it from the backscatters. The more sensitive a parameter is to SAR backscatters, the higher its retrievability. The presented SA not only identifies the most influential parameter to backscatters but also the relative sensitivity under different vegetation description schemes, incidence angle, and polarization. This can be regarded as the relative retrievability from the parameter estimation aspect.

5. Conclusions

Enormous efforts have been made to estimate high-resolution soil moisture from SAR observations, but there are no SAR-based soil moisture products at global scale available to date, partly due to the unavailability of SAR data and partly due to the insufficient understanding of the effects of surface parameters on the SAR backscatters. The release of Sentinel-1 SAR data has alleviated the issue of data unavailability and the introduction of the global SA method to analyzing the sensitivity of bare soil parameters on microwave backscatters has improved our understanding of the backscattering properties over bare soils. Nonetheless, issues remain regarding the understanding of the parameter effects on vegetated surface backscatters and the optimal configuration of the SAR for soil moisture retrieval. Thus, this paper presented an analysis to quantify the sensitivity of the surface parameters, especially those of the vegetation parameters, on the backscatters over the vegetated surface. To comprehensively understand the relations between backscatters and vegetated surface parameters, the Oh model was integrated into the WCM. To ensure the reasonability and reliability of the SA, five global SA methods were simultaneously exploited. We also identified the optimal vegetation description scheme in WCM and optimal configuration (incidence angle and polarization) of Sentinel-1 SAR for the estimation of surface parameters according to their sensitivity indices.
Various numerical experiments based on five SA methods were conducted, and an improved understanding of the parameter effects on backscatters was drawn. Five methods resulted in a fully identical parameter rank, which demonstrated that the SA presented here is reasonable and reliable. By comparing vegetation description schemes proposed in Park et al. [17] and Bindlish and Barros [8], we found that the descriptor of VWC was better than the combination of VWC and particle moisture content for describing the vegetation canopy backscatters. Under this scheme, we found that surface roughness, soil moisture, VWC, and empirical parameter B were the most sensitive parameters on the backscatters. Part of this observation is well supported by the previous findings in Ma et al. [26], Bai et al. [34], Zeng and Chen [35]. We also found that soil moisture and surface roughness were more sensitive on VV- and VH- polarized backscatters at small incidence angles than at larger incidence angles, indicating that they can be well estimated by backscatters at smaller incidence angles, while VWC and B were more sensitive on VV-polarized backscatter at larger incidence and roughness was more sensitive on HH-polarized backscatter at larger incidence.

Author Contributions

Conceptualization, C.M. and S.W.; methodology, C.M. and H.M.; formal analysis, C.M., S.W. and Z.Z.; writing—original draft preparation, C.M.; writing—review and editing, C.M., S.W. and Z.Z.; visualization, C.M. and Z.Z.; funding acquisition, C.M. and S.W. All authors have read and agreed to the published version of the manuscript.

Funding

This research was jointly funded by the National Science and Technology Major project of China’s High Resolution Earth Observation System (21-Y20B01-9001-19/22), the National Natural Science Foundation of China under grants 42130113, 41971305 and 41701418, and the CAS “Light of West China” Program.

Acknowledgments

The authors would like to thank two anonymous reviewers for their constructive suggestions and comments.

Conflicts of Interest

The authors declare no conflict of interest.

Acronyms

AIEMAdvanced Integral Equation Model
DGSMDerivative based Global Sensitivity Measures
FASTFourier Amplitude Sensitivity Test
IEMIntegral Equation Model
LAILeaf Area Index
MSIMain Sensitivity Index
NDVINormalized Difference Vegetation Index
SASensitivity Analysis
SISensitivity Index
SARSynthetic Aperture Radar
TSITotal Sensitivity Index
WCMWater Cloud Model
VWCVegetation Water Content

References

  1. Hornacek, M.; Wagner, W.; Sabel, D.; Truong, H.L.; Snoeij, P.; Hahmann, T.; Diedrich, E.; Doubkova, M. Potential for High Resolution Systematic Global Surface Soil Moisture Retrieval via Change Detection Using Sentinel-1. IEEE J. Sel. Top. Appl. Earth Obs. Remote Sens. 2012, 5, 1303–1311. [Google Scholar] [CrossRef]
  2. Torres, R.; Snoeij, P.; Geudtner, D.; Bibby, D.; Davidson, M.; Attema, E.; Potin, P.; Rommen, B.; Floury, N.; Brown, M.; et al. GMES Sentinel-1 mission. Remote Sens. Environ. 2012, 120, 9–24. [Google Scholar] [CrossRef]
  3. Ma, C.; Li, X.; Chen, K.-S. The Discrepancy Between Backscattering Model Simulations and Radar Observations Caused By Scaling Issues: An Uncertainty Analysis. IEEE Trans. Geosci. Remote Sens. 2019, 57, 5356–5372. [Google Scholar] [CrossRef]
  4. Fung, A.K.; Li, Z.Q.; Chen, K.S. Backscattering from a Randomly Rough Dielectric Surface. IEEE Trans. Geosci. Remote Sens. 1992, 30, 356–369. [Google Scholar] [CrossRef]
  5. Chen, K.S.; Wu, T.-D.; Tsang, L.; Li, Q.; Shi, J.; Fung, A.K. Emission of Rough Surfaces Calculated by the Integral Equation Method With Comparison to Three-Dimensional Moment Method Simulations. IEEE Trans. Geosci. Remote Sens. 2003, 41, 90–101. [Google Scholar] [CrossRef]
  6. Oh, Y. Quantitative retrieval of soil moisture content and surface roughness from multipolarized radar observations of bare soil surfaces. IEEE Trans. Geosci. Remote Sens. 2004, 42, 596–601. [Google Scholar] [CrossRef]
  7. Attema, E.P.W.; Ulaby, F.T. Vegetation Modeled as a Water Cloud. Radio Sci. 1978, 13, 357–364. [Google Scholar] [CrossRef]
  8. Bindlish, R.; Barros, A.P. Parameterization of vegetation backscatter in radar-based, soil moisture estimation. Remote Sens. Environ. 2001, 76, 130–137. [Google Scholar] [CrossRef]
  9. Sikdar, M.; Cumming, I. A modified empirical model for soil moisture estimation in vegetated areas using SAR data. In Proceedings of the Igarss 2004: IEEE International Geoscience and Remote Sensing Symposium, Anchorage, AK, USA, 20–24 September 2004; Volume 1–7, pp. 803–806. [Google Scholar]
  10. Baghdadi, N.; El Hajj, M.; Zribi, M.; Bousbih, S. Calibration of the Water Cloud Model at C-Band for Winter Crop Fields and Grasslands. Remote Sens. 2017, 9, 969. [Google Scholar] [CrossRef] [Green Version]
  11. Dabrowska-Zielinska, K.; Inoue, Y.; Kowalik, W.; Gruszczynska, M. Inferring the effect of plant and soil variables on C- and L-band SAR backscatter over agricultural fields, based on model analysis. Adv. Space Res. 2007, 39, 139–148. [Google Scholar] [CrossRef]
  12. Kumar, K.; Rao, H.P.S.; Arora, M.K. Study of water cloud model vegetation descriptors in estimating soil moisture in Solani catchment. Hydrol. Process. 2015, 29, 2137–2148. [Google Scholar] [CrossRef]
  13. Hajj, M.E. Soil moisture retrieval over irrigated grassland using X-band SAR data. Remote Sens. Environ. 2016, 176, 202–218. [Google Scholar] [CrossRef] [Green Version]
  14. Amazirh, A.; Merlin, O.; Er-Raki, S.; Gao, Q.; Rivalland, V.; Malbeteau, Y.; Khabba, S.; Escorihuela, M.J. Retrieving surface soil moisture at high spatio-temporal resolution from a synergy between Sentinel-1 radar and Landsat thermal data: A study case over bare soil. Remote Sens. Environ. 2018, 211, 321–337. [Google Scholar] [CrossRef]
  15. Ma, C.; Li, X.; McCabe, M.F. Retrieval of High-Resolution Soil Moisture through Combination of Sentinel-1 and Sentinel-2 Data. Remote Sens. 2020, 12, 2303. [Google Scholar] [CrossRef]
  16. Attarzadeh, R.; Amini, J.; Notarnicola, C.; Greifeneder, F. Synergetic Use of Sentinel-1 and Sentinel-2 Data for Soil Moisture Mapping at Plot Scale. Remote Sens. 2018, 10, 1285. [Google Scholar] [CrossRef] [Green Version]
  17. Park, S.E.; Jung, Y.T.; Cho, J.H.; Moon, H.; Han, S.H. Theoretical Evaluation of Water Cloud Model Vegetation Parameters. Remote Sens. 2019, 11, 894. [Google Scholar] [CrossRef] [Green Version]
  18. Liu, C.Z.; Shi, J.C. Estimation of Vegetation Parameters of Water Cloud Model for Global Soil Moisture Retrieval Using Time-Series L-Band Aquarius Observations. IEEE J. Sel. Top. Appl. Earth Obs. Remote Sens. 2016, 9, 5621–5633. [Google Scholar] [CrossRef]
  19. Oh, Y.; Sarabandi, K.; Ulaby, F.T. Semi-empirical model of the ensemble-averaged differential Mueller matrix for microwave backscattering from bare soil surfaces. IEEE Trans. Geosci. Remote Sens. 2002, 40, 1348–1355. [Google Scholar] [CrossRef] [Green Version]
  20. Gao, Y.; Walker, J.P.; Allahmoradi, M.; Monerris, A.; Ryu, D.; Jackson, T.J. Optical Sensing of Vegetation Water Content: A Synthesis Study. IEEE J. Sel. Top. Appl. Earth Obs. Remote Sens. 2015, 8, 1456–1464. [Google Scholar] [CrossRef] [Green Version]
  21. Sobol, I.M. Global sensitivity indices for nonlinear mathematical models and their Monte Carlo estimates. Math. Comput. Simul. 2001, 55, 271–280. [Google Scholar] [CrossRef]
  22. Sobol’, I.M. Sensitivity estimates for nonlinear mathematical models. Math. Model. Comput. Exp. 1993, 14, 407–414. [Google Scholar]
  23. Wang, Z.; Che, T.; Liou, Y.-A. Global Sensitivity Analysis of the L-MEB Model for Retrieving Soil Moisture. IEEE Trans. Geosci. Remote Sens. 2016, 54, 2949–2962. [Google Scholar] [CrossRef]
  24. Wang, J.; Li, X.; Lu, L.; Fang, F. Parameter sensitivity analysis of crop growth models based on the extended Fourier Amplitude Sensitivity Test method. Environ. Model. Softw. 2013, 48, 171–182. [Google Scholar] [CrossRef]
  25. Ma, C.; Li, X.; Wang, J.; Wang, C.; Duan, Q.; Wang, W. A Comprehensive Evaluation of Microwave Emissivity and Brightness Temperature Sensitivities to Soil Parameters Using Qualitative and Quantitative Sensitivity Analyses. IEEE Trans. Geosci. Remote Sens. 2017, 55, 1025–1038. [Google Scholar] [CrossRef]
  26. Ma, C.; Li, X.; Wang, S. A Global Sensitivity Analysis of Soil Parameters Associated With Backscattering Using the Advanced Integral Equation Model. IEEE Trans. Geosci. Remote Sens. 2015, 53, 5613–5623. [Google Scholar]
  27. Sobol, I.M.; Kucherenko, S. Derivative based global sensitivity measures and their link with global sensitivity indices. Math. Comput. Simul. 2009, 79, 3009–3017. [Google Scholar] [CrossRef]
  28. Plischke, E.; Borgonovo, E.; Smith, C.L. Global sensitivity measures from given data. Eur. J. Oper. Res. 2013, 226, 536–550. [Google Scholar] [CrossRef]
  29. Borgonovo, E. A new uncertainty importance measure. Reliab. Eng. Syst. Saf. 2007, 92, 771–784. [Google Scholar] [CrossRef]
  30. Campolongo, F.; Cariboni, J.; Saltelli, A. An effective screening design for sensitivity analysis of large models. Environ. Model. Softw. 2007, 22, 1509–1518. [Google Scholar] [CrossRef]
  31. Morris, M.D. Factorial Sampling Plans for Preliminary Computational Experiments. Technometrics 1991, 33, 161–174. [Google Scholar] [CrossRef]
  32. Saltelli, A.; Tarantola, S.; Chan, K.P.-S. A Quantitative Model-Independent Method for Global Sensitivity Analysis of Model Output. Glob. Sensit. Anal. Model Output 1999, 41, 39–56. [Google Scholar] [CrossRef]
  33. Cukier, R.; Fortuin, C.; Shuler, K.E.; Petschek, A.; Schaibly, J. Study of the sensitivity of coupled reaction systems to uncertainties in rate coefficients. I Theory. J. Chem. Phys. 1973, 59, 3873–3878. [Google Scholar] [CrossRef]
  34. Bai, X.; Zeng, J.; Chen, K.; Li, Z.; Zeng, Y.; Wen, J.; Wang, X.; Dong, X.; Su, Z. Parameter Optimization of a Discrete Scattering Model by Integration of Global Sensitivity Analysis Using SMAP Active and Passive Observations. IEEE Trans. Geosci. Remote Sens. 2019, 57, 1084–1099. [Google Scholar] [CrossRef]
  35. Zeng, J.; Chen, K. Theoretical Study of Global Sensitivity Analysis of L-Band Radar Bistatic Scattering for Soil Moisture Retrieval. IEEE Geosci. Remote Sens. Lett. 2018, 15, 1710–1714. [Google Scholar] [CrossRef]
  36. Baghdadi, N.; Holah, N.; Zribi, M. Soil moisture estimation using multi-incidence and multi-polarization ASAR data. Int. J. Remote Sens. 2006, 27, 1907–1920. [Google Scholar] [CrossRef]
  37. Holah, N.; Baghdadi, N.; Zribi, M.; Bruand, A.; King, C. Potential of ASAR/ENVISAT for the characterization of soil surface parameters over bare agricultural fields. Remote Sens. Environ. 2005, 96, 78–86. [Google Scholar] [CrossRef] [Green Version]
  38. Bauer-Marschallinger, B.; Freeman, V.; Cao, S.; Paulik, C.; Schaufler, S.; Stachl, T.; Modanesi, S.; Massari, C.; Ciabatta, L.; Brocca, L. Toward global soil moisture monitoring with Sentinel-1: Harnessing assets and overcoming obstacles. IEEE Trans. Geosci. Remote Sens. 2018, 57, 520–539. [Google Scholar] [CrossRef]
  39. Zribi, M.; Kotti, F.; Amri, R.; Wagner, W.; Shabou, M.; Lili-Chabaane, Z.; Baghdadi, N. Soil moisture mapping in a semiarid region, based on ASAR/Wide Swath satellite data. Water Resour. Res. 2014, 50, 823–835. [Google Scholar] [CrossRef] [Green Version]
Figure 1. Flowchart of the presented global SA procedure.
Remotesensing 13 03889 g001
Figure 2. Parameter SIs from the two quantitative methods (Sobol’ and FAST) under Bindlish vegetation description scheme. MSI and TSI-MSI represent the first-order effect (main sensitivity index, MSI) and the difference between total effect (total sensitivity index, TSI) and MSI, respectively.
Remotesensing 13 03889 g002
Figure 3. Parameter SIs from the three qualitative methods (DGSM, Delta test, and Morris) under Bindlish vegetation description scheme. The SIs are represented by SI, δ, and μ*, respectively.
Remotesensing 13 03889 g003
Figure 4. Parameter SIs from the two quantitative methods (Sobol’ and FAST) under the Park vegetation description scheme. MSI and TSI-MSI in Sobol’ and FAST methods represent the first-order effect (main sensitivity index, MSI) and the difference between total effect (total sensitivity index, TSI) and MSI.
Remotesensing 13 03889 g004
Figure 5. Parameter SIs from the three qualitative methods (DGSM, Delta test, and Morris) under the Park vegetation description scheme. The SIs are represented by SI, δ, and μ*, respectively.
Remotesensing 13 03889 g005
Figure 6. Variations of parameter MSIs with incidence angle and polarization.
Remotesensing 13 03889 g006
Table 1. Parameters in the coupled Oh–WCM model and their ranges for SA.
SchemesParameterMeaning (Unit)RangesReference
Park:
V1 = mg
V2 = mV
mssoil moisture (m3/m3)0.05–0.50[8]
srms of surface height (cm)0.2–3.1[8]
θincidence angle(degree)29–46Sentinel-1
mVvegetation water content (VWC, kg/m2)0.1–6.0[20]
mgparticle moisture content (g/g)0.0–0.9[17]
Acanopy type parameter0.05–0.13[17]
Bcanopy type parameter0.34–1.12[17]
Bindlish
V1 = mV
V2 = mV
mssoil moisture (m3/m3)0.05–0.50[8]
srms of surface height (cm)0.2–3.1[8]
θincidence angle (degree)29–46Sentinel-1
mVVWC (kg/m2)0.1–6.0[20]
Acanopy type parameter0.0009–0.0018[8]
Bcanopy type parameter0.032–0.138[8]
αradar-shadow coefficient1.29–10.6[8]
Table 2. Parameter SIs under different ranges of VWC (kg/m2).
Scheme SIs (MSI/TSI) and Rank
Range1
(0.0–1.5)
Range2
(1.5–3.0)
Range3
(3.0–4.5)
Range4
(4.5–6.0)
MSITSIRankMSITSIRankMSITSIRankMSITSIRank
Parkms0.1530.18230.0120.02570.0010.01170.0000.0057
s0.2050.24320.0200.04660.0020.01260.0000.0105
θ0.0850.09460.0340.04840.0100.01940.0050.0103
mV0.2540.34110.0260.05250.0010.00950.0000.0066
mg0.1230.20750.6570.75310.8570.89310.9100.9251
A0.0090.01870.0410.04930.0580.06520.0590.0652
B0.1320.20440.1030.16720.0220.05730.0040.0194
Bindlishms0.2560.25920.2500.25220.2270.23020.2040.2102
s0.6000.61310.5740.58610.5140.52610.4570.4721
θ0.1020.10330.1060.10730.1220.12330.1380.1403
mV0.0100.01140.0150.01750.0090.01150.0080.0105
A0.0000.00060.0000.00060.0000.00160.0010.0026
B0.0050.00750.0510.05340.0950.09740.2180.2244
α0.0000.00070.0000.00070.0000.00170.0000.0017
Publisher’s Note: MDPI stays neutral with regard to jurisdictional claims in published maps and institutional affiliations.

