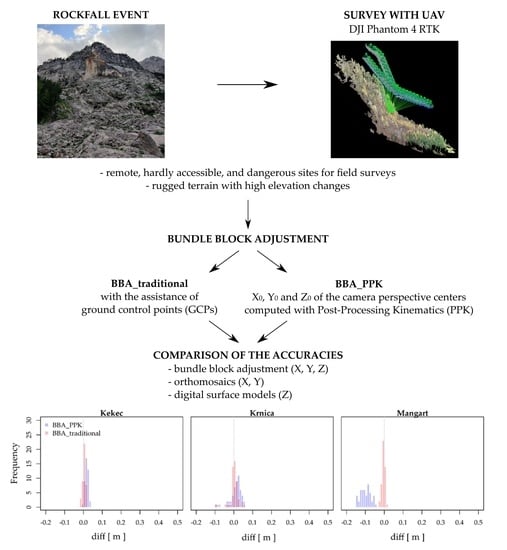
Article

Accuracy Assessment of UAV-Photogrammetric-Derived Products Using PPK and GCPs in Challenging Terrains: In Search of Optimized Rockfall Mapping

Department of Forestry and Forest Renewable Resources, Biotechnical Faculty, University of Ljubljana, Večna pot 83, 1000 Ljubljana, Slovenia
*
Author to whom correspondence should be addressed.
Remote Sens. 2021, 13(19), 3812; https://doi.org/10.3390/rs13193812
Submission received: 1 July 2021 / Revised: 14 September 2021 / Accepted: 18 September 2021 / Published: 23 September 2021
(This article belongs to the Special Issue Remote Sensing for Rock Slope and Rockfall Analysis)

Abstract

:
Unmanned aerial photogrammetric surveys are increasingly being used for mapping and studying natural hazards, such as rockfalls. Surveys using unmanned aerial vehicles (UAVs) can be performed in remote, hardly accessible, and dangerous areas, while the photogrammetric-derived products, with high spatial and temporal accuracy, can provide us with detailed information about phenomena under consideration. However, as photogrammetry commonly uses indirect georeferencing through bundle block adjustment (BBA) with ground control points (GCPs), data acquisition in the field is not only time-consuming and labor-intensive, but also extremely dangerous. Therefore, the main goal of this study was to investigate how accurate photogrammetric products can be produced by using BBA without GCPs and auxiliary data, namely using the coordinates X0, Y0 and Z0 of the camera perspective centers computed with PPK (Post-Processing Kinematic). To this end, orthomosaics and digital surface models (DSMs) were produced for three rockfall sites by using images acquired with a DJI Phantom 4 RTK and the two different BBA methods mentioned above (hereafter referred to as BBA_traditional and BBA_PPK). The accuracy of the products, in terms of the Root Mean Square Error (RMSE), was computed by using verification points (VPs). The accuracy of both BBA methods was also assessed. To test the differences between the georeferencing methods, two statistical test were used, namely a paired Student’s t-test, and a non-parametric Wilcoxon signed-rank. The results show that the accuracy of the BBA_PPK is inferior to that of BBA_traditional, with the total RMSE values for the three sites being 0.056, 0.066, and 0.305 m, respectively, compared to 0.019, 0.036 and 0.014 m obtained with BBA_traditional. The accuracies of the BBA methods are reflected in the accuracy of the orthomosaics, whose values for the BBA_PPK are 0.039, 0.043 and 0.157 m, respectively, against 0.029, 0.036 and 0.020 m obtained with the BBA_traditional. Concerning the DSM, those produced with the BBA_PPK method present accuracy values of 0.065, 0.072 and 0.261 m, respectively, against 0.038, 0.060 and 0.030 m obtained with the BBA_traditional. Even though that there are statistically significant differences between the georeferencing methods, one can state that the BBA_PPK presents a viable solution to map dangerous and exposed areas, such as rockfall transit and deposit areas, especially for applications at a regional level.

Graphical Abstract

1. Introduction

The use of unmanned aerial vehicles (UAVs) for remote sensing has become more common in the study of natural hazards and geomorphological processes, especially due to the development of technologies and mapping systems at larger scales, leading to a more comprehensive understanding of natural processes. UAVs are especially suitable for studying and monitoring rockfalls [1,2,3,4], due to their smaller spatial extent and the fact that the potential rockfall areas are often located on steep slopes above infrastructure and settlements, where the terrain is hardly accessible and dangerous for classical field observations [5,6,7,8]. Structure-from-motion (SfM) photogrammetry enables the production of various high-resolution photogrammetric-derived products, such as point clouds, 3D models of the surface, digital surface models (DSMs), digital terrain models (DTMs), and orthomosaics [9,10]. The use of a UAV is suitable for the acquisition of remote sensing data at a local scale (a few square kilometers), to which rockfalls are mostly limited [11]. As UAVs are less demanding to operate, compared to other remote sensing technologies (e.g., aerial photogrammetry, satellites, etc.), both from the temporal and financial point of view, the area of interest can be surveyed several times over shorter time periods, thus achieving greater spatial (i.e., centimeter resolution) and temporal resolution of data [12,13].
Previous photogrammetric rockfall hazard studies have focused on the potential of photogrammetry for different applications, regarding the vertical and sub-vertical rock slopes, as well as rockfall transit and deposit areas. The purpose of these studies was to (i) identify potentially unstable blocks, wedges, joints, and blocks of the rockfalls; (ii) extract rockfall discontinuities; (iii) identify potential rockfall release areas; and (iv) obtain spatial data for rockfall modeling and rockfall risk assessment [3,5,7,8,14,15,16,17,18,19,20,21,22,23]. Photogrammetric studies of rock faces have also included comparing and combining UAV photogrammetric data with data obtained by aerial and terrestrial laser scanning.

1.1. Challenges of UAV Photogrammetric Georeferencing

The positions and orientations of acquired aerial images must be known in order to provide satisfactory accuracy of photogrammetric products, either by using the indirect georeferencing approach with the use of ground control points (GCPs) or an approach using bundle block adjustment (BBA) without GCPs. The indirect approach performs aerial triangulation (AT) with BBA, using GCPs and/or the airborne global navigation satellite system (GNSS)-assisted controls (i.e., the coordinates, X0, Y0, and Z0 of the perspective centers), while BBA approaches without GCPs involve position and orientation measurements being obtained during camera capturing, and each aerial image is geolocated without any need for GCPs [24,25]. The position (X0, Y0 and Z0) is measured by the GNSS system, and the camera orientation angles (w, φ and k) by an Inertial Measurement Unit (IMU). The measurements form six parameters, called Exterior parameters (EO), which are used in the collinearity equation for georeferencing [26]. A majority of UAVs use GNSS systems that do not provide high spatial accuracy (i.e., meter-level accuracy) [27,28] of the images, meaning that the support of GCPs is crucial for increasing accuracy.
Due to its highest accuracy, indirect georeferencing is preferably used in the SfM photogrammetry. While the preparation and execution of a UAV flight, in the case of indirect georeferencing, can be performed from a safe location, the placement of the GCPs needed in this situation must be performed directly within the area of interest. Surveying of rockfalls can be an extremely challenging and dangerous field operation [27,29], due to their environmental and geomorphological conditions (e.g., steep slopes, rock walls, scree slopes, etc.), making them hard to access. To achieve the highest possible accuracy, GCPs need to be placed homogeneously throughout the area of interest, covering the edges of the area and having similar distances between them [30,31]. In the case of rockfalls, this means placing them within rockfall deposit areas and also above the rock cliffs, which could result in potentially more field workers in the field and separate surveys of the area. The field workers are exposed to the dangers of new rockfall events, displacements of already deposited rocks in the rockfall transit area, and other steep terrain-related dangers (e.g., falls, damages to the surveying equipment, etc.). The process of establishing the GCP network and measuring them with, for example, a total station or GNSS with RTK (Real-Time Kinematic) mode to achieve horizontal accuracies of 0.010–0.020 m and vertical accuracies of 0.020–0.030 m [32], is therefore not only dangerous but also time- and labor-intensive [29,33].
Due to the time-consuming procedure of indirect georeferencing with GCPs, UAV platforms that allow for georeferencing of BBA without GCPs have been introduced (see, e.g., References [34,35]). They use the so-called RTK, NRTK (Network Real-Time Kinematics), and PPK (Post-Processing Kinematics) solutions, based on a multi-frequency multi-constellation of GNSS receivers. By using GNSS RTK, positional data are acquired from satellites and a base station providing real-time high-accuracy positions, such that corrections in real time are applied to the data onsite. Although the PPK method gathers positional data by using virtual reference station (VRS) or continuously operating reference stations (CORS) in a similar manner, the corrections are applied in the post-processing stage. With the accuracies of those methods being comparable to that of indirect georeferencing, the GCPs would not be needed, thus decreasing the time required for the acquisition and processing of the data [29,36,37].

1.2. Previous Work on UAV Images Georeferencing without GCPs

Several studies have considered using image georeferencing without GCPs in the production of UAV-photogrammetric-derived products. In the following paragraphs, we present a short overview of the results provided only by UAV imagery georeferencing, using BBA without GCPs (BBA_PPK). A complete overview of the reviewed studies is available in Appendix A.
Summarizing the reviewed studies, the study area, in most of cases was a flat agricultural area [37,38,39,40,41], or an industrial/residential area [25,27,32,33,42,43,44,45,46,47]. Fewer studies have focused on areas, such as quarries [36,41,48], coastal areas [49], forests [28], and cultural and archeological sites [31,50]. These studies have largely used two types of UAV—senseFly eBee RTK [25,27,28,32,36,43,47] and DJI Phantom 4 RTK [31,44,45,46,47,49,50]—while others have used different UAV options [33,37,38,39,40,41,42]. Some studies have combined different UAV RTK drones and cameras [27,37,40]. BBA approaches without GCPs points methods mostly have used receiver stations located within the area of interest, while in some cases positional data were applied explicitly from the CORS stations. The configuration of the UAV flights was mostly parallel to the surface and cross-grid with fixed flying height. Some of the studies also tested different configurations, with regard to the flying heights and patterns, including different angles for acquiring images. The front overlap of images was mostly above 70%, and side overlap was about 60%.
The accuracy of photogrammetric-derived products can be assessed by comparing the photogrammetric models against a reference, or by using verification points (VPs) surveyed with traditional topographical methods, and identified within the BBA and orthomosaics/DSM [51]. In this review, we only included the results for the latter case, as we used the same approach, and focused on horizontal and vertical accuracies that were either compared for BBA, orthomosaics, and DSM. Observing the results for BBA, studies have reported a horizontal accuracy between 0.020 and 0.060 m, and vertical from 0.040 up to 0.300 m. Some studies have also reported lower accuracies: the specifics of these UAV flights were higher flying altitudes of the UAV, flying in only one direction, surveying vegetated areas and areas that are more diverse with extreme elevation changes, and with the CORS station at larger distances (especially affecting the vertical accuracy) [28,31,39,41,48,49]. Horizontal accuracies of orthomosaics have revealed similar results, with values of 0.020–0.050 m, except for Mian et al. (2016) [38] and Tomaštik et al. (2019) [28], where the accuracies resulting from different flight setups and vegetation conditions varied between 0.044 and 0.087 m. Vertical accuracy estimated from the DSM is, in the best case 0.030 m, reaching up to 0.200 m, with some exceptions exceeding these values [37,38].

1.3. Aim of the Study

A majority of the presented studies in Section 1.2. were carried out in flat areas with homogeneous terrain conditions (except for the studies by Hugenholtz et al. [36], Tomaštík et al. [28], and Tufarolo et al. [48]), where there is less satellite obstruction, better signal reception, and finally conditions for measuring GCPs and VPs. In our research, we wanted to test the accuracies of the photogrammetric products in the case of rockfalls, as the conditions for a survey of high-accuracy data (e.g., GCP positions) are highly demanding, due to the higher terrain roughness and larger elevation changes. It is crucial for surveyors of these environments to know whether it is possible to achieve results comparable to those acquired by using georeferencing, without requiring any GCP assistance. Therefore, we question which georeferencing method is more appropriate and suitable for providing high-accuracy photogrammetric-derived products, taking into consideration all of described environmental challenges and risks of field operations in the event of rockfall hazards. Either it is permissible to use the georeferencing with PPK (BBA_PPK) method, or the use of indirect georeferencing (BBA_traditional) is still preferable and needed, especially in the case of planning technical protection measures where an accuracy of the order of centimeters is required. As we wish to minimize the amount of time that field operators spend on an active rockfall slope, the main goal of the research was to analyze which BBA method (BBA_traditional or BBA_PPK) provides more accurate photogrammetric-derived products (e.g., orthomosaics and DSMs). In the research, we compared the photogrammetric-derived products that have been produced strictly by georeferencing, using BBA_PPK and indirect georeferencing (using BBA_traditional only), to determine the possible applications in the event of rockfall studies.
The reason that we considered the option of not using BBA_PPK in combination with the BBA_ traditional method is that the surveying of rockfalls can sometimes be too risky to place any GCP below, for example, rock walls in the transit corridors of the falling rocks. However, rockfalls located in remote and hardly accessible areas are still valuable and need to be included in past rockfall databases. In our study, we are focused only on rockfall transit and deposit areas, where we are collecting data on past rockfall events needed for calibration and validation of rockfall models. For rockfall modeling, we require data on the volume, location, shape of individual rock deposits, and surface roughness of the slope, among others, and know that the accuracy of photogrammetric-derived products is crucial for rockfall modeling at different scales.
The remainder of the paper is structured as follows: In the Materials and Methods section, we describe the test site, the experimental setup for comparing the results of georeferencing with two different methods (i.e., AT with solely GCPs and using auxiliary data provided by PPK and no GCPs), the UAV feature and flight plan, data processing, measuring and obtaining the positions of the VPs, and statistical evaluation of the results. In the Results section, we present the differences in the accuracy, using VPs, of the BBA (X, Y, and Z), orthomosaics (X and Y), and DSM (Z), as obtained by the two georeferencing methods mentioned above. In the Discussion section, we explain the significance of the results, draw the main outcomes, and discuss possible future investigations. Due to different applications (e.g., comparison of photogrammetric points clouds and laser scanner point clouds; spatial planning—orthomosaics; and so on) [51], our comparison of the results is carried out separately for BBA, for orthomosaics, and DSM.

2. Materials and Methods

2.1. Study Sites

In the study, we used three rockfall deposit sites, all located in the Julian Alps in the NW part of Slovenia (Figure 1). Two of the rockfalls are located in glacial alpine valleys—Trenta (rockfall Kekec) and Krnica (rockfall Krnica)—while the third (rockfall Mangart) is located on the mountain pass, below the mountain Mangart. This part of the Alps is geotectonically part of the Southeastern Alps, the thrust unit of the Julian Alps that consists of sediment rocks (mainly from Lower Triassic and Cretaceous, and predominantly from Upper Triassic): limestone and dolomite, with limestone layers commonly passing into dolomite in vertical and lateral directions [52,53]. Faults in this area have transverse Dinaric direction (NE–SW), while significant faults are also present in the Dinaric direction (NW–SE).
The rockfall deposits at the Kekec site consist of massive and bedded dolomite and limestone (Carnian), at the Krnica site of bedded dolomite and limestone (Anisian–Ladinian; Triassic), while at Mangart Pass, they consist of platy and bedded micritic and crinoid limestone with chert (Malm) from the Jurassic period. The specialty of this area (i.e., Mangart Pass) is that these beds are of restricted dimensions in the Julian Alps and represent tectonically confined rests of unconformably overlying limestones from the Upper Triassic period (massive limestone) [54].
All release areas are characterized by steep, vertical slopes and walls from where the rockfall material was deposited directly below the walls, steeper slopes, or lower down in the valleys. The terrain is rough with great elevation and slope values variations which can be observed in Figure 2 and Figure 3. The rockfall runout area was the smallest for the Kekec rockfall (4800 m2), followed by Mangart (13,000 m2) and Krnica (35,000 m2). At all three rockfalls rock deposits, volumes vary from the size of the rocks on the scree slopes of up to 100–200 m3 at the Krnica rockfall, up to 30 m3 at the Mangart rockfall, and up to 70 m3 at the Kekec rockfall. The conditions of surveying all three rockfalls are, therefore, extremely exposed, as the rocks deposited in the rockfall runout area can still be transported down the slope, and as there is always a possibility of new rockfall events occurring. Even though larger rockfall events in these sites have occurred in the past, the activity of falling rocks continues which can be observed by the colors of the rocks (brighter color of rocks indicate more recent events in comparison to darker deposits that are past events), and based on the vegetation (e.g., rocks covered by moss and grass; pioneer tree and shrub species).

2.2. Setting Up Ground Control and Verification Points

At each study site we set out VPs, which were later on used for accuracy comparison. Besides the VPs, we also set GCPs, which were used exclusively for indirect georeferencing and were not used as VPs. Before setting up VPs in the field, we have defined the area of interest at each rockfall by digitalizing the known rockfall runout area, using orthomosaics from previous UAV surveys. With the use of the Fishnet function in ArcGIS Pro 2.7.3 [55], we created a VP sample network (locations) for each rockfall. The final numbers of VPs were 42 at Kekec, 51 at Krnica, and 48 at Mangart rockfall. GCP locations were also preplanned and set up such that they were not at the same locations as VPs. The number and locations of the GCPs were set up according to the recommendations in the literature; the main condition was that the points were, as much as possible, regularly spaced within the area of interest and its edges. The horizontal distance between the points was approximately 30 m at Kekec, and 65 m at Krnica and Mangart [56,57,58,59,60]. We used 14 GCPs at Kekec, and 16 GCPs at Krnica and Mangart.
The known VP and GCP locations were then imported as shapefiles to the Leica Zeno20 with GG04 Smart Antenna. The points in the field were, thus, set up by using this antenna and the known locations of the VPs and GCPs. As the automatic generation of the VP sample network and predicted locations of GCPs cannot account for the conditions in the field, such that the points cannot be set due to particular terrain features (e.g., a more or less flat area, vegetation, unstable terrain, etc.), the final locations were adjusted when setting the points, based on the predicted locations, while also considering the outline of the rockfall runout area (Figure 3).
VP and GCP targets were squares with a 2 × 2 chess pattern (two white and two black squares; Figure 4), as recommended by the Pix4Dmapper software [61], attached to the ground by a nail through the center of the target. Where that was not possible (as, on the rockfall runout area, most of the terrain was represented by rocks), the targets were fixed with rocks at their edges. At the Krnica rockfall, targets with dimensions 21 cm × 29.7 cm were used, while the targets at Kekec and Mangart targets had dimensions of 29.7 cm × 42 cm. The targets at Krnica rockfall were smaller than at other two locations, as the terrain was too uneven to position larger targets. As all rockfalls are located within the Triglav National Park, any invasive procedures for placing or making different targets were not allowed.
All points were then surveyed, using a Leica Viva TS12 total station, while the orientation points and backside locations were measured with a Leica Zeno20 with GG04 Smart Antenna with accuracy of 0.010–0.030 m. Measurements of these points were carried out in two different parts of the same day (average location of coordinates was later calculated), with each coordinate being measured for an interval of 5 min (with a 6-h of difference). The differential correction data were acquired by using a real-time connection with the Slovenian real-time positioning service SIGNAL. The closest station to all rockfalls was station Bovec, which is located 13 km from Mangart rockfall, 15 km from Kekec rockfall, and 21 km from Krnica rockfall. The X and Y measurements were transformed to the horizontal geodetic datum “Slovenia 1996/Slovene National grid with Slovenia Geodetic Datum 1996”, whilst the Z coordinate was converted to an orthometric height, using the geopotential model EGM96.

2.3. Flight Planning and Acquisition of Data with UAV

A DJI Phantom 4 RTK [34] drone with GNSS RTK/PPK technology was used to survey the study sites. The UAV weighs 1391 g, has a diagonal distance of 350 mm, and maximum flight time of 30 min. A camera that is mounted on the UAV has a 1-inch, 20-megapixel CMOS sensor with lens FOV of 84° 8.8 mm/24 mm (35 mm format equivalent) and f/2.8–f/11 auto-focus at 1–∞ m. The ISO range for photos is 100–3200 for auto mode, and 100–12,800 for manual. The maximum image size is 5472 × 3648 (3:2), with a pixel size of approximately 2.4 μm. Multi-Frequency Multi-System High-Precision RTK GNSS enables GPS (L1/L2), GLONASS (L1/L2), and Galileo (E1/E5a) tracking. The manufacturer states that it enables a positional accuracy (RMSE) of 0.015 m (vertical) and 0.010 m (horizontal), both with 1 ppm, which means that the error has a 1 mm increase for each 1 km of movement by the UAV.
The UAV surveys were performed on three separate days for each location: Krnica rockfall was surveyed on 29 August 2019, Mangart rockfall on 20 September 2019, and Kekec rockfall on 7 November 2019. UAV flights were planned such that the flying height was kept constant, using LiDAR-derived digital terrain model (DTM) with a spatial resolution of 1 m. This feature allows for the acquisition of images with the same scale, despite the terrain being very rugged with changing elevation (Figure 3). The flight pattern was perpendicular to the surface slope. The flying height was set to 80 m at all study sites, to achieve a ground sampling distance of 2–3 cm. The image overlaps were 80%. Pictures were taken at 45° and 90° angles, as the combination of oblique and nadir images contributes to a more accurate representation of terrain [62]. For planning the UAV mission, we used the DJI GS RTK application.
The surveyed area for each site is provided in Table 1. We surveyed all sites in PPK mode, such that GNSS data were recorded during the flight and post-processed by using correctional data from the base station that was located within or next (<1 km) to the surveyed area. The location of the base station was calculated with RTK VRS method based on the Slovenian SIGNAL service (interval observations were performed with time spacing of more than one hour and a half). The cadence of observations was one observation per second, while the number of station satellites varied between 4 and 7. GNSS data from the flights were post-processed, using Leica GeoOffice and RTKlib.

2.4. Data Processing

The number of images used for each site are presented in Table 1. The images were processed with Pix4Dmapper (Version 4.6.4) by Pix4D [61]. For each site, we carried out two separate processing procedures, following the georeferencing methods: (a) processing by carrying out BBA_traditional and (b) processing by carrying out BBA_PPK. For the latter, a geolocation file was used to add the coordinates to the perspective centers of the images, while, for the former, the geolocation data of images were removed. The coordinate system used for the horizontal geodetic datum was Slovenia 1996/Slovene National grid with Slovenian Geodetic Datum 1996, while that for the vertical was the EGM96 Geoid model. The configuration of processing parameters was the same under all georeferencing methods: initial processing was performed in full mode; for point cloud densification, we used an image scale of 1/2 (i.e., half image size) and high point density; and the additional photogrammetric products were orthomosaic and DSM (Figure 5).
The precision values of the perspective centers of coordinates for BBA_PPK method are given in Table 2, while they were not needed for BBA_traditional, as all positional data of the images were removed before the processing.
The resolution of orthomosaic and DSM was determined to be the same as the GSD (Kekec, 2.4 × 2.4 cm; Krnica, 2.5 × 2.5 cm; and Mangart, 2.2 × 2.2 cm; Table 1). For the creation of the DSM, we used default options in Pix4DMapper, namely noise filtering to correct the altitude of points with the median altitude of neighboring points, as well as sharp surface smoothing. The generation of the point cloud can lead to noisy and erroneous points, and with the noise filtering, the altitude of these points was corrected with the median altitude of the neighboring points. Once the noise filter was applied, a surface was generated by using these points. However, the surface can still contain areas with erroneous small bumps, and with surface smoothing these areas are then corrected by flattening. Sharp surface smoothening is by default, and this type of smoothening tries to preserve the orientation of the surface, and keeps sharp objects. In this process, only quasi-planar areas were flattened. The DSM was generated in the raster GeoTIFF file format, using the method of inverse distance weighting. The results of photogrammetric processing are provided in Figure 5.

2.5. Accuracy Assessment of Bundle Block Adjustment, Orthomosaic and Digital Surface Model

The accuracies of the BBA_traditional and BBA_PPK, namely of BBA (X, Y and Z), orthomosaic (X and Y) and DSM (Z) were assessed with the help of the VPs. The coordinates of VPs, as computed by BBA_traditional and BBA_PPK, were retrieved through Pix4Dmapper, namely by using Checkpoints. They were marked in the same manner as GCPs, i.e., by measuring the center of the target (in this study, we marked each VP at 30 images). Then, the difference between the initial and computed position of the checkpoints (for X, Y and Z) was calculated and shown in the quality report [48]. The calculated differences were further used in comparative analyses.
Coordinates of the VPs of the orthomosaics (X and Y) and DSMs (Z) were retrieved by using GIS software, namely ArcGIS Pro 2.7.3 [55]. The VP targets were vectorized based on the orthomosaic. To accurately determine the center of the target, the procedure of vectorizing was carried out in three steps: (i) In the first step, a polygon with the actual size of target was made, orientated in the same direction as the target, and centralized according to the center of the target, such that it was covered by a polygon. (ii) In the second step, two polylines were drawn from each polygon’s angle, such that they crossed in the middle of the target. Lastly, (iii) in the third step, the point that represents the center of the target was placed at the crossing of the polylines. The location of the point was used to calculate the X and Y location from the orthomosaic. The whole procedure was performed three times, separately [37], and, in the end, an average value of three coordinates was used as the final one, which was used in further analyses. The Z coordinate was extracted from the DSM layer, based on the planimetric (XY) locations of VPs as measured in the field, namely by using the function Extract Values to Points.
The coordinate differences, as mentioned above, were then used to compute several statistics. These concern the minimum, maximum, median, mean, standard deviation, and root mean square error (RMSE) of the differences between the coordinates measured on photogrammetric-derived products (XM, YM and ZM) and given (XVP, YVP and ZVP) coordinates of the VPs (Equations (1)–(3)) [63]:
diff X =   X VP   X M
diff Y =   Y VP   Y M
diff Z =   Z VP   Z M
The RMSE, given by Equation (4) for the differences concerning each coordinate (C) separately (n is a total number of coordinates), was computed as an accuracy value in planimetry (Equation (5), [63]), and a total accuracy value (Equation (6), [63]) was also computed as an accuracy value in planimetry (Equations (4)–(6); [63]):
RMSE C = 1 n diff C 2 n   with   C = X ,   Y ,   Z
RMSE xy = RMSE x 2 + RMSE y 2
RMSE xyz = RMSE x 2 + RMSE y 2 + RMSE z 2
The computed differences (diffX, diffY and diffZ) are shown in the form of histograms for each photogrammetric product and georeferencing method separately (Section 3.1, Section 3.2, Section 3.3). Additionally, we also plotted the differences spatially to study any correlation with the terrain topography; the differences were plotted for each photogrammetric product and georeferencing method (Section 3.4).
To compare the accuracy of both the AT, using the BBA_traditional and BBA_PPK (X, Y and Z), and the produced orthomosaics (X and Y) and DSM (Z) for each of the three study areas, two statistical tests were carried out. Whereas the Shapiro-Wilk test [64] indicated that the difference values were normally distributed (p-value > 0.05), a paired Student’s t-test [65] was used, otherwise a non-parametric Wilcoxon signed-rank test [66] was used. All calculations and statistical analyses were carried out in RStudio [67].

3. Results

3.1. Assessing the Accuracy of Bundle Block Adjustment

Table 3 shows the several statistics computed to assess the accuracies of BBA_traditional and BBA_PPK. On the average, the BBA_traditional presented the smallest minimum value of the differences per coordinate. The differences range from −0.098 m (Krnica, diffX) to 0.091 m (Krnica, diffY) in the case of BBA_traditional, while the differences with BBA_PPK were higher; they range from −0.171 m (Mangart, diffY) to 0.431 m (Mangart, diffZ). The mean value of differences ranges from −0.006 m (Kekec, diffY) to 0.009 m (Kekec, diffZ) in the case of BBA_traditional. The mean value of the differences with BBA_PPK were higher, and range from −0.109 m (Mangart, diffY) to 0.245 m (Mangart, diffZ). The standard deviations of the differences were similar for both BBA methods for all coordinates when observing the Kekec (from 0.008 to 0.010 m) and Krnica site (from 0.014 to 0.031 m). At Mangart site, the BBA_PPK had larger standard deviations than BBA_traditional, namely reaching 0.028 for diffX, 0.047 m for diffY, and 0.092 m for diffZ, while BBA_traditional had values between 0.007 and 0.008 m.
The lowest RMSE values per coordinate were achieved with the BBA_traditional method at the Kekec and Mangart study sites, with the RMSE values lower than 0.015 m in all coordinates (Kekec, RMSEX = 0.009 m, RMSEY = 0.010 m, and RMSEZ = 0.014 m; Mangart, RMSEX = 0.009 m, RMSEY = 0.008 m, and RMSEZ = 0.007 m). At the Krnica study site, the results were slightly worse, but the RMSE in all coordinates did not exceed 0.029 m (Krnica, RMSEX = 0.026 m, RMSEY = 0.020 m, and RMSEZ = 0.015 m). The RMSE values per coordinate with the BBA_PPK method ranges from 0.019 to 0.050 m at the Kekec and Krnica rockfall site, while at the Mangart rockfall site, RMSE values per coordinate achieve values between 0.102 and 0.261 m.
The overall accuracy of BBA (RMSEXYZ) was higher in the case of BBA_traditional (range from 0.014 to 0.036 m); namely, in the case of the BBA_PPK method, the RMSEXYZ ranged from 0.056 to 0.305 m. Figure 6 shows the frequency distributions of the diffX, diffY, and diffZ at the sites for both georeferencing methods. It can be observed that the differences related to BBA_traditional method are closely clustered around 0, having uni-modal distribution. The differences related to the BBA_traditional coincided with BBA_PPK, with the latter having a larger span of values, with the exception of the Mangart location, where the differences of BBA_traditional and BBA_PPK coincided in a small part or not at all.
A paired Student’s t-test, for testing whether there was a statistically significance difference in the mean value of differences between the BBA_traditional and BBA_PPK, was used in three cases: diffX, diffY, and diffZ in Mangart. In all cases, there was a statistically significant difference between the mean values (p ≤ 0.05). For the rest of the pairs, a non-parametric Wilcoxon signed-rank test was used, which showed that, only in the case of diffY at Krnica location, there was not a statistically significant difference between the median values between the georeferencing methods (p > 0.05).

3.2. Assessing Accuracy of Orthomosaic

Table 4 shows the statistics, as detailed in Section 2.5, computed by measuring the VP at orthomosaics produced for the three study areas, and produced by carrying out the AT with the BBA_traditional and BBA_PPK methods. Similarly, as for BBA accuracy, the BBA_traditional method achieved the smallest difference in average in each coordinate, compared to the VPs. The differences range from −0.104 m (Krnica, diffX) to 0.078 m (Krnica, diffY) in the case of BBA_traditional, while the differences with BBA_PPK were higher; they range from −0.181 m (Mangart, diffY) to −0.016 m (Mangart, diffX). The mean value of differences ranges from −0.017 m (Kekec, diffY) to 0.018 m (Kekec, diffX) in the case of BBA_traditional. The mean value of differences with BBA_PPK were higher, and range from −0.119 m (Mangart, diffY) to −0.089 m (Mangart, diffX). The standard deviations of the differences were similar for both BBA methods for all coordinates when observing the Kekec (from 0.011 to 0.012 m) and Krnica site (from 0.022 to 0.027 m). At Mangart site, the BBA_PPK had larger standard deviations than BBA_traditional, namely reaching 0.026 m for diffX and 0.045 m for diffY, while in case of BBA_traditional, standard deviation values were the same for diffX and diffY (0.012 m). The RMSE values per coordinate were similar between the both coordinates in the case of BBA_traditional with all rockfall sites (0.020–0.021 m for Kekec, 0.025–0.026 m for Krnica, and 0.013–0.016 for Mangart). For the BBA_PPK method the RMSE values range from 0.031 to 0.034 m at the Kekec and Krnica rockfall site, while at the Mangart rockfall site RMSE values per coordinate achieve values between 0.093 and 0.127 m.
In Figure 7, the frequency distributions of the diffX and diffY for both georeferencing methods and all sites can be observed. Similar as with the assessment of BBA, the lowest values of differences were achieved by BBA_traditional, which had the densest distribution in all cases, and differences are clustered around 0. BBA_traditional’s differences did have an overlap with BBA_PPK, but the differences of BBA_PPK experienced larger variability. The location that stood out is Mangart, where the differences of X and Y retrieved from orthomosaic produced by BBA_PPK were larger and do mostly did not match with those of BBA_traditional. The overall accuracy of orthomosaic (RMSEXY) was higher in the case of BBA_traditional (range from 0.020 to 0.036 m), while the RMSEXY of orthomosaics produced by the BBA_PPK ranged from 0.039 to 0.157 m.
A paired Student’s t-test, for testing if there was a statistically significance difference in the mean value of differences between the BBA_traditional and BBA_PPK, was used in the following cases: diffX and diffY in Kekec, and diffX in Mangart. At all locations and coordinates, there were significance differences between the mean values (p ≤ 0.05). With other pairs, a non-parametric Wilcoxon signed-rank test was used, which also showed that there were statistically significant differences between the median values between the georeferencing methods in all of the cases (p ≤ 0.05).

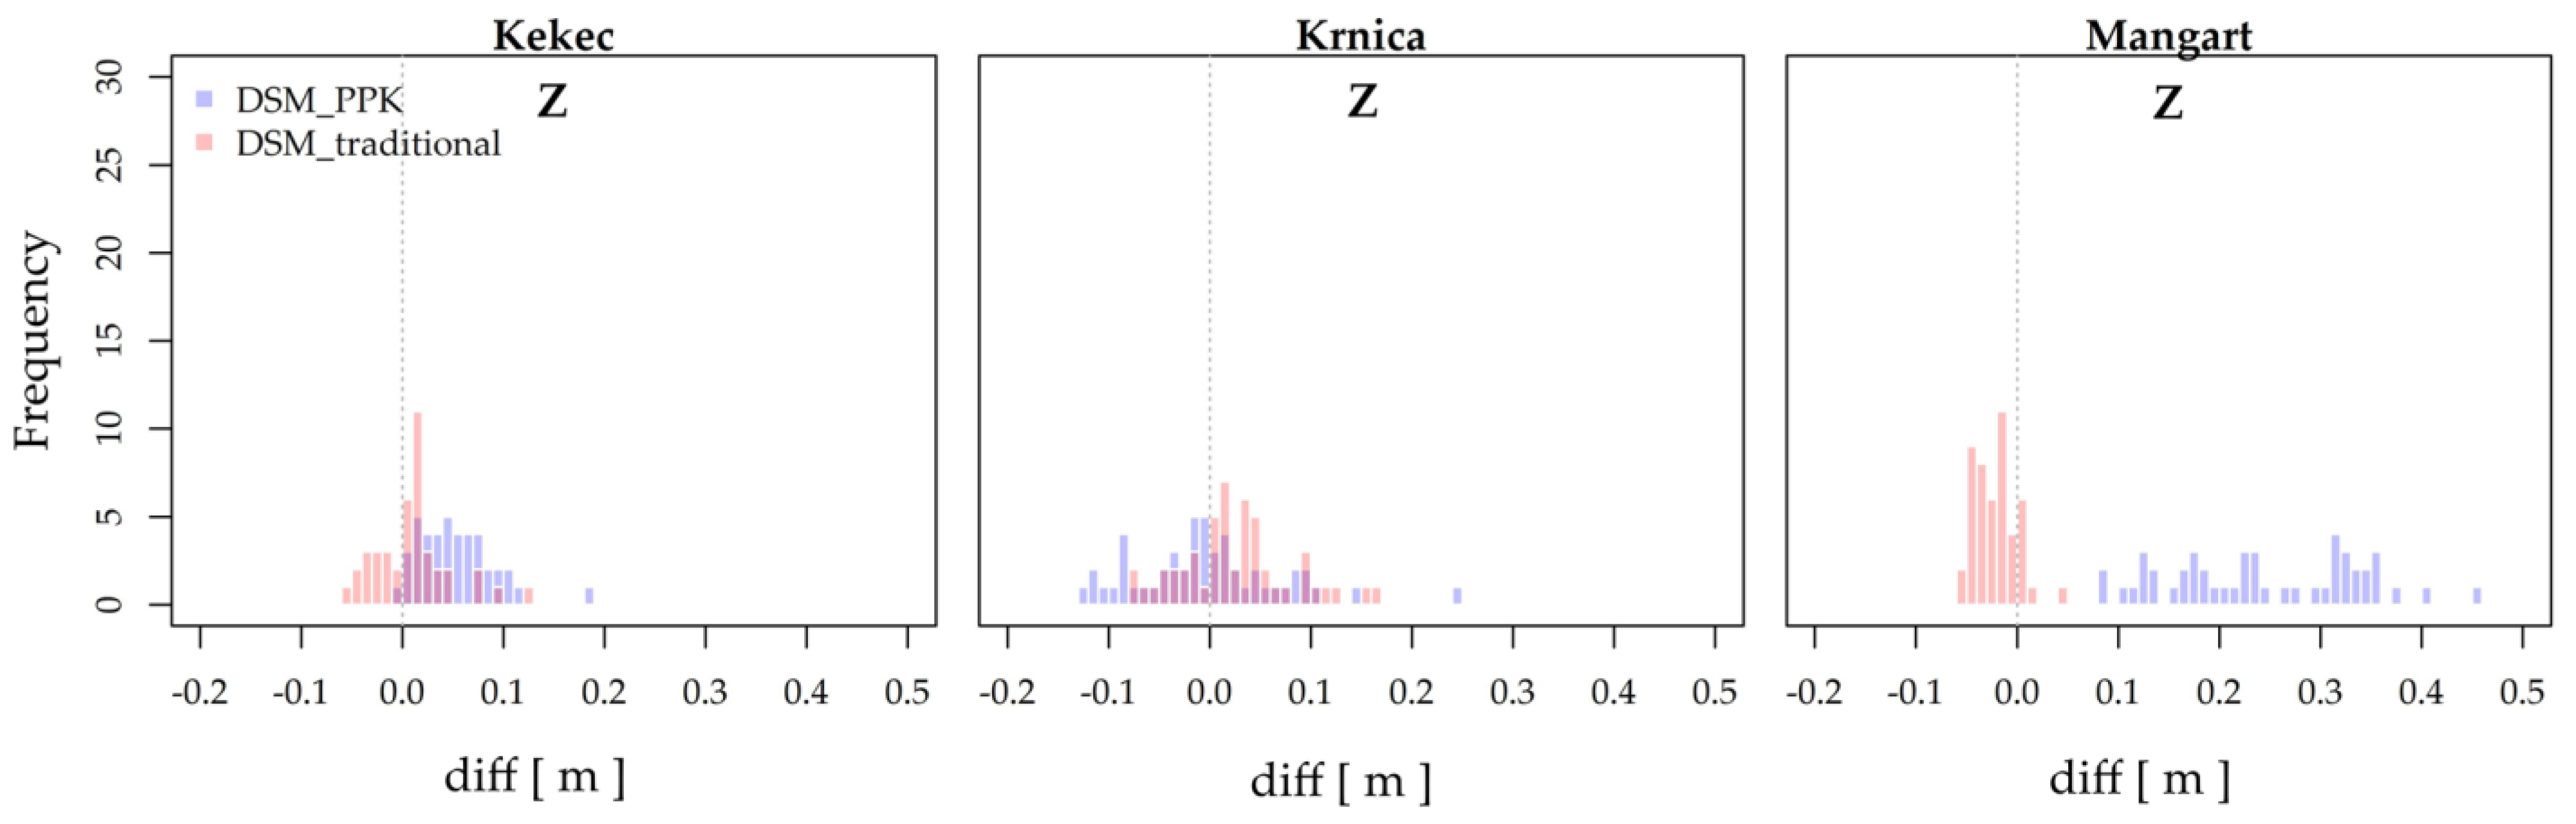
3.3. Assessing Accuracy of DSM

The accuracy of DSMs was assessed through the differences between the VP coordinate (Z) and coordinate extracted from the BBA_traditional and BBA_PPK methods. Table 5 shows the basic results for difference statistics for Z coordinate and the final RMSEZ values. The differences range from −0.079 m (Krnica) to 0.165 m (Krnica) in the case of BBA_traditional, while the differences with BBA_PPK were higher; they range from −0.129 m (Krnica) to 0.453 m (Mangart). The mean value of differences ranges from −0.022 m (Mangart) to 0.026 m (Krnica) in the case of BBA_traditional. The mean value of differences with BBA_PPK were higher, and range from −0.002 m (Krnica) to 0.244 m (Mangart). The standard deviations of the differences were the same for both BBA methods at the Kekec site (0.037 m), while larger differences in standard deviation were present at the Krnica (0.055 m for BBA_traditional, 0.072 m for BBA_PPK) and Mangart site (0.021 m for BBA_traditional, 0.093 m for BBA_PPK).
RMSEZ was generally smaller in the case of the BBA_traditional method; however, in comparison to the BBA_PPK method for the Kekec and Krnica, the difference was only 0.027 m and 0.012 m, respectively. Larger differences in RMSEZ were presented for the Mangart rockfall, namely they reached 0.231 m. The frequency distribution of the Z coordinates (Figure 8) indicates that DSM produced with BBA_traditional achieved the lowest differences, while the values had larger span, compared to the assessment of BBA alone. The differences of BBA_traditional and BBA_PPK coincided in a larger part of the frequency distribution, with the latter achieving larger differences. The results were, similar as with the assessment of BBA and orthomosaic, different at the Mangart location; where, for the DSM produced with BBA_PPK, the differences were larger and had greater span than those ones produced with BBA_traditional. Moreover, the differences did not coincide at all at the Mangart location.
To test for statistically significant differences in the mean value of differences between the BBA_traditional and BBA_PPK, a paired Student’s t-test was used for diffZ at the Krnica and Mangart site. It showed that there were statistically significant differences in the mean value between the georeferencing methods values (p ≤ 0.05). A non-parametric Wilcoxon signed-rank test was used for diffZ at Kekec, and it showed that there was a statistically significant difference between the median values of georeferencing methods (p ≤ 0.05).

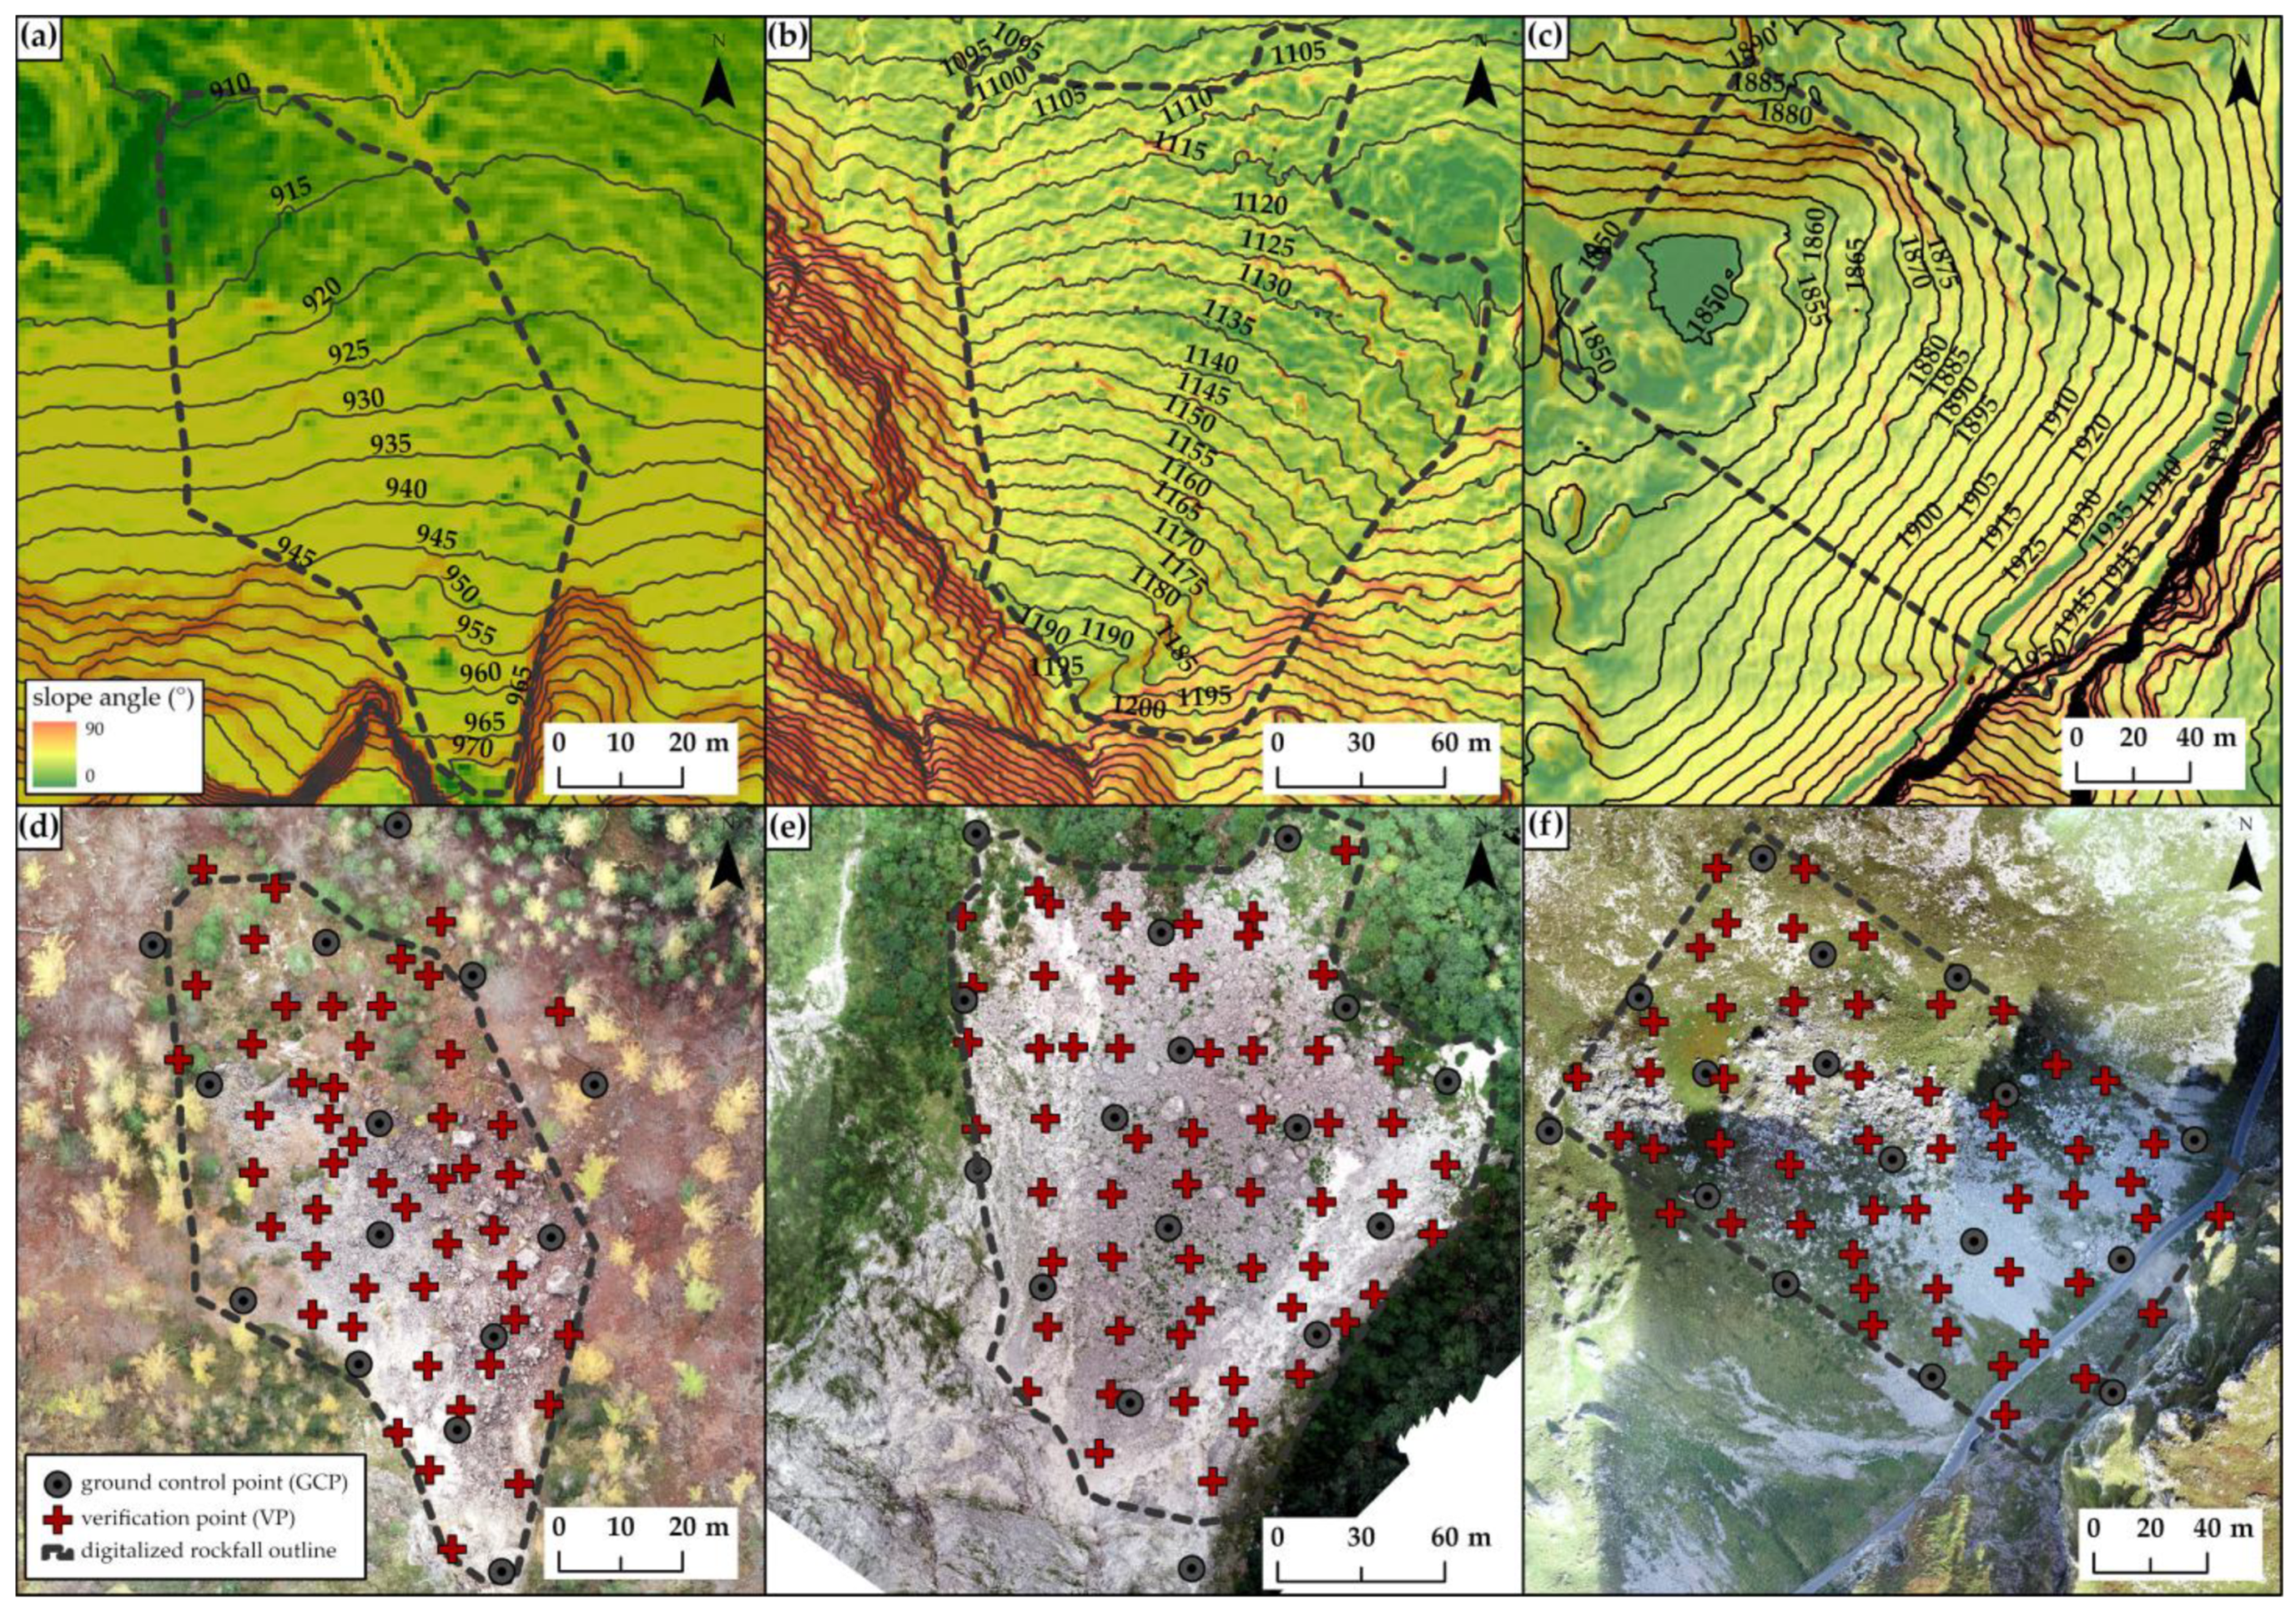
3.4. Spatial Distribution of X, Y and Z Differences

To observe the spatial pattern of the differences for individual coordinates, they were plotted for each VP and for all photogrammetric products produced (i.e., BBA, orthomosaics, and DSM). All plots (Figure 9 and Figure 10) include the marked outlines of the rockfall areas.
Figure 9 shows the spatial distribution of the difference values diffX, diffY and diffZ of respectively BBA_traditional and BBA_PPK methods. When observing the results of BBA_traditional, those differences appear to be randomly distributed through the rockfall areas, except for Krnica where larger diffX and diffY are concentrated in the central part of the rockfall area. BBA_PPK results show that at Krnica diffZ expressed larger differences in the southeastern part of the rockfall site, whereas, at the Mangart site, there was a systematic increase of diffX and diffY in towards the northwestern part and towards the southwestern part of the rockfall for the diffZ, which also had the largest values.
The results for the orthomosaics produced by BBA_traditional (Figure 10, X and Y coordinates) showed similarity to the BBA accuracy assessment for X and Y coordinates. The spatial pattern and the difference degree were both similar for all rockfalls. For the orthomosaics produced by the BBA_PPK method, no spatial pattern was recognized for Kekec and Krnica, as they varied across the whole rockfall sites. At the Mangart location, larger differences can be recognized towards the northwestern part of the rockfall site.
As for the DSM result for BBA_traditional (Figure 10, Z coordinate), Krnica rockfall was the only one that had larger differences in the central part of the rockfall while, for the other two, the spatial pattern of the differences could not be recognized. On the other hand, a systematic increase of differences for the DSM produced by BBA_PPK is present for Mangart, where the differences had larger values in the southwestern part of the rockfall site. The Kekec rockfall had larger differences in the central part of the rockfall, while differences are larger when moving in the southeastern direction at Krnica.
Observing the spatial distribution of the differences in X, Y and Z coordinate between BBA_traditional and BBA_PPK, when assessing the accuracy of BBA, it is possible to recognize that larger differences were present at the Mangart location. For the X and Y coordinates, the differences were similar across the rockfall area but, for the Z coordinate, they increase in the southwestern direction. Kekec and Krnica had homogeneous differences across the rockfall area with only Krnica having larger differences in Z coordinate in the southeastern part of the rockfall area. Similar conclusions can be drawn for the accuracy assessment of orthomosaics, when comparing the differences in X and Y coordinates of VPs as obtained by using the BBA_traditional and BBA_PPK methods. The difference in BBA accuracy assessment is with the Mangart site, where differences were increasing in northwestern direction for both with X and Y coordinates. No spatial pattern could be recognized for the Kekec and Krnica rockfalls. The spatial distribution of the differences between the Z coordinate of the VPs as obtained by using the BBA_traditional and BBA_PPK methods, when assessing the accuracy of DSMs showed that, at the Kekec site, the differences were larger in the southern direction; at the Krnica site, they were larger in the southeastern direction; and, at the Mangart site, they were larger in the southwestern direction. The largest differences were observed for the Mangart site.

4. Discussion

Georeferencing of UAV-acquired images has been studied by various authors, as already summarized in the Introduction section (see the references therein) and in Appendix A. The vertical and horizontal accuracies vary depending on several factors, including the BBA methods used, namely BBA with and without GCPs. The RMSE reported by the majority of studies varies between 0.020 and 0.060 m for horizontal accuracy, and, in the case of vertical accuracy, 0.020–0.090 m, while studies have also reported values of approximately 0.100 m up to three decimeters (in some cases, even higher).
The best accuracies in our study were achieved by the BBA_traditional method, when comparing the accuracies of BBA, orthomosaic, and DSM. The accuracies for the BBA_traditional method were, for either BBA, orthomosaic, or DSM, in the worst case, under 0.030 m for X and Y coordinates, and under 0.060 m for the Z coordinate. The BBA_PPK method generally achieved lower accuracy than the BBA_traditional method for all photogrammetric-derived products, but it must be highlighted that they were still under 0.035 m for X and Y coordinates and 0.075 m for the Z coordinate (except at the Mangart site), and, comparing the BBA_traditional with BBA_PPK, the results differed, in the worst case scenario, by 0.013 m for X and Y coordinate, and 0.036 m for the Z coordinate. The following results are in similar ranges as those reported in studies carried out by the authors mentioned in the Introduction [25,27,32,33,36,40,43,44,45,46,47]. In the case of BBA_traditional, the smallest variations (diff-SD) are present at Kekec and Mangart, achieving maximum SD up to 0.010 m (X, Y, or Z coordinate) when observing assessment of the BBA. With orthomosaics the variations were larger for BBA_traditional and in some cases comparable with BBA_PPK (e.g., Kekec Y coordinate), while maximum differences were present at BBA_PPK. On the other hand, the Z coordinate always achieved the lowest diff-SD in the case of BBA_traditional, including the diff-MAX values, where the differences exceed 0.006–0.008 cm in the case of Kekec and Krnica, and 0.041 cm in the case of Mangart, when compared to BBA_PPK.
The Mangart study site was an exception compared to the other two locations, where RMSEZ for the BBA_PPK method was larger by 0.093 m (X coordinate) and 0.111 m (Y coordinate), and 0.254 m for the Z coordinate, when observing the accuracy of BBA. The results for the orthophoto and DSM accuracies were in a similar range: 0.077–0.114 m for the X and Y coordinate and 0.231 m for Z coordinate. The major cause of such a large difference in accuracy was the unfavorable satellite position configuration [8,27,29] on the day of the UAV survey (more or less three visible satellite positions in the time of survey), compared to that on the day when the GCP/VP survey was performed. Consequently, it is recommended to predict the satellite position quality [29] before the UAV flight, both from the perspective of the final accuracy of the photogrammetric products and for the safety of the flight. Due to the extent of the UAV survey (rapidly changing weather conditions; clouds and fog), and the GNSS survey of the points, both measurements could not be performed on the same day.
Even though our study was carried out in mountainous areas with larger elevation changes along the area of interest (rockfall deposit areas), the final accuracies of BBA, orthomosaics, and DSM were in line with the values reported in other studies. The reliability of the results is therefore high, as similar results have been reported for two rockfall locations that we included in the study; however, the third location highlights that the BBA_PPK method still may—particularly in remote areas—cause larger deviations, and GCPs should be used to validate the results.
The spatial distribution of the differences between the X, Y and Z coordinates of VPs, as obtained by using BBA_traditional and BBA_PPK methods, did not reveal major spatial patterns, while outliers were located randomly across the rockfall sites. The only location that showed a distinctive spatial distribution was Mangart, and that only for the photogrammetric-derived products produced by BBA_PPK. The differences increase towards the northwestern direction for the X and Y coordinates and towards the southwestern direction for the Z coordinate. The spatial pattern was similar with all photogrammetric-derived products. The spatial distribution of the differences is a result of the lower accuracy of the BBA_PPK method, and it is not correlated with terrain topography.
The highest differences in coordinates (X, Y and Z) of the VPs when comparing the VP and GCP locations, were achieved at the Krnica rockfall, which was also the largest area that we surveyed. In our experience, measuring the locations of GCPs and VPs can be very challenging. Under the steep rock walls, there is no signal, meaning that the points cannot be measured with GNSS that has RTK; in such cases, the use of the total station is then needed. Additional challenge presented at this study site was moving the measurement equipment, and in the end measurement of the GCPs/VPs. Namely, not all GCPs/VPs could be measured with the total station from one standing position, since the area was too large. Consequently, the total station was positioned on several locations, and due to the large area that needed to be surveyed, not all measurements could be performed in one day. Moreover, due to the high surface roughness, there were many obstacles (rock deposits that are a few meters of high) that obstructed the measurements with total station, and the GCPs/VPs were in some cases located on scree slope (as there was no other option), meaning that they were not attached firmly to the ground. In latter case, targets were more unstable, and could be moved by simple slope processes or simply by walking past it. Consequently, all this factors could potentially influence the measurements, and result in higher errors at this rockfall site. The RMSE values of the BBA_traditional method were larger at the Krnica rockfall, compared to the other two locations, and comparable with the results of the BBA_PPK method. This was partially confirmed by a non-parametric Wilcoxon signed-rank test that showed that there were no statistically significant differences between the georeferencing methods for Y coordinate when assessing the accuracy of the BBA. However, in the assessment of other photogrammetric-derived products and coordinates, the differences were statistically significant between the georeferencing methods.
Taking into consideration this factor, BBA_PPK definitely represents a viable possibility and solution for application in such challenging terrains. Still, for generating products with high accuracy (if possible)—especially vertical accuracy—BBA_PPK should be used at least in combination with few GCPs and possible interferences or obstructions that can influence the final results. Benassi et al. [32] have reported that, by using at least one GCP point, the accuracy can be almost as good as with the use of GCPs for horizontal accuracy, and only slightly worse for vertical accuracy. The fact is that the accuracy can be significantly enhanced with the use of a UAV with PPK, especially when the GCPs cannot be properly distributed and measured in the hazardous areas [27,29,43,47,59,67]. To improve the vertical accuracy, Štroner et al. [47] proposed the use of duplicate flights (double-grid) and geometrically different combinations (different altitudes and camera angle of images); similar conclusions were drawn by Wiącek and Pyka [33]. Harwin et al. [68] concluded that including oblique images is advised, as they can improve self-calibration of the bundle block adjustment and increase horizontal and vertical accuracy. Similar findings were presented by Kyriou et al. [62]; they stated that the combination of nadir and oblique imagery can effectively be used for geomorphological mapping in areas with complex topography and steep slope (>60°), to increase the geometric accuracy of UAV data.
Accuracies of PPK solution up to 0.100 cm should provide a satisfactory photogrammetric-derived product at a representational scale [28,31,33,39]. Teppati Losè et al. [31] mentioned the use of BBA approaches without GCPs at the scale of 1:500. Przybilla and Bäumker [69] proposed to use RTK/PPK, depending on the application intended for the results. For topography mapping, where the accuracy range is between 0.010 and 0.020 m, they proposed the use of RTK/PPK; with cadaster mapping having an accuracy range between 0.010 and 0.030 m, they proposed the use of RTK/PPK with the GCPs; and, for engineering surveying (accuracy range 0.010 m), the use of GCPs was recommended. Padró et al. [37] stated that the PPK method is consistent enough in generating a large-scale mapping with less effort than the GCP method, and that highly detailed maps (spatial resolution <0.05 m) can be achieved. Tomaštík et al. [28] concluded that the BBA_PPK method can provide an optimal solution for mapping in remote areas.
Based on the results of our study, we can come to similar conclusions. Regarding the use of BBA_traditional or BBA_PPK, the decision regarding the georeferencing method must follow the accuracy requirements of data application and the scale needed, and the conditions for a safely conducting of the field survey. In the event of extreme rockfall events, where rockfall activity is high and the conditions for field work are not safe, we would recommend using the BBA_PPK method only. When the results will be used at a regional level (decimeter accuracy), such as for rockfall mapping of release areas, or the modeling of potential rockfall propagation and deposit areas, the use of the BBA_PPK method could prove to be satisfactory (achieving horizontal accuracies around 0.040 m and vertical up to 0.080 m). On the other hand, when the results of the rockfall modeling are to be used for the planning of the technical protection measures, additional GCPs should be included, to increase the accuracy of the results (up to 0.010–0.020 m) and their reliability. To find an optimal ratio between the accuracy of the photogrammetric products, the work load related to georeferencing and, most importantly, the safety of the field operations, we will continue our research by finding an optimal combination of BBA_traditional and BBA_PPK methods. The following research will, therefore, investigate the number of GCPs needed besides the BBA_PPK method, and the importance of the location where they are situated, especially taking into consideration that they are not located on the exposed and hazardous areas.

5. Conclusions

The use of UAV platforms equipped with GNSS receivers that provide georeferencing without the use of GCPs is desirable when mapping large and dangerous areas, such as active rockfall areas, as there is no need to use GCPs, as with indirect georeferencing. In this study, we only tested the use of only the georeferencing of the bundle block adjustment (BBA) with PPK method, in comparison to the use of georeferencing of the BBA with GCPs, to see if it is possible to produce high-accuracy photogrammetric products in the case of rockfalls. The main motivation of the study was to improve the condition for field surveying of GCPs, which is labor-intensive, time-consuming, and, most importantly, dangerous. In the majority of cases, the accuracy of the X, Y and Z coordinates, in the case of the georeferencing of the BBA with the PPK method, did not exceed 0.050 m; in the case of orthomosaic, the accuracy of the X and Y coordinates did not exceed 0.034 m; and in case of DSM, the accuracy of the Z coordinate did not exceed 0.072 m. At one location, the results of georeferencing of the BBA with the PPK method were not comparable to those of georeferencing of the BBA with GCPs for all photogrammetric products, which was mostly due to the satellite configuration on the day of the UAV survey with the BBA_PPK method.
We can conclude that the georeferencing of the BBA with the PPK method can provide high-accuracy products, presenting a viable alternative to the georeferencing of the BBA with GCPs. The decision regarding the use of the georeferencing method must be in line with the purpose of the final results; for example, in the regional modeling of rockfalls, at decimeter accuracy, the BBA georeferencing with the PPK method may be satisfactory, while the planning of technical protection measures with rockfalls, at centimeter accuracy, may require the use of GCPs. The PPK method presents a safer option for mapping in mountainous areas. To improve the accuracy of the BBA georeferencing with the PPK method (i.e., to centimeter accuracy), further analyses will be conducted, in combination with a smaller number of GCPs at certain locations in rockfall areas.

Author Contributions

Conceptualization, B.Ž. and M.K.; methodology, B.Ž. and M.K.; formal analysis, B.Ž.; investigation, B.Ž.; resources, M.K.; data curation, B.Ž.; writing—original draft preparation, B.Ž.; writing—review and editing, M.K.; visualization, B.Ž.; supervision, M.K. Both authors have read and agreed to the published version of the manuscript.

Funding

This research was supported by the Interreg Alpine Space projects “ROCKtheALPS” (ASP 462) and GreenRisk4ALPs (ASP 635). The authors would like to express their gratitude to the Pahernik Foundation, for providing funds to publish this paper.

Institutional Review Board Statement

Not applicable.

Informed Consent Statement

Not applicable.

Data Availability Statement

The data presented in this study are available on request from corresponding author.

Acknowledgments

The first author would like to additionally thank the Pahernik Foundation for co-financing the tuition for the doctoral study, of which this paper presents one of the major results. A special thanks also goes to the Triglav National Park, for issuing a permit for research work within the park.

Conflicts of Interest

The authors declare no conflict of interest.

Appendix A

In the following, a summary of studies that included georeferencing without the use of GCP points (RTK, PPK, and NRTK) in their work is provided. The presented results are only from studies that used georeferencing (GEO) without the additional use of GCPs, and verification points (VPs) as a validation method.
Table A1. The review of studies that included georeferencing without the use of GCP points (RTK, PPK, and NRTK) in their work. Sign “/” is indicating that information is not available.
AuthorsUAVStudy AreaGEOFlight ConfigurationBundle Block AdjustmentOrthomosaicDSM
Horizontal Accuracy (m)Vertical Accuracy (m)Horizontal Accuracy (m)Vertical Accuracy (m)
Mian et al., 2015microdrone md4-1000 quadcopter with RTK GNSSflat agricultural areaRTK
-
Lines flown in opposite direction and perpendicular cross line.
-
60–40% overlap.
-
Station 16 km away.
0.030.110.05/
Fazeli et al., 2016UAV RTK platformagricultural, semi-industrial areaRTK
-
80–60% overlap.
-
120 m flying height
-
lines flown in opposite direction.
0.1640.235//
Mian et al., 2016microdrone md4-1000 quadcopter with RTK GNSSrailway corridorRTK
-
Adjacent lines flown in opposite directions and one perpendicular cross line.
-
80 m flying height.
-
50–80% overlap.
//0.2010.767
Padró et al., 2019octocopter DJI S100 with RGB camera (PPK2) and DJI S900 with multispectral camera (MicaSense RedEdge)—PPK1agricultural area (crops, abandoned vineyards, vegetation)PPK1: single freq.
-
Flying height 80 m.
-
Overlap 80–60%.
//0.2560.238
PPK2: dual freq.//0.0360.036
Wiącek and Pyka, 2019FlyTech UAV BIRDIEresidential city areaPPKFlying variants:
-
1. Mean GSD 2 cm, overlap 60/60%, flight direction N–S.
-
2. Mean GSD 2 cm, overlap 60/60%, flight direction W–E.
-
3. Mean GSD 2 cm, overlap 70/70%, flight direction N–S.
-
4. Mean GSD 3 cm, overlap 60/60%, flight direction W–E.
-
5. Mean GSD 3 cm, overlap 60/60%, flight direction N–S.
-
6. Cross flight: Variant 1 + Variant 4.
-
7. Cross flight: Variant 1 + Variant 2.
-
8. Cross flight: Variant 4 + Variant 5.
//0.030–0.0400.030–0.050
Zhang et al., 2019custom-built Hexacopter and DJI Phantom 3 Advanced, equipped with multi-GNSS RTK receiveragricultural areaPPK
-
90–80% overlap.
-
45 m flying height.
-
Three flights: parallel direction.
//
-
DSLR camera EOS: 0.027
-
action camera GoPro: 0.027–0.031
-
DSLR camera: 0.036
-
action camera GoPro: 0.042
Ekaso et al., 2020DJI Matrice 600 Pro with RTKflatlandsRTK
-
Flying height 40 m. Three flights parallel to the surface.
-
Flight 1: flight planning in Pix4D software, time delay in GNSS capturing time, triggering at 0.110 s.
-
Flight 2: manual flight, time delay in triggering mode was 0.310 s.
-
- Flight 3: flight planning in Pix4D software, triggering mode of 0.110 s.
-
Flight 1: 0.336
-
Flight 2:
-
0.310
-
Flight 3: 0.582
-
Flight 1: 0.480
-
Flight 2: 0.272
-
Flight 3:
-
0.563
//
Hugenholtz et al., 2016senseFly eBee RTKgravel quarry, non-vegetated active pitRTK
-
Two line-of-sights.
-
80–80% overlap.
//0.0250.100
Benassi et al., 2017senseFly eBee RTKcampus area (parking lots, green areas, different buildings)RTK
-
RTK only camera positions from the navigational data without any GCPs.
-
80 m flight height.
-
85–80% overlap.
//0.0300.120
Forlani et al., 2018senseFly eBee RTKcampus area with buildings, roads, car parks and meadowsRTK
-
85–80% overlap.
-
90 m height of the flight.
0.0250.095//
NRTK0.0420.126//
Rabah et al., 2018senseFly eBee RTKindustrial areaRTK
-
Flight height 85 m.
-
80–80% overlap.
0.0340.029//
Forlani et al., 2019senseFly eBee RTK and DJI Phantom 4 RTKroad bridge and riverbedRTK
-
4 flights; 2 flights with each copter.
-
DJI Phantom 4 RTK for auxiliary flight and senseFly eBee for forward overlap.
-
Phantom 4 RTK (Ph4): 30 m, 82% overlap.
-
eBee block: EW 97 m; 50–70% overlap and NS: 105 m; 55–75% overlap.
-
eBee block: 0.022
-
eBee + P4 30: 0.023
-
eBee block: 0.057
-
eBee + P4 30: 0.115
//
Tomaštík et al., 2019senseFly eBee RTKrugged forested area with valleys and ridgesPPK
-
Different flight patterns: FP1—perpendicular to the valleys, FP2—parallel to the valleys.
-
Different conditions: LOFF—leaf-off, LO—leaf-on.
-
Flight height: 170–180 m.
-
Overlap: 80–40%.
-
FP1–LOFF: 0.108
-
FP2–LOFF: 0.119
-
FP12:
-
0.095
-
FP1–LO: 0.115
-
FP2–LO: 0.122
-
FP12–LO: 0.078
-
FP1–LOFF: 0.155
-
FP2–LOFF: 0.212
-
FP12:
-
0.143
-
FP1–LO: 0.164
-
FP2–LO: 0.161
-
FP12–LO: 0.222
-
FP1–LOFF: 0.055
-
FP2–LOFF: 0.087
-
FP12: 0.047
-
FP1–LO: 0.059
-
FP2–LO: 0.074
-
FP12–LO: 0.044
-
FP1–LOFF: 0.089
-
FP2–LOFF: 0.154
-
FP12:
-
0.084
-
FP1–LO: 0.082
-
FP2–LO: 0.101
-
FP12–LO: 0.154
Tufarolo et al., 2019senseFly eBee RTKmorphologically complex (quarry) area with extremely steep slopesNRTK
-
Due to high elevation changes, flight planning according to the DEM; constant elevation.
0.8301.880//
Forlani et al., 2020DJI Phantom 4 RTKgrassed sports areaRTK
-
Flight 1: 80–70% overlap, 80 m height, NRTK.
-
Flight 2: 80–70% overlap, 83 m, RTK.
-
Flight 3: 80–70% overlap, 82 m.
-
Flight 4: 80–80% overlap, 115 m, RTK.
0.020–0.0400.020–0.050//
PPK0.010–0.0400.010–0.060//
Štroner et al., 2020DJI Phantom 4 RTKurban and rural areaRTK
-
Flight height 110 m.
-
75–75% overlap.
-
Parallel and cross-grid flight pattern.
0.0440.103//
Taddia et al., 2020DJI Phantom 4 RTKbuilding’s façadeRTK
-
Vertical surveying of the building.
-
70–70% overlap.
-
Planned mission GS RTK app.
-
Obstacle free: 0.045.
-
Visual sky not clear: 0.045
-
Obstacle free: 0.054.
-
Visual sky not clear: 0.048
//
NRTK
-
Obstacle free: 0.022.
-
Visual sky not clear: 0.045
-
Obstacle free: 0.068.
-
Visual sky not clear: 0.081
//
Teppati Losè et al., 2020DJI Phantom 4 RTKarcheological/architectural siteNRTK
-
Flight direction E–W.
-
Overlap of 80–70%.
-
Flight height 40 m.
0.0570.068//
PPK0.0060.727//
Teppati Losè et al., 2020bDJI Phantom 4 RTKgardensNRTK
-
NRTK_1: nadiral + oblique images.
-
NRTK_2: nadiral.
-
NRTK_1: 0.014
-
NRTK_2: 0.031
-
NRTK_1: 0.040
-
NRTK_2: 0.418
//
PPK
-
PPK_1: nadiral + oblique images; self-calibration, base station on site.
-
PPK:2: nadiral images; self-calibration, base station on site.
-
PPK_7: nadiral images; on site calibration, base station on site.
-
PPK_8: nadiral images; on site calibration, base station on site.
-
PPK_9: nadiral + oblique images, Rinex.
-
PPK_10: CORS, self-calibration, 8 km.
-
PPK_11: CORS, 28 km, self-calibration.
-
PPK_12: CORS, 38 km, self-calibration.
-
PPK_13: CORS, self-calibration, 58 km.
-
PPK_14: CORS, self-calibration, 68 km.
-
PPK_15: CORS, self-calibration, 80 km.
-
PPK_1: 0.015
-
PPK_2: 0.435
-
PPK_7: 0.161
-
PPK_8: 0.111
-
PPK_9: 0.018
-
PPK_10: 0.279
-
PPK_11: 0.021
-
PPK_12: 0.034
-
PPK_13: 0.019
-
PPK_14: 0.029
-
PPK_15: 0.037
-
PPK_1: 0.028
-
PPK_2: 2.988
-
PPK_7: 0.117
-
PPK_8: 0.118
-
PPK_9: 0.025
-
PPK_10: 0.021
-
PPK_11: 0.032
-
PPK_12: 0.079
-
PPK_13: 0.097
-
PPK_14: 0.156
-
PPK_15: 0.184
//
DRTK
-
DRTK_1: nadiral + oblique images.
-
DRTK_2: nadiral + oblique images.
-
DRTK_1: 0.046
-
DRTK_2: 0.047
  • DRTK_1: 0.049
  • DRTK_2: 0.446
//
Taddia et al., 2020DJI Phantom 4 RTKcoastal areaPPK
-
Flight height: 80 m.
-
70–80% overlap.
-
Nadiral mapping single grid mission.
-
Oblique images for center part of the study site.
-
Nadiral: 0.050
-
Oblique: 0.020
-
Nadiral: 0.075
-
Oblique: 0.020
Štroner et al., 2021DJI Phantom 4 RTK UAVurban and rural areaRTK
-
Flights heights: 75 m (nadiral), 100 m (vertical) and 125 m (nadiral).
-
Vertical image acquisition with angle 15° and 30° from the vertical direction.
-
Gridded flight plan: two perpendicular flights.
-
75% front and side overlap.
<0.030<0.053//

References

  1. Giordian, D.; Manconi, A.; Facello, A.; Baldo, M.; dell’Anese, F.; Allasia, P.; Dutto, F. Brief communication: The use of unmanned aerial vehicle in a rockfall emergency scenario. Nat. Hazards Earth Syst. Sci. 2015, 15, 163–169. [Google Scholar] [CrossRef] [Green Version]
  2. Saroglou, C.; Asteriou, P.; Zekkos, D.; Tsiambaos, G.; Clark, M.; Manousakis, J. UAV-based mapping, back analysis and trajectory modeling of a coseismic rockfall in Lefkada island, Greece. Nat. Hazards Earth Syst. Sci. 2018, 18, 321–333. [Google Scholar] [CrossRef] [Green Version]
  3. Sarro, R.; Riquelme, A.; Garcia-Davalillo, J.C.; Mateos, R.M.; Tomás, R.; Pasto, J.L.; Cano, M.; Herrera, G. Rockfall simulation based on UAV photogrammetry data obtained during and emergency declaration: Application at a cultural heritage site. Remote Sens. 2018, 10, 1923. [Google Scholar] [CrossRef] [Green Version]
  4. Rodriguez, J.; Macciotta, R.; Hendry, M.T.; Roustaei, M.; Gräpel, C.; Skirrow, R. UAVs for monitoring, investigation, and mitigation design of a rock slope with multiple failure mechanisms—a case study. Landslides 2020, 17, 2027–2040. [Google Scholar] [CrossRef]
  5. Danzi, M.; Di Crescenzo, G.; Ramondini, M.; Santo, A. Use of unmanned aerial vehicles (UAVs) for photogrammetric surveys in rockfall instability studies. Rend. Online Soc. Geol. Ital. 2013, 24, 82–85. [Google Scholar]
  6. Sotier, B.; Adams, M.; Lechner, V. UAV-based natural hazard management in high-alpine terrain—Case studies from Austria. Geophys. Res. Abstr. 2015, 17, EGU2015–EGU13611. [Google Scholar]
  7. Salvini, R.; Mastrorocco, G.; Esposito, G.; Di Bartolo, S.; Coggan, J.; Vanneschi, C. Use of a remotely piloted aircraft system for hazard assessment in a rocky mining area (Lucca, Italy). Nat. Hazards Earth Syst. Sci. 2018, 18, 287–302. [Google Scholar] [CrossRef] [Green Version]
  8. Vanneschi, C.; Di Camillo, M.; Aiello, E.; Bonciani, F.; Salvini, R. SfM-MVS photogrammetry for rockfall analysis and hazard assessment along the ancient roman via flamina road at the Furlo Gorge. ISPRS Int. J. Geoinf. 2019, 8, 325. [Google Scholar] [CrossRef] [Green Version]
  9. Colomina, I.; Molina, P. Unmanned aerial systems for photogrammetry and remote sensing: A review. ISPRS J. Photogramm. 2014, 92, 79–97. [Google Scholar] [CrossRef] [Green Version]
  10. Nex, F.; Remondino, F. UAV for 3D mapping applications: A review. Appl. Geomat. 2014, 6, 1–15. [Google Scholar] [CrossRef]
  11. Giordian, D.; Manconi, A.; Remondino, F.; Nex, F. Use of unmanned aerial vehicles in monitoring and application and management of natural hazards. Geomat. Nat. Haz. Risk 2017, 8, 1–4. [Google Scholar] [CrossRef]
  12. Buill, F.; Núñez-Andrés, M.A.; Lantada, N.; Prades, A. Comparing of Photogrammetric Techniques for rockfalls monitoring. In Proceedings of the Word Multidisciplinary Earth Sciences Symposium (WMESS 2016), Prague, Czech Republic, 5–9 September 2016. [Google Scholar] [CrossRef] [Green Version]
  13. Gomez, C.; Purdie, H. UAV-based photogrammetry and geocomputing for hazards and disaster risk monitoring—A review. Geoenviron. Disasters 2016, 3, 23. [Google Scholar] [CrossRef] [Green Version]
  14. Salvini, R.; Francioni, M.; Riccucci, S.; Bonciani, F.; Callegari, I. Photogrammetry and laser scanning for analyzing slope stability and rock fall runout along the Domodossola-Iselle railway, the Italian Alps. Geomorphology 2013, 185, 110–122. [Google Scholar] [CrossRef]
  15. Kim, D.H.; Gratchev, I.; Berends, J.; Balasubramaniam, A. Calibration of restitution coefficients using rockfall simulations based on 3D photogrammetry model: A case study. Nat. Hazards 2015, 78, 1931–1946. [Google Scholar] [CrossRef] [Green Version]
  16. Lato, M.J.; Hutchinson, D.J.; Gauthier, D.; Edwards, T.; Ondercin, M. Comparison of airborne laser scanning, terrestrial laser scanning, and terrestrial photogrammetry for mapping differential slope change in mountainous terrain. Can. Geotech. J. 2015, 52, 129–140. [Google Scholar] [CrossRef]
  17. Manousakis, J.; Zekkos, D.; Saroglou, H.; Clark, M. Comparison of UAV-enabled photogrammetry-based 3D point clouds and interpolated DSMs of sloping terrain for rockfall hazard analysis. In Proceedings of the International Archives of the Photo-grammetry, Remote Sensing and Spatial Information Sciences, 11th 3D Geoinfo Conference, Athens, Greece, 20–21 October 2016; Volume XLII-2/W2, pp. 71–77. [Google Scholar]
  18. Thoeni, K.; Guccione, D.; Santise, M.; Giacomini, A.; Roncella, R.; Forlani, G. The potential of low-cost RPAS multi-view re-construction of sub-vertical rock faces. Int. Arch. Photogramm. Remote Sens. Spatial Inf. Sci. 2016, XLI-B5, 909–916. [Google Scholar] [CrossRef] [Green Version]
  19. Albarelli, D.S.N.A.; Mavrouli, O.C.; Nyktas, P. Identification of potential rockfall sources using UAV-derived point cloud. Bull. Eng. Geol. Environ. 2021, 80, 6539–6561. [Google Scholar] [CrossRef]
  20. Santangelo, M.; Alvioli, M.; Baldo, M.; Cardinali, M.; Giordian, D.; Guzzetti, F.; Marchesini, I.; Reichenbach, P. Brief communication: Remotely piloted aircraft systems for rapid emergency response: Road exposure to rockfall in Villanova di Accumoli. Nat. Hazards Earth Syst. Sci. 2019, 19, 325–335. [Google Scholar] [CrossRef] [Green Version]
  21. Wang, S.; Zhang, Z.; Wang, C.; Zhu, C.; Ren, Y. Multistep slope stability analysis based on unmanned aerial vehicle photogrammetry. Environ. Earth Sci. 2019, 78, 260. [Google Scholar] [CrossRef]
  22. Koukouvelas, I.K.; Nikolakopoulos, K.G.; Zygouri, V.; Kyriou, A. Post-seismic monitoring of cliff mass wasting using an unmanned aerial vehicle and field data at Egremni, Lefkada Island, Greece. Geomorphology 2020, 367, 107036. [Google Scholar] [CrossRef]
  23. Macciotta, R.; Gräpel, C.; Skirrow, R. Fragmented rockfall volume distribution from photogrammetry-based structural mapping and discrete fracture networks. Appl. Sci. 2020, 10, 6977. [Google Scholar] [CrossRef]
  24. Gabrlik, P. The use of direct georeferencing in aerial photogrammetry with micro UAV. IFAC-Pap. 2015, 48, 380–385. [Google Scholar] [CrossRef]
  25. Rabah, M.; Basiouny, M.; Ghanem, E.; Elhadry, A. Using RTK and VRS in direct geo-referencing of the UAV imagery. NRIAG J. Astron. Geophys. 2018, 7, 220–226. [Google Scholar] [CrossRef] [Green Version]
  26. Cramer, M.; Stallmann, D.; Haala, N. Direct geo-referencing using GPS/inertial exterior orientations for photogrammetric applications. In Proceedings of the International Archives of Photogrammetry and Remote Sensing, Amsterdam, The Netherlands, 16–23 July 2020; Volume 33, pp. 198–205. [Google Scholar]
  27. Forlani, G.; Diotri, F.; di Cella, U.M.; Roncella, R. Indirect UAV strip georeferencing by on-board GNSS data under poor satellite coverage. Remote Sens. 2019, 11, 1765. [Google Scholar] [CrossRef] [Green Version]
  28. Tomaštík, J.; Mokroš, M.; Surový, P.; Grznárová, A.; Merganič, J. UAV RTK/PPK method—An optimal solution for mapping inaccessible forested areas? Remote Sens. 2019, 11, 721. [Google Scholar] [CrossRef] [Green Version]
  29. Cledat, E.; Jospin, L.V.; Cucci, D.A.; Skaloud, J. Mapping quality prediction for RTK/PPK-equipped micro-drones operating in complex natural environment. ISPRS J. Photogramm. 2020, 167, 24–38. [Google Scholar] [CrossRef]
  30. Sanz-Ablanedo, E.; Chandle, J.H.; Rodríguez-Pérez, J.; Ordóñez, C. Accuracy of unmanned aerial vehicle (UAV) and SfM photogrammetry survey as a function of the number and location of ground control points used. Remote Sens. 2018, 10, 1606. [Google Scholar] [CrossRef] [Green Version]
  31. Teppati Losè, L.; Chiabrando, F.; Giulio Tonolo, F. Are measured ground control points still required in UAV based large scale mapping? Assessing the positional accuracy of an RTK multi-roto platform. Int. Arch. Photogramm. Remote. Sens. Spat. Inf. Sci. 2020, XLIII-B1-2020, 507–514. [Google Scholar] [CrossRef]
  32. Benassi, F.; Dall’Asta, E.; Diotri, F.; Forlani, G.; Morra di Cella, U.; Roncella, R.; Santise, M. Testing accuracy and repeatability of UAV blocks oriented with GNSS-supported aerial triangulation. Remote Sens. 2017, 9, 172. [Google Scholar] [CrossRef] [Green Version]
  33. Wiącek, P.; Pyka, K. The test field for UAV accuracy assessments. Int. Arch. Photogramm. Remote Sens. Spatial Inf. Sci. 2019, XLI-1/W2, 67–73. [Google Scholar] [CrossRef] [Green Version]
  34. DJI Phantom 4 RTK. Available online: https://www.dji.com/si/phantom-4-rtk (accessed on 18 April 2021).
  35. senseFly 2021. Available online: https://www.sensefly.com/ (accessed on 11 May 2021).
  36. Hugenholtz, C.; Brown, O.; Walker, J.; Barchyn, T.; Nesbit, P.; Kucharczyk, M.; Myshak, S. Spatial accuracy of UAV-derived orthoimagery and topography: Comparing photogrammetric models processed with direct geo-referencing and ground control points. Geomatica 2016, 70, 21–30. [Google Scholar] [CrossRef]
  37. Padró, J.-C.; Muñoz, F.-J.; Planas, J.; Pons, X. Comparison of four UAV georeferencing methods for environmental monitoring purposes focusing on the combined use with airborne and satellite remote sensing platforms. Int. J. Appl. Earth Obs. Geoinf. 2019, 75, 130–140. [Google Scholar] [CrossRef]
  38. Mian, O.; Luter, J.; Lipa, G.; Hutton, J.J.; Gavelle, E.; Borghini, S. Direct georeferencing on small unmanned aerial platforms for improved reliability and accuracy of mapping without the need for ground control points. In International Archives of the Photogrammetry, Remote Sensing and Spatial Information Sciences, Volume XL-1/W4, Proceedings of the International Conference on Unmanned Aerial Vehicles in Geomatics, Toronto, Canada, 30 August–2 September 2015; ISPRS: Toronto, ON, Canada, 2015; pp. 397–402. [Google Scholar]
  39. Fazeli, H.; Samadzadegan, F.; Dadrasjavan, F. Evaluating the potential of RTK-UAV for automatic point cloud generation in 3D rapid mapping. In Proceedings of the International Archives of the Photogrammetry, Remote Sensing and Spatial Information Sciences, Volume XLI-B6, XXIII Congress, Prague, Czech Republic, 12–19 July 2016; ISPRS: Prague, Czech Republic, 2016; pp. 221–226. [Google Scholar]
  40. Zhang, H.; Aldana-Jague, E.; Clapuyt, F.; Wilken, F.; Vanacker, V.; Van Oost, K. Evaluating the potential of post-processing kinematic (PPK) georeferencing for UAV-based structure-from-motion (SfM) photogrammetry and surface change detection. Earth Surf. Dynam. 2019, 7, 807–827. [Google Scholar] [CrossRef] [Green Version]
  41. Ekaso, D.; Nex, F.; Kerle, N. Accuracy assessment of real-time kinematics (RTK) measurements in unmanned aerial vehicles (UAV) for direct geo-referencing. Geo Spat. Inf. Sci. 2020, 23, 165–181. [Google Scholar] [CrossRef] [Green Version]
  42. Mian, O.; Luter, J.; Lipa, G.; Hutton, J.J.; Gavelle, E.; Borghini, S. Accuracy assessment of direct georeferencing for photogrammetric applications on small unmanned aerial platforms. In International Archives of the Photogrammetry, Remote Sensing and Spatial Information Sciences, Volume XL-3/W4, Proceedings of the EuroCOW 2016, the European Calibration and Orientation Workshop, Lausanne, Switzerland, 10–12 February 2016; Applanix: Richmond Hill, ON, Canada, 2016; pp. 77–83. [Google Scholar]
  43. Forlani, G.; Dall’Asta, E.; Diotri, F.; Morra di Cella, U.; Roncella, R.; Santise, M. Quality assessment of DSMs produced from UAV flights georeferenced with on-board RTK positioning. Remote Sens. 2018, 10, 311. [Google Scholar] [CrossRef] [Green Version]
  44. Forlani, G.; Diotri, F.; Morra di Cella, U.; Roncella, R. UAV block georeferencing and control by on-board GNSS data. Int. Arch. Photogramm. Remote Sens. Spatial Inf. Sci. 2020, XLIII-B2-2020, 9–16. [Google Scholar] [CrossRef]
  45. Štroner, M.; Urban, R.; Reindl, R.; Seidl, J.; Brouček, J. Evaluation of the georeferencing accuracy of a photogrammetric model using a quadrocopter with onboard GNSS RTK. Sensors 2020, 20, 2318. [Google Scholar] [CrossRef] [Green Version]
  46. Taddia, Y.; González-García, L.; Zambello, E.; Pellegrinelli, A. Quality assessment of photogrammetric models for façade and building reconstruction using DJI Phantom 4 RTK. Remote Sens. 2020, 12, 3144. [Google Scholar] [CrossRef]
  47. Štroner, M.; Urban, R.; Seidl, J.; Reindl, T.; Brouček, J. Photogrammetry using UAV-mounted GNSS RTK georeferencing strategies without GCPs. Remote Sens. 2021, 13, 1336. [Google Scholar] [CrossRef]
  48. Tufarolo, E.; Vanneschi, C.; Casella, M.; Salvini, R. Evaluation of camera positions and ground control points quality in a GNSS-RTK based UAV survey: Preliminary results from a practical test in morphological very complex areas. In International Archives of the Photogrammetry, Remote Sensing and Spatial Information Sciences, Volume XLII-2/W13; Proceedings of the Geospatial Week 2019, Enschede, The Netherlands, 10–14 June 2019; ISPRS: Enschede, The Netherlands, 2019; pp. 637–641. [Google Scholar]
  49. Teppati Losè, L.; Chiabrando, F.; Tonolo, F.G. Boosting the timeliness of UAV large scale mapping. Direct georeferencing approaches: Operational strategies and best practices. ISPRS Int. J. Geo.-Inf. 2020, 9, 578. [Google Scholar] [CrossRef]
  50. Taddia, Y.; Stecchi, F.; Pellegrini, A. Coastal mapping using DJI Phantom 4 RTK in post-processing kinematic mode. Drones 2020, 4, 9. [Google Scholar] [CrossRef] [Green Version]
  51. Caroti, G.; Zaragoza, M.-E.; Piemonte, A. Accuracy assessment in structure from motion 3D reconstruction from UAV-born images The influence of the data processing methods. In International Archives of Photogrammetry, Remote Sensing and Spatial Information Sciences, Volume XL-1/W4, Proceedings of the International Conference on Unmanned Aerial Vehicles in Geomatics, Toronto, Canada, 30 August–2 September 2015; ISPRS: Toronto, ON, Canada, 2015; pp. 103–109. [Google Scholar]
  52. Jurkovšek, B. Tolmač Listov Beljak in Ponteba: Osnovna Geološka Karta, SFRJ 1:100,000; Zvezni Geološki Zavod: Belgrade, Serbia, 1987; p. 55. [Google Scholar]
  53. Placer, L. Osnovne tektonske razčlenitve Slovenije. Geologija 2008, 51, 205–217. [Google Scholar] [CrossRef]
  54. Jurkovšek, B.; Šribar, L.; Ogorelec, B.; Kolar-Jurkovšek, T. Pelagic Jurassic and Cretaceous beds in the western part of the Julian Alps. Geologija 2020, 31, 285–328. [Google Scholar]
  55. ArcGIS Pro 2.7.3, Esri. Available online: https://www.esri.com/en-us/arcgis/products/arcgis-pro/resources (accessed on 19 April 2021).
  56. Clapuyt, F.; Vanacker, V.; Van Oost, K. Reproducibility of UAV-based earth topography reconstructions based on Structure-from-Motion algorithms. Geomorphology 2016, 260, 4–15. [Google Scholar] [CrossRef]
  57. Agüera-Vega, F.; Carvajal-Ramírez, F.; Martínez-Carricondo, P. Assessment of photogrammetric mapping accuracy based on variation ground control points number using unmanned aerial vehicle. Measurement 2017, 95, 221–227. [Google Scholar] [CrossRef]
  58. Oniga, V.-E.; Breaban, A.-I.; Statescu, F. Determining the Optimum Number of Ground Control Points for Obtaining High Precision Results Based on UAS Images. Proceedings 2018, 2, 5165. [Google Scholar] [CrossRef] [Green Version]
  59. Bolkas, D. Assessment of GCP Number and Separation Distance for Small UAS Surveys with and without GNSS-PPK Positioning. J. Surv. Eng. 2019, 145, 04019007. [Google Scholar] [CrossRef]
  60. Oniga, V.-E.; Breaban, A.-I.; Pfeifer, N.; Chirila, C. Determining the suitable number of ground control points for UAV images georeferencing by varying number and spatial distribution. Remote Sens. 2020, 12, 876. [Google Scholar] [CrossRef] [Green Version]
  61. Pix4Dmapper—Pix4D 2021. Available online: https://www.pix4d.com/product/pix4dmapper-photogrammetry-software (accessed on 19 April 2021).
  62. Kyriou, A.; Nikolakopoulos, K.; Koukouvelas, I. How image acquisition geometry of UAV campaigns affects the derived products and their accuracy in areas with complex geometry. ISPRS Int. J. Geo.-Inf. 2021, 10, 408. [Google Scholar] [CrossRef]
  63. FGCD—Federal Geographic Data Committee. Geospatial Positioning Accuracy Standards. FGDC-STD-007.3–1998. Part 3: National Standards for Spatial Data Accuracy (NSSDA); Federal Geographic Data Committee Secretariat c/o U.S. Geological Survey: Reston, VA, USA, 1998; pp. 1–25. [Google Scholar]
  64. Shapiro, S.S.; Wilk, M.B. An analysis of variance for normality (complete samples). Biometrika 1965, 52, 591–611. [Google Scholar] [CrossRef]
  65. Sealy, G.W. The probable error of a mean. Biometrika 1908, 6, 1–25. [Google Scholar]
  66. Wilcoxon, F. Individual comparison by ranking methods. Biom. Bull. 1945, 1, 80–83. [Google Scholar] [CrossRef]
  67. RStudio Team. RStudio: Integrated Development for R; RStudio Inc.: Boston, MA, USA, 2016. [Google Scholar]
  68. Harwin, S.; Lucieer, A.; Osborn, J. The impact of the calibration method on the accuracy of point clouds derived using unmanned aerial vehicle multi-view stereopsis. Remote Sens. 2015, 7, 11933–11953. [Google Scholar] [CrossRef] [Green Version]
  69. Przybilla, H.-J.; Bäumker, M. RTK and PPK: GNSS-Technologies for Direct Georeferencing of Uav Image Flights. In Proceedings of the FIG Working Week 2020, Amsterdam, The Netherlands, 10–14 May 2020; p. 52. [Google Scholar]
Figure 1. Locations of rockfalls (Slovenia) that were selected as study sites.
Remotesensing 13 03812 g001
Figure 2. Three-dimensional models of rockfalls (ac) and photos from the field (df) of Kekec (a,d), Krnica (b,e), and Mangart (c,f).
Remotesensing 13 03812 g002
Figure 3. Elevation and slope characteristics of studied areas (ac) with the drawn locations of the verification points (VPs), ground control points (GCPs), and digitalized rockfall runout areas (df) at Kekec (a,d), Krnica (b,e), and Mangart (c,f).
Remotesensing 13 03812 g003
Figure 4. Example of verification point (VP)/ground control point (GCP) target set out in the field.
Remotesensing 13 03812 g004
Figure 5. Final orthomosaics (ac) and digital surface models (DSM) (df) for Kekec (a,d), Krnica (b,e), and Mangart (c,f). The presented products were all produced by using the BBA_traditional method.
Remotesensing 13 03812 g005
Figure 6. Frequency distribution of the X, Y and Z coordinates’ differences at all three rockfall sites for BBA_traditional and BBA_PPK. Bar width is set to 0.01 m.
Remotesensing 13 03812 g006
Figure 7. Frequency distribution of the X and Y coordinate differences at all three rockfall sites for orthomosaic_traditional (produced by BBA_traditional) and orthomosaic_PPK (produced by BBA_PPK). Bar width is set to 0.01 m.
Remotesensing 13 03812 g007
Figure 8. Frequency distribution of the Z coordinates differences at all three rockfall sites for DSM_traditional and DSM_PPK. Bar width is set to 0.01 m.
Remotesensing 13 03812 g008
Figure 9. Spatial distribution of the differences in X, Y and Z coordinates, calculated for accuracy assessment of BBA produced by the BBA_traditional and the BBA_PPK method.
Remotesensing 13 03812 g009
Figure 10. Spatial distribution of the differences in X and Y coordinates, calculated for accuracy assessment of orthomosaic produced by the BBA_traditional and the BBA_PPK method, and of the differences in Z coordinates, calculated for accuracy assessment of DSM produced by the BBA_traditional method and the BBA_PPK method.
Remotesensing 13 03812 g010
Table 1. Results of photogrammetric processing provided by the Pix4D software for different locations and georeferencing methods.
LocationArea Surveyed (ha)Georeferencing MethodCameras Total/AlignedKey Points per ImagesDense Cloud (nbr Points)Orthomosaic, DSM Resolution (cm)
KEKEC3.4BBA_traditional135/13565,32645,662,559 (327.6/m3)2.4
BBA_PPK45,754,260 (323.16/m3)
KRNICA9.6BBA_traditional659/65969,863159,285,721 (836.51/m3)2.5
BBA_PPK165,097,231 (756.25/m3)
MANGART7.4BBA_traditional368/36872,809100,688,038 (1635.12/m3)2.2
BBA_PPK106,209,704 (1707.94/m3)
Table 2. Precision of the coordinates X0, Y0 and Z0 in processing used as the perspective centers for BBA_PPK method and precision values for the GCP in the BBA_traditional.
Precision in mX0Y0Z0
KEKECBBA_traditional0.0120.0090.019
BBA_PPK0.0060.0120.013
KRNICABBA_traditional0.0130.0130.014
BBA_PPK0.0170.0290.036
MANGARTBBA_traditional0.0080.0060.006
BBA_PPK0.0390.0330.579
Table 3. Basic statistics for the differences in X, Y and Z coordinates of VPs measured in the field by total station and obtained by the BBA_traditional and BBA_PPK methods.
Units in mKEKECKRNICAMANGART
BBA_TraditionalBBA_PPKBBA_TraditionalBBA_PPKBBA_TraditionalBBA_PPK
diffX-MIN−0.017−0.001−0.098−0.091−0.029−0.148
diffX-MAX0.0200.0370.0560.0570.011−0.043
diffX-MEAN0.0040.0170.0010.013−0.004−0.098
diffX-MEDIAN0.0040.0160.0040.015−0.003−0.100
diffX-SD0.0080.0090.0260.0290.0080.028
RMSEX0.0090.0190.0260.0320.0090.102
diffY-MIN−0.0280.000−0.033−0.041−0.024−0.171
diffY-MAX0.0160.0440.0910.1000.0130.001
diffY-MEAN−0.0060.0160.0040.008−0.003−0.109
diffY-MEDIAN−0.0060.0150.0010.002−0.002−0.118
diffY-SD0.0080.0100.0200.0310.0080.047
RMSEY0.0100.0190.0200.0310.0080.119
diffZ-MIN−0.0100.023−0.022−0.102−0.0140.102
diffZ-MAX0.0370.0690.038−0.0040.0150.431
diffZ-MEAN0.0090.0490.004−0.0420.0020.245
diffZ-MEDIAN0.0090.0480.001−0.0400.0030.232
diffZ-SD0.0100.0100.0140.0230.0070.092
RMSEz0.0140.0500.0150.0480.0070.261
RMSEXYZ0.0190.0560.0360.0660.0140.305
LEGEND
diff(X/Y/Z)-MINthe minimum value of the differences in X/Y/Z
diff(X/Y/Z)-MAXthe maximum value of the differences in X/Y/Z
diff(X/Y/Z)-MEANthe mean value of the differences in X/Y/Z
diff(X/Y/Z)-MEDIANthe median value of the differences in X/Y/Z
diff(X/Y/Z)-SDthe standard deviation of the differences in X/Y/Z
RMSE(X/Y/Z)root mean square error of X/Y/Z
Table 4. Basic statistics for differences in X and Y coordinates measured in the field by the total station and obtained by the orthomosaic_traditional or orthomosaic_PPK methods.
Units in m.KEKECKRNICAMANGART
Orthomosaic_TraditionalOrthomosaic_PPKOrthomosaic_TraditionalOrthomosaic_PPKOrthomosaic_TraditionalOrthomosaic_PPK
diffX-MIN−0.0070.008−0.104−0.079−0.011−0.139
diffX-MAX0.0450.0610.0460.0520.037−0.026
diffX-MEAN0.0180.0320.0000.0140.011−0.089
diffX-MEDIAN0.0180.0310.0030.0170.012−0.088
diffX-SD0.0120.0120.0270.0280.0120.026
RMSEX0.0210.0340.0260.0310.0160.093
diffY-MIN−0.036−0.013−0.056−0.041−0.044−0.181
diffY-MAX0.0110.0390.0780.1060.016−0.016
diffY-MEAN−0.0170.013−0.0120.006−0.005−0.119
diffY-MEDIAN−0.0160.011−0.0130.002−0.002−0.133
diffY-SD0.0110.0120.0220.0290.0120.045
RMSEY0.0200.0170.0250.0300.0130.127
RMSEXY0.0290.0390.0360.0430.0200.157
LEGEND
diff(X/Y)-MINthe minimum value of the differences in X/Y
diff(X/Y)-MAXthe maximum value of the differences in X/Y
diff(X/Y)-MEANthe mean value of the differences in X/Y
diff(X/Y)-MEDIANthe median value of the differences in X/Y
diff(X/Y)-SDthe standard deviation of the differences in X/Y
RMSE(X/Y)root mean square error of X/Y
Table 5. Basic statistics for differences in Z coordinate measured in the field by total station and obtained by the DSM_traditional or DSM_PPK.
Units in mKEKECKRNICAMANGART
DSM_TraditionalDSM_PPKDSM_TraditionalDSM_PPKDSM_TraditionalDSM_PPK
diffZ-MIN−0.051−0.002−0.079−0.129−0.0530.081
diffZ-MAX0.1220.1840.1650.2450.0420.453
diffZ-MEAN0.0100.0530.026−0.002−0.0220.244
diffZ-MEDIAN0.0130.0480.019−0.005−0.0220.237
diffZ-SD0.0370.0370.0550.0720.0210.093
RMSEZ0.0380.0650.0600.0720.0300.261
LEGEND
diffZ-MINthe minimum value of the differences in Z
diffZ-MAXthe maximum value of the differences in Z
diffZ-MEANthe mean value of the differences in Z
diffZ-MEDIANthe median value of the differences in Z
diffZ-SDthe standard deviation of the differences in Z
RMSEZroot mean square error of Z
Publisher’s Note: MDPI stays neutral with regard to jurisdictional claims in published maps and institutional affiliations.

