Article

Modeling the Near-Surface Energies and Water Vapor Fluxes Behavior in Response to Summer Canopy Density across Yanqi Endorheic Basin, Northwestern China

1
State Key Laboratory of Desert and Oasis Ecology, Xinjiang Institute of Ecology and Geography, Chinese Academy of Sciences, 818 South Beijing Road, Urumqi 830011, China
2
University of Chinese Academy of Sciences, Beijing 100049, China
3
Faculty of Environmental Sciences, University of Lay Adventists of Kigali (UNILAK), Kigali 6392, Rwanda
4
Center of Excellence in Biodiversity and Natural Resource Management, University of Rwanda, College of Agriculture, Animal Sciences and Veterinary Medicine, Huye 117, Rwanda
*
Author to whom correspondence should be addressed.
Remote Sens. 2021, 13(18), 3764; https://doi.org/10.3390/rs13183764
Submission received: 31 August 2021 / Revised: 16 September 2021 / Accepted: 16 September 2021 / Published: 20 September 2021

Abstract

:
The Yanqi basin is the main irrigated and active agroecosystem in semi-arid Xinjiang, northwestern China, which further seeks responses to the profound local water-related drawbacks in relation to the unceasing landscape desiccation and scant precipitation. Yet, it comes as an astonishment that a few reported near-surface items and water vapor fluxes as so far required for water resources decision support, particularly in a scarce observation data region. As a contributive effort, here we adjusted the sensible heat flux (H) calibration mechanism of Surface Energy Balance Algorithm for Land (SEBAL) to high-resolution satellite dataset coupled with in-situ observation, through a wise guided “anchor” pixel assortment from surface reflectance-α, Leaf area index-LAI, vegetation index-NDVI, and surface temperature ( P c o l d ,   P h o t ) to model the robustness of energy fluxes and Evapotranspiration-ETa over the basin. Results reasonably reflected ETa which returned low RMSE (0.6 mm d 1 ), MAE (0.48 mm d 1 ) compared to in-situ recordings, indicating the competence of SEBAL to predict vapor fluxes in this region. The adjustment unveiled the estimates of the land-use contribution to evapotranspiration with an average ranging from 3 to 4.69 mm d 1 , reaching a maximum of 5.5 mm d 1 . Furthermore, findings showed a high striking energy dissipation (LE/Rn) across grasslands and wetlands. The vegetated surfaces with a great evaporative fraction were associated with the highest LE/Rn (70–90%), and water bodies varying between 20% and 60%, while the desert ecosystem dissipated the least energy with a low evaporative fraction. Still, besides high portrayed evaporation in water, grasslands and wetlands varied interchangeably in accounting for the highest ETa followed by cropland. Finally, a substantial nexus between available energy (Rn-G) and ETa informed the available energy, influenced by NDVI to be the primary driver of these oases’ transpiration. This study provides essentials of near-surface energy fluxes and the likelihood of ETa with considerable baseline inferences for Yanqi that may be beneficial for long-term investigations that will attend in agrometeorological services and sustainable management of water resources in semi-arid regions.

1. Introduction

In northwest China, Xinjiang arid ecosystems, the amount of oasis water consumption stands for 94% of the total consumption in agroecosystems with evapotranspiration (ET) remaining the major channel through which water disappears into the atmosphere [1]. Besides, anthropogenic reasons including rapid urbanization and climatic reasons such as extreme temperature anomaly, and low precipitation are all rendering the acceleration and intensification of the global hydrological cycle an undisputed fact [2,3]. On top of that, the atmospheric thermal vapor fluxes-induced processes impact the dominant water-heat budgets, especially in arid ecosystems [4,5]. The overall scenario is maintained by ET dynamisms, a significant constituent in hydrological regimes, playing a key substantial role in water budget and mass-energy nexus transfer [6,7]. In addition to food security and oasis cropland development, ET is once again a crucial parameter in current scientific investigations for studying both water-heat balance processes in terrestrial-atmospheric interactions [8]. Along with the 60% of global land precipitation that vanishes into the atmosphere due to evapotranspiration [9,10], scholars have further argued that several hydrological deficits are mostly due to asynchronous modifications in ET [11].
Notwithstanding the constraints posed by landscape inhomogeneity, irregular and sparse weather recordings in arid areas, the estimation of actual ETa for improving the agro-ecological environment, water needs, and demands are still yet of high priority. Here we demark the Yanqi basin within the large Bosten basin in arid Xinjiang, dominated by agroecosystems, and reputed to receive scant precipitation. Serious ecological havocs emanating from ecological farmland abandonment, anthropogenically induced oasis expansions, and unceasing warming have in return caused the modifications in surface radiance fluxes as a result of anomalous fluctuations in the surface reflectance [12,13]. Furthermore, with extremely low precipitation and high temperatures, the study suits the Yanqi desert agroecosystem where shifts in the surface temperature (Ts) contrariwise respond to the advective forces of surface fluxes that are coordinated by the region’s high evaporative fractions [14,15]. Nevertheless, underlining the air-surface thermal regimes in intensifying ET effects during summertime, not so much is documented about the irrigated-oasis effects on the surface energy budget and evaporative demand in our target area. Thus, in the basis of understanding water consumption, environment trades-off, and water allocation, it is sought imperative to account for Spatio-temporal land evaporative demand which is believed to have realistic and long-term implications for establishing sustainable water management strategies, ecosystem improvement, and agrometeorological purposes at large in drylands [16,17].
In this concern, ETa measurements have mostly been the scientific interest of various hydrologists [18,19]. Yet, due to heterogeneity and inadequate observations, representing straightforwardly global or regional coverage evapotranspiration is considered a challenging task. Thus further, as an alternative approach, satellite and geospatial modeling-based techniques hold great promises in accurately deriving the spatio-temporal ET distribution through a set of robust computational algorithms [20,21]. For instance, several kinds of Remote Sensing (RS) based Surface Energy Balance (SEB) models for ET estimation and advancements have been developed and widely used across the globe. This includes the Surface Energy Balance System (SEBS) [22], The Surface Energy Balance Index (SEBI) [23], the Mapping Evapotranspiration at High Resolution with Internalized Calibration (METRIC) [20], and the Surface Energy Balance Algorithm for Land (SEBAL) [24]. Hitherto, combined with a minimum in-situ meteorological data and high-resolution datasets such as (Landsat 30 m, 16 day revisit, ASTER 15 m, 16 day) datasets, with a sound base of physics, SEBAL has succeeded in filling gaps in the standard generated biases of the aforementioned models [24,25] through its efficient capabilities to overcome tedious practical constraints in ‘anchor’ pixel selection for model calibration [26,27], as well as due to its effective parameterization scheme in partitioning available land surface energies, from which evaporative fractions required for obtaining ET are derived [28,29]. Last but not least, SEBAL can further upscale the instantaneous evaporative fraction from daily up to annual ETa during the satellite overpass time. SEBAL schemes and formulations are extensively documented in [27,30].
In the study area emphasis, various researches have been conducted on the complex Yanqi oases-deserts ecosystems. Nonetheless, the majority focused on hydroclimatic changes and Bosten water quality [31], water carrying capacity [13,32,33], and oasis vegetation responses to the groundwater change using the SWAT-MODFLOW model [34,35]. Although Wang, Zhang [36] studied the evapotranspiration measurements from space-borne missions through Surface Energy Balance (SEB) model over the large Bosten Lake basin using coarse resolution datasets, and despite being the main active agro-ecosystems in the basin, there is still a lack of comprehensive ETa information on near-surface energy items and evaporative depletion over it. Accordingly, documenting this information and boosting our insight on the rapport among these near-surface energies fluxes via derived ETa subjects is imperative to better address the consumptive water demands issue and the betterment of water resources management in a semi-arid area.
So, bearing in mind the Yanqi heterogeneity and SEBAL uncertainties, previous studies showed that errors in the model parameterization can be reduced through wise manual or automated endmember pixel assortment based on expert judgment [37,38] while its mentioned accuracy is operative for mapping ETa distribution for at least one growing season [39,40]. Therefore, as contribution efforts, ETa was computed as a residue of SEB on a pixel-by-pixel basis using high-resolution Landsat datasets integrated with available in-situ meteorological data. As well, the study purpose seeks to explore the robustness of the SEBAL algorithm to better address the nexus between near-surface energy flux essentials over the Yanqi land-use types with high potential water supply systems. Then, SEBAL accuracy was performed referenced back to ETa parameters automated from ground-based observations. Mainly, from a time-space perspective, daily ETa behavior and feedbacks to canopy density for the summer period in between satellite overpasses were investigated. This study area is chosen since the Yanqi basin is one of the most agriculturally productive ecosystems in the Xinjiang province that is irrigated by water diverted from rivers and plays a key critical role in the socio-economic sector of Xinjiang, as rural to urban Xinjiang people depend on it for survival.

2. Materials and Methods

2.1. Study Area

The Yanqi basin is a mountainous endorheic basin within the large Bosten Lake basin (Figure 1), a fragile ecological temperate-arid environment in northwestern China (Lat 82.9° to 90.4° and Long 43.3° to 40.4°), situated in Xinjiang province on the Northeastern rim of the Tarim Basin, about 20 km (12 mi) East of Yanqi and 57 km (35 mi) Northeast of Korla. It is known to be the main agro-ecosystem active area of the province and lies in the Taklamakan Desert. The Yanqi basin receives an average of about 80 mm (3 inches) of precipitation per year, rendering it one of the driest places in the world. The large Bosten Lake basin is known to be the landscape of both the Kaidu and Kongque river basin system along the Bosten lake, a huge regulating reservoir playing a key critical role in the hydrological supply system, with an average annual temperature of 7.9 °C.
It serves as both the endpoint of Kaidu and the sources of the Kongque river with a lengthy snowfall period from Mid-November to March. Yet, with high water amount utilization due to surface water irrigation, the water resources in the basin exceed their limit. As surface water demand relief in 2000, high-efficiency water-saving irrigation was adopted, shifting from conventional irrigation. Further, the lake area shrank from 1.23 × 10⁵ ha to 0.91 × 10⁵ ha while a decrement in the Bosten lake level was observed from its high level of 1049.39 m in 2002 to 1045.06 in 2013, which is approximately its lowest control water level of 1045 m.

2.2. Data Mining

2.2.1. Landsat-8

To capture the landscape heterogeneity of ETa across the basin, the SEBAL algorithm requires satellite-based products and available in-situ climatic data (Table 1). So, with a revisit time of 16-days, clear sky Landsat-8 imageries (Sequential Day of Year, DOY 2019 June–August, summer season) were collected from United States Geological Survey (USGS) with pixel size bands of (30 m for visible, infrared, and two thermal bands). Formally, the Landsat 8 Data Continuity Mission, LDCM was launched on an Atlas-V rocket from Vandenberg Air Force Base, California on 11 February 2013. The satellite imagery datasets are available at (https://earthexplorer.usgs.gov/). The focus study area falls on the 143rd path, 31st row, and is provided in Greenwich Mean Time (GMT). Further, these were terrain-rectified, hence the radio-geometric accuracies and their exact local time (UTM +6) of the area of interest were put into consideration in the model adjustment. Still, our study area’s growing season evaluation was solely based on Landsat products (16-day revisit), which was impossible since the chance of acquiring all no cloud-free scenes was very low. However, in the SEBAL model adjustment, surface energy fluxes and ET cannot be computed for land surfaces covered by cloud since even a thin layer of cloud may considerably drop the thermal band readings and result in large errors in the computation of sensible heat flux [24]. Thus, using the thermal band, our study thoroughly checked for the presence of clouds and ensured they are masked out where detected. To detect these clouds, we viewed the thermal band relying on a range of colors to distinguish thermal values, therefore, clouds appear as uniquely colored areas across the image and are flagged. Landsat-8 visible (1–9) and thermal (10–11) bands were once again advantageous in computing SEBAL input essentials, namely Land surface Emissivity (LSE—ε), Normalized Difference Vegetation Index (NDVI), Leaf Area Index (LAI), Soil-Adjusted Vegetation Index (SAVI), Land Surface Albedo (LSA—α), Land Surface Temperature (LST—Ts), spectral radiance (Lλ; Wm−2 sr μm), and reflectivity (ρλ; Wm−2 sr μm) that are arithmetically explained in the methodology sections. Besides, the Digital Elevation Model (DEM) retrieved from (https://earthexplorer.usgs.gov/) was used to provide elevation information on a pixel basis. Finally, the consistent land cover datasets retrieved from the yearly global land cover map (300 m) released by the European Space Agency (ESA) through the Climate Change Initiative (CCI) (http://www.esa-landcover-cci.org/) along with the Moderate Resolution Imaging Spectroradiometer (MODIS) Land Cover Type (MCD12Q1) Version 6 data product (https://lpdaac.usgs.gov/) were employed as a reference to apply the maximum likelihood classification algorithm on the acquired Landsat 8 imageries, hence the land cover categories. Further details on input datasets are presented in Table 1.

2.2.2. Reference ET Measurements and Meteorological Observations

Since the Yanqi station was not calibrated to measure different surface energy fluxes such as Rn, G, and H, this study employed meteorological historical records domiciled at Yanqi station (Latitude 42.08°, Longitude 86.57°) required in SEBAL model operation. This included 2 m-wind speed data (m s−1), instantaneous reference ET (EToi, mm) from YQ synchronous with the time of the Landsat overpass, and daily value of reference evapotranspiration (ETo-mm) from the YQ station that applies the FAO-Penman–Monteith method (PM) to derive ET reference records. The PM approach and its formulation schemes were elaborated and extensively documented [41,42,43]. Furthermore, a single weather station indeed seems little for such a vast basin. Still, in addition to SEBAL model input requirements (weather station records within the agro-ecosystem), the study area only demarks one active and available meteorological station (Yanqi station as depicted in Figure 1). Nonetheless, the land use ETa and instantaneous NDVI ratio estimates were extracted from within 450 m2 of the validation station fetch area. Therefore, the basin area ET spatial distribution map was produced from the SEBAL modeled ETa. Recent studies also considered somewhat larger than this footprint for calibrating, mapping, and validating near-surface vapor fluxes [44,45]. Figure 2 presents the meteorological condition during the study time satellite overpass in the study area.

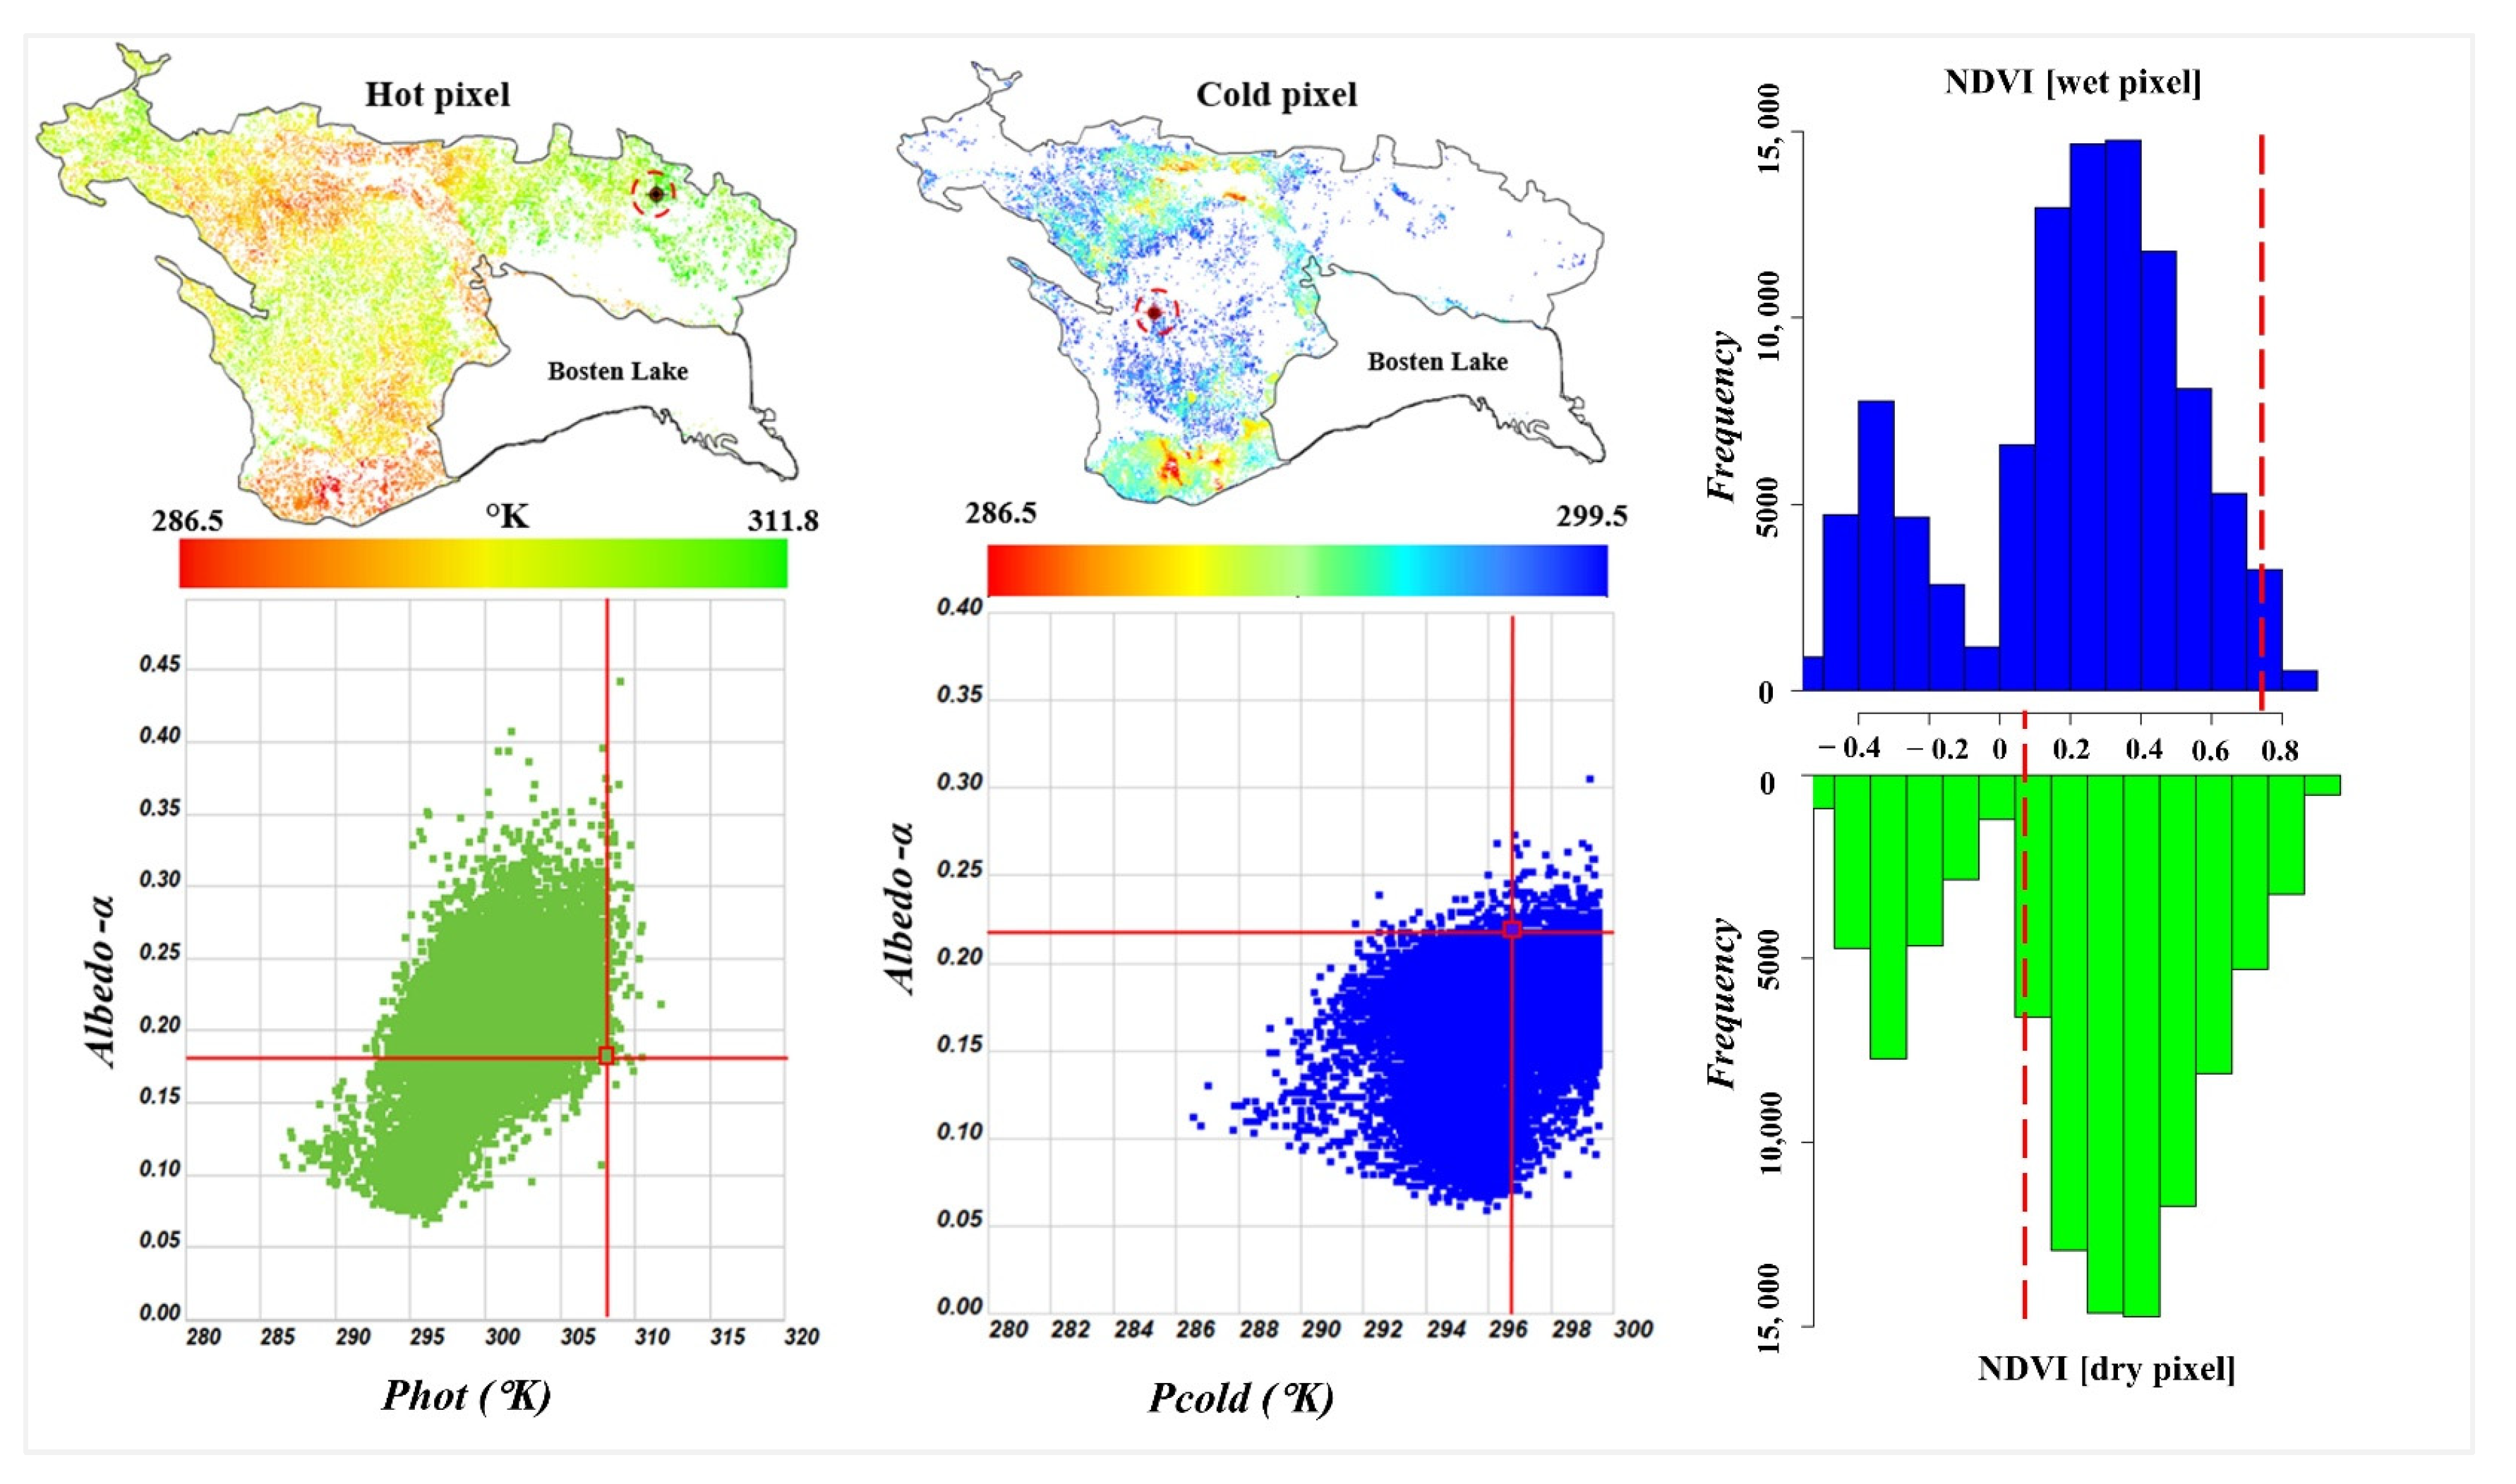
2.3. SEBAL Algorithm Adjustment and Actual ET Measurements

SEBAL robustness relies on the skillful evaluation and careful “anchor” pixels selection (cold, hot) within the defined area, hence the calculation of instantaneous net surface radiance fluxes resulting from the arithmetic surface radiance balance. This involves the surface emissivity-ε, surface albedo-α, incoming shortwave-Rs, outcoming-RL, and incoming-RL longwave radiation. Further to the pixel selection, the instantaneous net radiation (Rn-Wm−2), sensible heat fluxes (H-Wm−2), and soil heat fluxes (G-Wm−2) are computed to derive latent heat flux (LE = λET-Wm−2) as shown in Equation (1). These variables serve as inputs in land surface energy balance models computation, hence the accurate estimation of ETa from evaporative fraction [λET/(Rn-G)].
LE = λ ET = ( R n - G - H )
The coefficient of vaporization LE is noted as λ (J kg−2), with ET expressed in mm. As the first step in the SEBAL model operation, the R n calculation is demonstrated in the below formulations flow chart (Figure 3).
where DN: Digital Number, Esunλ (Wm−2 sr μm): The average solar exoatmospheric irradiance. θ: Solar angle of occurrence (90° -β). dr: Inverse relative earth-sun distance (1 + 0.033 cos (DOY 2 π 365 )). K1 and K2: Constant of Landsat bands (K1-band10 = 774.8853, K2 -band10 = 1321.0789, K1-band11 = 480.8883, K2-band 11 = 1201.1442) and τsw as atmospheric pathway transmissivity. Then NB as narrow bands. Gsc: Solar constant (1367 W/m2), ρ (4,5) as reflectivities for bands 5 and 4, L the constant for SAVI (0.5) as soil brightness correction factor. σ: Stefan-Boltzmann constant (5.67 × 10⁻⁸ Wm−2 k−4) with meteorological air temperature Ta. ω λ represents the weighting coefficient for each computed band and α path variance as the average portion of the incoming solar radiation throughout bands back-scattered to the airborne machine before it reaches the earth’s surface. Further, thermal bands were used with high gain from which Ts was derived, thereby the ratio of radiation fluxes was converted to land surface reflectance. Secondly, in arid-land with sparse vegetation, SEBAL significantly considers the soil evaporation in overall ETa computation [46]. As such, through Equation (2), the algorithm counts for water-heat exchange derived from soil heat fluxes (G) as the residue of R n , such that the estimated fragment is proportionally inverse to the albedo-α, T s (°C) and variance between red and near infrared bands for Landsat 8 (NDVI).
G R n = T S ( 0.0038 + 0.007 2 ) ( 1 0.98 N D V I 4 ) .
Thirdly, with temperature variation, SEBAL derived-ET considers the rate of heat loss proportional to the air by convection and conduction through Equation (3).
H = ( ρ × C ρ × Δ T ) / r a h ,
where ρ is the air density (Kg/m3), C ρ specific air heat (1004 j/kg/K), Δ T (K) is the temperature difference between two heights (Z) and, r a h as the aerodynamic resistance to heat transport (s/m). The crucial part in sensible heat flux (H) computation is the fixation of boundary conditions for the energy balance. In this, difficulties lie with two initial unknown variables Δ T and r a h . So, to ease the calculation, this study carefully selected hot-cold pixels through a wise guided manual in depth-analysis of radiometric surface temperature following the characteristics of p h o t ,   p c o l d , LAI, and albedo where reliable H values can be predicted (Figure 4) [27]. Particularly, represented by Ts, cold-pixel as “wet”, was selected in a well-irrigated area near the YQ with (not extreme pcold 296.8 °K value and 0.22 ≤ as ≤ 0.24 with a high NDVI) while hot-pixel is selected as “dry”, in a bare-agricultural field where evapotranspiration is assumed to be null (0 ≤ LAI ≤ 0.4, no extreme phot value 308.1 °K with a low NDVI). Thereby, ( Δ T = α T s + β ) where α and β are linear coefficient regression calculated as
α = r a h _ h o t ρ h o t × C p × R n _ h o t G h o t T S h o t / N D V I T S h o t / N D V I
β = r a h h o t ρ h o t × C p × ( R n h o t G h o t ) × T s T S h o t / N D V I T S c o l d / N D V I ,
where r a h _ h o t , ρ h o t   R n h o t ,   and   G h o t are heat transfer ascending from aerodynamic resistance and air density at a pixel with the driest surface, net-radiation, and G fluxes for the driest pixel, respectively.
Further T S h o t / N D V I   and   T S c o l d / N D V I indicate pixels with wettest and driest T s , within the extracted Landsat-8 imageries. To derive (H), the buoyancy effects emanating from surface heating in dry conditions are considered. So, after estimating Δ T for each pixel, the Monnin-Obukhov similarity formulation scheme [47] was applied in an iterative process driven by (α-β), since atmospheric conditions stability has great influences on the aerodynamic resistance. Thus, H is computed as
H = ρ × C ρ × Δ T r a h = ρ × C ρ × ( α T s + β ) r a h ,
where:
r a h = 1 k u [ ln ( Z 2 Z 1 ) ψ h ( Z 2 ) + ψ h ( Z 1 ) ]
u = k u 200 l n ( 200 z o m ) ψ m Z 200 ,
where K (0.41) and u ( m   s 1 ) is Von Karman’s constant and the frictional velocity; ψ m , ψ h representing the stability correction and improvements factors of momentum and sensible heat transport, respectively [48]. The momentum roughness length of each pixel was represented by ( z o m ) calculated as a function of LAI ( z o m = 0.018 × LAI ). Lately, the final corrected value of (H) at each pixel from which instantaneous ETinst (mm/hr) and ET fraction (ETrF) is derived, assuming that the constant throughout the daytime was derived and then transformed (W m−2 to mm d−1) following Equations (9) and (10).
Daily   ET = ET 24 = 1 λ v ( 86400 × E F i n s × R n 24 ) ,
where λ is the latent heat absorbed once a kilogram of water evaporates (J/kg) and 86, 400 is the conversion of seconds in a day and E F i n s as a daily instantaneous evaporative fraction of i period. Nevertheless, negative values in the SEBAL can occur due to systematic errors evoked by several assumptions made in the energy balance process. Since the Rn24 is the first main component in estimating the magnitude of ET, then season ET was computed from the cumulative summation of ET24 for each period (ETa grids of the Summer growing season, June–August 2019).
E T 24 _ p e r i o d = i = p   q [ ( E T r _ p e r i o d ) × ( E F i n s ) ] ,
where E T r p e r i o d and E F i n s are reference ET for overall ETr and the daily instantaneous evaporative fraction-period i (p to q) from the observation of study time-scope, respectively [28]. Landsat-8 data processing, Land cover classification along the improved SEBAL algorithm operation including anchor pixel identification in simulating instantaneous near-surface energy fluxes essentials over YQ basin were implemented in GRASS-GIS 7.6-based python 2.7. Other statistical analyses and data visualization were performed in RStudio software. Figure S2 in the supporting material presents the graphical flow chart of the study (SEBAL model execution).

3. Results and Discussion

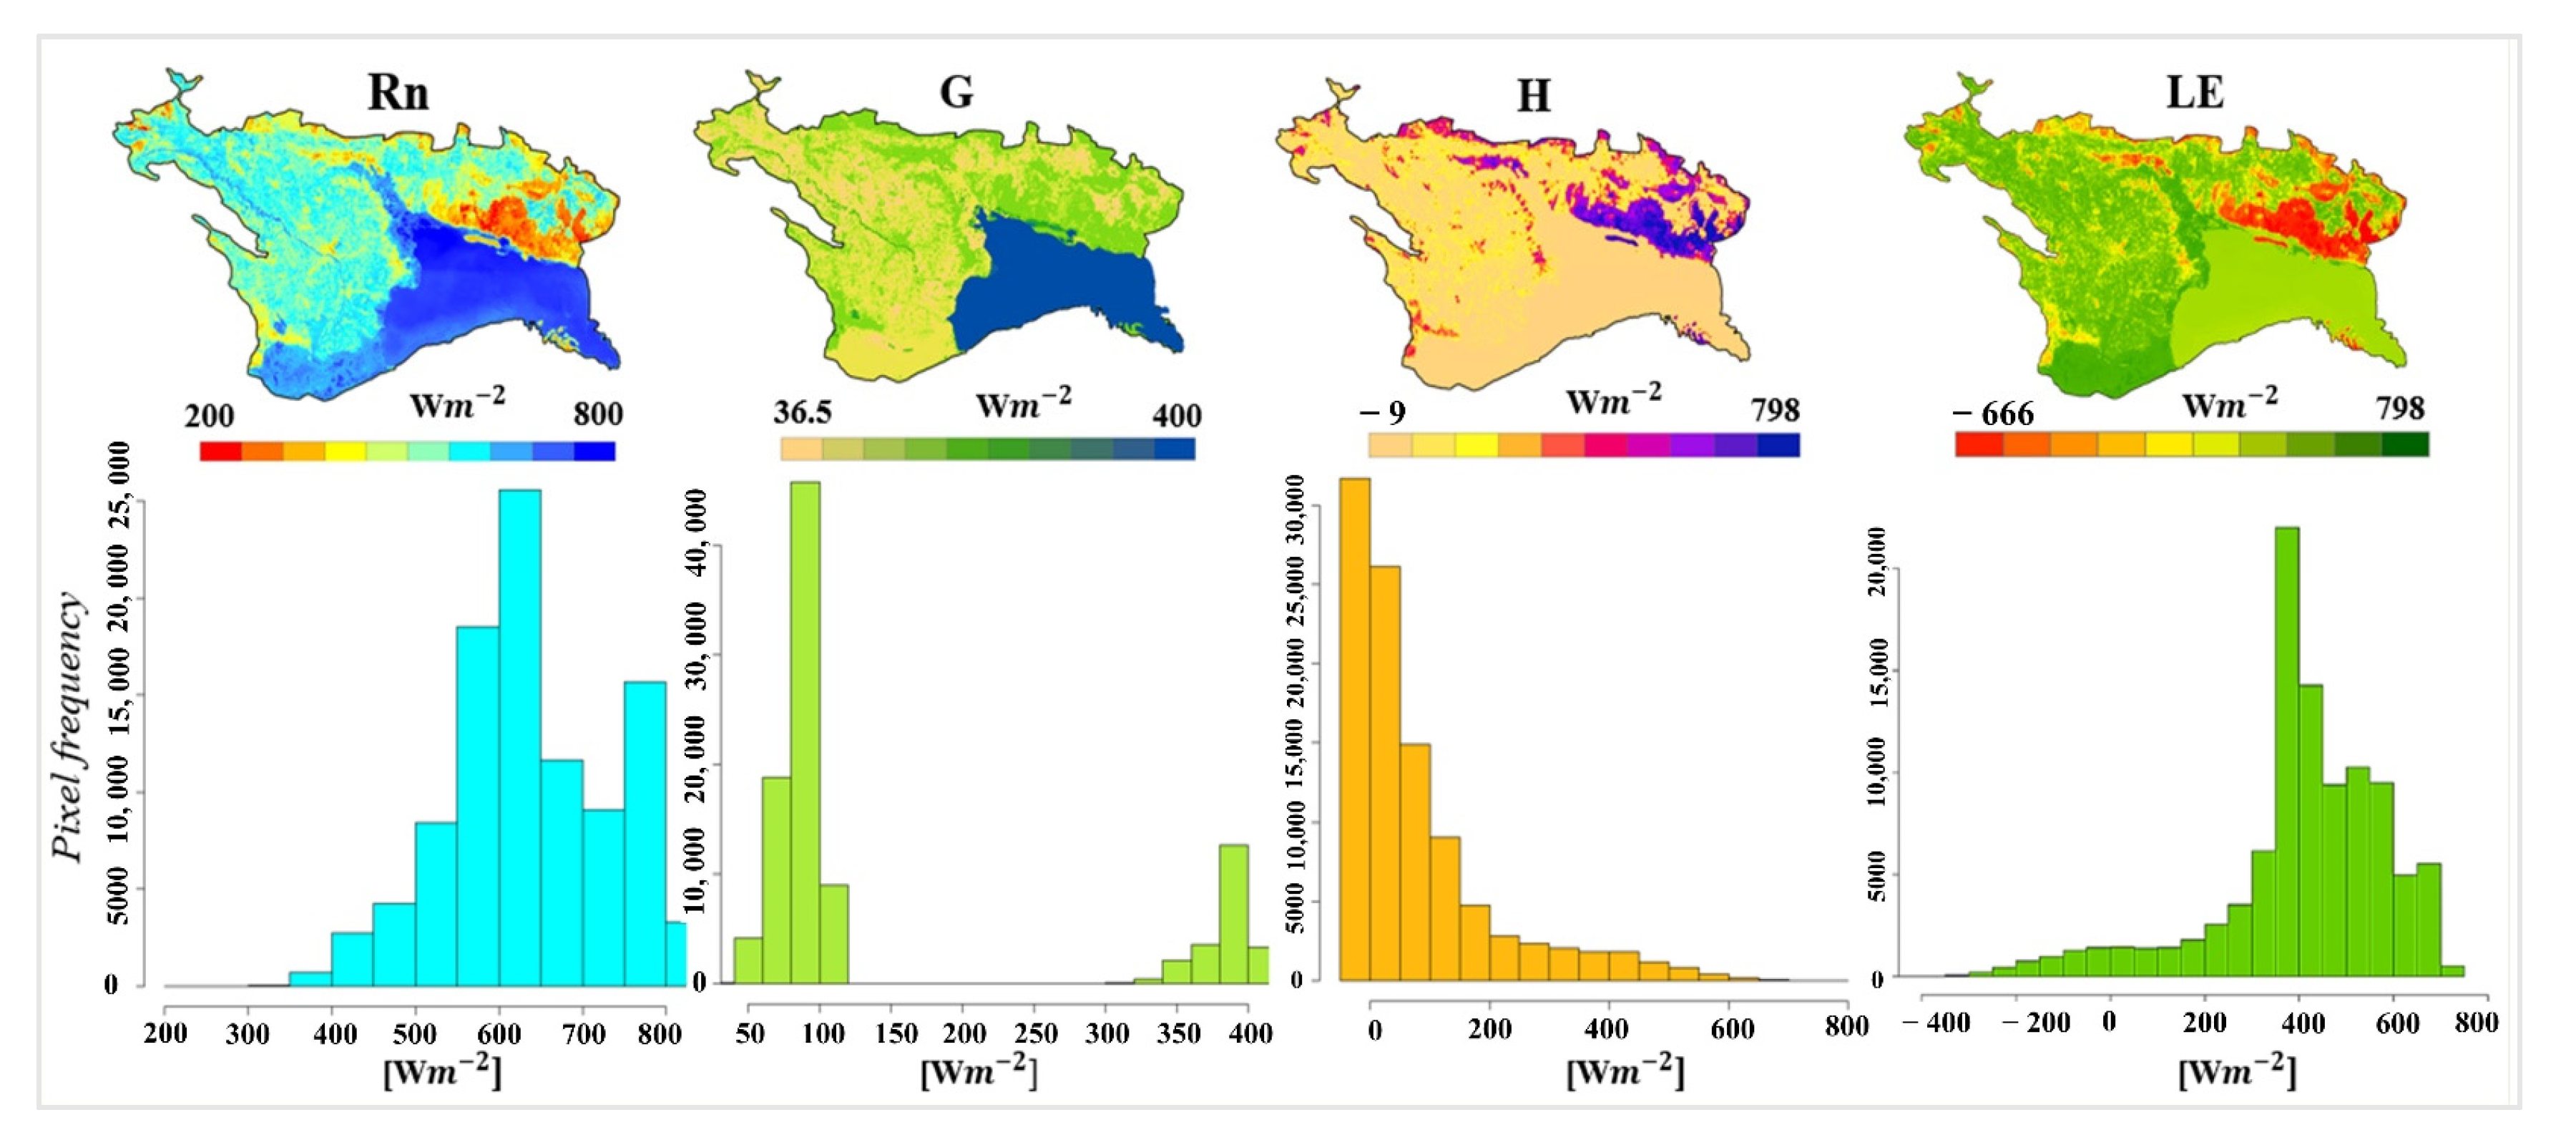
3.1. Near-Surface Energies Fluxes Partition across Yanqi Canopy Density

The experimental area presented extreme energy variability characterized by the diversity of land surface areas, namely water bodies, oasis cropland, temperate grassland, permanent wetlands, residential areas, and concrete desert surface. Figure 5 displays the partition of the surface energy balance apparatuses derived from Landsat 8 imageries during the period of the experiment and Table 2 presents statistics of their mean distribution across every single land-use type. Thus, with the incoming shortwave radiation reaching the Yanqi land surface, the derived energies showed a wide range as a result of the strong divergence of surface albedo-α characteristics displayed in the supporting material (Figure S1). In particular, due to the semi-aridity nature of the site, the energy flux Rn was observed to range from 200 Wm 2 (desert) up to 800 Wm 2 (water–wetlands–grasslands) from which the residue energy available for ET was derived. Such a phenomenon is known to be common in most temperate arid land, as some scholars have also reported Rn of over 500 Wm 2 in semi-arid land [49,50].
Remote sensing-based surface energy balance-LET estimation strongly relied on available energy (Rn-G) and an evaporative fraction (LET/Rn-G). Therefore, as argued by Allen, Burnett [51], the precise LET relied profoundly on the measurements of Rn, which may be influenced by cloud cover, air thermal regimes, daytime isolation, and perhaps land emissivity (NDVI). Although, no further significant difference was detected among LET fluxes over Yanqi land-use types since this ranged between 294 and 299 Wm 2 on DOY-161, compared to other DOY that exhibited quite a difference in LET. The highest LET was observed on DOY193 across wetlands (Table 2), while both Rn and G fluxes were higher in water bodies than other land surfaces due to low albedo, then H with a high ratio of radiosity to the irradiance was higher in the concrete desert surface than others (Figure 5). In addition to H, the smallest item of the surface energy flux abbreviated as G is the portion stored as heat storage into the soil and vegetation due to conduction [39,52]. Here, G and H ranged from 36.5 Wm 2 to 400 Wm 2 and −9 Wm 2 to 798 Wm 2 respectively, with H negative values concentrated from open water bodies to both wetlands and grasslands (Figure 5). Serval studies unveiled that site heat advection is answerable for the increased soil evaporation and plant transpiration [53,54,55]. The advection in question takes place once the sensible heat flux is negatively assigned at or near the ground level [56]. Due to canopy air temperature differences, the horizontal advection transfers heat from higher to low temperatures [57]. Likewise, our findings unveiled such air thermal regimes gradient between oasis cropland, grasslands, and wetlands. The negative assigned values of sensible heat observed at the wetlands, grasslands, and water bodies pointed out the temperature inversion as a result of the advection of warm air from surrounding areas, which tends to occur on clear days. Most remarkably, Rn values were captured temporally falling at all land cover surfaces, explaining the amplification of high ratio of radiosity to the irradiance at the land surface, inferring to vegetation greenness reduction, followed by the fall of autumn (Table 2 and Figure S1). Such a scenario is also associated with the high average loss of LET noticed on DOY-241 (Table 3). Marking the weather settings of Yanqi and harvesting practices in late August to October, the temperature falls and the loss in the evergreen vegetation of the basin are strongly responsible for the reduction of latent heat flux. Bear in mind that with the gradual depletion of moisture content below the critical threshold, vegetated surfaces undergo drought suppression, substantially reducing the LET. To put into perspective, Almeida, Soares [58], and Vincke and Thiry [59] observed that the depletion in plant transpiration takes place with a decrement in soil water content, partly when the relative extractable water drops below the critical threshold of 0.4 (a threshold that induces stomatal closure in most trees and suffers from stress). Last but not the least, Aguilos, Sun [60] also assessed the effects of land-use change and drought on decadal evapotranspiration and water balance of natural and managed forested wetlands in southeastern united states lower coastal plain and detected a prolonged soil moisture deficit once the relative extractable water falls below the critical threshold (0.4), implying that plants or trees might be under constant water stress. Globally, the same situation is detailed by [61,62], who argued that deforestation perturbs the surface energy balance, and loss in an evergreen broadleaf forest resulting in a strong reduction in latent heat flux. In our study, the mean latent heat of ET derived in the withdrawal of the ground conductive and sensible heat fluxes from the net radiation reached the value of 405.5 Wm 2 on DOY 161, but portrayed to continuously deplete till DOY-241 with an average energy of 301.98 Wm 2 (Table 3), a depletion rate of 25.52%.
Since Rn determines the availability of energy for other energy flux items and is the primary driver of ET [63], Figure 6 indicates the quantity of the available energy (Rn-G) partitioned across different Yanqi land surfaces. As established earlier, the computed available energy from the applied SEBAL algorithm and its distribution differ appreciably over Yanqi land-use types. It is unveiled that the highest average amount of available energy on DOY’s to be mostly partitioned in temperate grasslands reaches an average amount of 561.6 Wm 2 on DOY 161 to 447.4 Wm 2 on DOY241 (Table 4), which are spatially situated on the south edge of the study area. These patches were closely followed by wetlands ranging between 538 Wm 2 and 460.5 Wm 2 , while the lowest amount of energy is distributed across concrete desert surfaces and were observed to vary between 416 Wm 2 on DOY-161 and 299.2 Wm 2 on DOY-209.
Besides, the oasis cropland varied between 485 Wm 2 on DOY161 to 394.5 Wm 2 on DOY-245, with water bodies ranging from 430 Wm 2 on DOY-161 to 443.8 Wm 2 .
Remarkably, due to high incoming solar radiation, the peak of the captured available energy was detected on the 161st DOY compared to other days of the understudied period and the nadir detected on the 241st DOY (Table 4), coinciding with the high average energy amount of latent heat recorded on DOY-161 but lessened on the 241st DOY (Table 3). Noting that, temporal Rn-G unceasingly decreased in parallel with both vegetated (oasis cropland, temperate grassland, and wetlands) and non-vegetated canopy cover (water, residentials, and concrete surface). Consistent with our findings, the LET was observed to negatively fluctuate, and the depletion of available energy fell together with the autumn-winter solstice [64]. On top of that, the magnitude variation of the biomass as elucidated by the vegetation index was related to available energy. Therefore, a substantial positive linear correlation was found between NDVI and Rn-G (DOY 161, R 2 = 0.6 ; DOY 193, R 2 = 0.7 , DOY 209, R 2 = 0.5 , DOY 225, R 2 = 0.6 , DOY 241, R 2 = 0.5 ) (Figure 7). The nature of findings divulged the available energy (Rn-G), moisture content [65], and vegetation cover to be responsible for how Yanqi land-use types convert solar energy in diverse ways. Although sometimes high NDVI values can be detected in fall Autumn (April–May), our study hypothesized that the NDVI is high in the summer season due to intensification of irrigation activities across the basin, thus the uppermost NDVI values from June to July, combined with the computed available energy were allied with the chronological shifts from latent heat to sensible heat flux as the main consumer of the available energy and how the energy is dissipated. Likewise, Ochege, Luo [4] detected high NDVI values in summer (June to July) due to irrigation activities that are intensified in such a semi-arid basin. While the arid land appeared completely dry with low moisture content, vegetated surfaces and well-watered canopies contribute the most to high ETa estimates [66].
Generally, the water cycle is unceasingly supervised by the sun’s irradiation, which in return plays a substantial role in the dissipation of available solar energy and the cycling of matter [67] and several physical aspects such as LAI, Rn-G, moisture ability, and vegetation greenness bearing a robust influence on energy dissipation [68]. Also, the allocation of energy flux into latent and sensible heat is vital in vegetated ecosystems. Thus, a large amount of water is transpired by vegetated surfaces into the atmosphere, hence the higher latent heat is customized from such surfaces [69]. In our experiment, the magnitude of net radiation as the most powerful surface energy item occupied the highest average, reaching a proportion of about 70% followed by 20% of sensible heat patches, and lastly about 10% of soil heat flux (Figure 8a). Here, to better comprehend the energy dissipation amongst energy fluxes based on vegetation cover and soil moisture, Figure 8b visualizes the spatial relative magnitude exiting between the latent heat flux and the net radiation in quantifying the rate at which the loss of energy by conversion into latent heat of evapotranspiration across the Yanqi land-use types occurred. The magnitude of radiation energy split up to latent heat was higher in vegetated sites than those with less canopy cover density. Highlighting the critical role played by wetlands and temperate grasslands in the energy budgets of their respective landscapes due to their aptitude to switch energy fluxes in favor of latent heat, Pokorný, Květ [70] and Huryna, Brom [71] reported high dissipation of latent heat flux to be associated with wet meadow in the agricultural landscape as a result of high available moisture content and low resistance to evaporation. Our findings similarly document a striking variation in the temporal dissipation of energy where all vegetated sites, partly grasslands and wetlands, were depicted to dissipate more latent heat of ET than remaining classes (Figure 8b). The vegetated sites with a high evaporative fraction (EF) (Figure 8c) were recorded with the highest LE/Rn ranging between 0.7 to 0.9, and water bodies LE/Rn varying from 0.2 up to 0.6, while desert concrete surface and residential areas dissipate the least LE/Rn (−0.9 to −1.02) with low EF, due to the absence of vegetation cover and small water holding capacity [72]. Particularly, vegetation cover contributed to the modification of energy fluxes by greatly intensifying the ET (LE) from vegetation to soil patches. Largely, this phenomenon is reported by Kayumba, Chen [73], and Yamazaki, Yabuki [74] who discussed that the high ratio of LE/Rn depicted in temperate grasslands and wetlands can further be elucidated by the high moisture availability and low surface confrontation to evaporation. The vegetation dynamics produced a divergence in the net radiation, most likely due to the high reflectance of leaves present in temperate grassland and wetlands. Generally, as displayed by Figure S1 in the supporting material, surfaces with high albedo (concrete desert surface) dissipated low energy while those with low albedo (T. grasslands-wetlands) dissipated a large amount of energy. Consistent with recent studies [75,76], vegetated wetland surfaces with an ample water supply were detected to have a high evaporative fraction compared to other vegetation covers, and Sun, Wei [77] also estimated the evapotranspiration in the Nansi Lake wetland of China and realized the evaporation to be greatly pronounced across swamps than other vegetated surfaces. Likewise, Liljedahl, Hinzman [78] assessed the nonlinear curbs on ET in artic coastal wetlands by closing that there is a resistance in the hydrological system that controls soil drying in coastal Arctic wetlands. They finally proposed that the wetness of the wetlands may persist, notwithstanding the warming climate. Therefore, in our study area, the divergence among EF and dissipated energy could be described by a higher groundwater level at the Yanqi site, acknowledging the dominant flood irrigation approach across the Yanqi basin with water mainly diverted from rivers. Due to flood irrigation and an inefficient drainage system, the groundwater table has been raised in recent years [79].

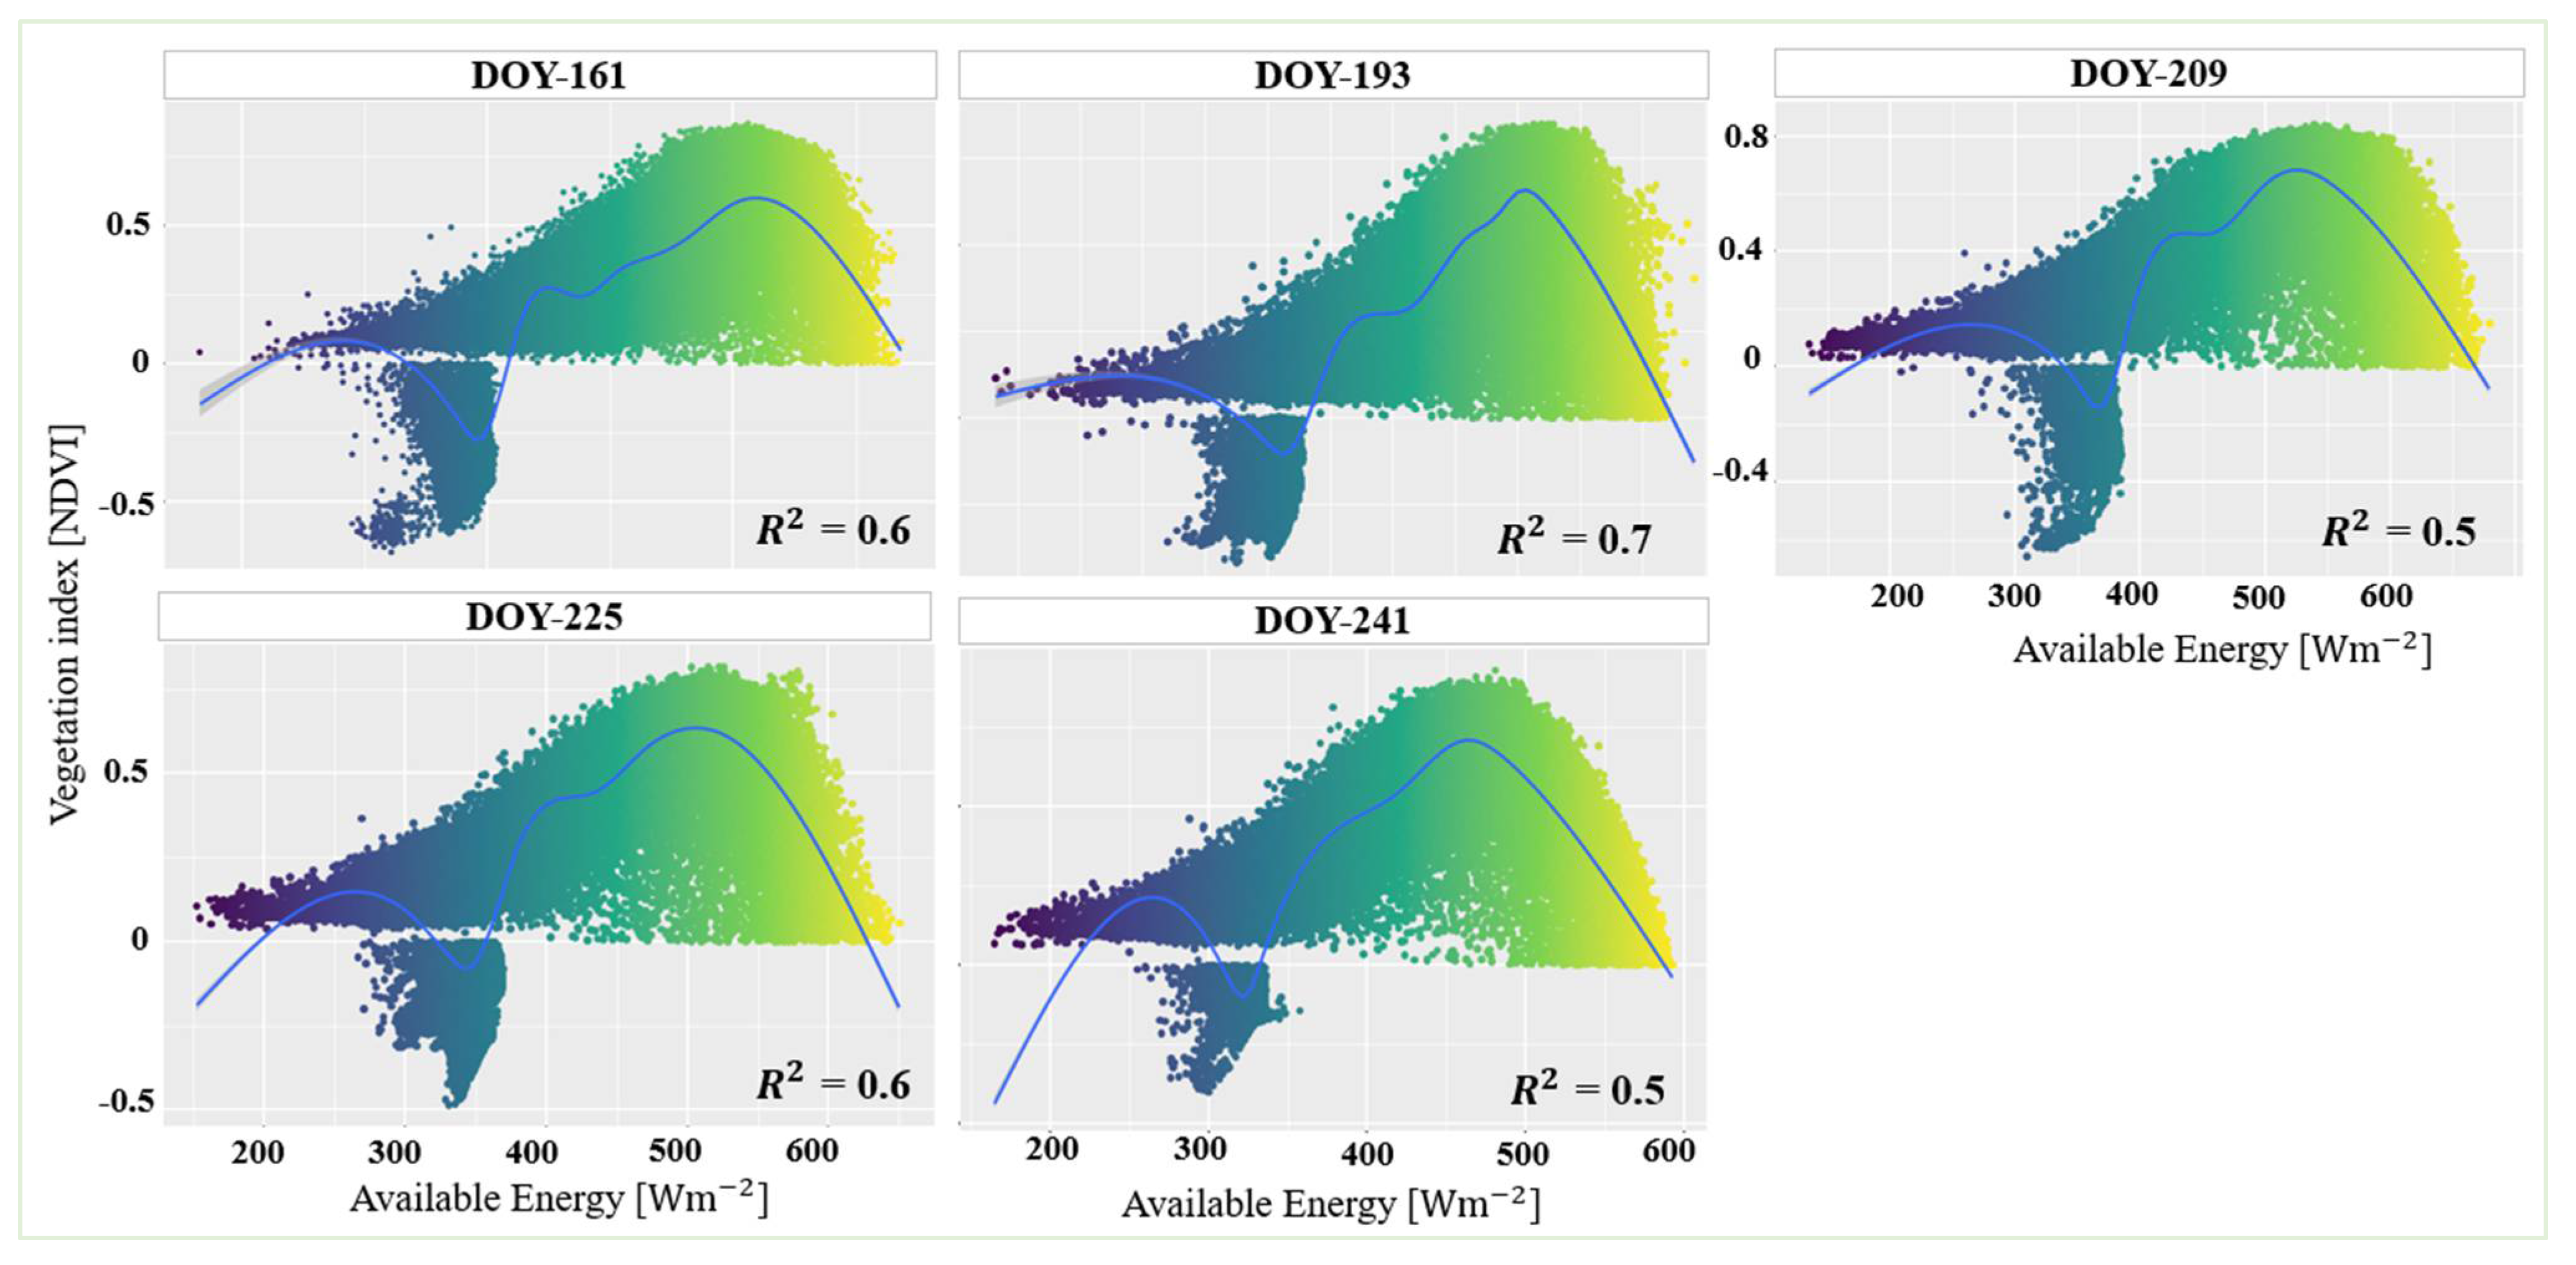
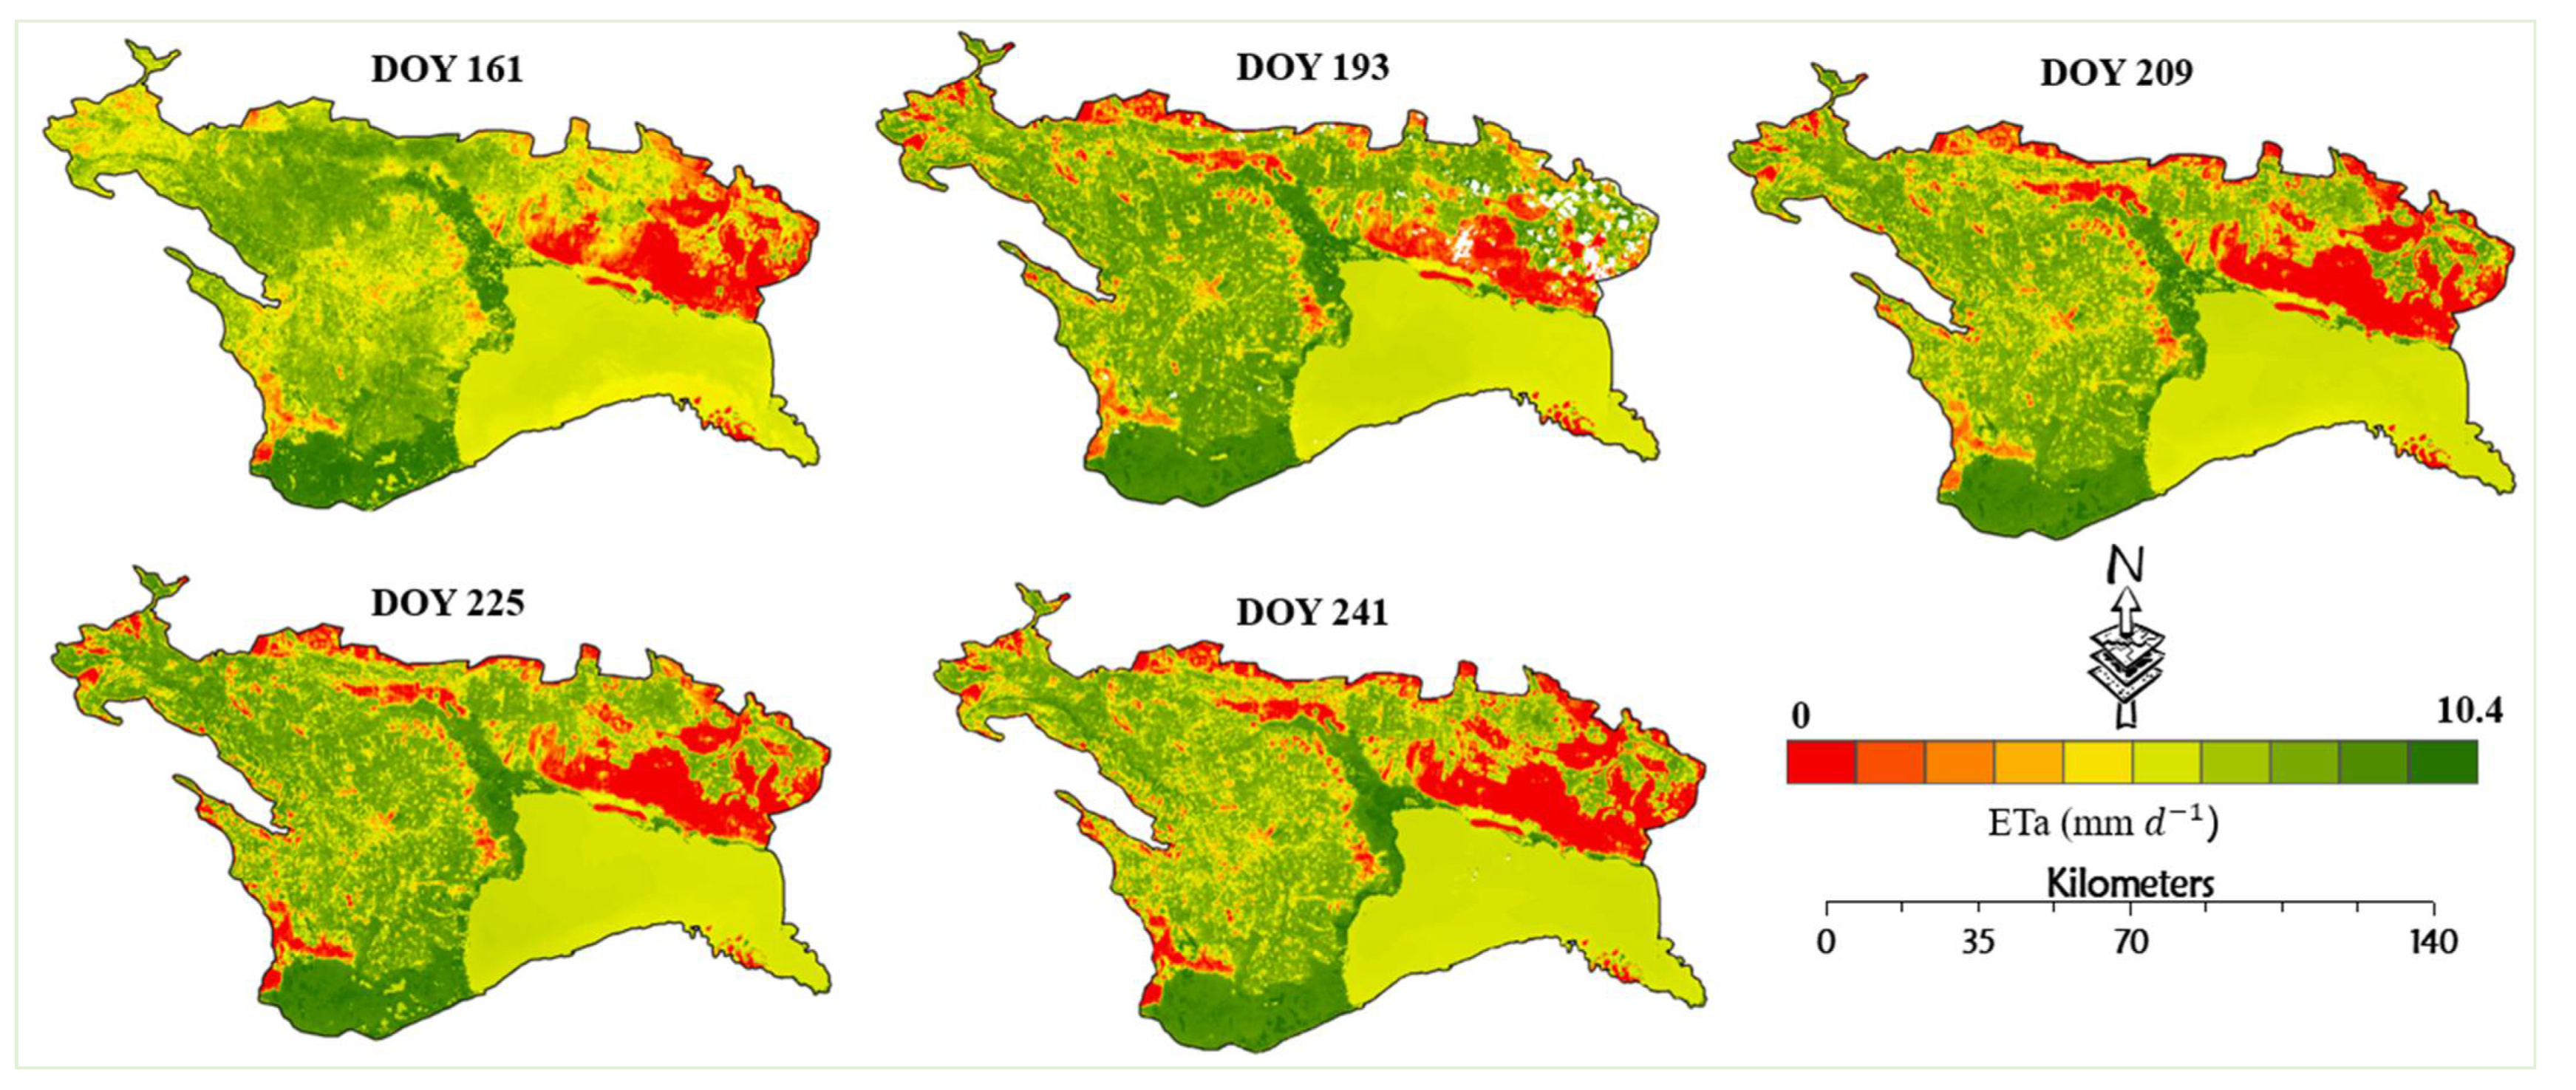
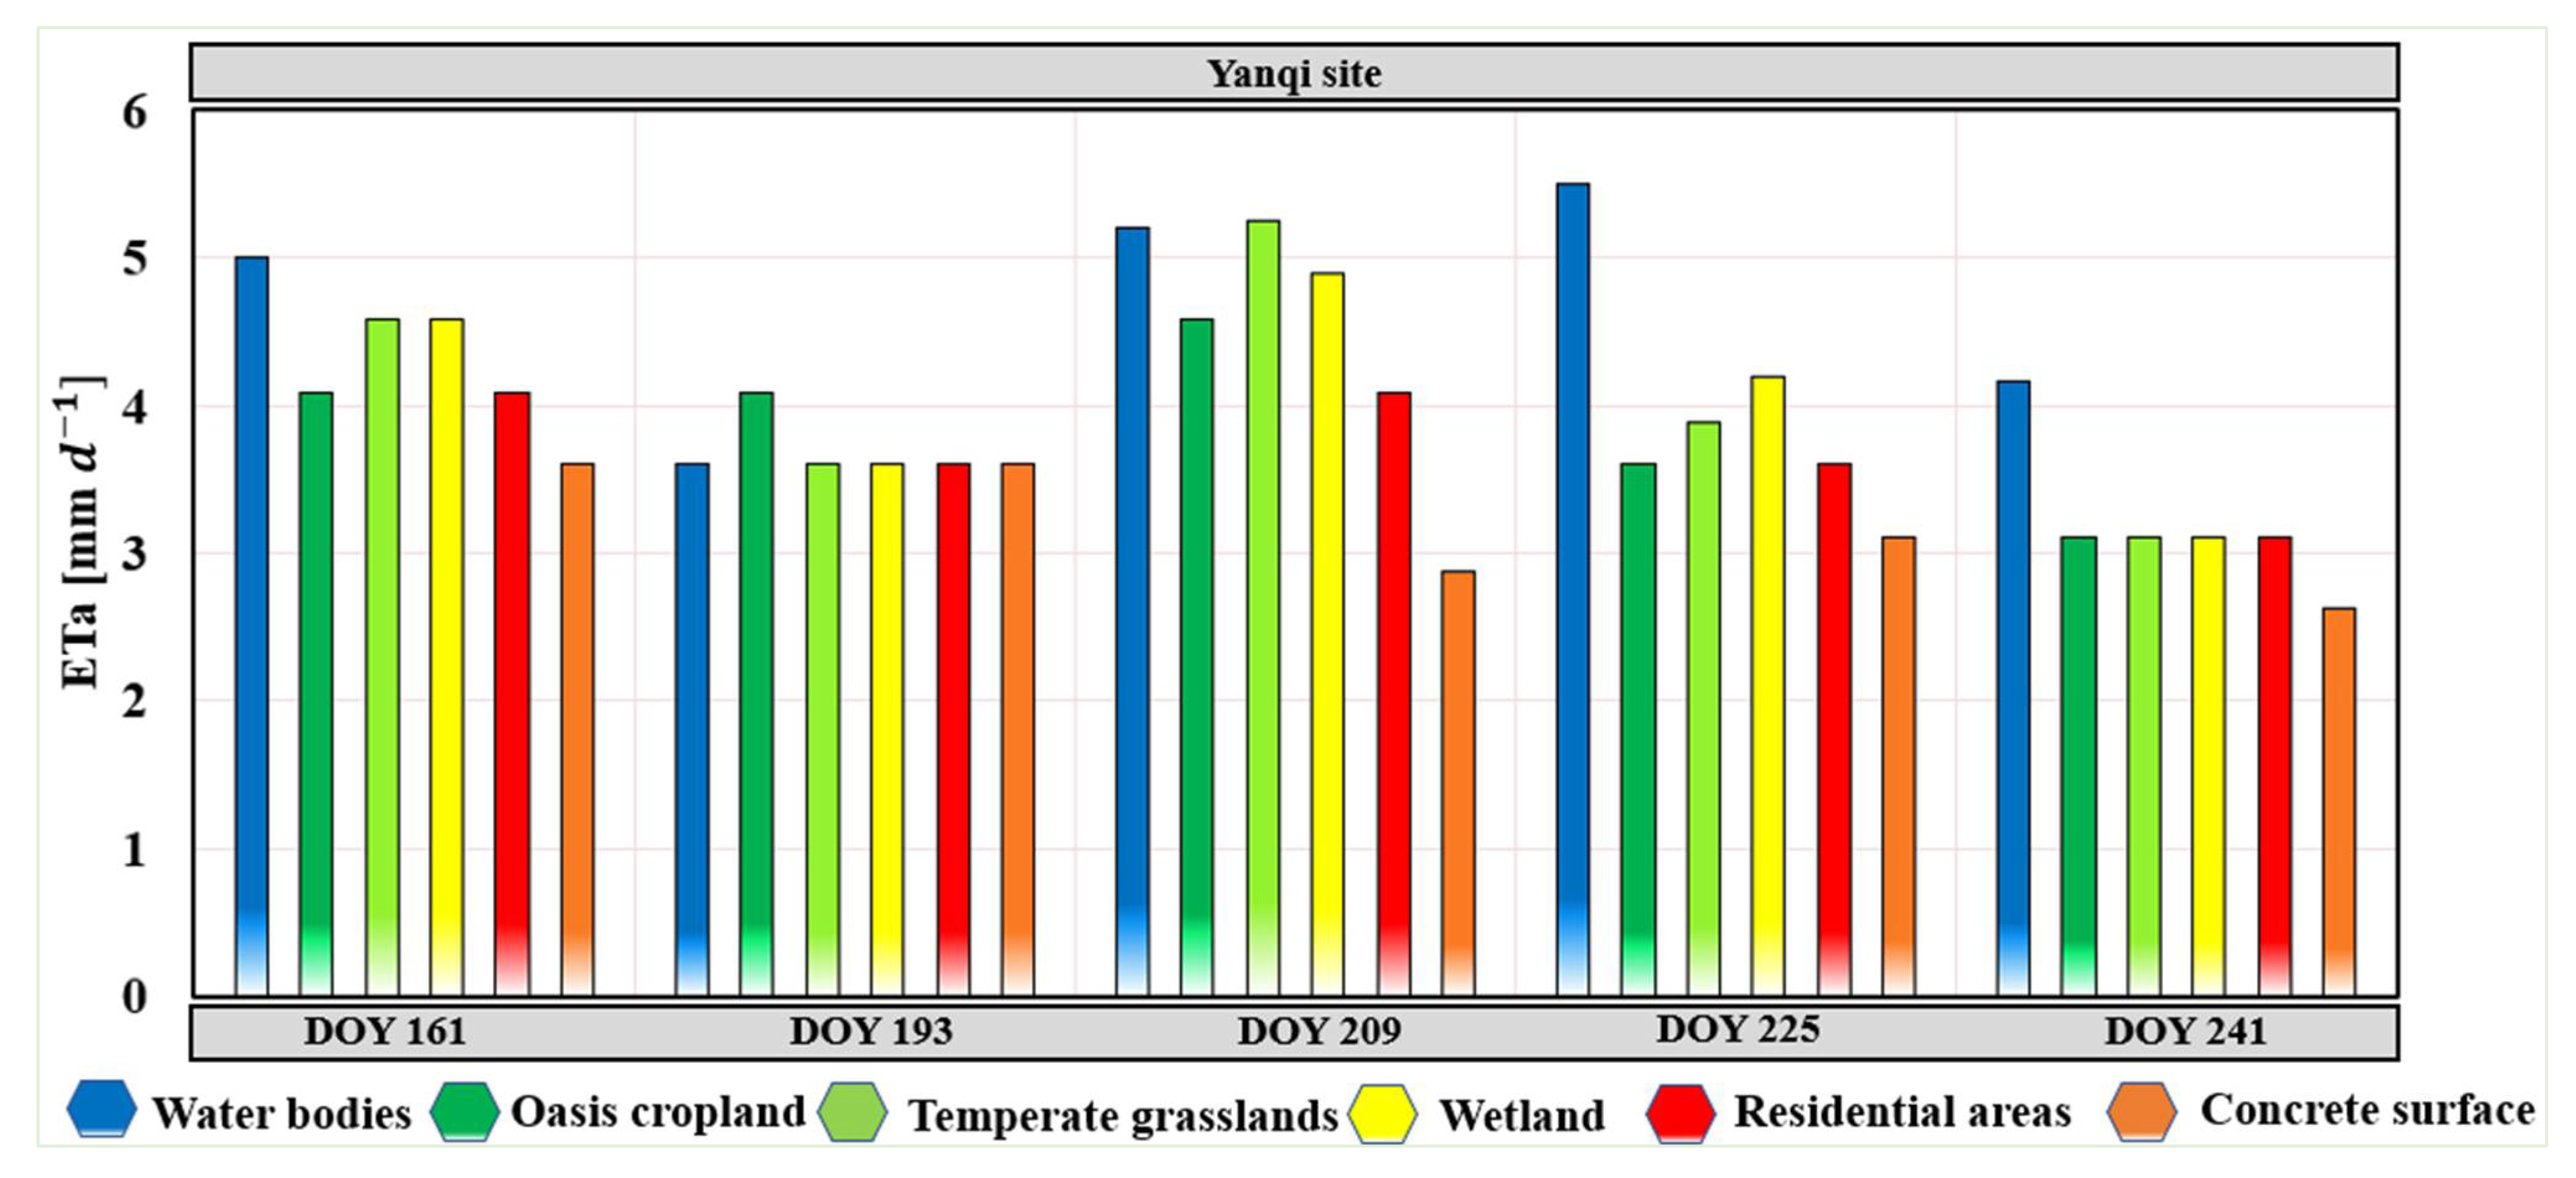
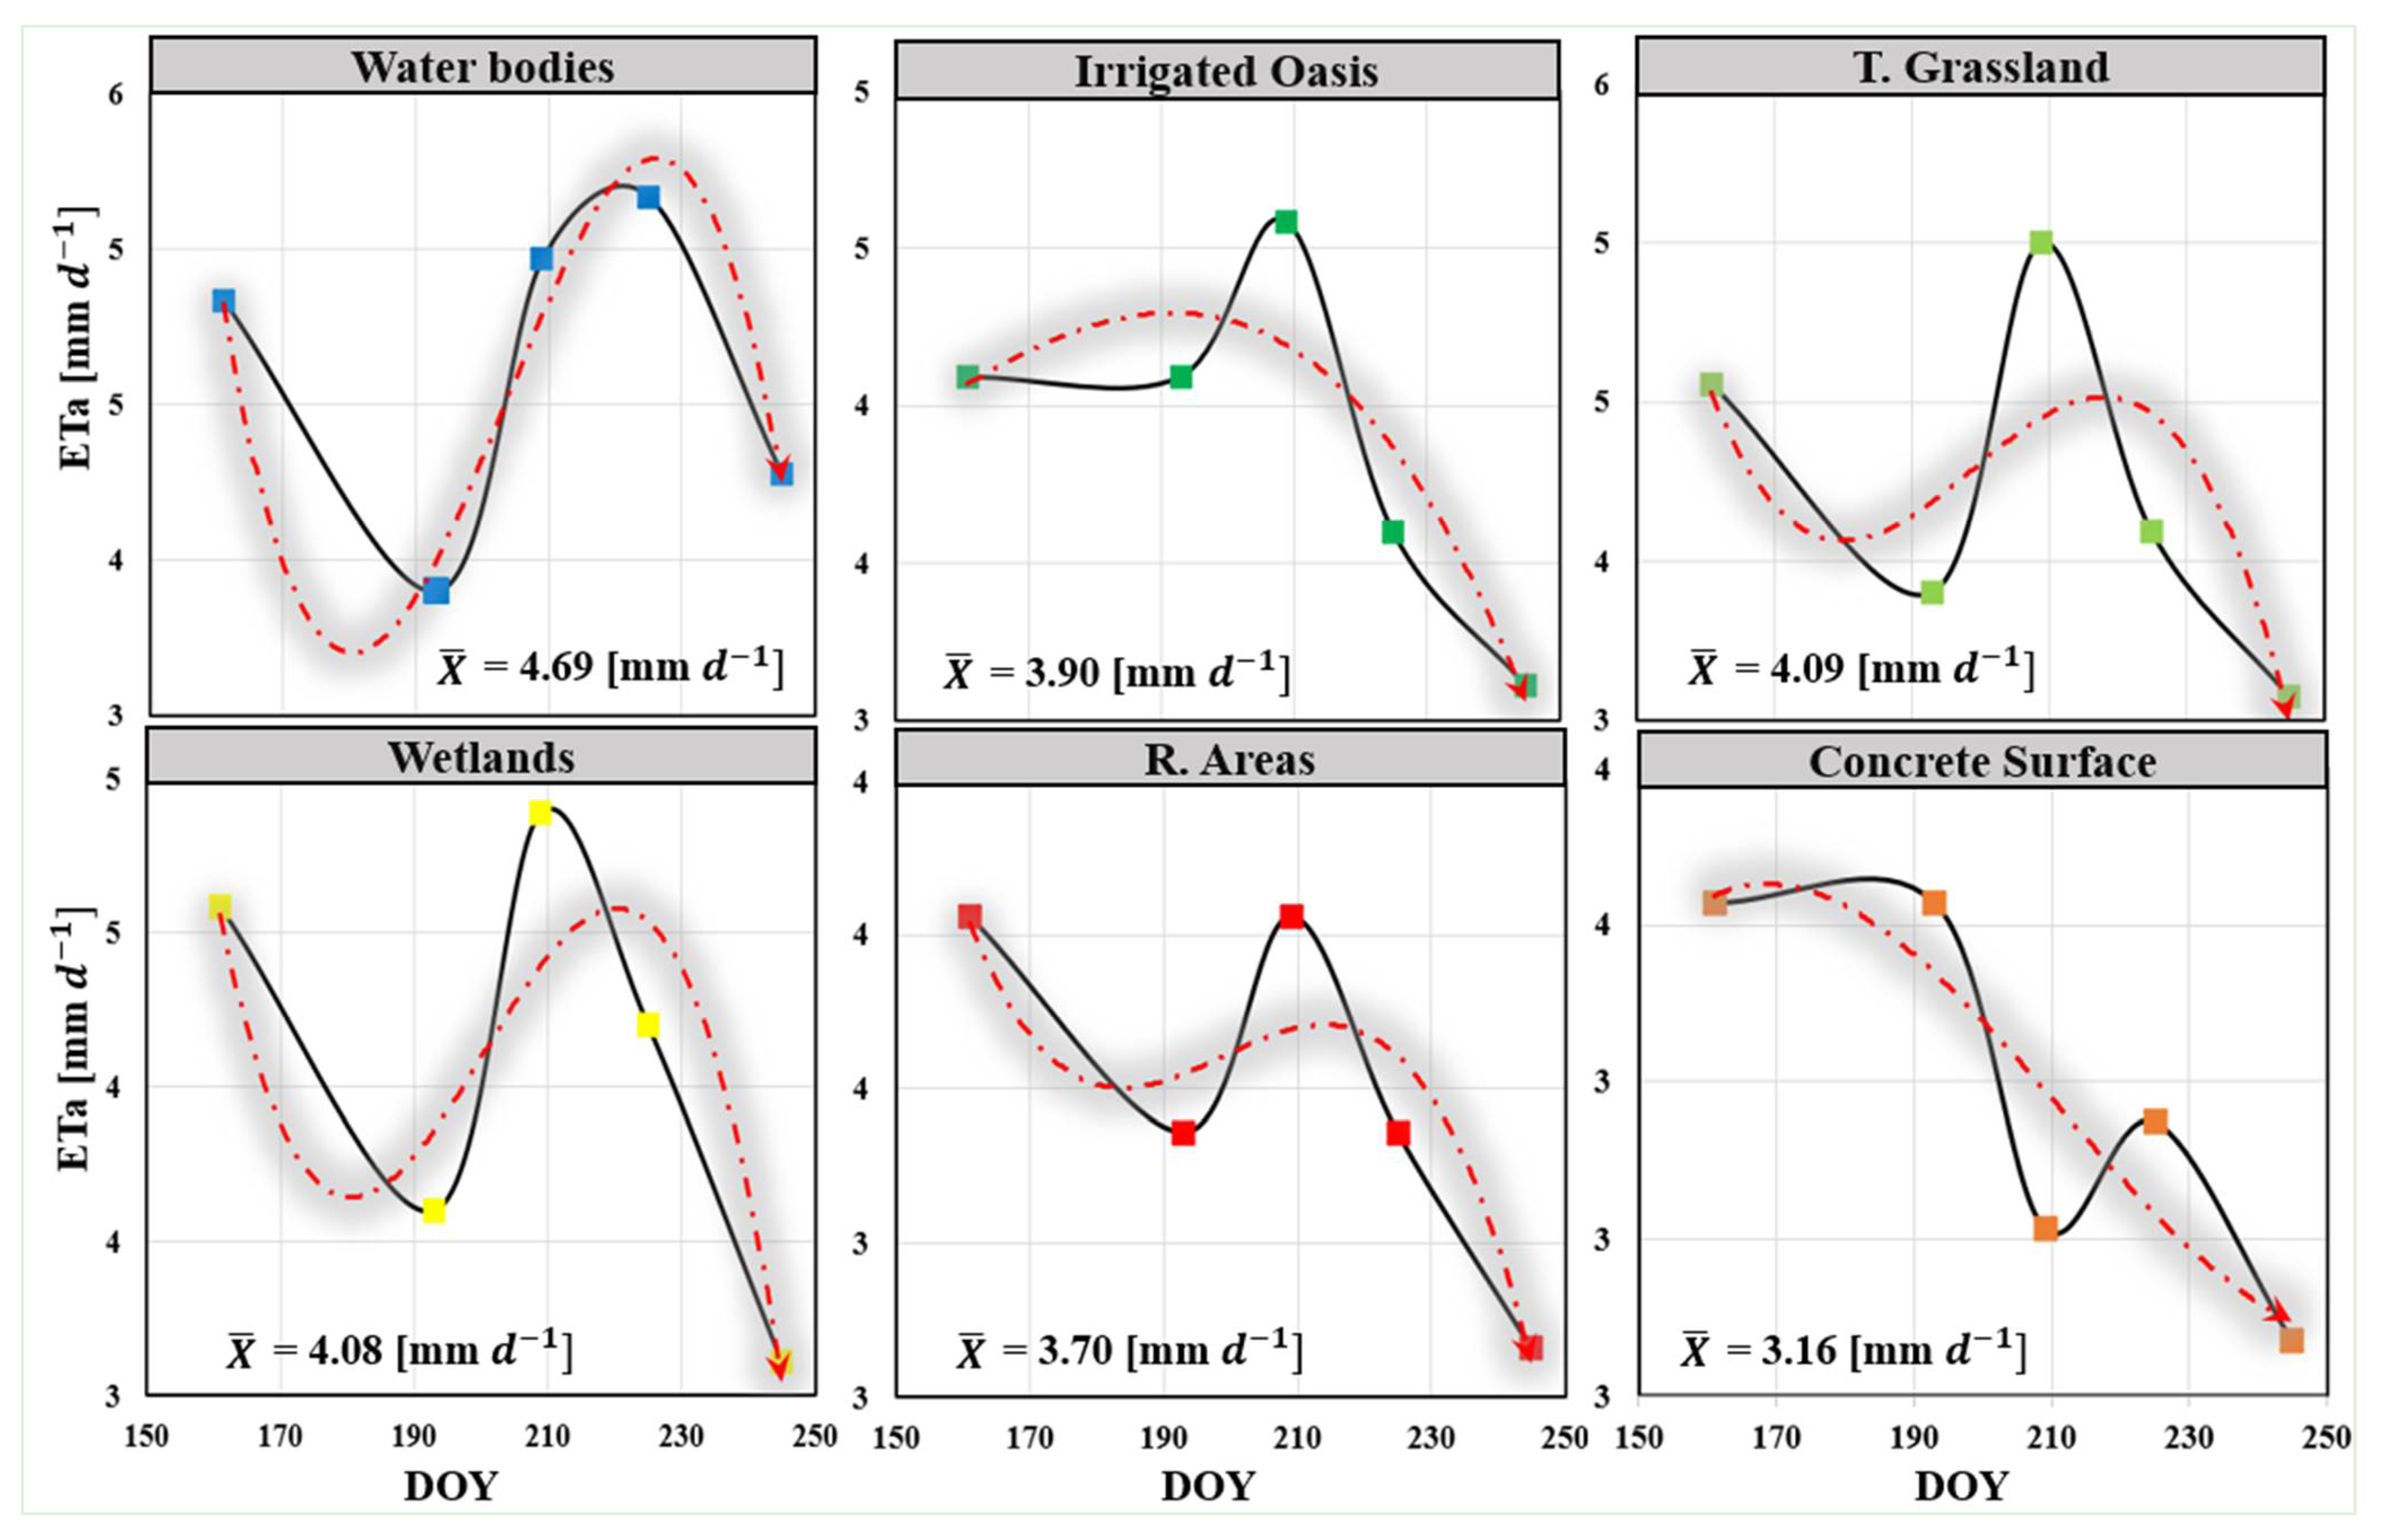
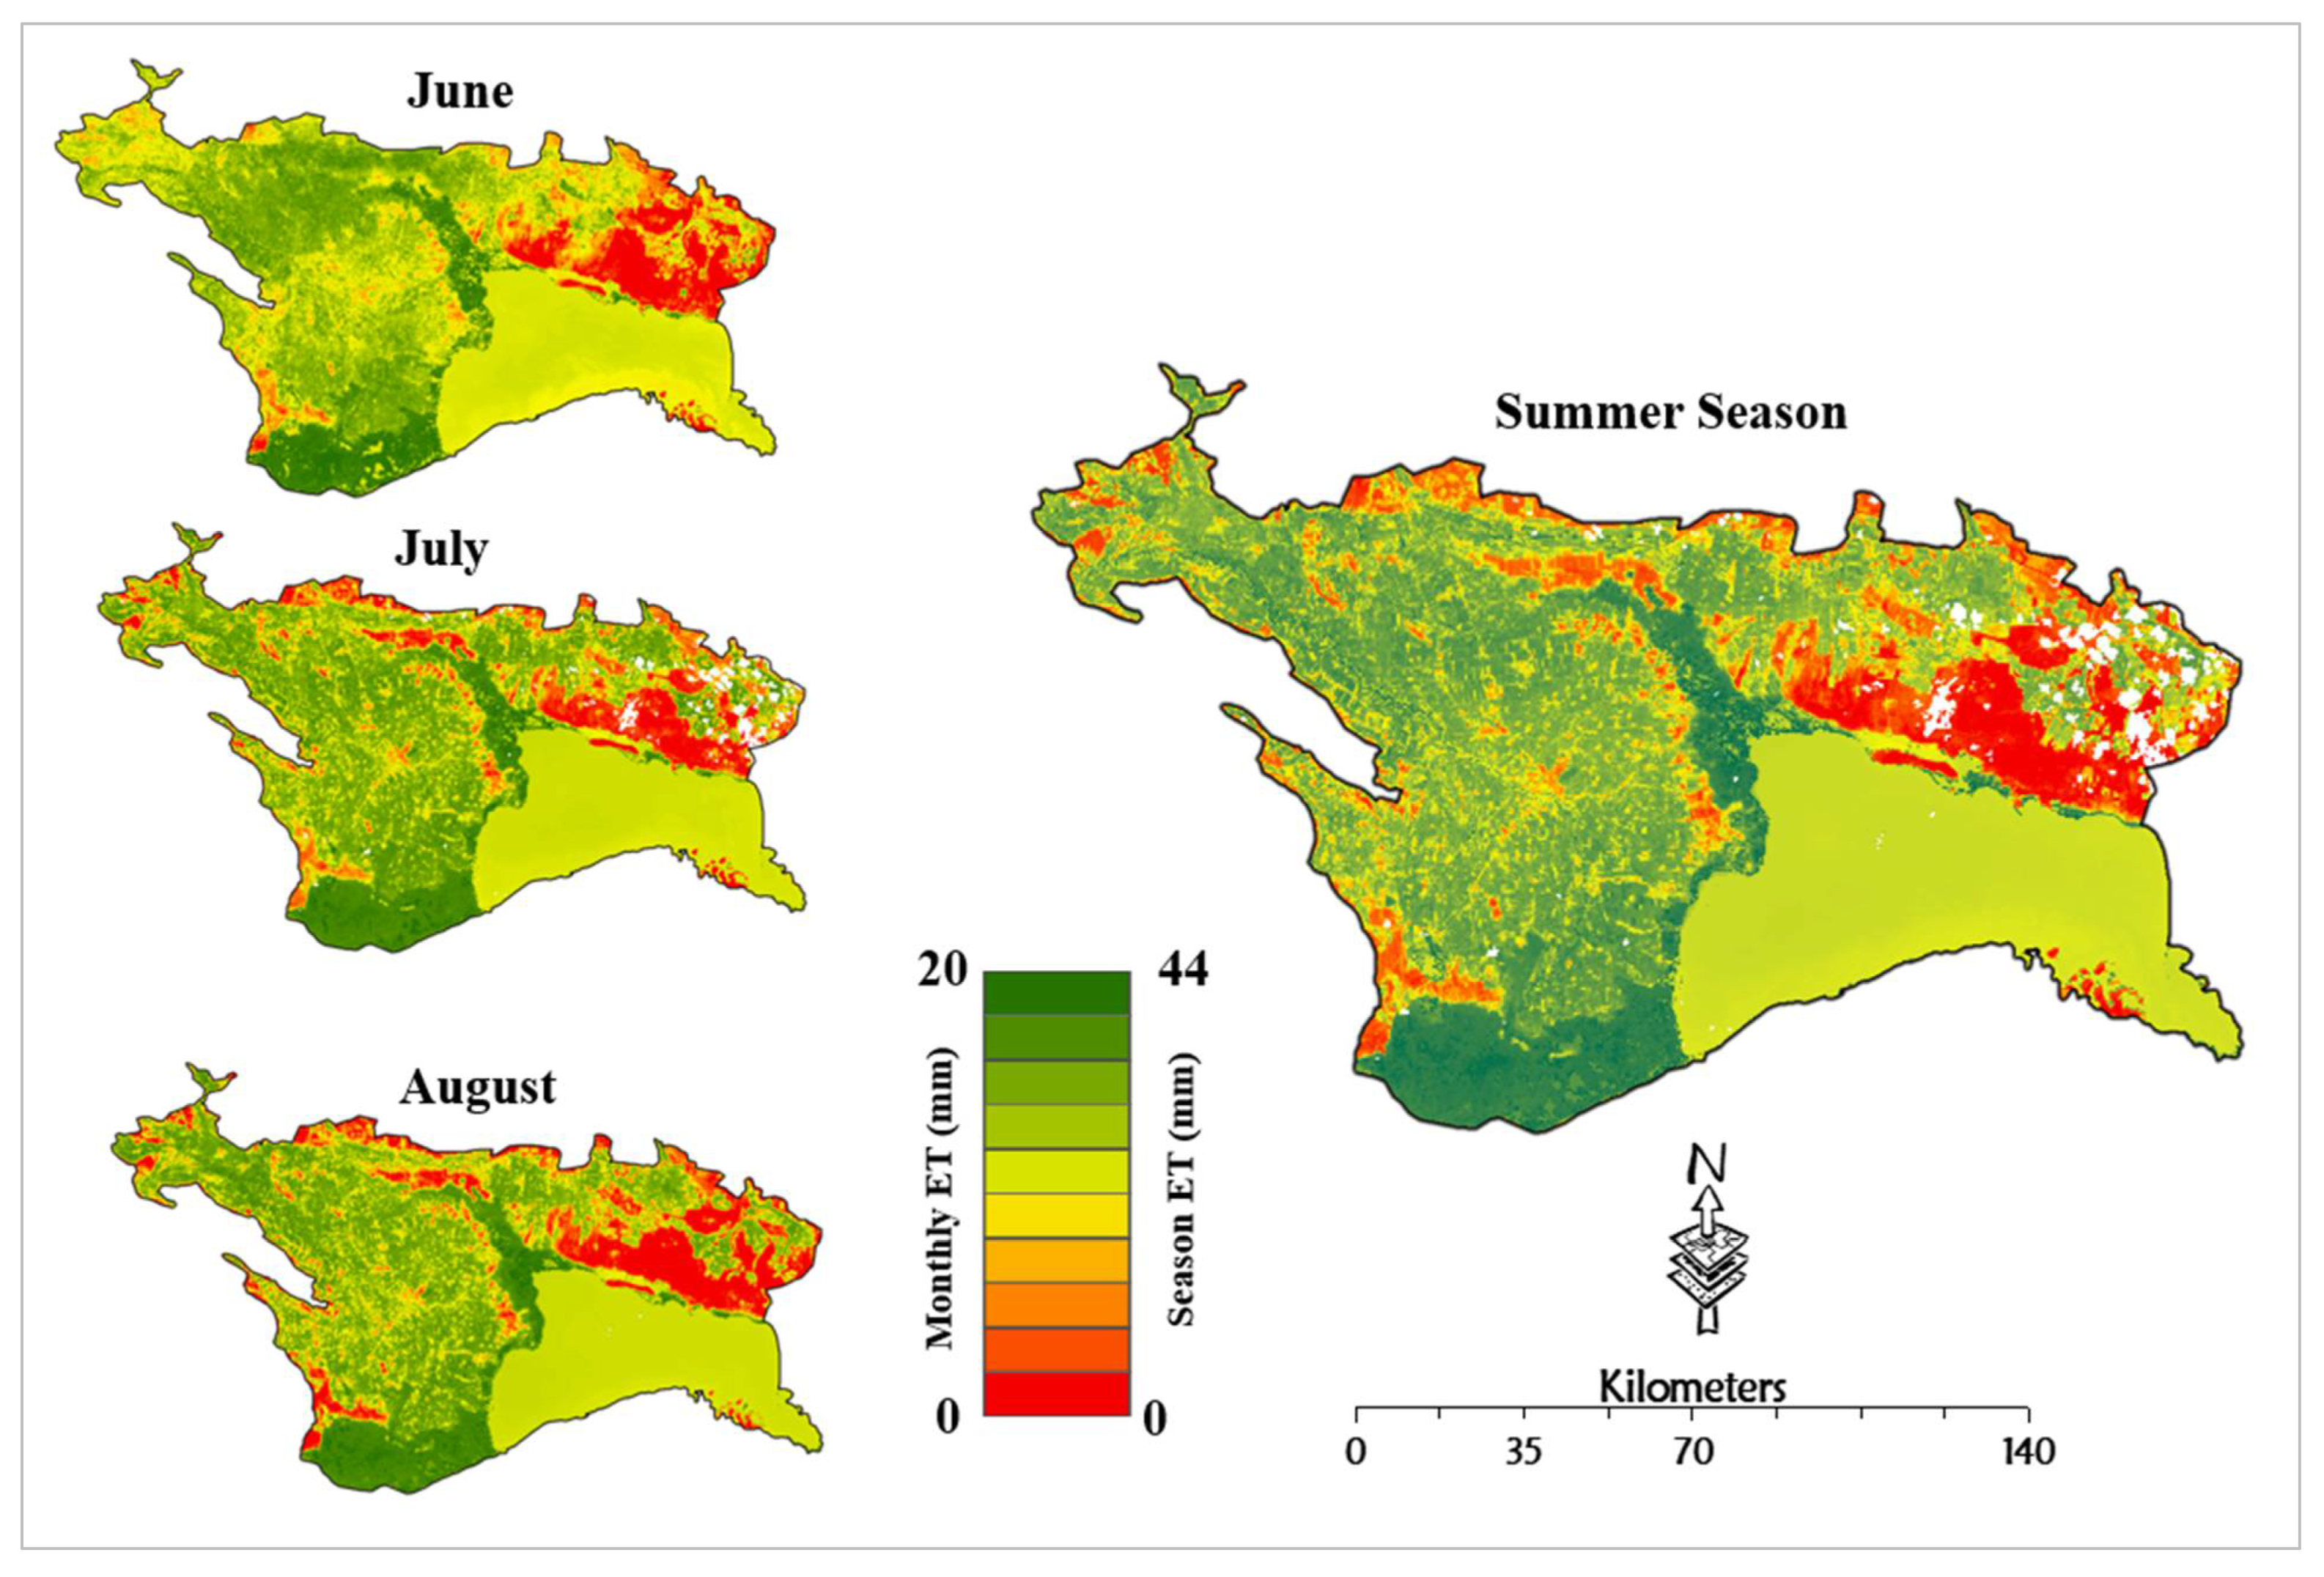
3.2. Dynamics of Daily Mean Evapotranspiration in Response to Yanqi Canopy Density

Diverse land use types vary significantly with the surface physiological characteristics. This includes radiant energy absorption, radiosity to the irradiance, moisture content, and vegetation condition, among others. Thus, daily ETa estimates across land cover surfaces in the basin vary significantly. The daily actual ETa in the basin on pixel basis ranged from 0.00 mm d 1 to 10.4 mm d 1 for the understudied season with the highest mean ETa of 5.5 mm d 1 observed on DOY-225 in the open water surfaces marking the peak of evaporation, closely followed by both wetlands and grasslands patches on DOY-209 at the edge of this open water body (Figure 9), coinciding with the meteorological conditions during the time satellite overpass shown in Figure 2.
Since Yanqi is the main active agroecosystem in the large Bosten basin, oasis cropland ETa mean remained in the range of 0.00 mm d 1 to 4.6 mm d 1 with the highest ETa values recorded on DOY-209 (July). The transpiration variability across cropland can be attributed to the concentration of irrigation activities [80,81]. In our study, the dynamics of ETa in the Yanqi irrigated oasis differ significantly from the desert patches as a result of the well-watered oasis cropland that is well-drained in the Kongque river.
Besides, the nadir ETa values matched with concrete desert ecosystem due to lower fractional vegetation, but also as a result of limited soil moisture content and energy available to evaporate water, otherwise ETa of this latter waved between 0.00 mm d 1 to 3.6 mm d 1 with the lowest ETa (2.63 mm d 1 ) chronicled in August, DOY-241 (Figure 10). Notwithstanding the DOY’s in the understudied period, the average estimates of ETa across grassland were 4.09 mm d 1 , while in wetlands, the mean estimates were 4.08 mm d 1 . With a difference of 0.74 mm d 1 , average estimates ETa of 3.90 mm d 1 and 3.16 mm d 1 were retrieved from the irrigated oasis and concrete desert surface, respectively (Figure 11). As mentioned earlier, water surface evaporation consumes the largest, with an average of about 4.69 mm d 1 in water bodies (Figure 11). In Northwestern China, summer gradually sets in from mid-May, sometimes in June especially in the Xinjiang province, extending to August. These periods are assumed to be marked by high ETa rates noting the temperate aridity nature of the site receiving a low amount of precipitation (80 mm per year). Daily trends of ETa spanning through the summer season at different patches of the study area may appear similar with some DOY. However, we need to bear in mind that the highest evaporation rates were associated with the water surface, fluctuating between 5.5 mm d 1 and 4.17 mm d 1 , with peaks in mid-August. Although, during the whole summer period, high ETa estimates were appearing concentrated in both grasslands and wetlands at the edge of the Bosten lake as already observed in Figure 9. ETa fluctuation can be attributed to irrigation concentration practices, while extreme climate conditions including high summer temperature, low precipitation, and alkaline soils are answerable for the reduced ETa in the concrete desert surfaces.
Given the vegetated patches on DOY-209 Yanqi were marked by high transpiration, partly in temperate grasslands along wetlands as indicated by the concentration of green vegetative cover in the south edge of the basin. On this day, the mean daily transpiration of grasslands reached up to 5.25 mm d 1 compared to 2.88 mm d 1 of evaporation retrieved in the concrete desert ecosystem, while 4.89 mm d 1 and 4.58 mm d 1 were recorded in wetlands and oasis cropland, respectively. During the whole summer period, spatial findings depicted the ETa rates to appear concentrated across the vegetated cover including oasis croplands than the surrounding desert ecosystem. Despite recording the lowest ETa values during the DOY’s, the desert surface recorded high evaporation on DOY-161 and 193 equivalents to 3.6 mm d 1 . Nevertheless, the peak value, 5.5 mm d 1 , is retrieved over water bodies. Similar findings were obtained by Wang, Zhang [36] who assessed the actual evapotranspiration across the large Bosten Lake basin using MODIS datasets and portrayed high ETa rates during the growing season of about 5.61 mm/d over water bodies, followed by grasslands (4.6 mm/d), with the peak in July, which then declined significantly. Additionally, Cha, Li [82] proposed a trapezoid method and a sinusoidal method to estimate ETa across the kai-Kon river basin in Xinjiang and detected a high ETa concentration across temperate grassland and wetlands. In addition, a homologous geographical area similar to ours measured an average ETa across wetlands and prairie ranging between 3.5 and 6.5 mm/d in Nebraska, during the growing season [83]. Last but not all, Micklin, Aladin [84], and Li, Luo [85] also unveiled high ETa estimates over grassland canopies in the summer of the growing season around the Aral sea basin in Central Asia. This implies that daily ETa in the basin rises with the growth of vegetation, despite the low moisture content induced by encroaching desert sands, and will recede as vegetation coverage decreases during summer and harvesting periods.
Figure 12 presents the monthly and summer period cumulatively computed from DOY161-241. Results revealed that the seasonal ETa for Yanqi land surface areas range between 0 mm d 1 and 44 mm d 1 . These values represent the pixel-based water amount transpired by the basin during the understudied period. The magnitude of ETa across the basin was observed to be comparatively temporal homologous in terms of land use types since ETa estimates of all months showed to be intense from vegetated canopy following the open water bodies to non-vegetated sites (residentials and desert surface). The phenomena matched the one presented in Figure 8b under the prevailing energy dissipation of grasslands and wetlands through transpiration. In June, considering the area of the land cover types, higher mean ETa estimates are associated with water bodies, while in mid-July vegetated cover partly temperate grasslands maintained a high ETa, contrary with the late days of August where ETa started to lessen (Figure 12). During this period of the growing season, vegetated canopy including irrigated oasis received more irrigated water amount, which in return increases the crop water holding capacity and soil texture. The action enhances the processes by which Yanqi plant roots uptake water, resulting in more plant transpiration and soil evaporation, with an unsubstantial effect in the desert vegetation and other concrete surfaces [86].
Furthermore, throughout the course of the study period, a nexus between the available energy and ETa was established and exhibited in Figure 13. The intercepts were close to the null value; therefore, ETa was directly relative to the available energy. The regression analysis evidenced that the established available energy was the major expulsive factor of ETa. The strong correlations between the two are detected in mid-July to August (DOY 209, R2 = 0.83; DOY 225, R2 = 0.8; DOY 241, R2 = 0.73) while substantial correlations are observed in June to Mid-July (DOY 161, R2 = 0.64; DOY 193, R2 = 0.62) (Figure 13). Likewise, Hemakumara, Chandrapala [87] assessed the evaporative fraction over a mixed vegetation area including cropland from a large aperture scintillometer and realized ETa to be strongly related to the available energy derived from the net radiation. They also found the mean ETa estimates to range between 1.1 mm/d and 6 mm/d, which are considered to be reasonable estimates under Yanqi climatic conditions. Such land surface energy behavior highlights thermal influences on the oasis ecosystem.
Following the land surface categories, besides water bodies, the summer mm/d variation unveiled that oasis ecosystems consume and transpire more water than other land surface areas in the basin compared to desert surfaces and other areas. In summer, with high NDVI, irrigation activities are intensified, while concrete desert surfaces appeared to be arid with low soil moisture content. Finally, oasis cropland and well-watered lands contributed the most to ETa increment. July has the highest vegetation ETa estimates in this basin, as indicated in Figure 14. In August, following the available energy decrement and vegetation greenness depletion, harvest activities are responsible for the decline in ETa estimates. In fact, in our study area, late August–September is considered as autumn–winter fall months with truncated Rn, which counteracts the heat transfer that produces low energy and low air thermal regimes. From Figure 14, the study revealed that the ETa estimates across vegetated canopy cover lessened on the same wavelength with the converted latent heat fluxes, with the peak of summer warmth marked in mid-July DOY 209. Such a decrement refers to the interception of transpiration by a peculiar local Autumn-winter advection effect [4,40]. Overall, maximum ETa rates measured during the summer period have been caught to occur along the south part of the study area with the greatest average retrieved in water bodies and the largest daily ETa recorded across grasslands and wetlands. Overall, the sequence of ETa magnitude was (water > grasslands > wetlands > oasis cropland > residential areas > concrete desert), equally reported by Wang, Zhang [36] in their study over the large Bosten Lake basin where located the Yanqi basin.

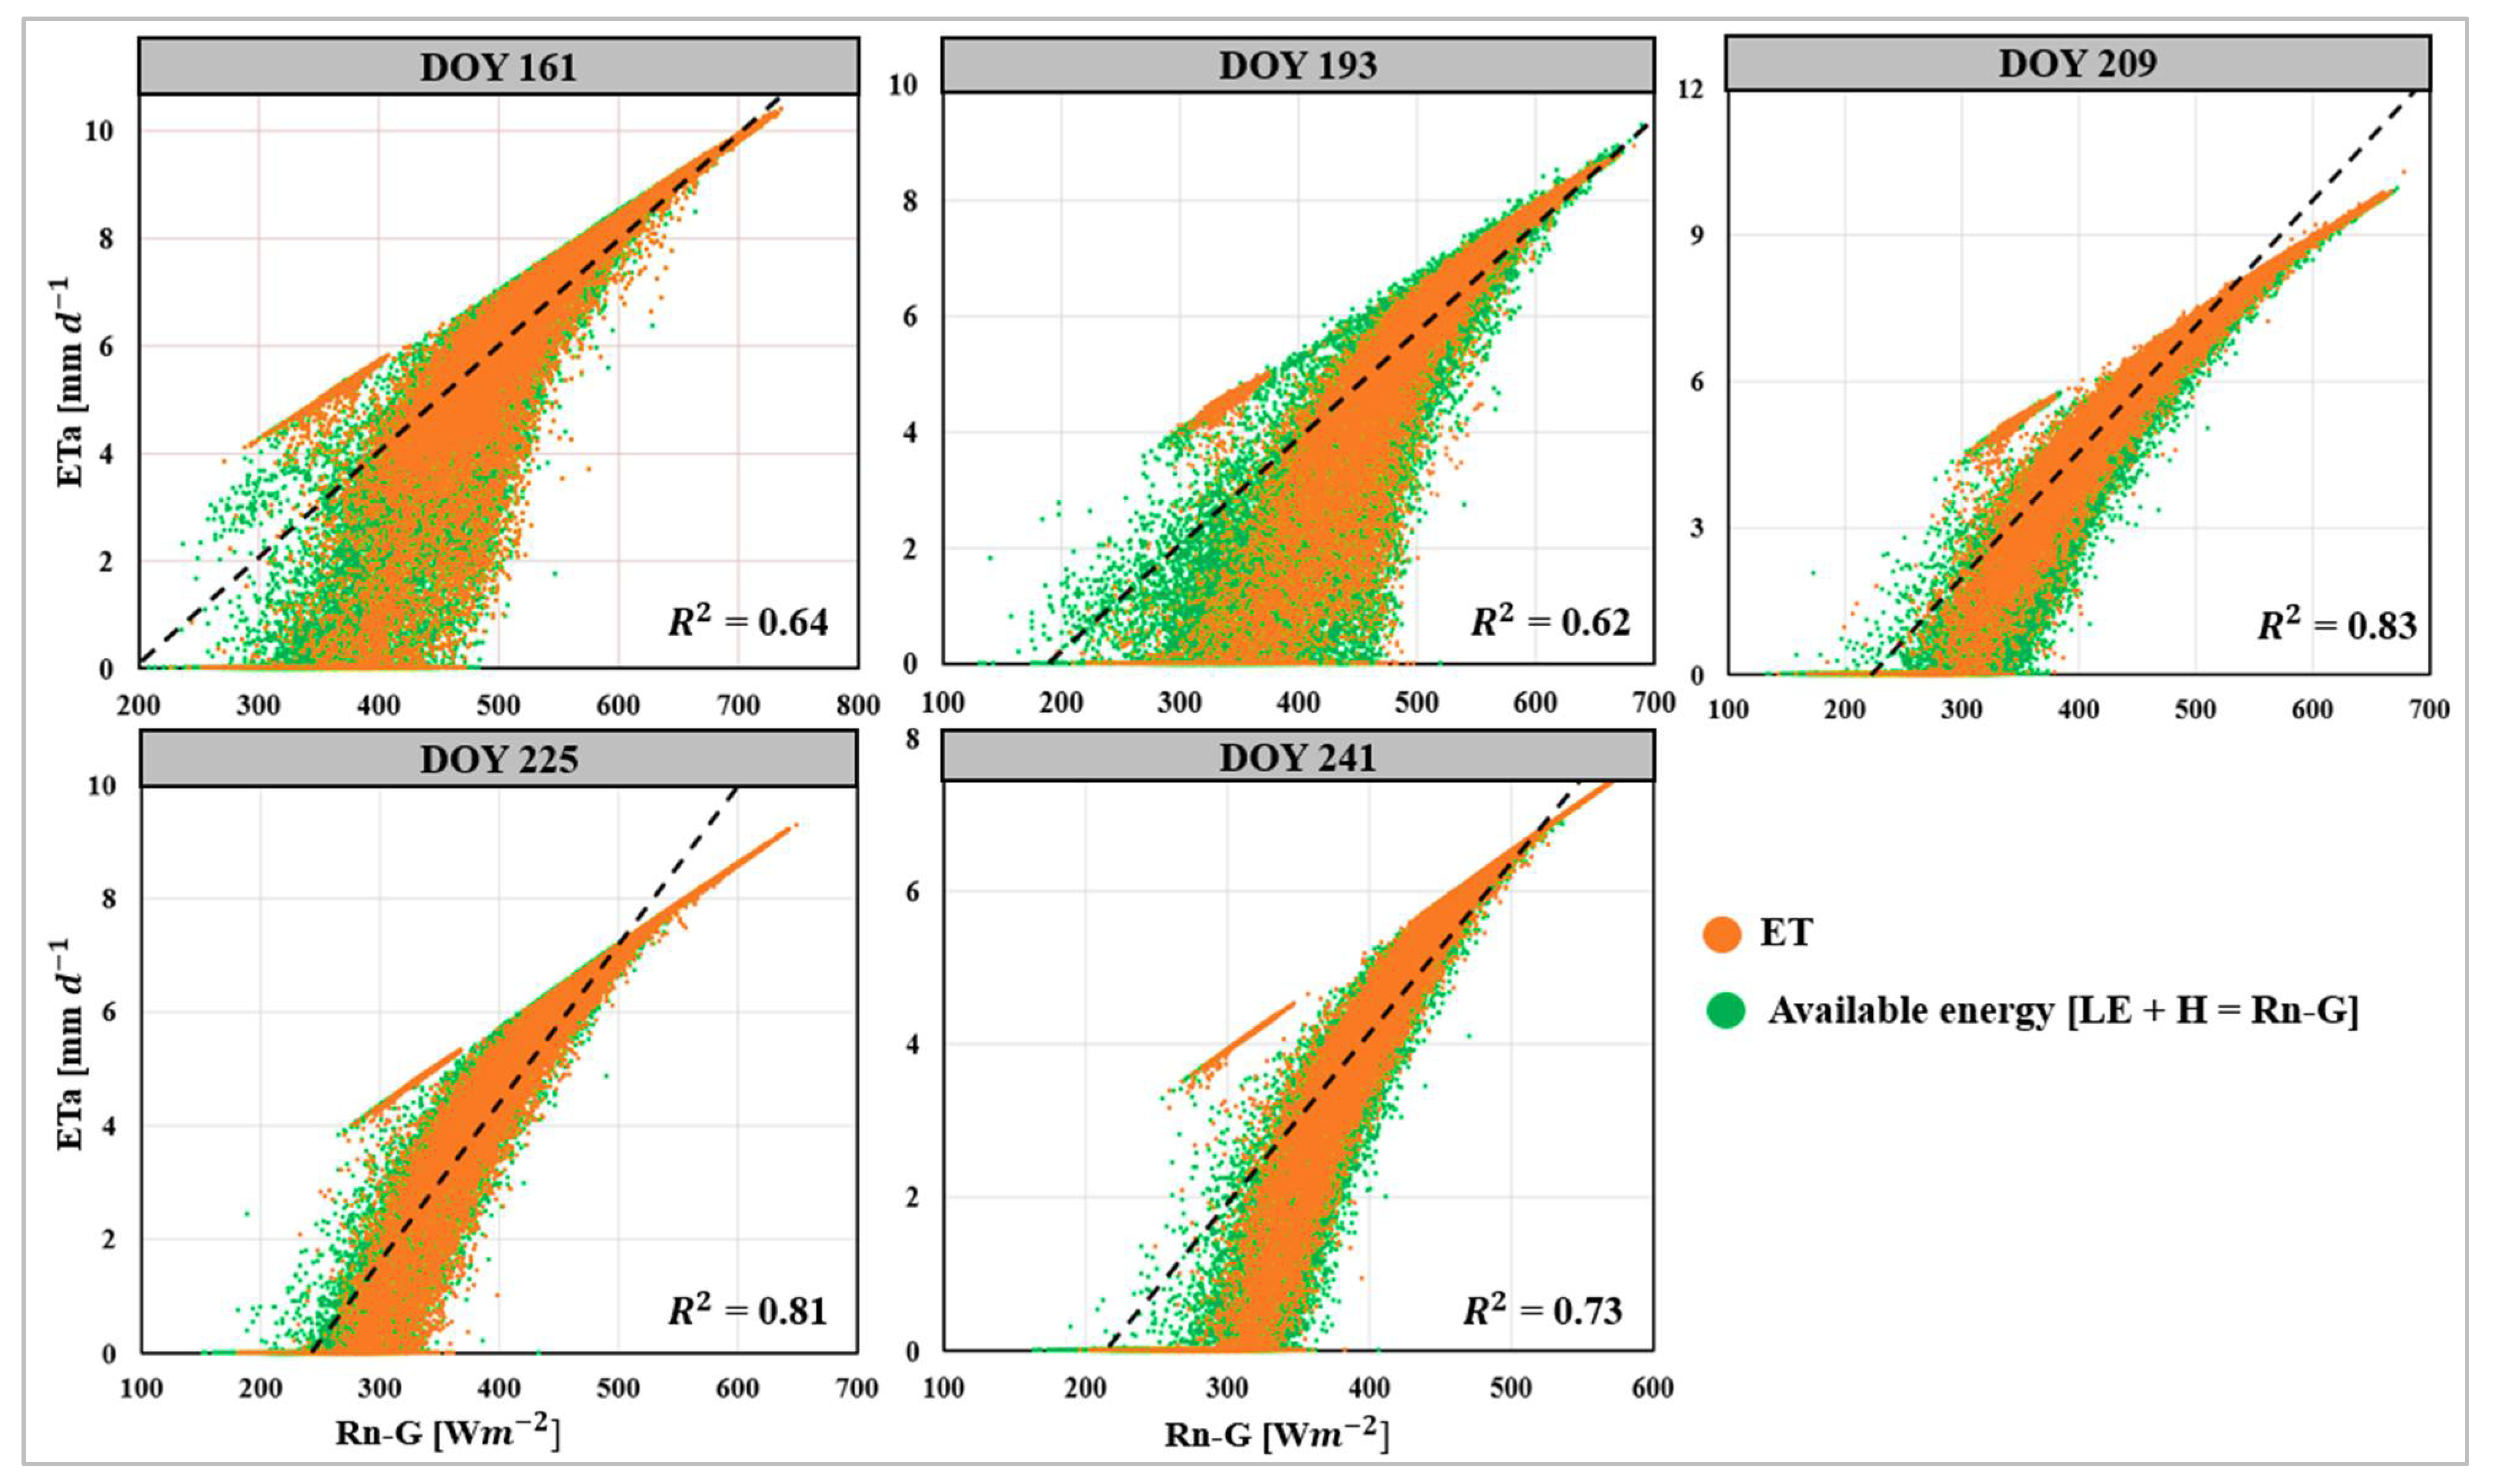
3.3. SEBAL Model Validation

Comparisons of SEBAL model results with ET a estimated at Yanqi station are shown in Table 5. Daily ETa was chosen over instantaneous ET since this former was considered to be more crucial, especially in semi-arid agroecosystems applications. The Mean Absolute Deviation (MAE) and the Root Mean Square Error (RMSE) were statistically applied to evaluate the agreement between the SEBAL modeled ET day and nearby ground-based measurements at the Yanqi site within the clipped satellite scene. RMSE indicates the degree of error in the units of the observed and simulated elements where the null RMSE value indicates strong agreement, and MAE determines the deviation of the simulation accuracy. Findings revealed that the applied SEBAL derived ETa has a strong agreement with the observed ETa at Yanqi site (RMSE = 0.60 mm/day, MAE = 0.48 mm/day). Therefore, Yanqi results within the clipped satellite images indicate reasonable RMSE and agreed with the temporal pattern of ETa which is well captured when applying the SEBAL algorithm.
In addition to temperature, the spatial pattern of plant transpiration and soil evaporation in the large Bosten Lake basin where we based our study area is mainly driven by precipitation and land cover. The study area is known to receive a low amount of precipitation and to experience scant ETa. Yet, the concentration of the flood irrigation approach across the oasis mainly diverted from rivers intensifies the ETa magnitude over the Yanqi basin [79]. Meanwhile, the land surface evapotranspiration magnitude across Yanqi heterogeneous landscape reveals significant differences showing that water > grasslands > wetlands > oasis cropland > residential areas > concrete desert. Despite the lack of integrated near-surface energy fluxes analysis in their study, our finding agrees with the investigations of Li, Chen [88] who also applied SEBAL to measure ET in the mainstream of the Tarim River, Xinjiang Northwestern China, and realized the sequence ET magnitude across land-use types in the order of water bodies > oasis cropland > forest > grassland > unused land. Besides, Li, Yang [89] employed MODIS products coupled with in-situ-observation to invert surface ET in northwest China based on SEBAL, and outcomes showed the MAE between the applied model and Penman-Monteith approach to be 0.79 mm/d, and the RMSE of 0.94 mm/d, which are close to the current study situation at Yanqi station (Table 5), indicating the SEBAL model had good applicability in the study area of interest. In addition to observed ETa values at Yanqi station, the overall agreements, and the constancy of the adjusted cold-hot pixel assortment unveiled the current applied SEBAL to be more skillful at partitioning the water vapor flux over the basin.

3.4. Uncertainties and Prospects

The computerized adjustment of Landsat-8 anchor pixels in SEBAL comparatively produced high accuracies (RMSE and MAE) for ETa in the current study and yielded a reasonable representation for evapotranspiration at the Yanqi site level, indicating the overall agreements and stability of the adjusted cold-hot pixel assortment. Nevertheless, it is unlikely that the complexity of the landscape will guarantee reliable operation in other parts of the larger Bosten Lake basin up to the Tarim basin within mountainous elevation. In addition, we cannot ignore that some small portions covered by clouds were masked out to avoid any errors in the calculation of sensible heat fluxes. This may cause some uncertainty in the final ET average computation. Besides, the study lacks adequate observation data of different surface energy fluxes (Rn, G, H), and that the study only relied on a comprehensive ETa mapping of the summer season. Otherwise, with accurate energy fluxes based on the eddy covariance approach, further invested efforts in inter-seasonal comparison beyond one season or growing season may illustrate a better evaluation of the model to guide future scholars. Besides, the climate forcing data set is the foremost factor supervising evapotranspiration estimates, therefore the evaluation of different forcing climate dataset’s influence on evapotranspiration measurements is widely open for future investigations.

4. Conclusions

The Yanqi basin, being the main active agroecosystem in Xinjiang, northwest China is known to receive a low amount of precipitation and seeks responses to the profound local water-related matters following the unceasing temperature. Nevertheless, routine modeling of spatial averaged near-surface energy balance apparatuses and ETa behavior across landscape canopy is now feasible in sparse ground-based weather observation regions. Here, the utility of a high-spatial-resolution satellite dataset coupled with available in-situ observation was employed to model the behavior of the summer dynamic among near-surface energy and vapor fluxes supervised by the advective effects of oasis and desert ecosystems across Yanqi basin. Besides, the study illustrated the exceeding reliability of high-resolution satellite-driven surface energy balance of energy fluxes across different land-use types, notwithstanding the sparse meteorological observation data. The Surface Energy Balance Algorithm for land (SEBAL) was applied to monitor different near-surface energy fluxes that are essentials in the estimation of the actual ETa over the basin. Results disclosed that the estimation of applied SEBAL to Landsat datasets followed a guided pixel selection from surface albedo, LAI, and NDVI, and the surface temperature ( T S h o t / N D V I   and   T S c o l d / N D V I ) can reasonably reflect ETa in the study area. Compared to field measurements at the Yanqi site, the validation and accuracy of ETa which returned low RMSE (0.5 mm/d) and MAE (0.48 mm/d) indicated the capability and stability of SEBAL model performance to predict surface energy and vapor fluxes across the basin. For that, our findings documented a striking variation in the temporal dissipation of energy where all vegetated sites, mostly grasslands and wetlands were depicted to dissipate more latent heat of ET than the remaining classes. The vegetated sites with a high evaporative fraction were recorded with the highest LE/Rn ranging between 70% to 90%, and water bodies LE/Rn varying from 20% up to 60%, while desert concrete surface and residential areas dissipate the least LE/Rn with low EF, due to the absence of vegetation cover and small water holding capacity. Besides high portrayed evaporation in water bodies, grasslands and wetlands varied interchangeably in accounting for the highest ETa followed by oasis cropland, with a peak of summer warmth observed in mid-July, while low ET estimates were retrieved in both residentials and concrete desert areas. Based on ETa estimates, the sequence of ETa magnitude across Yanqi is: water bodies > grasslands > wetlands > oasis cropland > residentials > concrete desert surface, with average ETa rates of (4.69, 4.09, 4.08, 3.9, 3.7, and 3.16 mm/day) respectively. Vegetation transpiration was dominant for the surface ETa. So, the overall observation and substantial correlation between Rn-G and ET disclosed the available energy influenced by vegetation emissivity (NDVI) to be the primary driver of plant transpiration and soil evaporation in summer over Yanqi. Finally, this study provides essential rapport of near-surface energy fluxes and the likelihood of ETa based information in the summer period over the Yanqi basin. This may be important as a baseline and for such long-term investigations, hence the guidance of agrometeorological services and sustainable management of water resources in temperate-arid regions.

Supplementary Materials

The following are available online at https://www.mdpi.com/article/10.3390/rs13183764/s1, Figure S1. Spatial distribution of surface reflectance across Yanqi Basin under the study period.

Author Contributions

Conceptualization: P.M.K., G.F., Y.C. and M.M.; methodology and data curation: P.M.K. and R.M.; Software and visualization: P.M.K. and Y.H.; formal analysis and writing of the original draft preparation: P.M.K.; Reviewing and editing of the previous draft: M.M., R.M. and S.A.; Supervision and funding acquisition: G.F. and Y.C. All authors have read and agreed to the published version of the manuscript.

Funding

The current research is funded by National Key Research and Development Program (2019YFA0606902) and the National Natural Science Foundation of China (U1903208). The authors gratefully acknowledge the Youth Innovation Promotion Association of the Chinese Academy of Sciences (No. 2019431).

Institutional Review Board Statement

Not applicable.

Informed Consent Statement

Not applicable.

Data Availability Statement

The Landsat 8 datasets and Digital Elevation Model (DEM) are available at no cost through the website https://earthexplorer.usgs.gov/. The European Space Agency (ESA) Land Cover can be accessed through the website http://www.esa-landcover-cci.org/. The Moderate Resolution Imaging Spectroradiometer (MODIS) Land Cover Type (MCD12Q1) Version 6 data product can be downloaded from (https://lpdaac.usgs.gov/). All the relevant data and methods used in this study are also available from the authors upon request.

Conflicts of Interest

The authors declare no potential conflict of interest.

References

  1. Yang, H.; Li, M.-S.; Peng, Y.-G. Analysis on the Minimum Water Requirment of Natural Vegetations in Arid Regions in Xinjiang. Arid Land Geogr. 2005, 6, 770–774. [Google Scholar] [CrossRef]
  2. Haddeland, I.; Heinke, J.; Biemans, H.; Eisner, S.; Flörke, M.; Hanasaki, N.; Konzmann, M.; Ludwig, F.; Masaki, Y.; Schewe, J.; et al. Global water resources affected by human interventions and climate change. Proc. Natl. Acad. Sci. USA 2014, 111, 3251–3256. [Google Scholar] [CrossRef] [PubMed] [Green Version]
  3. Schlesinger, W.H.; Jasechko, S. Transpiration in the global water cycle. Agric. For. Meteorol. 2014, 189–190, 115–117. [Google Scholar] [CrossRef]
  4. Ochege, F.U.; Luo, G.; Obeta, M.C.; Owusu, G.; Duulatov, E.; Cao, L.; Nsengiyumva, J.B. Mapping evapotranspiration variability over a complex oasis-desert ecosystem based on automated calibration of Landsat 7 ETM+ data in SEBAL. GIScience Remote Sens. 2019, 56, 1305–1332. [Google Scholar] [CrossRef]
  5. Song, C.; Sheng, Y.; Zhan, S.; Wang, J.; Ke, L.; Liu, K. Impact of amplified evaporation due to lake expansion on the water budget across the inner Tibetan Plateau. Int. J. Clim. 2020, 40, 2091–2105. [Google Scholar] [CrossRef]
  6. Zhao, L.; Xia, J.; Xu, C.-Y.; Wang, Z.; Sobkowiak, L.; Long, C. Evapotranspiration estimation methods in hydrological models. J. Geogr. Sci. 2013, 23, 359–369. [Google Scholar] [CrossRef]
  7. Rodell, M.; McWilliams, E.B.; Famiglietti, J.S.; Beaudoing, H.K.; Nigro, J. Estimating evapotranspiration using an observation based terrestrial water budget. Hydrol. Process. 2011, 25, 4082–4092. [Google Scholar] [CrossRef]
  8. Mu, Q.; Zhao, M.; Running, S.W. Improvements to a MODIS global terrestrial evapotranspiration algorithm. Remote Sens. Environ. 2011, 115, 1781–1800. [Google Scholar] [CrossRef]
  9. Oki, T.; Kanae, S.; Musiake, K. Global Hydrological Cycle and World Water Resources. Science 2003, 313, 1068–1072. [Google Scholar] [CrossRef] [Green Version]
  10. Jung, M.; Reichstein, M.; Ciais, P.; Seneviratne, S.; Sheffield, J.; Goulden, M.; Bonan, G.; Cescatti, A.; Chen, J.; De Jeu, R.; et al. Recent decline in the global land evapotranspiration trend due to limited moisture supply. Nature 2010, 467, 951–954. [Google Scholar] [CrossRef]
  11. Zhang, K.; Kimball, J.S.; Nemani, R.R.; Running, S.W.; Hong, Y.; Gourley, J.J.; Yu, Z. Vegetation Greening and Climate Change Promote Multidecadal Rises of Global Land Evapotranspiration. Sci. Rep. 2015, 5, 15956. [Google Scholar] [CrossRef] [PubMed]
  12. Guo, M.; Wu, W.; Zhou, X.; Chen, Y.; Li, J. Investigation of the dramatic changes in lake level of the Bosten Lake in northwestern China. Theor. Appl. Clim. 2015, 119, 341–351. [Google Scholar] [CrossRef]
  13. Chen, X.; Wu, J.; Hu, Q. Simulation of Climate Change Impacts on Streamflow in the Bosten Lake Basin Using an Artificial Neural Network Model. J. Hydrol. Eng. 2008, 13, 180–183. [Google Scholar] [CrossRef]
  14. Dong, Q.; Wang, W.; Shao, Q.; Xing, W.; Ding, Y.; Fu, J. The response of reference evapotranspiration to climate change in Xinjiang, China: Historical changes, driving forces, and future projections. Int. J. Clim. 2020, 40, 235–254. [Google Scholar] [CrossRef]
  15. Thevs, N.; Peng, H.; Rozi, A.; Zerbe, S.; Abdusalih, N. Water allocation and water consumption of irrigated agriculture and natural vegetation in the Aksu-Tarim river basin, Xinjiang, China. J. Arid. Environ. 2015, 112, 87–97. [Google Scholar] [CrossRef]
  16. Wang, K.; Dickinson, R.E.; Liang, S. Global Atmospheric Evaporative Demand over Land from 1973 to 2008. J. Clim. 2012, 25, 8353–8361. [Google Scholar] [CrossRef]
  17. Hobbins, M.T.; Wood, A.; McEvoy, D.J.; Huntington, J.L.; Morton, C.; Anderson, M.; Hain, C. The Evaporative Demand Drought Index. Part I: Linking Drought Evolution to Variations in Evaporative Demand. J. Hydrometeorol. 2016, 17, 1745–1761. [Google Scholar] [CrossRef]
  18. Liu, S.; Xu, Z.; Zhu, Z.; Jia, Z.; Zhu, M. Measurements of evapotranspiration from eddy-covariance systems and large aperture scintillometers in the Hai River Basin, China. J. Hydrol. 2013, 487, 24–38. [Google Scholar] [CrossRef]
  19. Mueller, B.; Seneviratne, S.; Jimenez, C.; Corti, T.; Hirschi, M.; Balsamo, G.; Ciais, P.; Dirmeyer, P.; Fisher, J.; Guo, Z.; et al. Evaluation of global observations-based evapotranspiration datasets and IPCC AR4 simulations. Geophys. Res. Lett. 2011, 38. [Google Scholar] [CrossRef] [Green Version]
  20. Allen, R.G.; Tasumi, M.; Trezza, R. Satellite-Based Energy Balance for Mapping Evapotranspiration with Internalized Calibration (METRIC)—Model. J. Irrig. Drain. Eng. 2007, 133, 380–394. [Google Scholar] [CrossRef]
  21. Santos, C.; Lorite, I.J.; Tasumi, M.; Allen, R.G.; Fereres, E. Integrating satellite-based evapotranspiration with simulation models for irrigation management at the scheme level. Irrig. Sci. 2008, 26, 277–288. [Google Scholar] [CrossRef]
  22. Su, Z. The Surface Energy Balance System (SEBS) for estimation of turbulent heat fluxes. Hydrol. Earth Syst. Sci. 2002, 6, 85–100. [Google Scholar] [CrossRef]
  23. Roerink, G.; Su, Z.; Menenti, M. S-SEBI: A simple remote sensing algorithm to estimate the surface energy balance. Phys. Chem. Earth Part B Hydrol. Oceans Atmos. 2000, 25, 147–157. [Google Scholar] [CrossRef]
  24. Bastiaanssen, W.G.; Menenti, M.; Feddes, R.A.; Holtslag, A.A.M. A remote sensing surface energy balance algorithm for land (SEBAL). 1. Formulation. J. Hydrol. 1998, 212, 198–212. [Google Scholar] [CrossRef]
  25. Mhawej, M.; Elias, G.; Nasrallah, A.; Faour, G. Dynamic calibration for better SEBALI ET estimations: Validations and recommendations. Agric. Water Manag. 2020, 230, 105955. [Google Scholar] [CrossRef]
  26. Paul, G.; Gowda, P.H.; Prasad, P.V.; Howell, T.A.; Staggenborg, S.A.; Neale, C.M. Lysimetric evaluation of SEBAL using high resolution airborne imagery from BEAREX08. Adv. Water Resour. 2013, 59, 157–168. [Google Scholar] [CrossRef] [Green Version]
  27. Bastiaanssen, W.G.M.; Noordman, E.J.M.; Pelgrum, H.; Davids, G.; Thoreson, B.P.; Allen, R.G. SEBAL Model with Remotely Sensed Data to Improve Water-Resources Management under Actual Field Conditions. J. Irrig. Drain. Eng. 2005, 131, 85–93. [Google Scholar] [CrossRef]
  28. Allen, R.; Irmak, A.; Trezza, R.; Hendrickx, J.M.H.; Bastiaanssen, W.; Kjaersgaard, J. Satellite-based ET estimation in agriculture using SEBAL and METRIC. Hydrol. Process. 2011, 25, 4011–4027. [Google Scholar] [CrossRef]
  29. Mhawej, M.; Faour, G. Open-source Google Earth Engine 30-m evapotranspiration rates retrieval: The SEBALIGEE system. Environ. Model. Softw. 2020, 133, 104845. [Google Scholar] [CrossRef]
  30. Bastiaanssen, W.G.; Pelgrum, H.; Wang, J.; Ma, Y.; Moreno, J.F.; Roerink, G.J.; Van der Wal, T. A remote sensing surface energy balance algorithm for land (SEBAL): Part 2: Validation. J. Hydrol. 1998, 212, 213–229. [Google Scholar] [CrossRef]
  31. Yao, J.; Chen, Y.; Zhao, Y.; Yu, X. Hydroclimatic changes of Lake Bosten in Northwest China during the last decades. Sci. Rep. 2018, 8, 1–13. [Google Scholar] [CrossRef] [Green Version]
  32. Wang, Y.; Zhou, X.; Engel, B. Water environment carrying capacity in Bosten Lake basin. J. Clean. Prod. 2018, 199, 574–583. [Google Scholar] [CrossRef]
  33. Yang, H.; Xu, J.; Chen, Y.; Li, D.; Zuo, J.; Zhu, N.; Chen, Z. Has the Bosten Lake Basin been dry or wet during the climate transition in Northwest China in the past 30 years? Theor. Appl. Climatol. 2020, 141, 627–644. [Google Scholar] [CrossRef]
  34. Xu, H.; Ye, M.; Song, Y.; Chen, Y. The Natural Vegetation Responses to the Groundwater Change Resulting from Ecological Water Conveyances to the Lower Tarim River. Environ. Monit. Assess. 2007, 131, 37–48. [Google Scholar] [CrossRef]
  35. Wu, M.; Wu, J.; Lin, J.; Zhu, X.; Wu, J.; Hu, B.X. Evaluating the interactions between surface water and groundwater in the arid mid-eastern Yanqi Basin, northwestern China. Hydrol. Sci. J. 2018, 63, 1313–1331. [Google Scholar] [CrossRef]
  36. Wang, Y.; Zhang, S.; Chang, X. Evapotranspiration Estimation Based on Remote Sensing and the SEBAL Model in the Bosten Lake Basin of China. Sustainability 2020, 12, 7293. [Google Scholar] [CrossRef]
  37. Timmermans, W.J.; Kustas, W.P.; Anderson, M.; French, A.N. An intercomparison of the Surface Energy Balance Algorithm for Land (SEBAL) and the Two-Source Energy Balance (TSEB) modeling schemes. Remote Sens. Environ. 2007, 108, 369–384. [Google Scholar] [CrossRef]
  38. Bhattarai, N.; Quackenbush, L.J.; Im, J.; Shaw, S.B. A new optimized algorithm for automating endmember pixel selection in the SEBAL and METRIC models. Remote Sens. Environ. 2017, 196, 178–192. [Google Scholar] [CrossRef]
  39. Singh, R.K.; Irmak, A.; Irmak, S.; Martin, D.L. Application of SEBAL Model for Mapping Evapotranspiration and Estimating Surface Energy Fluxes in South-Central Nebraska. J. Irrig. Drain. Eng. 2008, 134, 273–285. [Google Scholar] [CrossRef]
  40. Allen, R.G.; Morse, A.; Tasumi, M.; Bastiaanssen, W.; Kramber, W.; Anderson, H. Evapotranspiration from Landsat (SEBAL) for water rights management and compliance with multi-state water compacts. In IGARSS 2001. Scanning the Present and Resolving the Future, Proceedings of the IEEE 2001 International Geoscience and Remote Sensing Symposium (Cat. No. 01CH37217), Sydney, Australia, 9–13 July 2001; IEEE: New York, NY, USA, 2001; Volume 2, pp. 830–833. [Google Scholar]
  41. Gentilucci, M.; Bufalini, M.; Materazzi, M.; Barbieri, M.; Aringoli, D.; Farabollini, P.; Pambianchi, G. Calculation of Potential Evapotranspiration and Calibration of the Hargreaves Equation Using Geostatistical Methods over the Last 10 Years in Central Italy. Geosciences 2021, 11, 348. [Google Scholar] [CrossRef]
  42. Tegos, A.; Malamos, N.; Koutsoyiannis, D. A parsimonious regional parametric evapotranspiration model based on a simplification of the Penman–Monteith formula. J. Hydrol. 2015, 524, 708–717. [Google Scholar] [CrossRef]
  43. Kjelgaard, J.; Bellocchi, G. Evaluation of estimated weather data for calculating Penman-Monteith reference crop evapotranspiration. Irrig. Sci. 2004, 23, 39–46. [Google Scholar] [CrossRef]
  44. Jiménez-Bello, M.; Castel, J.R.; Testi, L.; Intrigliolo, D.S. Assessment of a Remote Sensing Energy Balance Methodology (SEBAL) Using Different Interpolation Methods to Determine Evapotranspiration in a Citrus Orchard. IEEE J. Sel. Top. Appl. Earth Obs. Remote Sens. 2015, 8, 1465–1477. [Google Scholar] [CrossRef] [Green Version]
  45. Madugundu, R.; Al-Gaadi, K.A.; Tola, E.; Hassaballa, A.A.; Patil, V. Performance of the METRIC model in estimating evapotranspiration fluxes over an irrigated field in Saudi Arabia using Landsat-8 images. Hydrol. Earth Syst. Sci. 2017, 21, 6135–6151. [Google Scholar] [CrossRef] [Green Version]
  46. Jassas, H.; Kanoua, W.; Merkel, B. Actual Evapotranspiration in the Al-Khazir Gomal Basin (Northern Iraq) Using the Surface Energy Balance Algorithm for Land (SEBAL) and Water Balance. Geosciences 2015, 5, 141–159. [Google Scholar] [CrossRef] [Green Version]
  47. Brutsaert, W. Aspects of bulk atmospheric boundary layer similarity under free-convective conditions. Rev. Geophys. 1999, 37, 439–451. [Google Scholar] [CrossRef]
  48. Jia, L.; Su, Z.; Hurk, B.V.D.; Menenti, M.; Moene, A.; De Bruin, H.A.; Yrisarry, J.B.; Ibanez, M.; Cuesta, A. Estimation of sensible heat flux using the Surface Energy Balance System (SEBS) and ATSR measurements. Phys. Chem. Earth Part B 2003, 28, 75–88. [Google Scholar] [CrossRef]
  49. Mira, M.; Olioso, A.; Gallego-Elvira, B.; Courault, D.; Garrigues, S.; Marloie, O.; Hagolle, O.; Guillevic, P.; Boulet, G. Uncertainty assessment of surface net radiation derived from Landsat images. Remote Sens. Environ. 2016, 175, 251–270. [Google Scholar] [CrossRef] [Green Version]
  50. Bisht, G.; Venturini, V.; Islam, S.; Jiang, L. Estimation of the net radiation using MODIS (Moderate Resolution Imaging Spectroradiometer) data for clear sky days. Remote Sens. Environ. 2005, 97, 52–67. [Google Scholar] [CrossRef]
  51. Liou, Y.-A.; Le, M.S.; Chien, H. Normalized Difference Latent Heat Index for Remote Sensing of Land Surface Energy Fluxes. IEEE Trans. Geosci. Remote Sens. 2018, 57, 1423–1433. [Google Scholar] [CrossRef]
  52. Allen, R.G.; Burnett, B.; Kramber, W.; Huntington, J.L.; Kjaersgaard, J.; Kilic, A.; Kelly, C.; Trezza, R. Automated Calibration of the METRIC-Landsat Evapotranspiration Process. JAWRA 2013, 49, 563–576. [Google Scholar] [CrossRef]
  53. Cuenca, R.H.; Ciotti, S.P.; Hagimoto, Y. Application of Landsat to Evaluate Effects of Irrigation Forbearance. Remote Sens. 2013, 5, 3776–3802. [Google Scholar] [CrossRef] [Green Version]
  54. Tolk, J.A.; Evett, S.R.; Howell, T.A. Advection Influences on Evapotranspiration of Alfalfa in a Semiarid Climate. Agron. J. 2006, 98, 1646–1654. [Google Scholar] [CrossRef] [Green Version]
  55. Berengena, J.; Gavilán, P. Reference Evapotranspiration Estimation in a Highly Advective Semiarid Environment. J. Irrig. Drain. Eng. 2005, 131, 147–163. [Google Scholar] [CrossRef]
  56. Lang, A.; Evans, G.; Ho, P. The influence of local advection on evapotranspiration from irrigated rice in a semi-arid region. Agric. Meteorol. 1974, 13, 5–13. [Google Scholar] [CrossRef]
  57. Zhou, L.-T. Influence of thermal state of warm pool in western Pacific on sensible heat flux. Atmos. Sci. Lett. 2013, 14, 91–96. [Google Scholar] [CrossRef]
  58. Li, L.; Yu, Q. Quantifying the effects of advection on canopy energy budgets and water use efficiency in an irrigated wheat field in the North China Plain. Agric. Water Manag. 2007, 89, 116–122. [Google Scholar] [CrossRef]
  59. Almeida, A.C.; Soares, J.V.; Landsberg, J.J.; Rezende, G.D. Growth and water balance of Eucalyptus grandis hybrid plantations in Brazil during a rotation for pulp production. For. Ecol. Manag. 2007, 251, 10–21. [Google Scholar] [CrossRef]
  60. Vincke, C.; Thiry, Y. Water table is a relevant source for water uptake by a Scots pine (Pinus sylvestris L.) stand: Evidences from continuous evapotranspiration and water table monitoring. Agric. For. Meteorol. 2008, 148, 1419–1432. [Google Scholar] [CrossRef]
  61. Aguilos, M.; Sun, G.; Noormets, A.; Domec, J.-C.; McNulty, S.; Gavazzi, M.; Minick, K.; Mitra, B.; Prajapati, P.; Yang, Y.; et al. Effects of land-use change and drought on decadal evapotranspiration and water balance of natural and managed forested wetlands along the southeastern US lower coastal plain. Agric. For. Meteorol. 2021, 303, 108381. [Google Scholar] [CrossRef]
  62. Duveiller, G.; Hooker, J.; Cescatti, A. The mark of vegetation change on Earth’s surface energy balance. Nat. Commun. 2018, 9, 1–12. [Google Scholar] [CrossRef] [Green Version]
  63. Sun, X.; Zou, C.B.; Wilcox, B.; Stebler, E. Effect of Vegetation on the Energy Balance and Evapotranspiration in Tallgrass Prairie: A Paired Study Using the Eddy-Covariance Method. Bound.-Layer Meteorol. 2019, 170, 127–160. [Google Scholar] [CrossRef]
  64. Twine, T.; Kustas, W.; Norman, J.; Cook, D.; Houser, P.; Meyers, T.; Prueger, J.; Starks, P.; Wesely, M. Correcting eddy-covariance flux underestimates over a grassland. Agric. For. Meteorol. 2000, 103, 279–300. [Google Scholar] [CrossRef] [Green Version]
  65. Trepekli, A.; Loupa, G.; Rapsomanikis, S. Seasonal evapotranspiration, energy fluxes and turbulence variance characteristics of a Mediterranean coastal grassland. Agric. For. Meteorol. 2016, 226–227, 13–27. [Google Scholar] [CrossRef]
  66. Jian, D.; Li, X.; Sun, H.; Tao, H.; Jiang, T.; Su, B.; Hartmann, H. Estimation of Actual Evapotranspiration by the Complementary Theory-Based Advection–Aridity Model in the Tarim River Basin, China. J. Hydrometeorol. 2018, 19, 289–303. [Google Scholar] [CrossRef]
  67. Zhang, Z.; Li, X.; Liu, L.; Wang, Y.; Li, Y. Influence of mulched drip irrigation on landscape scale evapotranspiration from farmland in an arid area. Agric. Water Manag. 2020, 230, 105953. [Google Scholar] [CrossRef]
  68. Al-Tameemi, M.A.; Chukin, V.V. Global water cycle and solar activity variations. J. Atmos. Solar-Terr. Phys. 2016, 142, 55–59. [Google Scholar] [CrossRef]
  69. Liu, S.; Li, S.G.; Yu, G.R.; Sun, X.M.; Zhang, L.M.; Hu, Z.M. Surface energy exchanges above two grassland ecosystems on the Qinghai-Tibetan Plateau. Biogeosci. Discuss. 2009, 6, 9161–9192. [Google Scholar]
  70. Pokorný, J.; Květ, J.; Rejšková, A.; Brom, J. Wetlands as energy-dissipating systems. J. Ind. Microbiol. Biotechnol. 2010, 37, 1299–1305. [Google Scholar] [CrossRef]
  71. Huryna, H.; Brom, J.; Pokorný, J. The importance of wetlands in the energy balance of an agricultural landscape. Wetl. Ecol. Manag. 2014, 22, 363–381. [Google Scholar] [CrossRef]
  72. Melesse, A.M.; Frank, A.; Nangia, V.; Hanson, J. Analysis of energy fluxes and land surface parameters in a grassland ecosystem: A remote sensing perspective. Int. J. Remote Sens. 2008, 29, 3325–3341. [Google Scholar] [CrossRef]
  73. Kayumba, P.M.; Chen, Y.; Mind’Je, R.; Mindje, M.; Li, X.; Maniraho, A.P.; Umugwaneza, A.; Uwamahoro, S. Geospatial land surface-based thermal scenarios for wetland ecological risk assessment and its landscape dynamics simulation in Bayanbulak Wetland, Northwestern China. Landsc. Ecol. 2021, 36, 1699–1723. [Google Scholar] [CrossRef]
  74. Yamazaki, T.; Yabuki, H.; Ishii, Y.; Ohta, T.; Ohata, T. Water and Energy Exchanges at Forests and a Grassland in Eastern Siberia Evaluated Using a One-Dimensional Land Surface Model. J. Hydrometeorol. 2004, 5, 504–515. [Google Scholar] [CrossRef]
  75. Krinner, G. Impact of lakes and wetlands on boreal climate. J. Geophys. Res. Space Phys. 2003, 108. [Google Scholar] [CrossRef]
  76. Mohamed, Y.; Bastiaanssen, W.; Savenije, H.; Hurk, B.V.D.; Finlayson, C. Wetland versus open water evaporation: An analysis and literature review. Phys. Chem. Earth 2012, 47–48, 114–121. [Google Scholar] [CrossRef]
  77. Sun, Z.; Wei, B.; Su, W.; Shen, W.; Wang, C.; You, D.; Liu, Z. Evapotranspiration estimation based on the SEBAL model in the Nansi Lake Wetland of China. Math. Comput. Model. 2011, 54, 1086–1092. [Google Scholar] [CrossRef]
  78. Liljedahl, A.K.; Hinzman, L.D.; Harazono, Y.; Zona, D.; Tweedie, C.E.; Hollister, R.D.; Engstrom, R.; Oechel, W.C. Nonlinear controls on evapotranspiration in arctic coastal wetlands. Biogeosciences 2011, 8, 3375–3389. [Google Scholar] [CrossRef] [Green Version]
  79. Li, H. Water Resources Management for Sustainable Development in the Yanqi Basin, Xinjiang, China. Ph.D. Thesis, ETH Zürich, Zürich, Switzerland, 2009. [Google Scholar]
  80. Wang, H.; Li, X.; Xiao, J.; Ma, M. Evapotranspiration components and water use efficiency from desert to alpine ecosystems in drylands. Agric. For. Meteorol. 2021, 298–299, 108283. [Google Scholar] [CrossRef]
  81. Dodgen, L.K.; Ueda, A.; Wu, X.; Parker, D.R.; Gan, J. Effect of transpiration on plant accumulation and translocation of PPCP/EDCs. Environ. Pollut. 2015, 198, 144–153. [Google Scholar] [CrossRef] [Green Version]
  82. Cha, M.; Li, M.; Wang, X. Estimation of Seasonal Evapotranspiration for Crops in Arid Regions Using Multisource Remote Sensing Images. Remote Sens. 2020, 12, 2398. [Google Scholar] [CrossRef]
  83. Burba, G.; Verma, S.; Kim, J. Surface energy fluxes of Phragmites australis in a prairie wetland. Agric. For. Meteorol. 1999, 94, 31–51. [Google Scholar] [CrossRef]
  84. Micklin, P.; Aladin, N.V.; Plotnikov, I. Aral Sea; Springer: Berlin/Heidelberg, Germany, 2016. [Google Scholar]
  85. Li, L.; Luo, G.; Chen, X.; Li, Y.; Xu, G.; Xu, H.; Bai, J. Modelling evapotranspiration in a Central Asian desert ecosystem. Ecol. Model. 2011, 222, 3680–3691. [Google Scholar] [CrossRef]
  86. Brunner, P.; Kinzelbach, W.; Li, W.P.; Dong, X.G. Sustainable irrigation in the Yanqi basin, China. Sustain. Irrig. Manag. Technol. Policies 2006, 96, 115–125. [Google Scholar] [CrossRef] [Green Version]
  87. Hemakumara, H.; Chandrapala, L.; Moene, A.F. Evapotranspiration fluxes over mixed vegetation areas measured from large aperture scintillometer. Agric. Water Manag. 2003, 58, 109–122. [Google Scholar] [CrossRef]
  88. Li, B.F.; Chen, Y.N.; Li, W.H.; Cao, Z.C. Remote sensing and the SEBAL model for estimating evapotranspiration in the Tarim River. Acta Geogr. Sin. 2011, 66, 1230–1238. [Google Scholar]
  89. Li, X.; Yang, L.; Xu, X.; Tian, W.; He, C. Analysis of evapotranspiration pattern by SEBAL model during the growing season in the agro-pastoral ecotone in Northwest China. Acta Ecol. Sin. 2020, 40, 2175–2185. [Google Scholar]
Figure 1. Location of Yanqi ecosystem in the large Bosten Lake Basin, China. The map is from Chinese Standard Map (http://bzdt.ch.mnr.gov.cn/, GS (2019)1652).
Remotesensing 13 03764 g001
Figure 2. Meteorological condition during the study time satellite overpass in the study area (Xinjiang, local time).
Remotesensing 13 03764 g002
Figure 3. Flow chart of the net surface radiation computation.
Remotesensing 13 03764 g003
Figure 4. Model performance prototype of bivariate scatter plots, and histograms showing anchor pixels selection through NDVI, Ts (cold-dry), and surface albedo.
Remotesensing 13 03764 g004
Figure 5. Spatial mean variation of surface energy components across Yanqi basin during the summer season (Rn: Net Radiation, G: Ground heat fluxes, H: Sensible heat flux, and LE: Latent heat flux).
Remotesensing 13 03764 g005
Figure 6. SEBAL-derived available energy distribution across the Yanqi land use types during the understudied period. On each boxplot, the central mark represents the median, while the upper and lower edge determines the first and the third quartiles, respectively. Lately, the whiskers extend to a minimum up to a maximum value.
Remotesensing 13 03764 g006
Figure 7. Magnitude variation of Yanqi vegetated canopy density (NDVI) related with available energy under the studied period.
Remotesensing 13 03764 g007
Figure 8. Near-surface energy components proportion over Yanqi basin where: (a) The partition of main near-surface energies for LE of evapotranspiration during summertime (Rn, G, and H); (b) Dissipation of net radiation amongst latent heat flux of evapotranspiration (LE/Rn) during the understudied period (DOY), (c) Evaporative fraction displaying the ratio between the latent heat flux and the available energy.
Remotesensing 13 03764 g008
Figure 9. Spatial distribution of SEBAL derived daily ET a across Yanqi basin.
Remotesensing 13 03764 g009
Figure 10. Summer season daily mean ETa over Yanqi land cover canopy.
Remotesensing 13 03764 g010
Figure 11. Trends of daily ETa across every single land-use type. (The red dotted line indicates the 3rd order polynomial trend).
Remotesensing 13 03764 g011
Figure 12. Monthly and season spatial distribution of SEBAL derived ETa variability across the Yanqi basin.
Remotesensing 13 03764 g012
Figure 13. Nexus between available energy and ETa over Yanqi during the summer season 2019, Day of the Year (DOY). (The black dotted line indicates a reasonable agreement based on the fitting linear model while the orange dots represent the evapotranspiration-ETa and green representing the available energy Rn-G).
Remotesensing 13 03764 g013
Figure 14. The trend of mean ETa estimates of vegetated patches against the average latent heat of evapotranspiration over time. (The black dotted line shows the peak of summer warmth, while the dotted red line represents the polynomial trend of LET).
Remotesensing 13 03764 g014
Table 1. Satellite products and ground-based observation datasets used in the study.
DatasetsAcquisition DateOverpass Time (GMT)Local Time (UTM+6:00)Footprint
Satellite
- Landsat 8 imageries (16 days revisit time)
10 June 201904:56:31.2145410Z10:56:31Path-143
Row-031
12 July 2019 04:56:39.9086680Z10:56:39
28 July 2019 04:56:45.1198030Z10:56:45
13 August 2019 04:56:51.0675480Z10:56:51
29 August 2019 04:56:55.0502779Z10:56:55
Meteorological
(Yanqi station-YQ)
- 2 m wind speed data (m s−1)
- Instantaneous reference ET (EToi, mm)
- Daily reference ET (ETo, mm)
- Temperature
June–August 2019 --- Latitude 42.06 °N
- Longitude 86.57 °E
- Altitude 1059 m
Land cover
- MODIS 0.5 degrees (MCD12Q1)
- ESA LCC 300m
Start date: 1 January 2019
End date: 31 December 2019
-Annual operation-
Global multi-resolution terrain elevation data 2010 (GMTED2010)(USGS)
- Digital elevation model 30 arc-seconds
2010---
Table 2. Mean distribution of surface energy fluxes across Yanqi land-use types.
LCLUEnergy Fluxes
( Wm 2 )
DOY
161
DOY
193
DOY
209
DOY
225
DOY
241
Area
(ha)
Water BodiesRn586.3554.4523.9519.7481.7102,897.54
G198.1196.0192.1198.3177.8
H304.6237.4200.3199.4256.7
LET299.5277.9262.2254.0172.8
Oasis CroplandRn589.9553.5524.0516.7483.7197,992.71
G194.2192.6175.9179.193.9
H243.3237.5196.1196.9259.3
LET297.5280.2261.6253.1173.8
T. GrasslandsRn590.8554.5524.7519.8484.354,305.55
G199.7198.6194.5201.4179.4
H245.2237.9199.0199.8257.5
LET298.9283.2261.4253.4172.3
WetlandsRn593.3595.9526.4522.1487.119,590.66
G209.2238.9214.2219.5196.3
H256.8205.5205.4203.9265.5
LET293.6355.1255.2248.0168.2
R. AreasRn590.2553.3522.5515.9481.946,973.07
G193.2193.1186.1189.3171.5
H241.1236.4198.4196.7254.8
LET299.2277.7259.4254.6172.8
C. SurfaceRn585.5553.5524.2518.9482.867,162.32
G188.1193.0118.6180.2118.6
H242.3237.6196.0196.8254.9
LET294.1277.5263.0249.7173.9
Table 3. Overall mean latent heat flux across Yanqi basin during the understudied period.
Latent   Heat   Flux   [ Wm 2 ]
DOY161193209225241
LET405.46394.91356.20348.74301.98
Table 4. Statistics on average of available energy derived from the variance between net radiation (Rn) and ground heat flux parameters(G) over Yanqi land use categories.
SEBAL   Average   Available   Energy   ( Rn - G ,   Wm 2 )
DOYWater BodiesOasis CroplandT. GrasslandWetlandsResidentialC. Surface
161430.9485.6561.6538.0456.0416.2
193486.3476.3512.9502.0431.0387.4
209484.5439.2528.1511.7379.4299.0
225437.4420.4493.3486.4371.2299.2
241443.8394.5447.4460.7362.4304.2
Table 5. Comparison of high-resolution SEBAL derived daily ETa (mm d 1 ) and observed ETa estimates at Yanqi station.
DOYSEBAL-ETaObserved Δ ETa RMSE-YanqiMSA-Yanqi
1615.75.60.10.6 mm/d0.48 mm/d
1935.25.20.0
2095.46.2−0.8
2255.15.9−0.8
2414.14.8−0.7
Publisher’s Note: MDPI stays neutral with regard to jurisdictional claims in published maps and institutional affiliations.

