
Evaluating the Applicability of Thermal Infrared Remote Sensing in Estimating Water Potential of the Karst Aquifer: A Case Study in North Adriatic, Croatia


Abstract
:1. Introduction
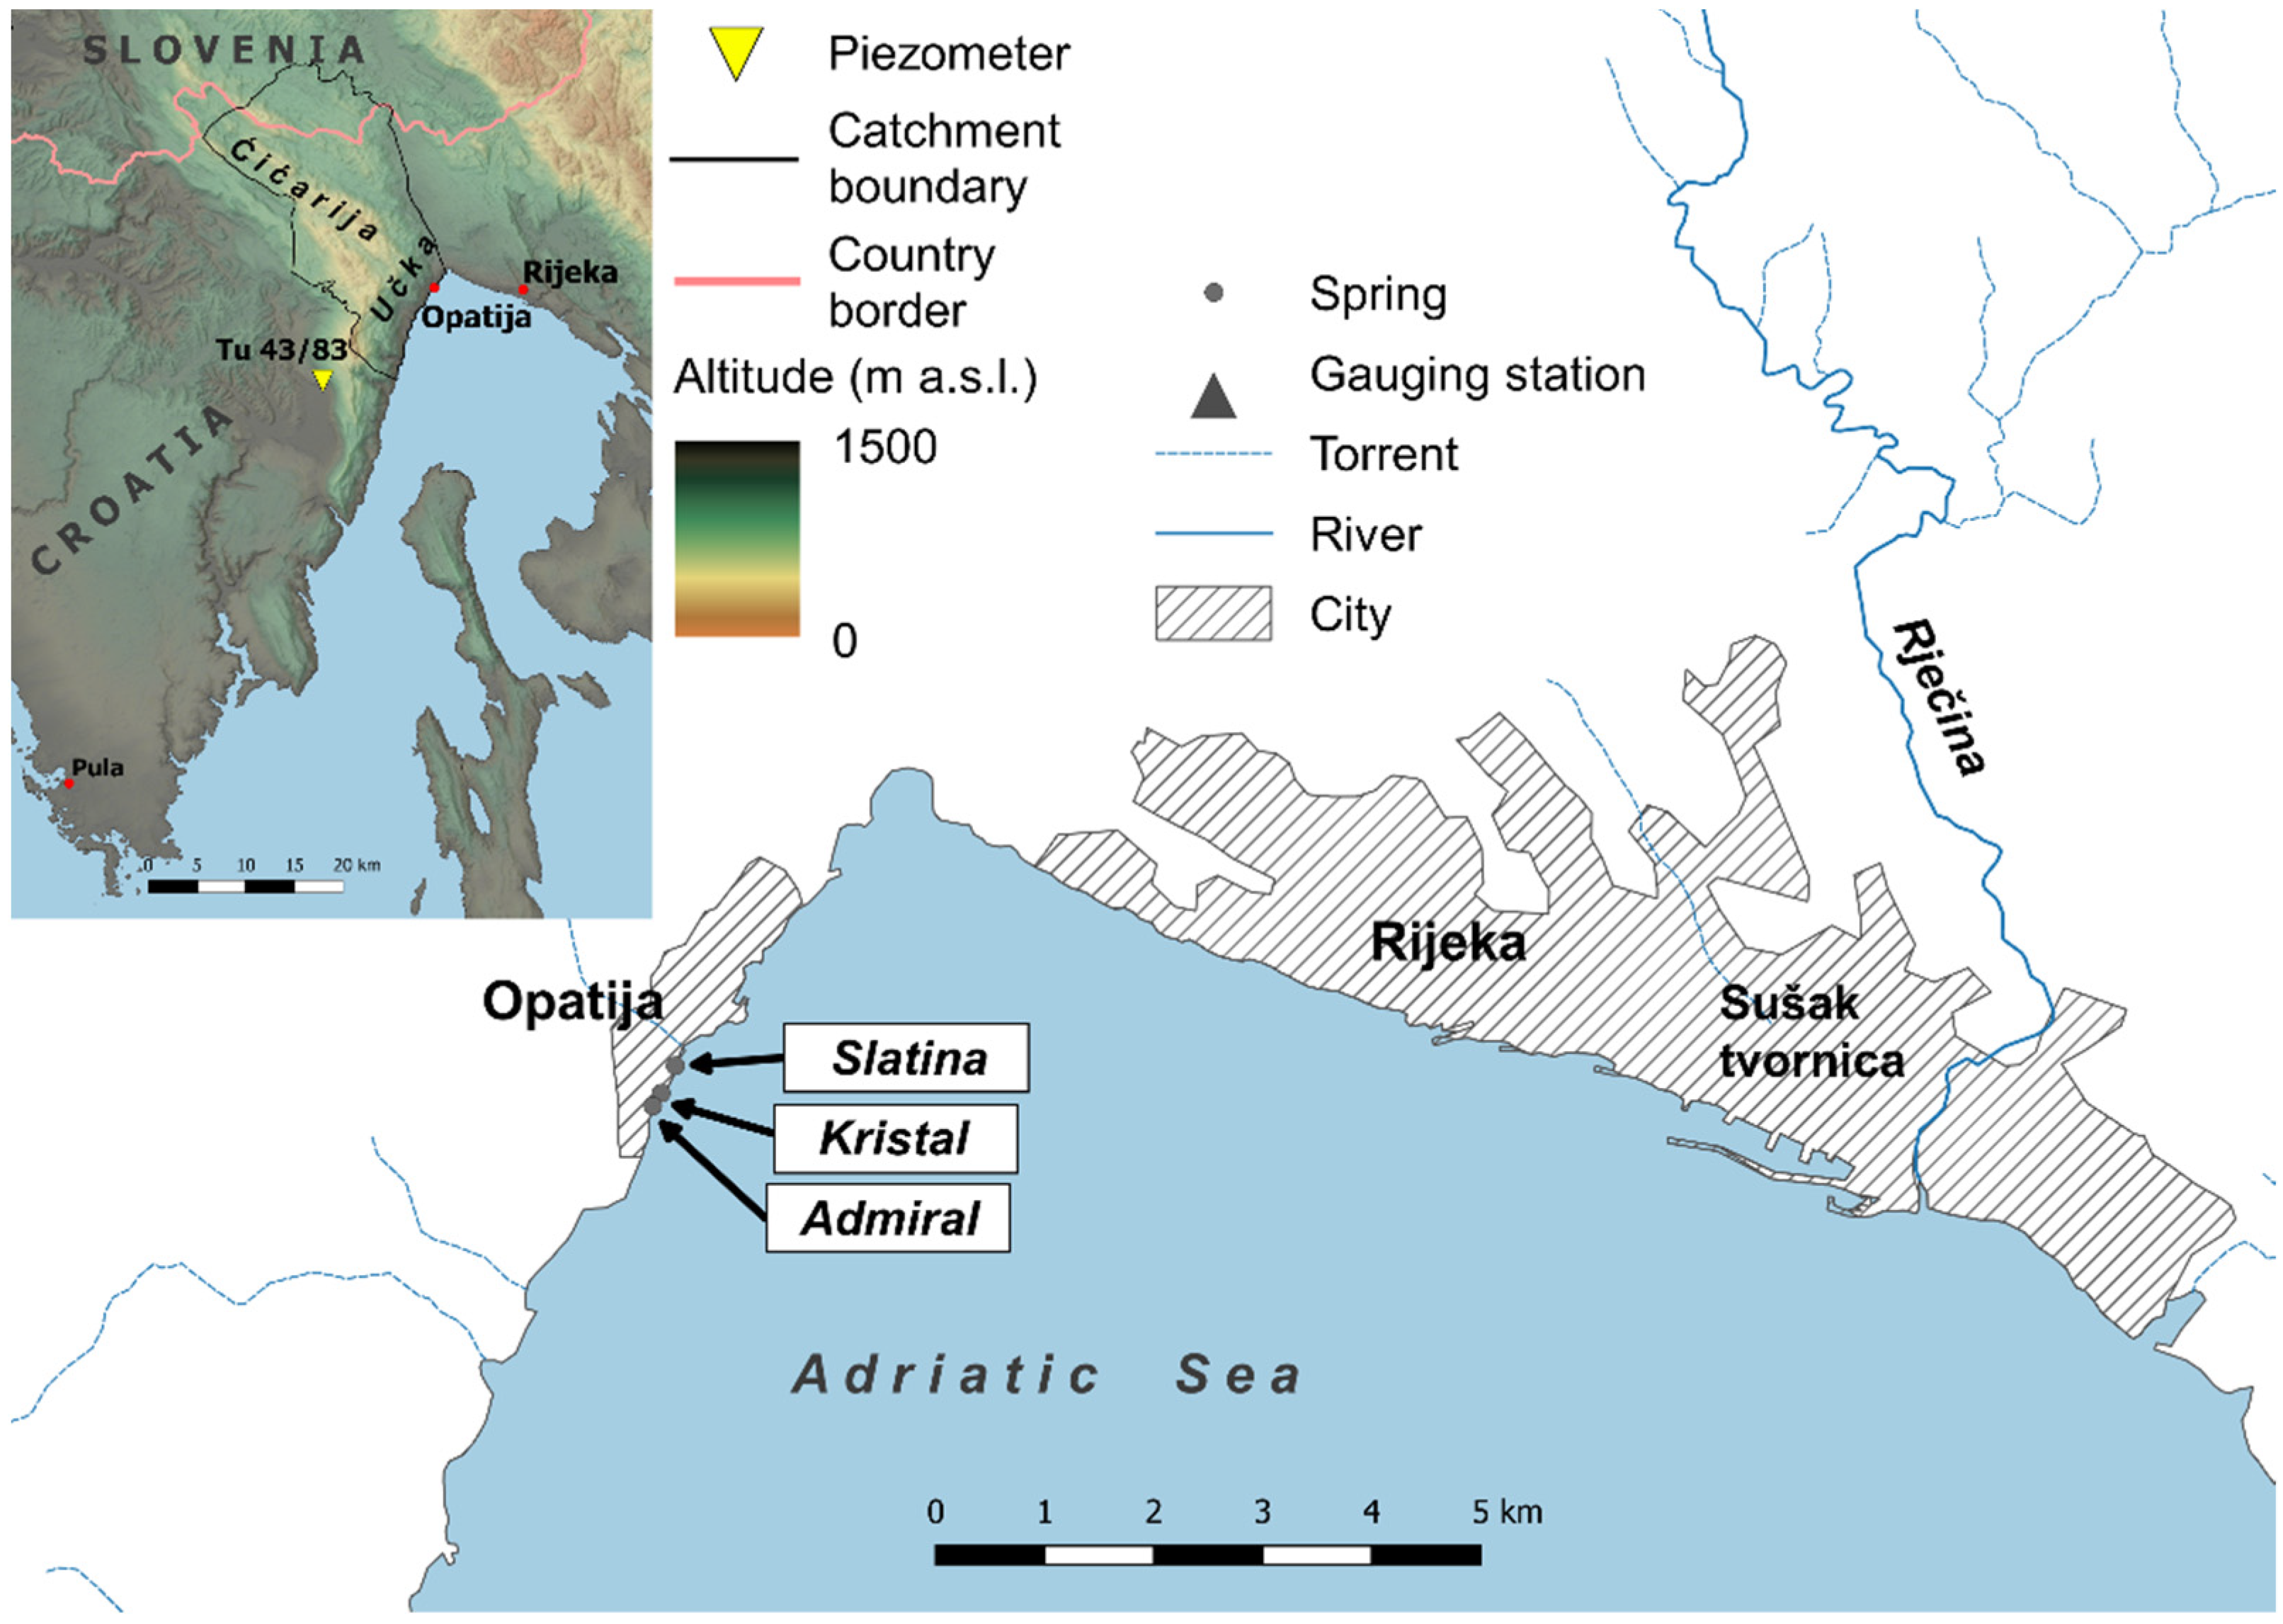
Research Area and Environmental Settings
2. Materials and Methods
2.1. Hydrological Data
2.2. Landsat Images
3. Results
4. Discussion
Limitations of the Proposed Method
5. Conclusions
Author Contributions
Funding
Institutional Review Board Statement
Informed Consent Statement
Data Availability Statement
Conflicts of Interest
References
- Smith, K.; Ward, R. Floods: Physical Processes and Human Impacts; J. Wiley: Chichester, UK, 1998. [Google Scholar]
- Centre for Research on the Epidemiology and Disasters (CRED). EM-DAT: The OFDA/CRED International Disaster Database; CRED: Brussels, Belgium, 2002. [Google Scholar]
- Bolle, H.J. (Ed.) Mediterranean Climate: Variability and Trends; Springer: Heildeberg, Germany, 2003. [Google Scholar]
- Wilhite, D.A. (Ed.) Drought and Water Crises: Science, Technology and Management Issues; Taylor & Frances: Boca Raton, FL, USA, 2005. [Google Scholar]
- Taniguchi, M.; Burnett, W.C.; Cable, J.E.; Turner, J.V. Investigation of Submarine Groundwater Discharge. Hydrol. Process. 2002, 16, 2115–2129. [Google Scholar] [CrossRef]
- Burnett, W.C.; Bokuniewicz, H.; Huettel, M.; Moore, W.S.; Taniguchi, M. Groundwater and Pore Water Inputs to the Coastal Zone. Biogeochemistry 2003, 66, 3–33. [Google Scholar] [CrossRef]
- Burnett, W.C.; Aggarwal, P.K.; Aureli, A.; Bokuniewicz, H.; Cable, J.E.; Charette, M.A.; Kontar, E.; Krupa, S.; Kulkarni, K.M.; Loveless, A.; et al. Quantifying Submarine Groundwater Discharge in the Coastal Zone via Multiple Methods. Sci. Total Environ. 2006, 367, 498–543. [Google Scholar] [CrossRef] [PubMed]
- Fleury, P.; Bakalowicz, M.; de Marsily, G. Submarine Springs and Coastal Karst Aquifers: A Review. J. Hydrol. 2007, 339, 79–92. [Google Scholar] [CrossRef]
- Moosdorf, N.; Oehler, T. Societal Use of Fresh Submarine Groundwater Discharge: An Overlooked Water Resource. Earth-Sci. Rev. 2017, 171, 338–348. [Google Scholar] [CrossRef]
- Bakalowicz, M. Coastal Karst Groundwater in the Mediterranean: A Resource to Be Preferably Exploited Onshore, Not from Karst Submarine Springs. Geosciences 2018, 8, 258. [Google Scholar] [CrossRef] [Green Version]
- Breznik, M. Storage Reservoirs and Deep Wells in Karst Regions; A. A. Balkema: Rotterdam, The Netherlands; Brookfield, CT, USA, 1998. [Google Scholar]
- Rodellas i Vila, V. Evaluating Submarine Groundwater Discharge to the Mediterranean Sea by Using Radium Isotopes. Doctoral Thesis, Universitat Autònoma de Barcelona, Institut de Ciència i Tecnologia Ambientals, Barcelona, Spain, 2014. [Google Scholar]
- Lee, K. Infrared Exploration for Shoreline Springs at Mono Lake, California, Test Site. In Proceedings of the 6th International Symposium on Remote Sensing of Environment, Ann Arbor, MI, USA, 13–16 October 1969; pp. 1075–1100. [Google Scholar]
- Roxburgh, I.S. Thermal Infrared Detection of Submarine Springs Associated with the Plymouth Limestone. Hydrol. Sci. J. 1985, 30, 185–196. [Google Scholar] [CrossRef] [Green Version]
- Miller, D.C.; Ullman, W.J. Ecological Consequence of Ground Water Discharge to Delaware Bay, United States. Ground Water 2004, 42, 959–970. [Google Scholar] [CrossRef]
- Johnson, A.G. Groundwater Discharge from the Leeward Half of the Big Island, Hawaii. Master’s Thesis, University of Hawaii, Honolulu, HI, USA, 2008. [Google Scholar]
- Kelly, J.L.; Glenn, C.R.; Lucey, P.G. High-Resolution Aerial Infrared Mapping of Groundwater Discharge to the Coastal Ocean. Limnol. Oceanogr. Methods 2013, 11, 262–277. [Google Scholar] [CrossRef]
- UNESCO. Submarine Groundwater Discharge—Management Implications, Measurement, and Effects; UNESCO: Paris, France, 2004. [Google Scholar]
- Wilson, J.; Rocha, C. Regional Scale Assessment of Submarine Groundwater Discharge in Ireland Combining Medium Resolution Satellite Imagery and Geochemical Tracing Techniques. Remote Sens. Environ. 2012, 119, 21–34. [Google Scholar] [CrossRef]
- Gajić-Čapka, M.; Patarčić, M.; Perčec Tadić, M.; Srnec, L.; Zaninović, K. Digitalna Godišnja Oborinska Karta Hrvatske (Engl. Digital Annual Rainfall Map of Croatia). II Hrvatski Meteorološki Časopis 2003, 38, 21–34. [Google Scholar]
- Gajić-Čapka, M.; Patarčić, M.; Perčec Tadić, M.; Srnec, L.; Zaninović, K. Prostorna Raspodjela Srednje Godišnje Temperature Zraka i Količine Oborina u Hrvatskoj (Engl. Spatial Distribution of Average Annual Air Temperature and Rainfall in Croatia). In Croatian Waters in the 21st Century, Proceedings of the 3rd Croatian Conference on Water, Osijek, Croatia, 28–31 May 2003; Gereš, D., Ed.; Hrvatske Vode: Zagreb, Croatia, 2003; pp. 75–81. [Google Scholar]
- Kuhta, M.; Matičec, D.; Stroj, A. Vodoistražni Radovi Na Izvorištu Kristal u Opatiji, Izvješće Druge Faze Istraživanja (Engl. Water Research of the Kristal Spring in Opatija, a Second Phase Report); Croatian Geological Survey: Zagreb, Croatia, 2005. [Google Scholar]
- Bonacci, O.; Oštrić, M.; Roje-Bonacci, T. Prilog Hidrologiji Krškog Izbora Rječine (Engl. A Contribution to the Rječina Karst Spring Hydrology). Hrvat. Vode 2017, 25, 99–108. [Google Scholar]
- Božičević, S. Morphology of the Rječina Sping Water Channels. Geološki Vjesnik 1974, 27, 273–281. [Google Scholar]
- Ožanić, N.; Rubinić, J. Problemi Praćenja Stanja i Gospodarenja Vodnim Resursima Na Primjeru Sliva Rječina (Engl. Problems in Monitoring of the Conditions and Water Resources Management as Exemplified by the River Rječina). Hrvat. Vodoprivr. 1996, 50, 41–45. [Google Scholar]
- Munda, B.; Trutin, M.; Pribeg, D. Novelacija Granica Zaštitnih Zona Vodocrpilišta Riječkog Vodoopskrbnog Sustava (Engl. Amendment of the Boundaries of the Protection Zones of Water Supply System in the City of Rijeka); GeoAqua: Zagreb, Croatia, 2009. [Google Scholar]
- U. S. Geological Survey (USGS). Data User’s Handbook. LSDS-1927, Version 2.0; USGS: Sioux Falls, SD, USA, 2019.
- Fischer, H.; List, J.; Koh, C.; Imberger, J.; Brooks, N. Mixing in Inland and Coastal Waters; Academic Press: London, UK, 1980. [Google Scholar]
- Bonham-Carter, G.F. Geographic Information Systems for Geoscientists: Modelling with GIS; Pergamon: New York, NY, USA, 1994. [Google Scholar]
- Kainz, W. Fuzzy Logic and GIS; Department of Geography and Regional Research, University of Vienna: Vienna, Austria, 2002. [Google Scholar]
- Horvat, B.; Rubinić, J. Annual Runoff Estimation—An Example of Karstic Aquifers in the Transboundary Region of Croatia and Slovenia. Hydrol. Sci. J. 2006, 51, 314–324. [Google Scholar] [CrossRef]
- Žugaj, R. Regionalna Hidrološka Analiza u Kršu Hrvatske (Engl. Regional Hydrologic Analysis in Croatian Karst); Hrvatsko Hidrološko Društvo: Zagreb, Croatia, 1995. [Google Scholar]
- Soulios, G. Effective Infiltration into Greek Karst. J. Hydrol. 1984, 75, 343–356. [Google Scholar] [CrossRef]
- Rubinić, A. Hidrološka Analiza Vodnih Pojava Na Području Parka Prirode Učka s Primjenom GIS Tehnologije (Engl. Hydrological Analysis of the Water Phenomena in Učka Nature Park Using GIS Technology). Bachelor’s Thesis, Faculty of Civil Engineering, University of Rijeka, Rijeka, Croatia, 2004. [Google Scholar]
- Bonacci, O.; Rubinić, J. Water Losses from a Reservoir Built in Karst: The Example of the Boljunčica Reservoir (Istria, Croatia). Environ. Geol. 2009, 58, 339–345. [Google Scholar] [CrossRef]
- Rubinić, J.; Horvat, B.; Kuhta, M.; Stroj, A. Analiza Izdašnosti Priobalnih Izvora Na Području Opatije Korištenjem Termalnih Infracrvenih Satelitskih Snimaka (Engl. Abundance Analyses of the Coastal Springs Abundance in the Opatija Region Using Thermal Infrared Satellite Imagery). In Croatian Water and European Union—Challenges and Possibilities, Proceedings of the 4th Croatian Conference on Water, Opatija, Croatia, 17–19 May 2007; Gereš, D., Ed.; Hrvatske Vode: Zagreb, Croatia, 2007; pp. 211–216. [Google Scholar]


| Parameter | Unit | Time Period 1961–2002 | Characteristic Year | ||
|---|---|---|---|---|---|
| 1994 (Very Dry) | 1995 (Average) | 1998 (Dry) | |||
| PAVG1 | mm | 1790 | 1360 | 1842 | 1573 |
| TAVG2 | °C | 9.6 | 10.6 | 9.5 | 10.0 |
| qAVG3 | l s−1 km−2 | 33.2 | 19.6 | 35.1 | 26.1 |
| QAVG4 | m3 s−1 | 12.7 | 7.5 | 13.4 | 10.0 |
| CO5 | - | 0.56 | 0.45 | 0.60 | 0.52 |
| Sensor | Spatial Resolution of the TIR 1 Band (m) | Date of Acquisition |
|---|---|---|
| Landsat ETM+ | 60 | 7 August 1999 |
| 15 September 1999 | ||
| 22 June 2000 | ||
| 16 August 2000 | ||
| 10 September 2000 | ||
| 11 July 2001 | ||
| 12 August 2001 | ||
| 12 June 2002 | ||
| 21 July 2002 | ||
| 27 March 2003 | ||
| Landsat TM | 120 | 27 September 2003 29 September 2004 |
| Date | Kristal | Rječina | ||
|---|---|---|---|---|
| SSTMIN (K) | SSTMAX (K) | SSTMIN (K) | SSTMAX (K) | |
| 7 August 1999 | 296.89 | 300.21 | 294.36 | 300.38 |
| 22 June 2000 | 299.84 | 303.21 | 300.55 | 303.62 |
| 16 August 2000 | 300.42 | 303.91 | 297.66 | 303.62 |
| 11 July 2001 | 296.99 | 299.69 | 294.93 | 299.78 |
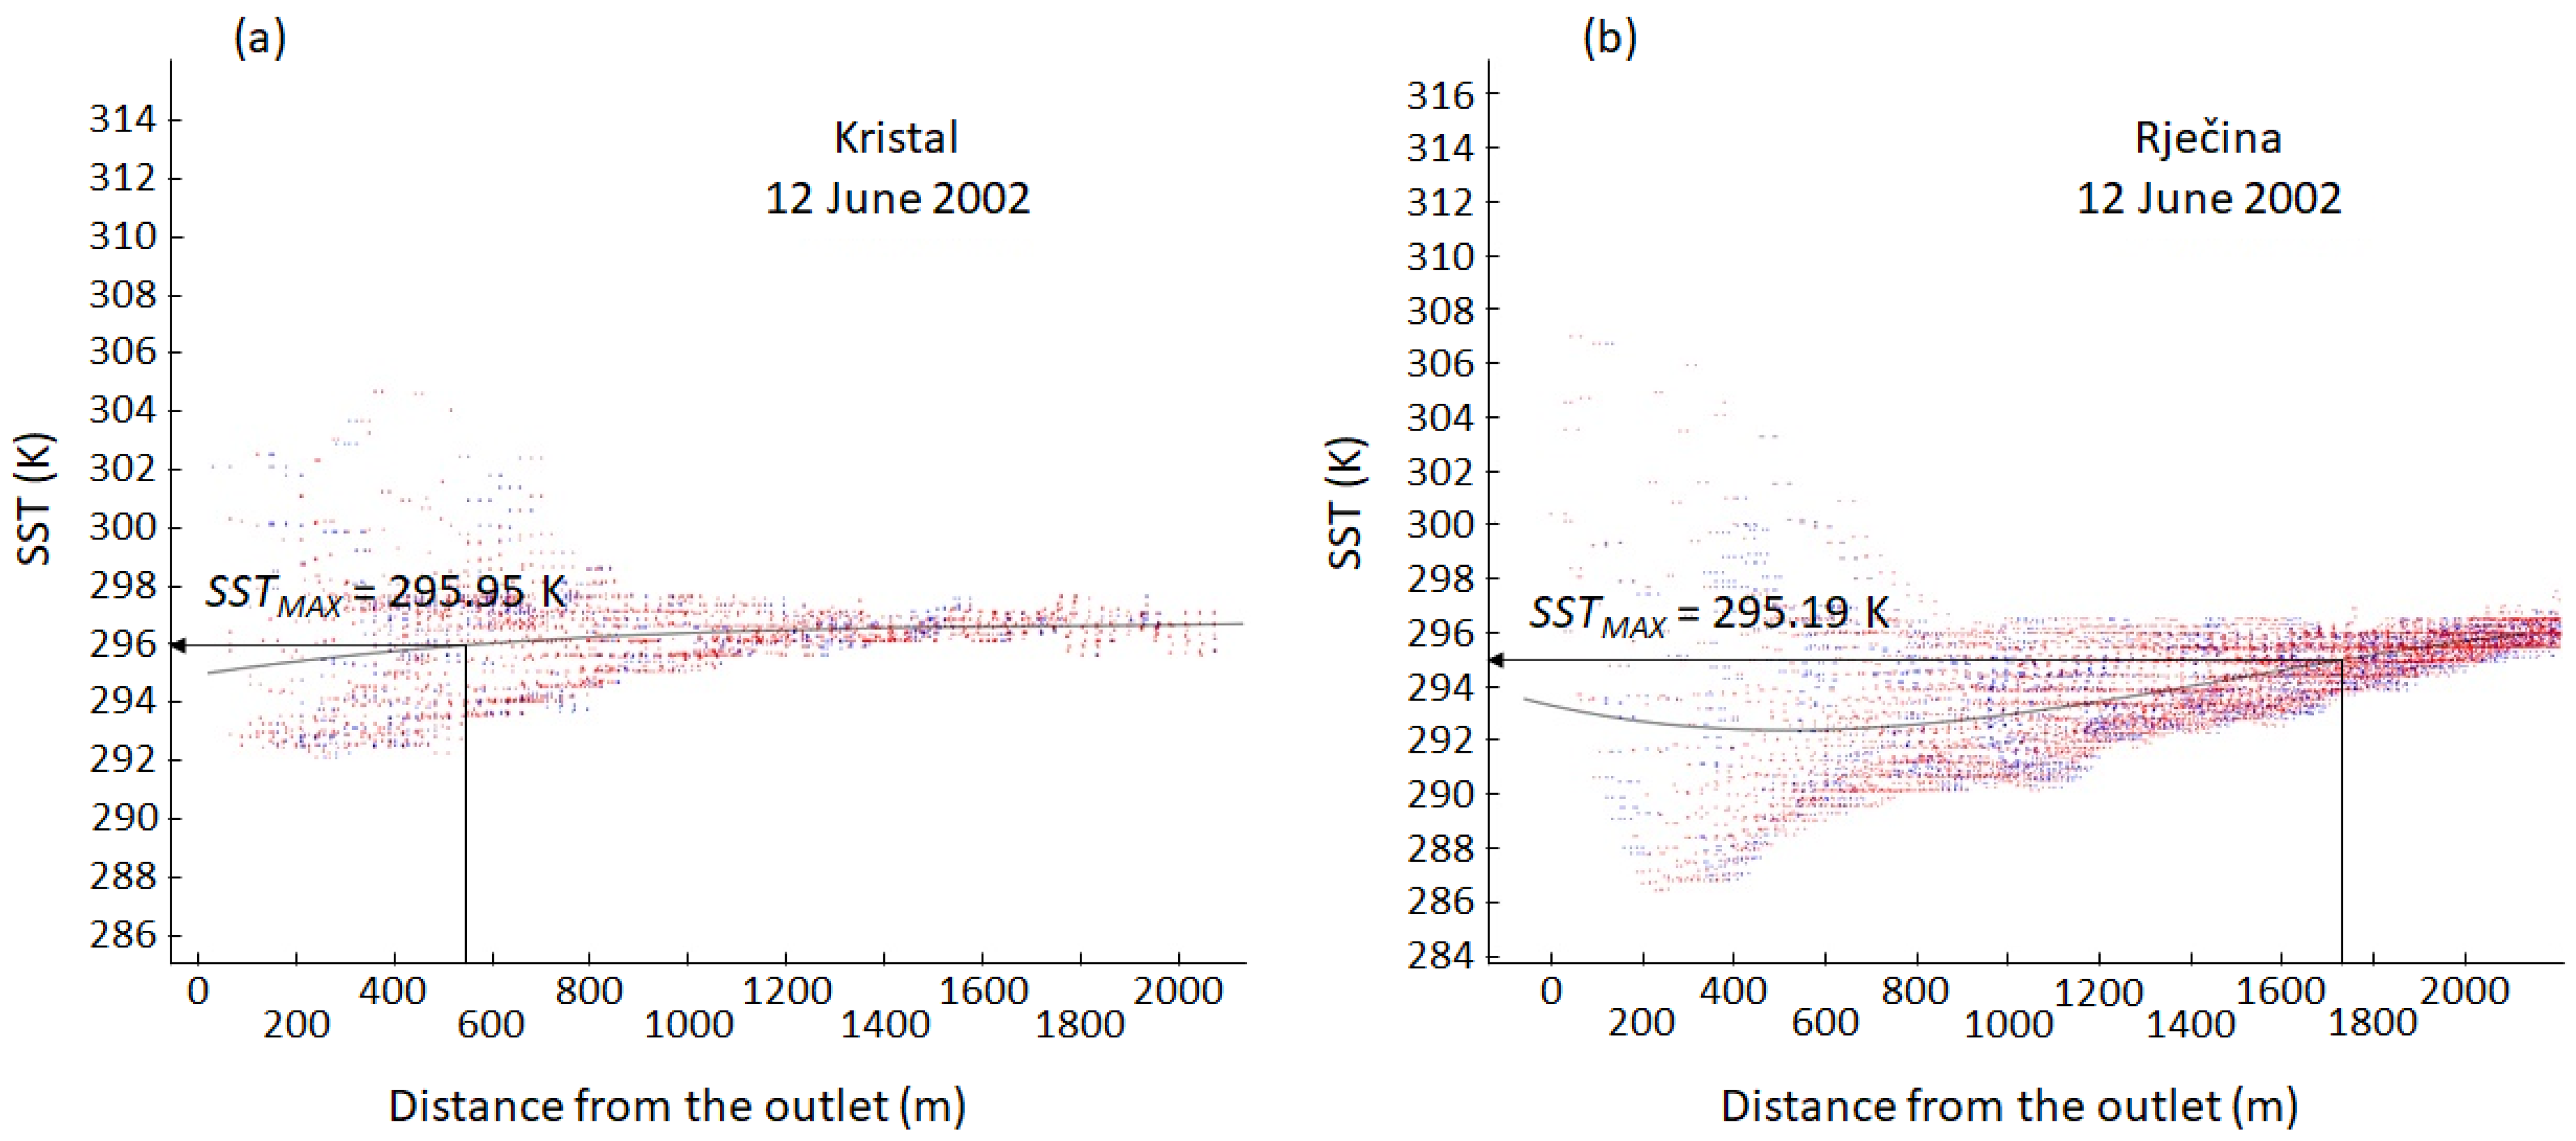
| 12 June 2002 | 292.32 | 295.95 | 287.26 | 295.19 |
| 21 July 2002 | 297.51 | 301.48 | 294.97 | 301.81 |
| 29 September 2004 | 287.32 | 287.45 | 284.49 | 287.60 |
| Date | AADJUSTED (m2) | QR 1 (m3 s−1) | |
|---|---|---|---|
| Kristal | Rječina | ||
| 7 August 1999 | 107,965.47 | 120,552.61 | 1.67 |
| 22 June 2000 | 96,213.25 | 27,471.56 | 0.906 |
| 16 August 2000 | 99,130.35 | 34,245.10 | 1.255 |
| 11 July 2001 | 103,227.04 | 103,168.45 | 1.26 |
| 12 June 2002 | 244,690.78 | 701,582.50 | 14.5 |
| 21 July 2002 | 118,771.01 | 114,240.81 | 4.22 |
| 29 September 2004 | 14,841.23 | 120,793.26 | not available |
| Date | QO 1 (m3 s−1) | H43/83 2 (m) | QM 3 (m3 s−1) |
|---|---|---|---|
| 7 August 1999 | 2.143 | 12.50 | - |
| 22 June 2000 | 2.178 | 11.11 | - |
| 16 August 2000 | 2.236 | 11.28 | - |
| 11 July 2001 | 2.318 | 12.80 | - |
| 12 June 2002 | 5.148 | 19.87 | - |
| 21 July 2002 | 2.629 | 12.50 | - |
| 29 September 2004 | 0.551 | 9.30 | 0.504 |
| Location | Measured Variable | Predicted Variable | RAE1 | RSE2 |
|---|---|---|---|---|
| Rječina | Area of influence | Discharge | 0.22 | 0.04 |
| Kristal | Groundwater level | Area of influence | 0.27 | 0.04 |
Publisher’s Note: MDPI stays neutral with regard to jurisdictional claims in published maps and institutional affiliations. |
© 2021 by the authors. Licensee MDPI, Basel, Switzerland. This article is an open access article distributed under the terms and conditions of the Creative Commons Attribution (CC BY) license (https://creativecommons.org/licenses/by/4.0/).
Share and Cite
Horvat, B.; Rubinić, J. Evaluating the Applicability of Thermal Infrared Remote Sensing in Estimating Water Potential of the Karst Aquifer: A Case Study in North Adriatic, Croatia. Remote Sens. 2021, 13, 3737. https://doi.org/10.3390/rs13183737
Horvat B, Rubinić J. Evaluating the Applicability of Thermal Infrared Remote Sensing in Estimating Water Potential of the Karst Aquifer: A Case Study in North Adriatic, Croatia. Remote Sensing. 2021; 13(18):3737. https://doi.org/10.3390/rs13183737
Chicago/Turabian StyleHorvat, Bojana, and Josip Rubinić. 2021. "Evaluating the Applicability of Thermal Infrared Remote Sensing in Estimating Water Potential of the Karst Aquifer: A Case Study in North Adriatic, Croatia" Remote Sensing 13, no. 18: 3737. https://doi.org/10.3390/rs13183737