Article

Converting Optical Videos to Infrared Videos Using Attention GAN and Its Impact on Target Detection and Classification Performance

1
Department of Electrical and Computer Engineering, Old Dominion University, Norfolk, VA 23625, USA
2
Applied Research LLC, Rockville, MD 20850, USA
*
Author to whom correspondence should be addressed.
Remote Sens. 2021, 13(16), 3257; https://doi.org/10.3390/rs13163257
Submission received: 23 July 2021 / Revised: 14 August 2021 / Accepted: 16 August 2021 / Published: 18 August 2021

Abstract

:
To apply powerful deep-learning-based algorithms for object detection and classification in infrared videos, it is necessary to have more training data in order to build high-performance models. However, in many surveillance applications, one can have a lot more optical videos than infrared videos. This lack of IR video datasets can be mitigated if optical-to-infrared video conversion is possible. In this paper, we present a new approach for converting optical videos to infrared videos using deep learning. The basic idea is to focus on target areas using attention generative adversarial network (attention GAN), which will preserve the fidelity of target areas. The approach does not require paired images. The performance of the proposed attention GAN has been demonstrated using objective and subjective evaluations. Most importantly, the impact of attention GAN has been demonstrated in improved target detection and classification performance using real-infrared videos.

1. Introduction

There are two groups of target detection algorithms for infrared videos. One group contains conventional algorithms that utilize supervised machine-learning algorithms. For instance, there are some conventional target tracking methods [1,2]. The second group of target detection and classification schemes uses deep-learning algorithms such as You Only Look Once (YOLO) for larger objects in short-range optical and infrared videos [3,4,5,6,7,8,9,10,11,12,13,14,15]. Training videos are required in these algorithms. Among those deep-learning algorithms, it is worth mentioning that some of them [3,4] are using compressive measurements directly for target detection and classification. This means that no reconstruction of compressive measurements is needed, and hence, fast target detection and classification can be achieved. The algorithms in [5,6,7,8,9,10,11,12,13,14] require target locations to be known. All of the aforementioned applications require a lot of videos for training.
In practical applications, we may have a lot of optical videos but only a handful of infrared videos. Consequently, the performance of machine-learning algorithms for surveillance and reconnaissance operations is seriously affected. Since optical videos are abundant in the public domain, the objective of this research is to determine if one can convert optical videos to infrared videos so that the performance of the machine-learning algorithms using IR videos for surveillance and reconnaissance can be improved. In particular, we focus on applying recent developments in a generative adversarial network (GAN) for converting optical videos to mid-wave infrared (MWIR) videos. We developed a customized attention GAN, which performed better than state-of-the-art methods [16,17,18]. Moreover, we compared the three GAN-based models using actual Defense Systems Information Analysis Center (DSIAC) videos [19]. We observed that when combining the converted videos with the actual MWIR videos for training, we were able to improve the intersection of the union (IoU) score of the target detection from 40.86% (without augmentation) to 61.2% (with augmentation) for the 2000 m-range videos. In contrast, the classification performance using ResNet was not as good as expected. We believe the root cause is due to the small target size in those videos. To mitigate this target size issue, we investigated the use of super-resolution videos to enhance the resolution of the target areas. We then observed quite significant improvements in ResNet classification performance.
Our contributions are as follows. First, we propose a new attention-based GAN to synthesize infrared videos from optical videos. Our approach does not require paired images. We were able to improve on cycle GAN [16], dual GAN [17], and CUTGAN [18]. Second, using many DSIAC videos, we demonstrated that target detection performance using YOLO can be significantly improved with data augmentation. Third, we demonstrated that the combination of data augmentation and video super-resolution can achieve good target classification performance using ResNet.
Figure 1 shows the overall framework of our work, and our paper is organized as follows. Section 2 summarizes the related work. Section 3 describes our proposed model for optical-to-infrared video conversion. Section 4 summarizes the experimental results of converting optical images to infrared images. Both objective and subjective results are presented. Section 5 includes results where we incorporated the synthetic-infrared videos into the training of target detection and classification deep-learning models. In Section 6, we summarize the target classification results using a combination of video super-resolution and attention GAN. Section 7 includes some discussions on a future research direction. Finally, some remarks are included in Section 8.

2. Related Work

2.1. Image-to-Image Translation Using GANs

Researchers have used GANs to convert image from one domain to another [16,20,21,22,23]. For example, Isola et al. proposed Pix2Pix GAN for image-to-image translation between two domains, but it needs paired datasets for training [20]. After that, several GAN-based models were proposed to mitigate this limitation including disco GAN [23], dual GAN [17], and cycle GAN [16]. Later, the attention mechanism was introduced to GAN for image conversion. In [24], authors used Resnet-18 as a teacher network to train the discriminator of the GAN where the teacher taught the discriminator where to focus on the generated image. In [25], researchers proposed a model with attention GAN for image-to-image translation. SAGAN was introduced in [26], which used the self-attention mechanism for generating fake images.

2.2. Image Conversion between Visible and IR Domains

In the past few years, few researchers have done image translation between the visible and IR domain, including near-infrared (NIR) to visible [27,28,29,30], MWIR to grey-scale [31], LWIR to RGB [32,33], and visible to IR [34]. Some general GAN network such as Pix2Pix GAN [19,33,35] was also customized for RGB to IR image generation and for generating infrared textures from visible images [36]. Moreover, in [37], authors used conditional GAN to generate NIR spectral band from an RGB image where they used paired dataset for this conversion. In addition, cycle GAN [16,38,39,40] was also used for visible-to-IR image translation.

2.3. Video Super-Resolution

Video super-resolution (VSR) aims to enhance video resolution and improve subsequent processing performance. VSR is inherently more challenging than single image super-resolution (SSIR) due to the consideration of harnessing relevant information in temporal domain. Frame concatenation is the vanilla approach to retain temporal information for VSR [41,42]. Kappeler et al. [43] proposed a CNN-based VSR method where they used the handcrafted optical flow method [44] for super-resolution. Later, Liu et al. [45] introduced a temporal aggregation method to address the dynamic motion problem. However, this method still requires concatenation of input frames, which negatively affects global optimization. Recurrent neural networks (RNNs) have already become promising for video captioning [46] and video summarization [47]. Huang et al. [48] utilized bidirectional recurrent CNN for VSR, and further improvement was done by adding a motion compensation module and a convLSTM layer [49]. Sajjadi et al. [50] developed an improved VSR model by using many-to-many RNN, which used the previous high-resolution estimates to improve the estimation for the next frame.

3. Converting Optical Videos to Infrared Videos

3.1. Architecture of the Proposed Model

Our proposed model is based on the architecture of cycle GAN, and Figure 2 shows the architecture of our model for visible-to-IR image conversion. There are two generators (G and F) and two discriminators (DX and DY) in the model. Figure 3 shows the architecture of the generator, which used nine residual blocks along with convolution layers. Figure 4 shows the structure of the discriminator, which is a patch-based discriminator introduced in [51], and we modified it by following [25]. In [24], authors used ResNet-18 [52] as a teacher network to generate attention maps to teach the discriminators where to focus. Inspired by [24], we use ResNet-18 as a teacher network in our model to train the generators where to focus.
There are two types of attention GAN models in the literature for image-to-image translation: self-attention-based GAN model [25,26] and teacher-attention-based GAN model [24]. Self-attention mechanism uses the interactions among inputs to identify where the model should focus to produce output. Teacher-attention methods utilize a well-trained model to generate an attention map to focus. The authors of [24] used the ResNet-18 model trained with the ImageNet dataset to generate an attention map to facilitate medial image augmentation. In our dataset, the objects of interest (different types of military vehicles) are typically very small in images, since the images were taken from a distance. An attention map generated by a self-attention mechanism will be distracted to other unrelated parts in the images. We utilized the well-trained ResNet-18 model and finetuned it with our dataset to classify the different types of military vehicles to force ResNet-18 to focus on the vehicles in the images. Our proposed model then used the finetuned ResNet-18 model as a teacher to generate an attention map for image-to-image translation.

3.2. Objective Function

The proposed model has three loss functions: GAN loss, cycle-consistency loss, and attention loss. In our model, there are two generators, G and F. Given the two domains, visible and IR, let G to map from visible to IR and F to map from IR to visible. x is an image from the visible domain and y is an image from the IR domain. G(x) denotes a generated IR image from visible image, and F(y) represents a generated visible image from IR image. We have two discriminators DX and DY where DX discriminates x from F(y) and DY discriminates y from G(x).
A GAN loss is defined as [21]:
L G A N = L G A N ( G , D Y , x , y ) + L G A N ( F , D X , y , x )
A cycle-consistency loss is defined over F(G(x)) and G(F(y)) as,
L c y c = | | F ( G ( x ) ) x | | 1 + | | G ( F ( y ) ) y | | 1  
In our model, an attention loss is defined between the attention map (generated by ResNet-18) of the input image and the output image of the generator as,
L a t t e n = α | | AM ( x ) AM ( G ( x ) | | 1 + β | | AM ( y ) AM ( F ( y ) ) | | 1
The total loss of our model with hyperparameters α , β , and γ is defined:
T o t a l   L o s s = L G A N + γ L c y c + L a t t e n

4. Performance Evaluation of Attention GAN for Converting Optical Videos to Infrared Videos
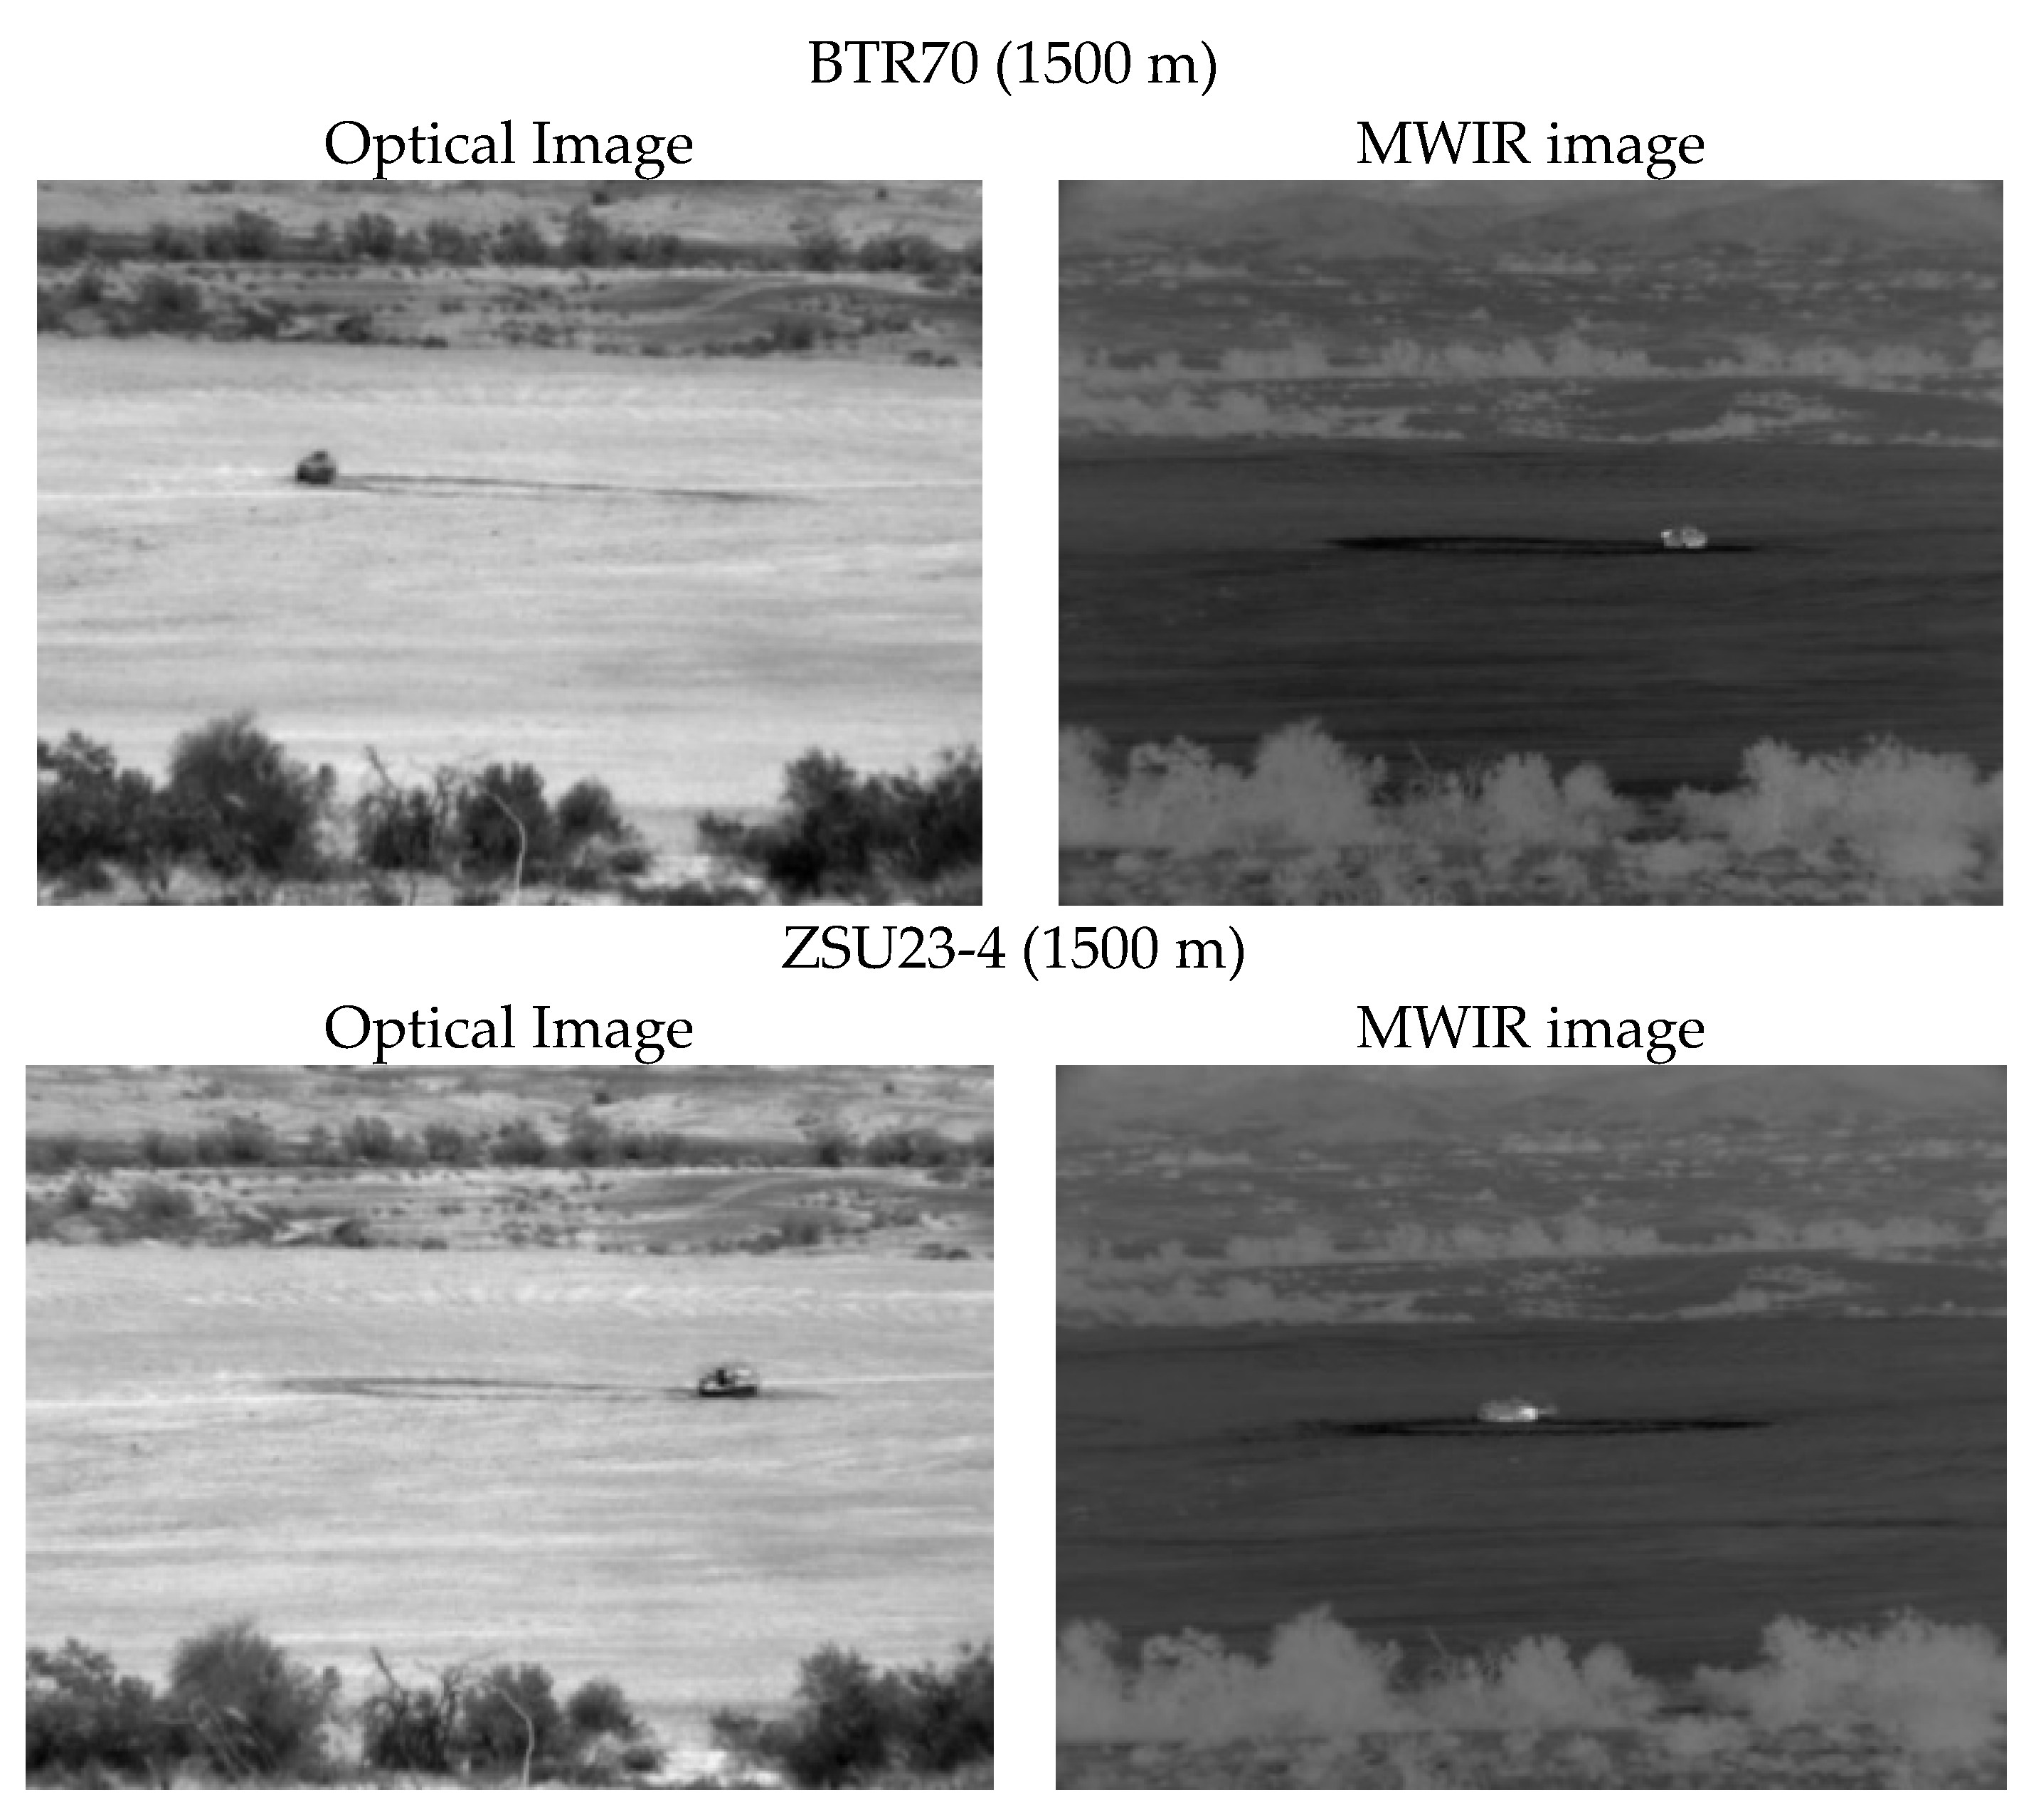
4.1. DSIAC Data

We selected five vehicles in the DSIAC videos for detection and classification. There are optical and mid-wave infrared (MWIR) videos collected at distances ranging from 1000 m to 5000 m with 500 m increments. The five types of vehicles are shown in Figure 5. These videos are challenging for several reasons. First, the target sizes are small due to long distances. This is quite different from some benchmark datasets such as MOT Challenge [53] where the range is short and the targets are big. Second, the target orientations also change drastically. Third, the illuminations in different videos are also different. Fourth, the cameras also move in some videos.
In this research, we focus mostly on MWIR nighttime videos because MWIR is more effective for surveillance during the night.
Here, we briefly highlight the background for optical and MWIR videos. The optical and MWIR videos have very different characteristics. Optical imagers have a wavelength between 0.4 and 0.8 microns, and MWIR imagers have a wavelength range between 3 and 5 microns. Optical cameras require external illuminations whereas MWIR counterparts do not need external illumination sources because MWIR cameras are sensitive to heat radiation from objects. Consequently, target shadows, illumination, and hot air turbulence can affect the target detection performance in optical videos. MWIR imagery is dominated by the thermal component at night, and hence, it is a much better surveillance tool than visible imagers at night. Moreover, atmospheric obscurants cause much less scattering in the MWIR bands than in the optical band. As a result, MWIR cameras are tolerant of heat turbulence, smoke, dust, and fog.
We have considered DSIAC videos for our research to do optical image to MWIR nighttime conversion, detection, and classification. DSIAC dataset has five different types of vehicles including BMP2, BTR70, BRDM2, ZSU23-4, and T72. Optical and MWIR videos were taken at 1000 m, 1500 m, and 2000 m distances. The video frame rate is 7 frames/second. The frame sizes of optical videos and MWIR videos are 640 × 480 and 640 × 512, respectively. The total number of frames is 1875 per optical video. On the other hand, each MWIR video has 1800 frames. Each pixel is represented by 8 bits. Figure 6 and Figure 7 show the frames of the videos in our dataset. Some MWIR videos in Figure 7 are very dark, and it is difficult to visualize the video contents. Later on, we will apply contrast enhancement techniques to enhance the video quality.

4.2. Training

We trained our proposed model with the videos taken from 1500 m distance and applied the trained model to generate MWIR videos from optical videos taken from 1000 m and 2000 m distances. The training was performed with unpaired frames of optical and MWIR videos of BTR70 and ZSU234 at 1500 m. Figure 8 shows some unpaired frames used for training. In total, we have used 3600 unpaired frames for each domain in the training dataset. During training, we randomly cropped 256 × 256 patches, but full images were used during testing. We used a batch size of 1 during training by following [16] and selected 50 as the number of image buffer. The Adam optimizer [54] was used during training. We used Pytorch framework for implementation, and all experiments were conducted on a NVIDIA GPU.

4.3. Evaluation Metrics for Assessing the Conversion Performance

4.3.1. Inception Score (IS)

An inception score (IS) [55] is one of the widely used metrics for evaluating the quality and diversity of images generated by GANs. IS considers the entropy of the probability distribution that is generated by the pre-trained inception v3 model [56] on the generated images. A higher inception score indicates the better quality of the generated images.

4.3.2. Frechet Inception Distance (FID)

Frechet inception distance (FID) [57] was specially developed for evaluating the performance of a GAN. The FID score indicates the similarity between two collections of images. Consistency between FID score and human judgement has made the FID score a good indicator of the generated image’s quality. Statistics of the real and fake images are considered for obtaining the FID score. When calculating FID, the Wasserstein-2 distance between the features of real and synthetic images is calculated. The inception model [56] generates the feature representations of the images for calculating FID. FID performs well in terms of robustness and discriminability. A lower FID score denotes more similarity between the two data distributions.

4.3.3. Kernel Inception Distance (KID)

Similar to FID, Kernel inception distance (KID) [58] also indicates the quality of the generated images of a GAN relative to the real images. The KID score is the maximum mean discrepancy (MMD) between the inception representations of the real and fake images. The inception model is used to obtain those feature representations of the images. KID scores are consistent with human judgements when evaluating the quality of the synthetic images. A lower KID score denotes the high quality of the synthetic images generated by GAN.

4.4. Conversion Results

4.4.1. Attention Maps

Figure 9 shows two representative attention maps generated by the teacher network (ResNet-18) during training of our attention GAN. It can be seen that the corresponding vehicle areas in the attention maps are brighter than other areas. This means that more emphasis will be placed in the vehicle areas during the training process. Consequently, the attention GAN will generate more accurate results near the vehicle areas than cycle GAN.

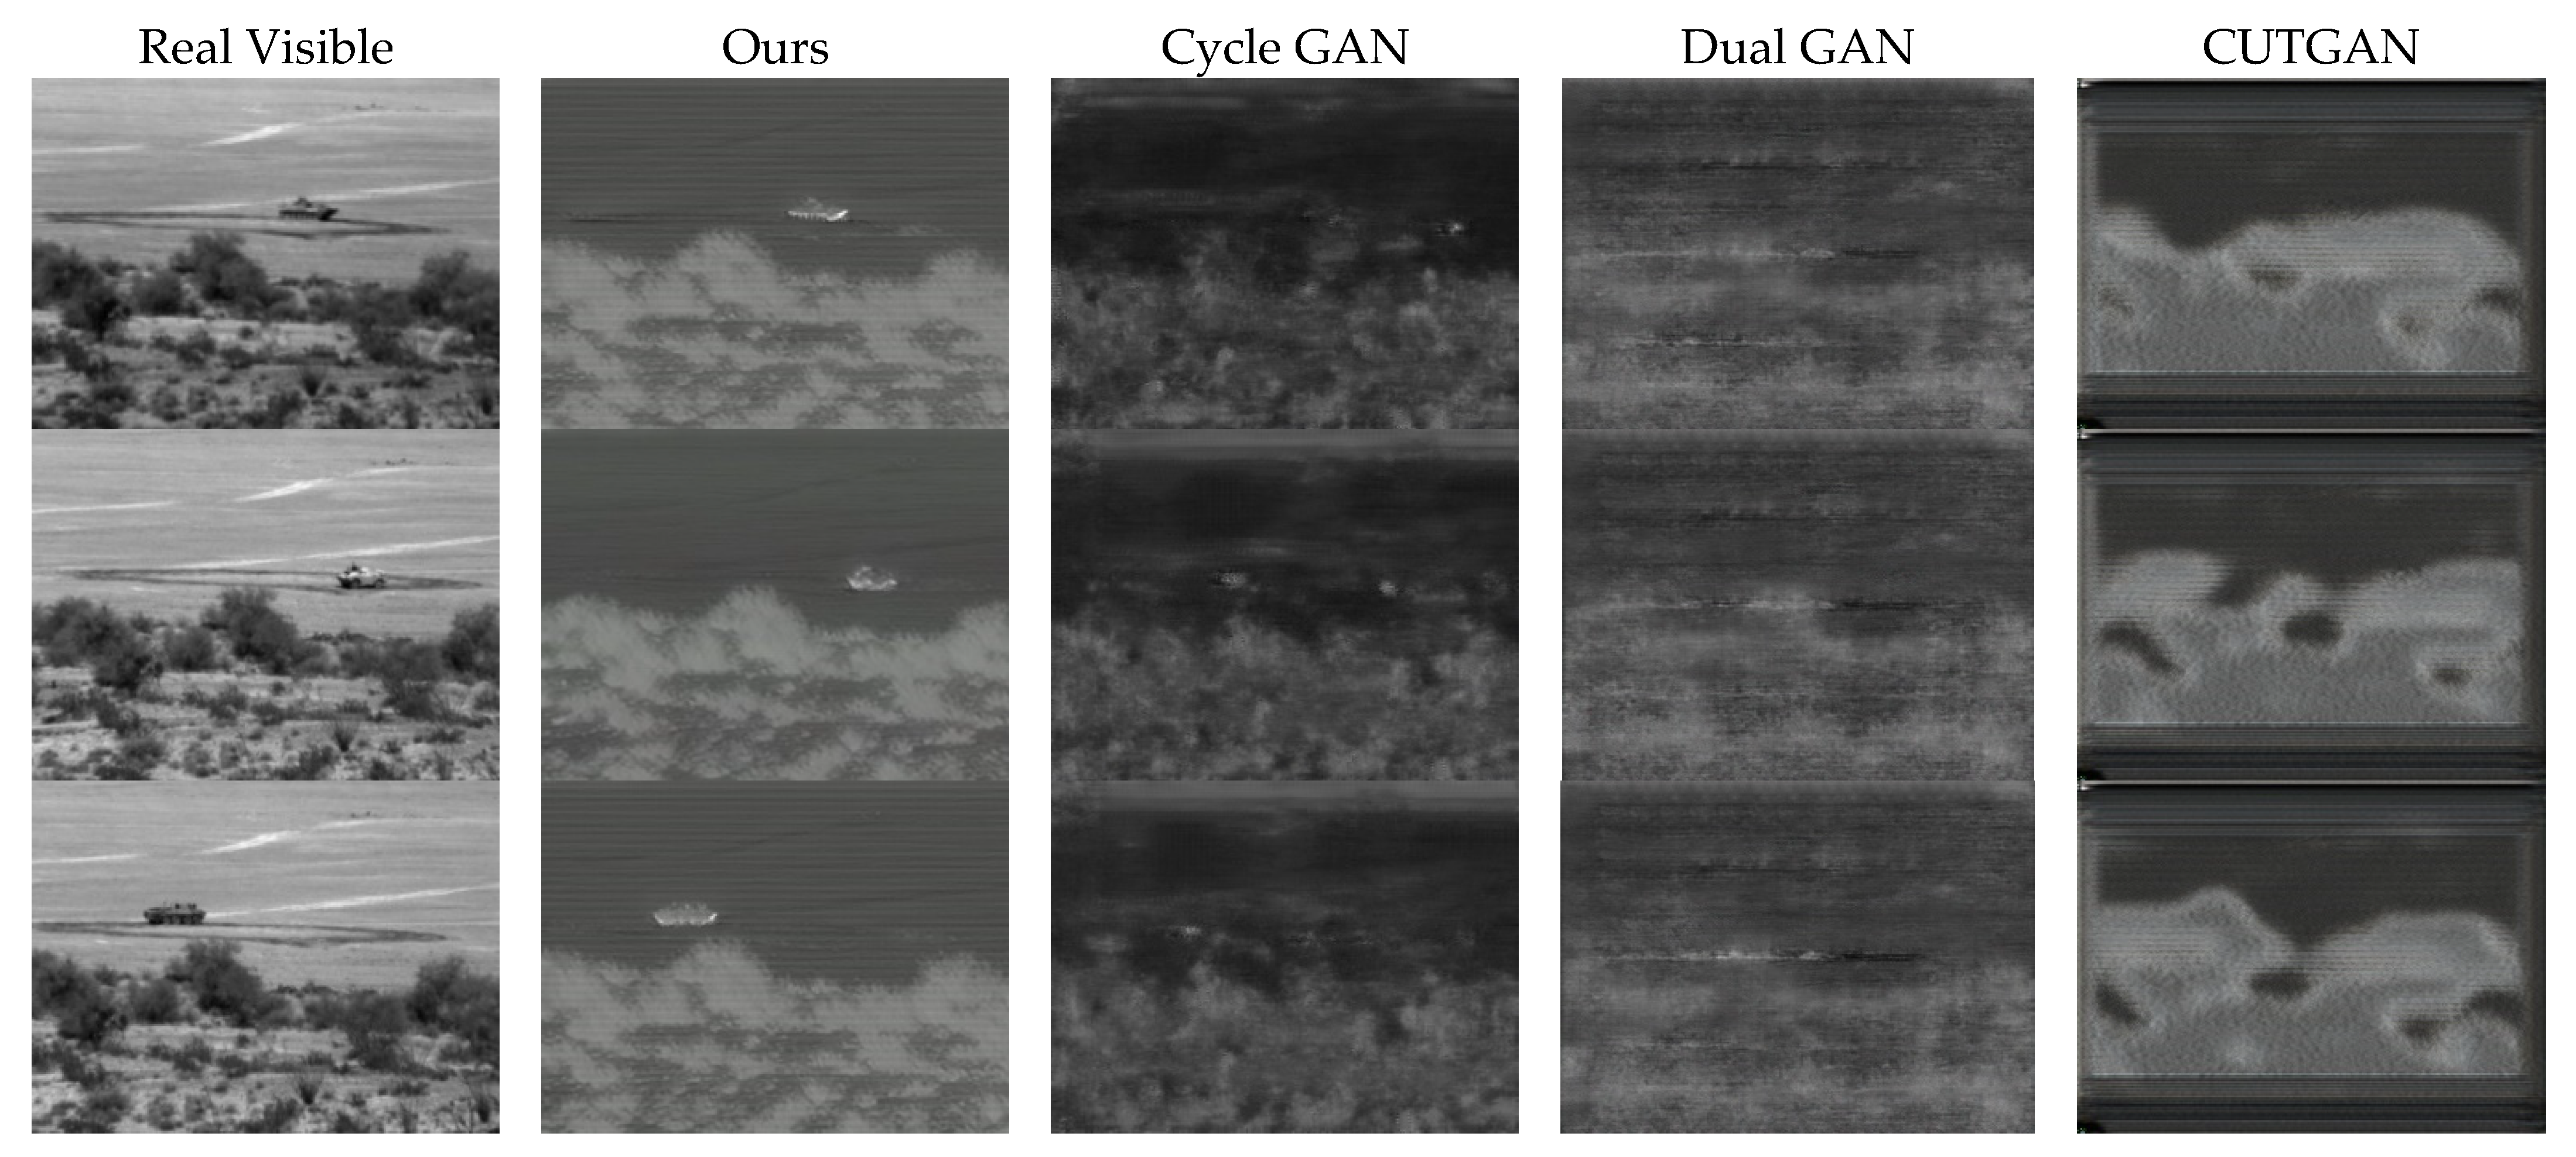
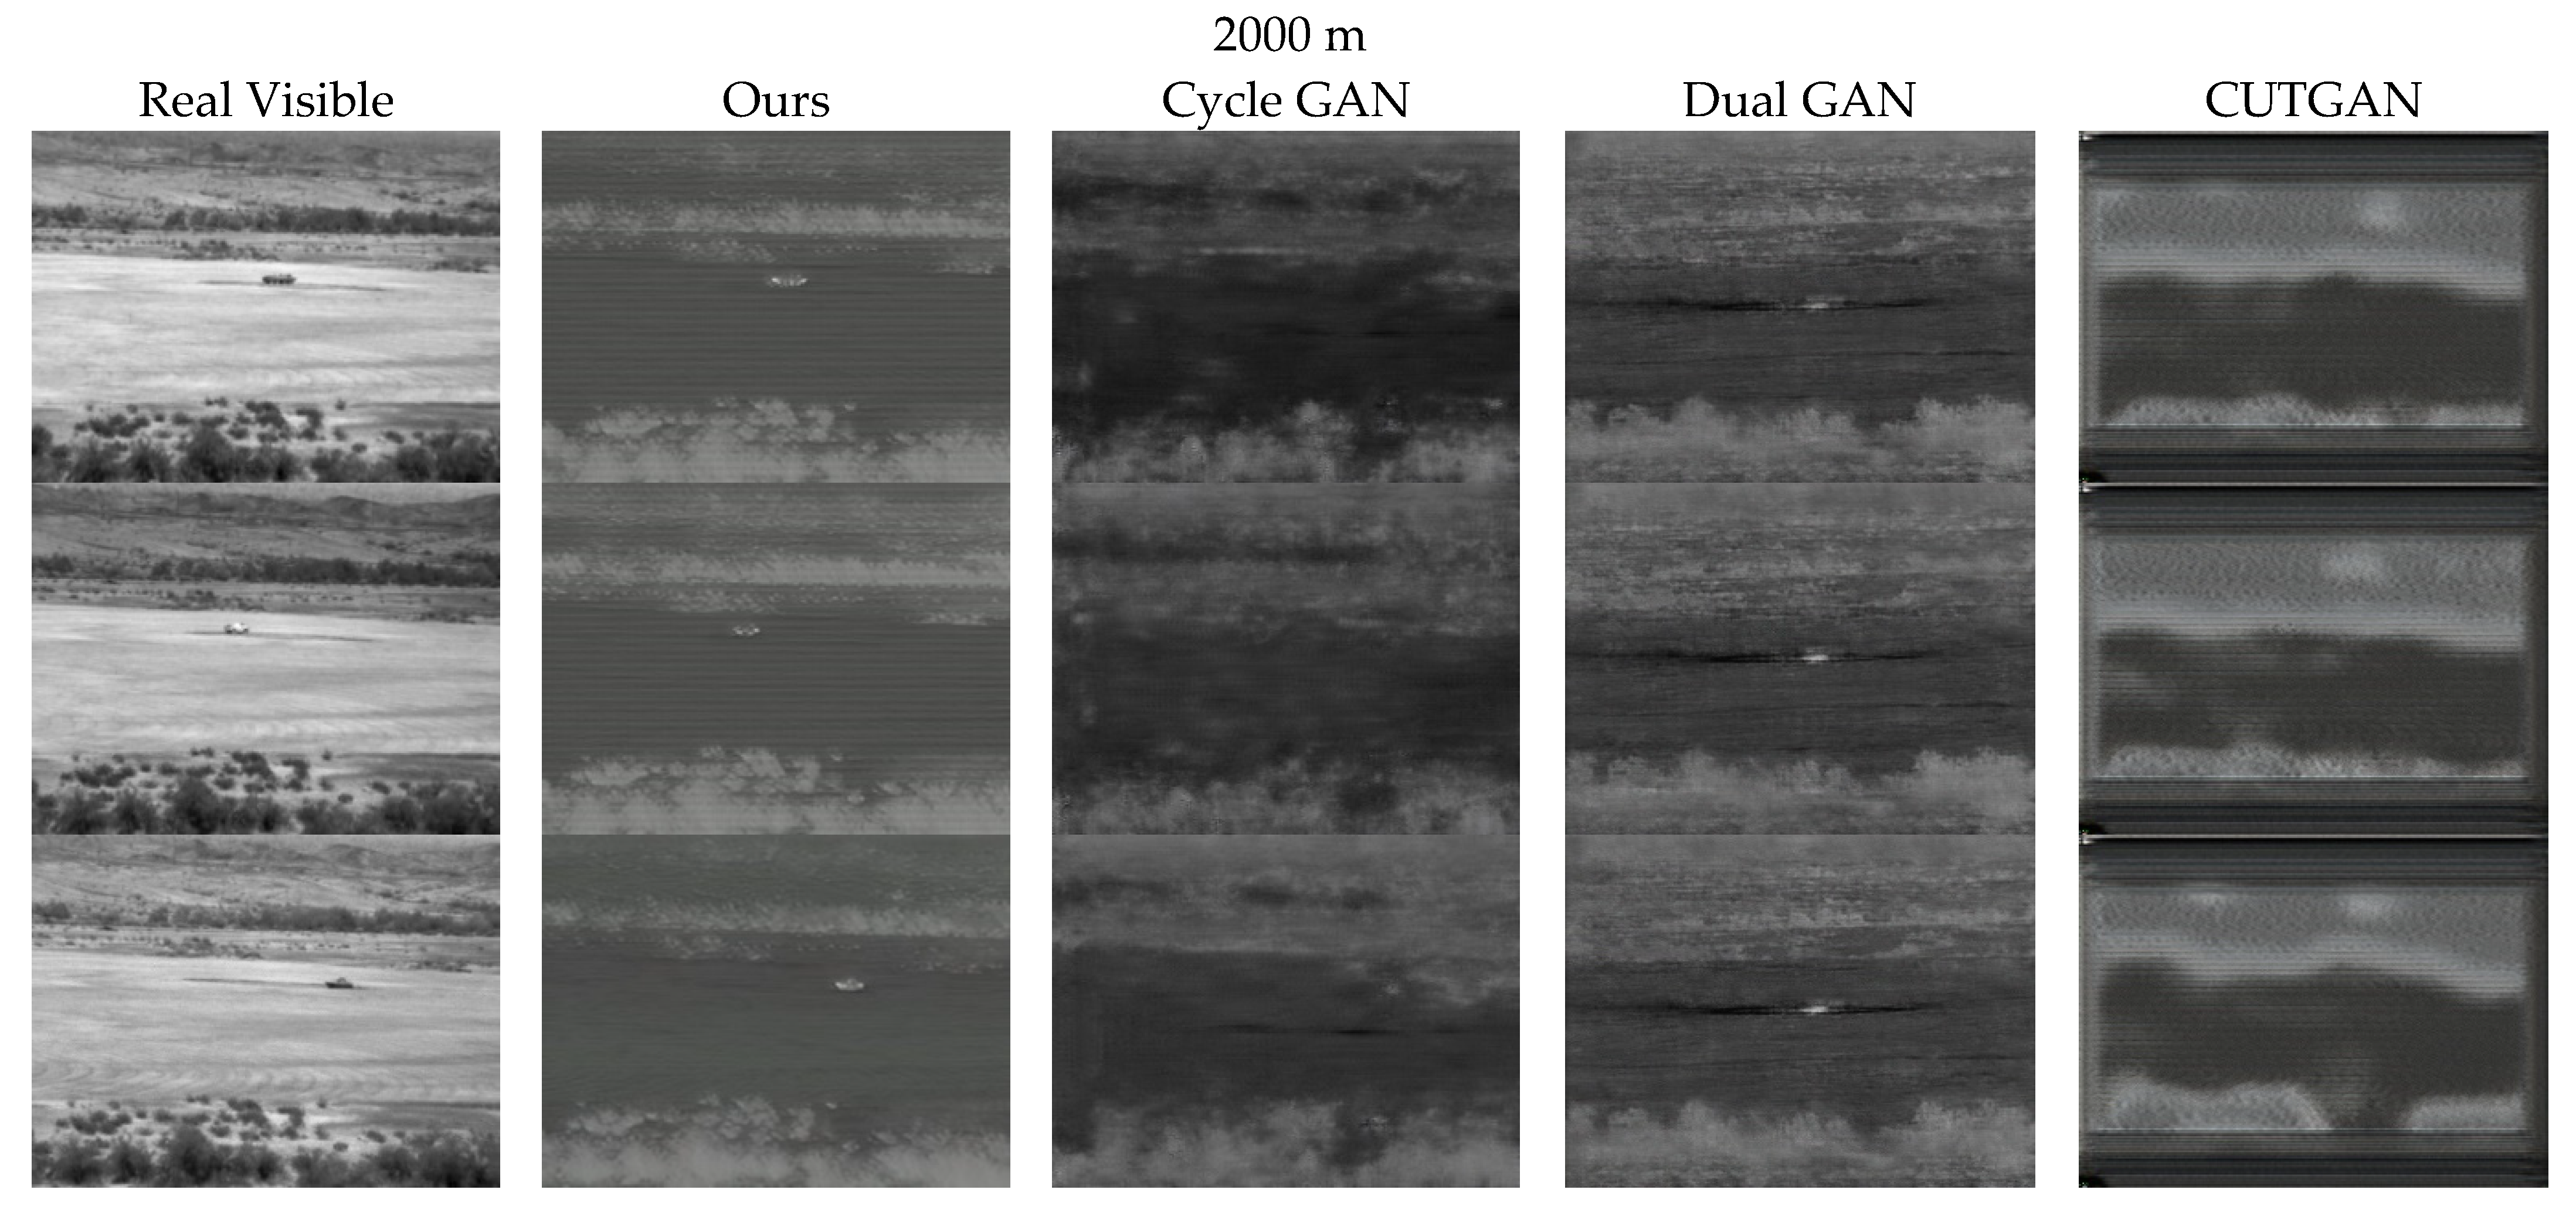
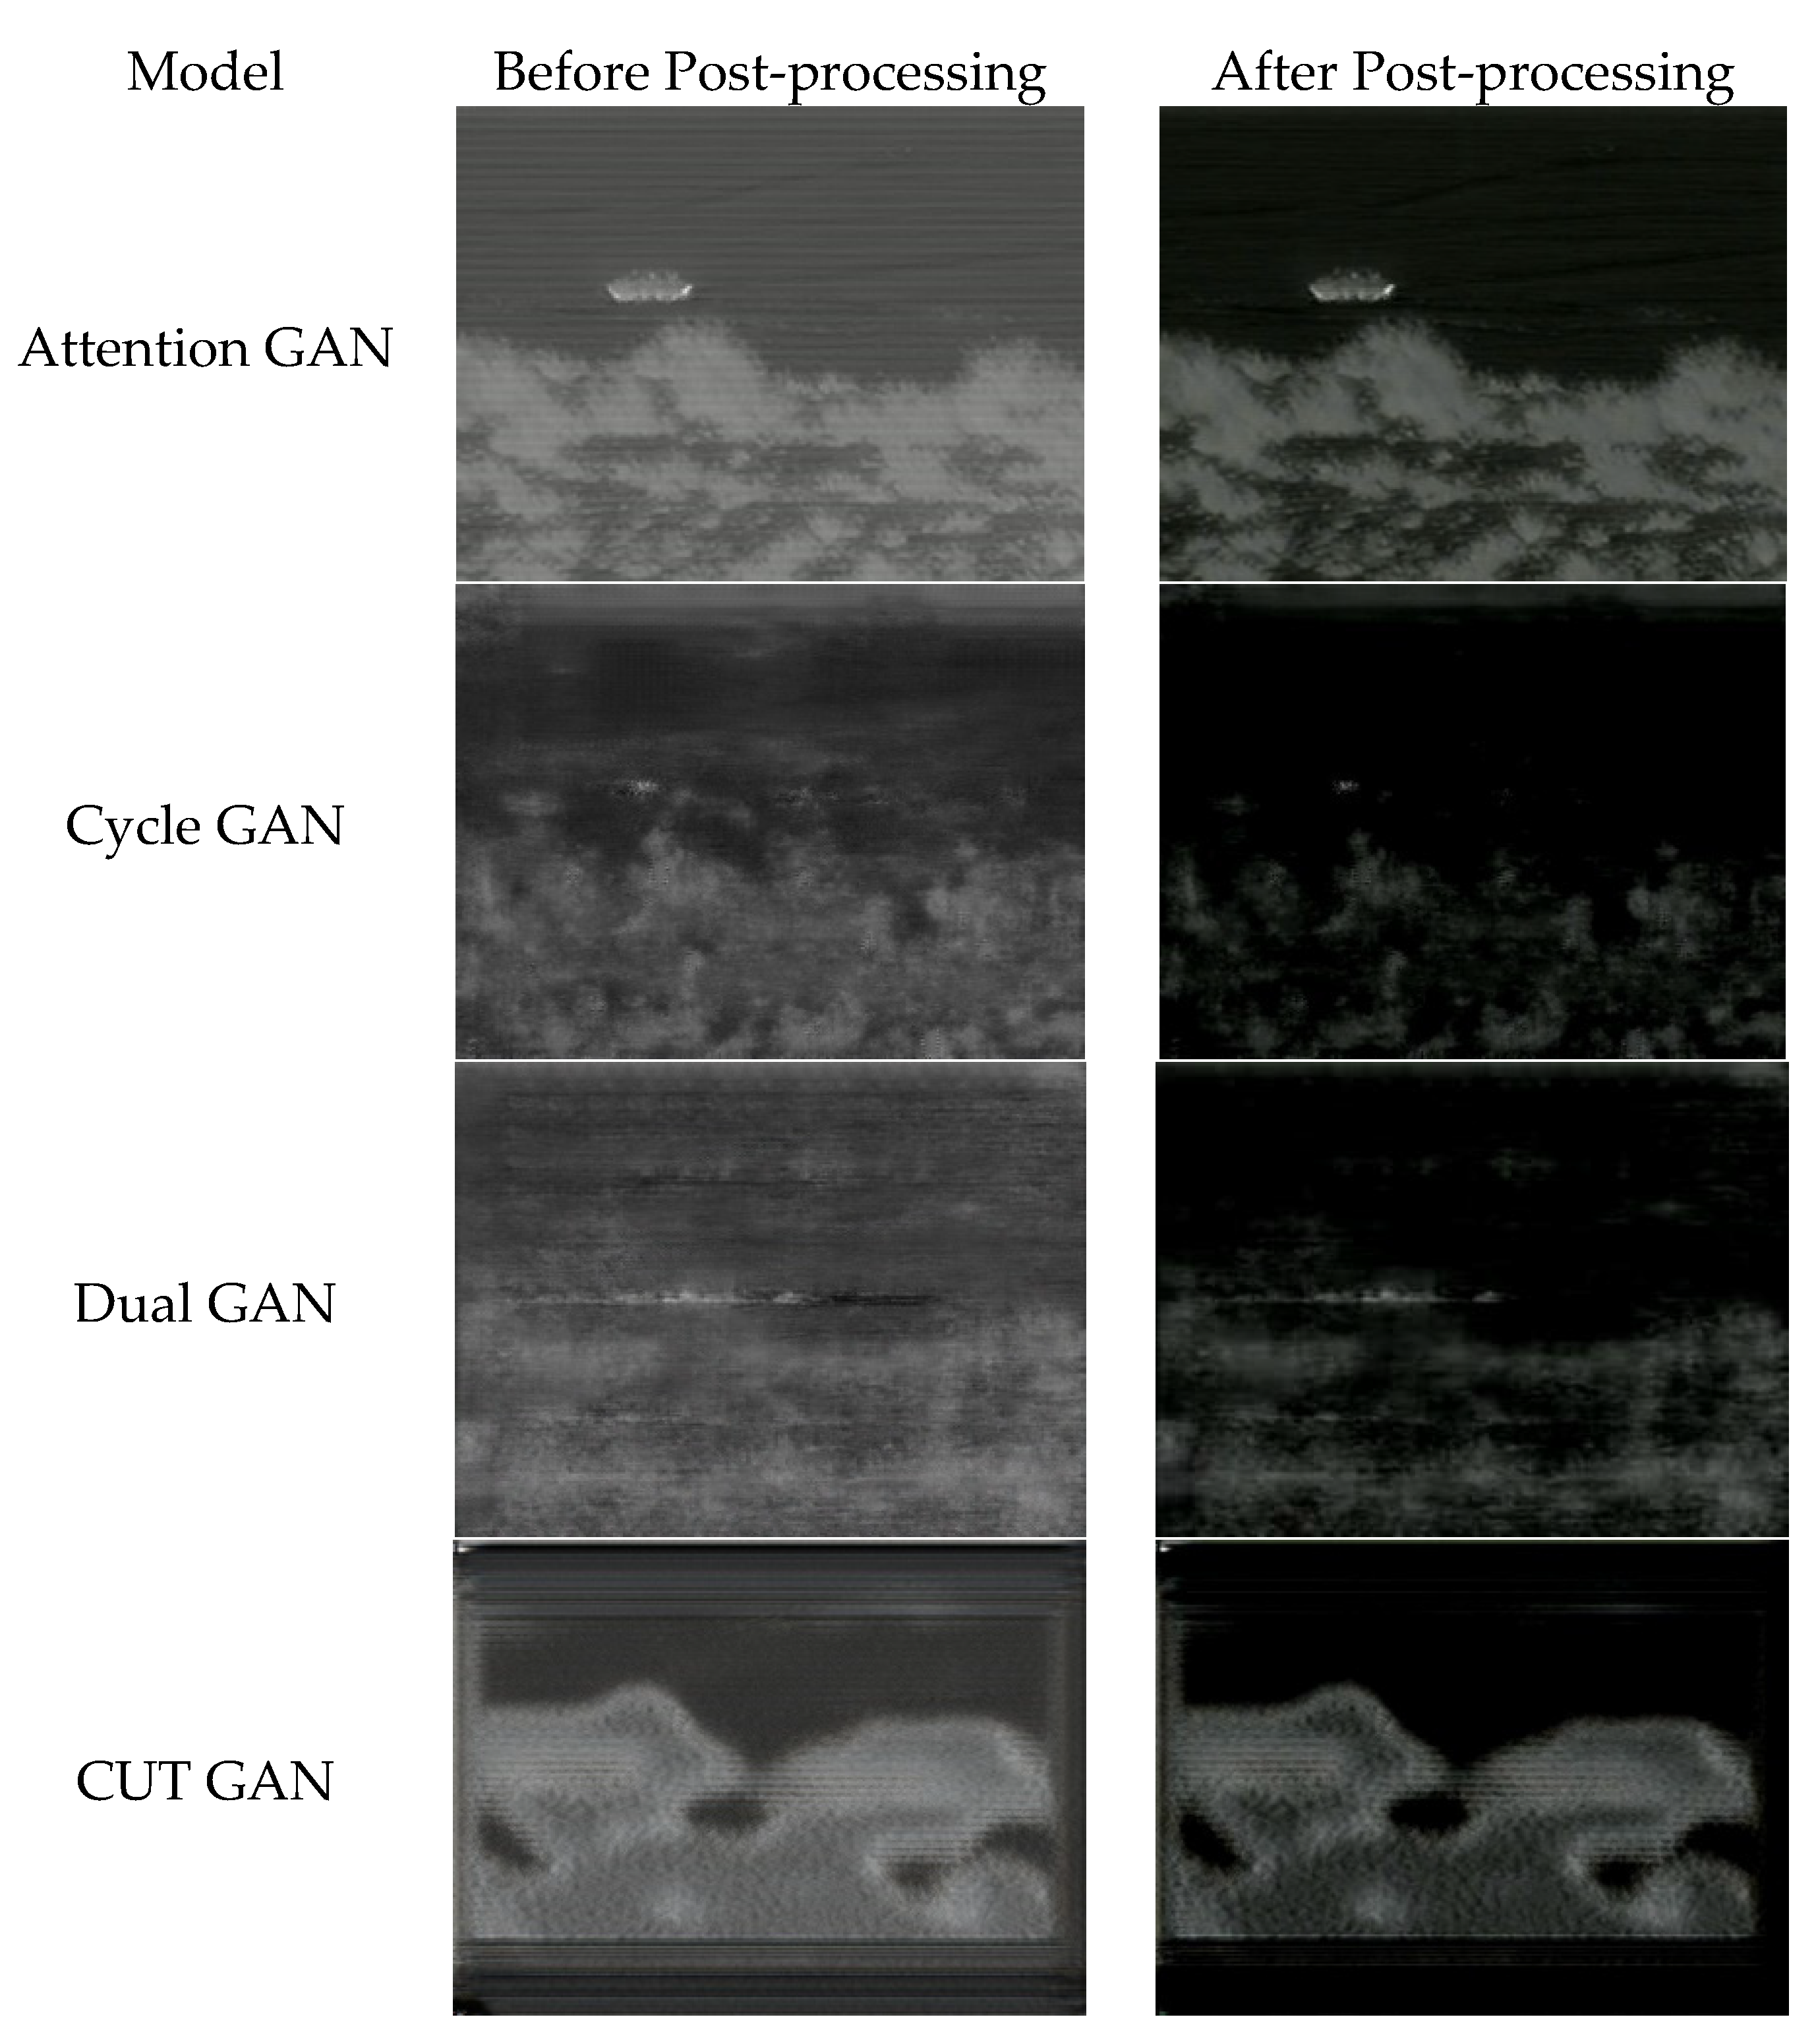
4.4.2. Qualitative Comparison

We compared our method with Cycle GAN [16], Dual GAN [17], and CUTGAN [18], which are state-of-the-art methods for unsupervised image-to-image translation. Both Cycle GAN and Dual GAN have two generators and two discriminators. On the other hand, CUTGAN uses one generator and one discriminator. They use unpaired datasets for training. All models were trained with the same dataset. Figure 10 shows results for visible-to-MWIR translation by different models. It is observed that results by Cycle GAN, Dual GAN, and CUTGAN contain visible artifacts, and the fine details of objects are not preserved. On the other hand, results by our model have much better visual quality, and the vehicles have been correctly translated to the IR domain. It should be noted that although the target areas are consistent, there are some artifacts in the background. We applied two post-processing steps (contrast enhancement and Gaussian filter) to the results, and Figure 11 shows the processed results.

4.4.3. Quantitative Comparison

Table 1 shows the IS, FID, and KID for different models. We can see that the proposed model outperformed Cycle GAN, Dual GAN, and CUTGAN in terms of IS. For FID and KID, the proposed model also won over the competing methods in most of the cases. Table 2 and Table 3 list quantitative metrics after the post-processing steps, and the proposed methods won all cases in terms of FID and KID.

5. Impact of Converted Videos on Target Detection and Classification Performance

For a given surveillance mission, we can divide it into two phases. The first phase is the training of the algorithms. We will first need to build target detection and classification models. In our approach, we propose to use YOLO for target detection and ResNet for classification. To train both YOLO and ResNet, we will create a training database by utilizing both real-infrared and synthetic-infrared videos. The synthetic-infrared videos are converted using our attention GAN. The second phase is the operational phase. We will feed the testing IR videos from various ranges into YOLO for target detection. The target locations will be fed into ResNet for classification. To enhance the classification performance, we propose to apply a VSR algorithm to increase the resolution of the input testing videos before feeding them into ResNet. It turns out that VSR does improve the overall performance of the target classification.

5.1. YOLO for Target Detection

In some conventional object trackers such as those conventional methods mentioned in [1], initial bounding boxes are needed to be manually placed on the objects in the first frame. This is a serious limitation involving human intervention. In contrast, YOLO and faster R-CNN do not require bounding boxes to be placed on some objects in the first frame. Once trained, YOLO and faster R-CNN can detect objects in any frames. The YOLO tracker [59] is fast and demonstrates similar performance to the faster R-CNN [60]. The input image is resized to 448 × 448. There are 24 convolutional layers and two fully connected layers. The output is 7 × 7 × 30. We have used YOLOv2 because it is more accurate than YOLO version 1. The training of YOLO is quite simple. Images with ground-truth target locations are needed. The bounding box for each vehicle was manually determined using tools in MATLAB. For YOLO, the last layer of the deep-learning model was retrained. We did not change any of the activation functions. YOLO took approximately 2000 epochs to train.
YOLO also comes with a built-in classification module. However, based on our earlier evaluations, the classification accuracy using YOLO’s built-in module is not good compared to ResNet [52].

5.2. ResNet for Target Classification

As mentioned earlier, YOLO’s built-in classifier did not perform well, which is probably because we have limited training data. Moreover, we think that although YOLO is good for object detection, its built-in classifier is probably more suitable for inter-class (humans, vehicles, bikes, etc.) discrimination and not good for intra-class (e.g., BTR70 vs. BMP2) discrimination. The ResNet-18 model is an 18-layer convolutional neural network (CNN) that has the advantage of avoiding performance saturation and/or degradation when training deeper layers, which is a common problem among other CNN architectures. The ResNet-18 model avoids the performance saturation by implementing an identity shortcut connection, which skips one or more layers and learns the residual mapping of the layer rather than the original mapping.
It is necessary to explain the relationship between YOLO and ResNet. YOLO was used to determine where, in each frame, the vehicles were located. YOLO generated bounding boxes for those vehicles, and the data were used to crop the vehicles from the image. The cropped vehicles would be fed into the ResNet-18 for classification, and classification results were generated. To be more specific, ResNet-18 is used directly after the bounding box information is obtained from YOLO.
Training of ResNet requires target patches. The targets are cropped from training videos. Mirror images are then created. We then perform data augmentation using scaling (larger and smaller), rotation (every 45 degrees), and illumination (brighter and dimmer) to create more training data. For each cropped target, we are able to create a dataset with 64 more images. For ResNet, the last layer of the deep-learning model was retrained. The ResNet model was trained until the validation score reached a steady-state value.

5.3. Performance Metrics for Assessing Target Detection and Classification Performance

The six different performance metrics used to quantify the detection performance are: center location error (CLE) [1], distance precision at 10 pixels (DP@10) [1], estimates in ground truth (EinGT) [15], intersection over union (IoU) [15], and percentage of frames with detection (% det.) [15]. These metrics have been widely used by researchers in the past. We briefly summarize them below:
Center location error (CLE): It is the error between the center of the bounding box and the ground-truth bounding box. Smaller means better. CLE is calculated by measuring the distance between the ground-truth center location ( C x , g t , C y , g t ) and the detected center location ( C x , e s t , C y , e s t ). Mathematically, CLE is given by
CLE = ( C x , e s t C x , g t ) 2 + ( C y , e s t C y , g t ) 2
Distance precision (DP): It is the percentage of frames where the centroids of detected bounding boxes are within 10 pixels of the centroid of ground-truth bounding boxes. Close to 1 or 100% indicates good results.
Estimates in ground truth (EinGT): It is the percentage of the frames where the centroids of the detected bounding boxes are inside the ground-truth bounding boxes. It depends on the size of the bounding box and is simply a less strict version of the DP metric. Close to 1 or 100% indicates good results.
Intersection over union (IoU): It is the ratio of the intersected area over the union of the estimated and ground-truth bounding boxes.
IoU = A r e a   o f   I n t e r s e c t i o n A r e a   o f   U n i o n
Percentage of frames with detection (% det.): This is the percentage of the number of frames that have detection. It is between 0 and 100%.
We used confusion matrices for evaluating vehicle classification performance using ResNet. From the confusion matrix, we can also evaluate overall accuracy (OA), average accuracy (AA), and the kappa coefficient.

5.4. Training and Testing Procedures

In the training, we used 1500 m original nighttime MWIR videos and attention GAN (aGAN)-converted videos from 1000 m, 1500 m, and 2000 m optical videos. Altogether, there are 20 videos to train the YOLO and ResNet models. In testing, we used 1000 m, 1500 m, and 2000 m videos.

5.4.1. Baseline Results Using Only 1500 m Infrared Videos for Training

Table 4 and Table 5 summarize the baseline YOLO detection and ResNet classification results, respectively. Here, baseline means that the YOLO and ResNet models were trained using only the 1500 m infrared videos without any data augmentation using our attention GAN. The baseline performance metrics will be used as a baseline to compare against the results of using converted videos with attention GAN. There are three different distances that have test results: 1000 m, 1500 m, and 2000 m. Please note that 1500 m testing results are only used as reference, as training data also used 1500 m videos. There is an obvious deterioration in accuracy as the vehicle distance moves from 1500 m, the distance the model was trained on.
From Table 4 and Table 5, each metric trends worse as it moves further away from the trained 1500 m distance. This is a trend that is seen across both detection and classification statistics. The overall degradation in accuracy as distances move from the trained distances is quite extreme. For example, with detection, the AP value, measuring the amount of overlap between ground truth and detected bounding box, halves with each increase of 500 m. When looking at overall trends, although there is only one distance closer than 1500, it seems that the model performs better when moving closer than trained rather than moving further away.

5.4.2. Results with Attention GAN Augmented Data

The focus here is on performance evaluation of target detection and classification models using the augmented data converted by attention GAN. The training data include 1500 m infrared videos, converted infrared videos by attention GAN from 1000 m, 1500 m, and 2000 m optical videos. In the baseline models, we only used the 1500 m MWIR videos. In this case, we focused on testing infrared videos at 1000, 1500, and 2000 m distances because the target size is too small for longer ranges. Table 6 shows the YOLO detection metrics for each distance, while Table 7 shows the ResNet classification metrics and confusion matrices of each distance.
Partially, due to an anomaly for the BRDM2 CLE metric, there is a decrease in accuracy for 2000 m. However, most other metrics are at least slightly improved. The largest overall improvement comes from the 2000 m distance, and the largest metric improvement is the detection percentage. Classification results do not show many differences. Possible reason is that the converted video contains shape information about vehicles that helped the detection performances. However, the conversion was imperfect and did not preserve detailed textures of vehicles. Therefore, the performances of vehicle classification remain similar.
Here, we would like to compare the baseline results in Section 5.4.1 and the attention GAN results in this section. We focus only on the 2000 m case.
We first compare the YOLO detection results. From Table 4 and Table 6, we can clearly see that data augmentation using attention GAN clearly improved the baseline YOLO performance in almost every metric.
In contrast, the ResNet with attention GAN results in Table 7 do not improve over that of the baseline ResNet results in Table 5. This is mainly because the attention-GAN-converted videos lack some detailed textures for the targets, and those additional synthetic videos in the training data actually interfered with the original videos. As a result, the trained ResNet model with attention GAN augmented data did not perform as well as the baseline ResNet.

6. Enhancement of Target Classification Using Super-Resolution Videos

From the end of Section 5, we noticed that converted videos using attention GAN did not improve the ResNet classification performance in long-range videos. We think the reason is due to the small target size in the long-range videos. Since ResNet needs to normalize input images to certain standard sizes of 448 × 448, the target area becomes even smaller because the DSIAC videos are 640 × 480. The study in this section focuses on the use of video super-resolution (VSR) algorithms to enlarge the target area. Consequently, the target size will be bigger. Because of the above reasoning, we only focus on the target area inside the bounding boxes. It is assumed that YOLO has already detected the target. Now, we would like to see if we can improve the classification performance using super-resolution videos.

6.1. Vehicle Classification Architecture with Video Super-Resolution

For this investigation, at first, we cropped only the vehicle portion from each of the video frames. Then, we used the pre-trained video super-resolution (VSR) model to enhance the resolution of these cropped vehicle sub-image frames up to 4×. This pre-trained model takes seven frames as an input to predict the high-resolution center frame. We applied this pre-trained VSR model on our 2000 m, 1500 m, and 1000 m cropped vehicle dataset to obtain 4× higher-resolution vehicle video frames. Figure 12 shows the IR object classification block diagram.

6.2. Video Super-Resolution Algorithm

For VSR, we used the recurrent back-projection network (RBPN) model developed by Haris et al. [61]. This model combines spatial and temporal information from continuous video frames using a recurrent encoder–decoder resulting in high-resolution frame generation compared to the other state-of-the-art VSR. Video frames were enhanced four times using the VSR model. These enhanced frames were then fed to the pre-trained ResNet-18 as input for classification. For this project, we only used the 1500 m dataset to finetune the ResNet-18 model for classification. Then, we applied the trained ResNet model to classify the vehicles in the 1000 m and 2000 m cropped vehicles dataset with and without enhanced resolution, histogram matching, and image stretching. For finetuning, we set the learning rate to 0.001, training epochs to 300, and optimizer as stochastic gradient descent (SGD).
Figure 13 shows the overview of VSR [61]. I is a low-resolution video frame. Model takes are the LR frames { I t 1 ,   I t 2 …, I t n ,   I t } where I t is the target frame. The VSR model goal is to produce S R t , which is the high-resolution version of I t . The network has two approaches. In the horizontal blue-line flow, the model extracts features from the target frame, and in the vertical red-line flow, the model computes the residual features from a pair of the targets to neighbor frames and the precomputed dense motion flow maps ( F t 1 ,   F t 2 ). On each projection step, the model observes the missing details on the target frame and extracts the residual features from each neighbor frame to recover the missing details. More details of this VSR model can be found in [61].

6.3. Results

It should be noted that 1500 m optical videos were converted to MWIR videos by attention GAN. The converted infrared videos were then used to train the ResNet. In our experiments here, we did not convert the 1000 m and 2000 m optical videos to infrared because the ResNet classification results in Section 5 showed that the converted videos did not help ResNet. As explained earlier, the likely reason is that the converted 1000 m and 2000 m videos interfered with the actual IR videos during the training process and thereby degraded the ResNet classification. In short, the experiments in this section can be seen in Figure 14 below.
To test the above framework, we used two separate datasets in the DSIAC database. Table 8 summarizes those videos in our experiments. There are MWIR daytime and MWIR nighttime, with five videos in each case. Each video has 1800 frames.
The classification results are summarized in Table 9. There are two separate studies.
  • Testing on MWIR daytime videos.
There are four sub-cases in each range: (a) without both VSR and data augmentation (by attention GAN); (b) with VSR and without data augmentation; (c) without VSR and with data augmentation; (d) with both VSR and data augmentation. We can see that the classification results with VSR (MWIR Day) are improved quite a lot for both 1000 m and 2000 m videos regardless of data augmentation. In some cases, the improvements are over 30%. The 2000 m video results with both VSR and data augmentation are also improved by 11% as compared to the case in which no data augmentation is used.
  • Testing on MWIR nighttime videos.
Results on MWIR nighttime videos are mixed, as shown in Table 9. In two out of the four cases with VSR, we see slightly improved performance. While the 1000 m case with data augmentation and 2000 m case without data augmentation showed degraded performance. The converted data have low quality, and more research is needed along this direction.

7. Discussion

We have explored a data augmentation method to mitigate data scarcity in the IR domain for deep-network training by converting largely available labelled visible videos to the IR domain. Our method outperformed state-of-the-art methods for generating IR images from visible images. In addition, we have demonstrated that the converted IR images increased the detection and classification accuracies in the IR domain. Furthermore, we have proved that video super-resolution can be an effective way to improve object detection in video. There are some possible alternatives to mitigate the data hungry issue in deep learning such as transfer learning, in which datasets from similar domain can be utilized to pre-train a deep model, and the domain-specific dataset is then used to finetune the pre-trained data to improve the performance. For object detection in an IR video, we will investigate which method is more effective in future work.

8. Conclusions

In this paper, we presented a new approach to convert optical videos to infrared videos. Our proposed attention GAN model can generate more stable IR images and better vehicles’ shapes in the IR domain than the cycle GAN. We also observed that attention GAN helps the YOLO detection performance. In particular, the average precision of the target detection was improved from 41% (without augmentation) to 62% (with augmentation) for the 2000 m videos. However, the converted videos did not help ResNet classification performance. We then investigated the use of a video super-resolution technique to enhance the ResNet classification performance. Some positive impacts on the ResNet classification performance have been observed. However, more research is still needed in this area. One future direction is to develop an integrated framework for target detection and classification that combines VSR, attention GAN, and more recent target detectors and classifiers.

Author Contributions

Conceptualization, C.K. and J.L.; methodology, M.S.U., C.K. and J.L.; software, M.S.U., R.H., K.A.I. and D.G.; formal analysis, M.S.U., C.K., J.L. and R.H.; validation, M.S.U., C.K. and J.L.; investigation: M.S.U., C.K., R.H. and J.L.; resources, C.K. and J.L.; data curation, C.K., M.S.U.; writing—original draft preparation, C.K. and M.S.U.; writing—review and editing, M.S.U., R.H. and J.L.; supervision, C.K. and J.L.; project administration, C.K. and J.L.; funding acquisition, C.K. and J.L. All authors have read and agreed to the published version of the manuscript.

Funding

This research was supported by the US Army under contract W909MY-20-P-0024. The views, opinions, and/or findings expressed are those of the author and should not be interpreted as representing the official views or policies of the Department of Defense or the U.S. Government.

Conflicts of Interest

The authors declare no conflict of interest.

References

  1. Kwan, C.; Chou, B.; Kwan, L.M. A Comparative Study of Conventional and Deep Learning Target Tracking Algorithms for Low Quality Videos. In Proceedings of the 15th International Symposium on Neural Networks, Minsk, Belarus, 25–28 June 2018. [Google Scholar] [CrossRef]
  2. Demir, H.S.; Cetin, A.E. Co-difference based object tracking algorithm for infrared videos. In Proceedings of the IEEE International Conference on Image Processing (ICIP), Phoenix, AZ, USA, 25–28 September 2016; pp. 434–438. [Google Scholar] [CrossRef]
  3. Kwan, C.; Chou, B.; Yang, J.; Rangamani, A.; Tran, T.; Zhang, J.; Etienne-Cummings, R. Target tracking and classification directly using compressive sensing camera for SWIR videos. J. Signal Image Video Process. 2019, 13, 1629–1637. [Google Scholar] [CrossRef]
  4. Kwan, C.; Chou, B.; Yang, J.; Rangamani, A.; Tran, T.; Zhang, J.; Etienne-Cummings, R. Deep Learning based Target Tracking and Classification for Low Quality Videos Using Coded Aperture Camera. Sensors 2019, 19, 3702. [Google Scholar] [CrossRef] [Green Version]
  5. Lohit, S.; Kulkarni, K.; Turaga, P.K. Direct inference on compressive measurements using convolutional neural networks. In Proceedings of the IEEE International Conference on Image Processing (ICIP), Phoenix, AZ, USA, 25–28 September 2016; pp. 1913–1917. [Google Scholar] [CrossRef]
  6. Adler, A.; Elad, M.; Zibulevsky, M. Compressed Learning: A Deep Neural Network Approach. arXiv 2016, arXiv:1610.09615v1. [Google Scholar]
  7. Xu, Y.; Kelly, K.F. Compressed domain image classification using a Dynamic-rate neural network. arXiv 2019, arXiv:1901.09983. [Google Scholar]
  8. Wang, Z.W.; Vineet, V.; Pittaluga, F.; Sinha, S.N.; Cossairt, O.; Kang, S.B. Privacy-Preserving Action Recognition Using Coded Aperture Videos. In Proceedings of the IEEE/CVF Conference on Computer Vision and Pattern Recognition Workshops, Long Beach, CA, USA, 16–20 June 2019. [Google Scholar] [CrossRef] [Green Version]
  9. Vargas, H.; Fonseca, Y.; Arguello, H. Object Detection on Compressive Measurements using Correlation Filters and Sparse Representation. In Proceedings of the European Signal Processing Conference (EUSIPCO), Rome, Italy, 3–7 September 2018; pp. 1960–1964. [Google Scholar] [CrossRef]
  10. Değerli, A.; Aslan, S.; Yamac, M.; Sankur, B.; Gabbouj, M. Compressively Sensed Image Recognition. In Proceedings of the European Workshop on Visual Information Processing (EUVIP), Tampere, Finland, 26–28 November 2018; pp. 1–6. [Google Scholar] [CrossRef] [Green Version]
  11. Latorre-Carmona, P.; Traver, V.J.; Sánchez, J.S.; Tajahuerce, E. Online reconstruction-free single-pixel image classification. Image Vis. Comput. 2018, 86, 28–37. [Google Scholar] [CrossRef]
  12. Li, C.; Wang, W. Detection and Tracking of Moving Targets for Thermal Infrared Video Sequences. Sensors 2018, 18, 3944. [Google Scholar] [CrossRef] [PubMed] [Green Version]
  13. Tan, Y.; Guo, Y.; Gao, C.; Tan, Y.; Guo, Y.; Gao, C. Background subtraction based level sets for human segmentation in thermal infrared surveillance systems. Infrared Phys. Technol. 2013, 61, 230–240. [Google Scholar] [CrossRef]
  14. Berg, A.; Ahlberg, J.; Felsberg, M. Channel Coded Distribution Field Tracking for Thermal Infrared Imagery. In Proceedings of the IEEE Conference on Computer Vision and Pattern Recognition Workshops, Las Vegas, NV, USA, 26 June–1 July 2016; pp. 1248–1256. [Google Scholar] [CrossRef] [Green Version]
  15. Kwan, C.; Gribben, D.; Chou, B.; Budavari, B.; Larkin, J.; Rangamani, A.; Tran, T.; Zhang, J.; Etienne-Cummings, R. Real-Time and Deep Learning based Vehicle Detection and Classification using Pixel-Wise Code Exposure Measurements. Electronics 2020, 18, 1014. [Google Scholar] [CrossRef]
  16. Zhu, J.Y.; Park, T.; Isola, P.; Efros, A.A. Unpaired image-to-image translation using cycle-consistent adversarial networks. In Proceedings of the IEEE International Conference on Computer Vision, Venice, Italy, 22–29 October 2017; pp. 2223–2232. [Google Scholar] [CrossRef] [Green Version]
  17. Yi, Z.; Zhang, H.; Tan, P.; Gong, M. Dualgan: Unsupervised dual learning for image-to-image translation. In Proceedings of the IEEE International Conference on Computer Vision, Venice, Italy, 22–29 October 2017; pp. 2849–2857. [Google Scholar] [CrossRef] [Green Version]
  18. Park, T.; Efros, A.A.; Zhang, R.; Zhu, J.Y. Contrastive learning for unpaired image-to-image translation. In Proceedings of the European Conference on Computer Vision, Glasgow, UK, 23–28 August 2020; pp. 319–345. [Google Scholar] [CrossRef]
  19. ATR Dataset. Available online: https://www.dsiac.org/resources/available-databases/atr-algorithm-development-image-database/ (accessed on 1 January 2020).
  20. Isola, P.; Zhu, J.Y.; Zhou, T.; Efros, A.A. Image-to-image translation with conditional adversarial networks. In Proceedings of the IEEE Conference on Computer Vision and Pattern Recognition, Honolulu, HI, USA, 21–26 July 2017; pp. 1125–1134. [Google Scholar] [CrossRef] [Green Version]
  21. Goodfellow, I.J.; Pouget-Abadie, J.; Mirza, M.; Xu, B.; Warde-Farley, D.; Ozair, S.; Bengio, Y. Generative adversarial nets. Adv. Neural Inf. Process. Syst. 2014, 27, 2672–2680. [Google Scholar] [CrossRef]
  22. Brock, A.; Donahue, J.; Simonyan, K. Large scale GAN training for high fidelity natural image synthesis. arXiv 2018, arXiv:1809.11096. [Google Scholar]
  23. Kim, T.; Cha, M.; Kim, H.; Lee, J.K.; Kim, J. Learning to discover cross-domain relations with generative adversarial networks. In Proceedings of the International Conference on Machine Learning, Sydney, Australia, 6–11 August 2017; pp. 1857–1865. [Google Scholar] [CrossRef]
  24. Kastaniotis, D.; Ntinou, I.; Tsourounis, D.; Economou, G.; Fotopoulos, S. Attention-aware generative adversarial networks (ATA-GANs). In Proceedings of the 2018 IEEE 13th Image, Video, and Multidimensional Signal Processing Workshop (IVMSP), Zagorochoria, Greece, 10–12 June 2018; pp. 1–5. [Google Scholar] [CrossRef] [Green Version]
  25. Tang, H.; Xu, D.; Sebe, N.; Yan, Y. Attention-guided generative adversarial networks for unsupervised image-to-image translation. In Proceedings of the 2019 International Joint Conference on Neural Networks (IJCNN), Budapest, Hungary, 14–19 July 2019; pp. 1–8. [Google Scholar] [CrossRef] [Green Version]
  26. Zhang, H.; Goodfellow, I.; Metaxas, D.; Odena, A. Self-attention generative adversarial networks. In Proceedings of the International Conference on Machine Learning, Long Beach, CA, USA, 9–15 June 2019; pp. 7354–7363. [Google Scholar]
  27. Sun, T.; Jung, C.; Fu, Q.; Han, Q. NIR to RGB domain translation using asymmetric cycle generative adversarial networks. IEEE Access 2019, 7, 112459–112469. [Google Scholar] [CrossRef]
  28. Perera, P.; Abavisani, M.; Patel, V.M. In2i: Unsupervised multi-image-to-image translation using generative adversarial networks. In Proceedings of the 2018 24th International Conference on Pattern Recognition (ICPR), Beijing, China, 20–24 August 2018; pp. 140–146. [Google Scholar] [CrossRef] [Green Version]
  29. Mehri, A.; Sappa, A.D. Colorizing near infrared images through a cyclic adversarial approach of unpaired samples. In Proceedings of the IEEE/CVF Conference on Computer Vision and Pattern Recognition Workshops, Long Beach, CA, USA, 16–17 June 2019. [Google Scholar] [CrossRef]
  30. Suárez, P.L.; Sappa, A.D.; Vintimilla, B.X. Infrared image colorization based on a triplet dcgan architecture. In Proceedings of the IEEE Conference on Computer Vision and Pattern Recognition Workshops, Long Beach, CA, USA, 16–17 June 2017; pp. 18–23. [Google Scholar] [CrossRef]
  31. Liu, S.; John, V.; Blasch, E.; Liu, Z.; Huang, Y. IR2VI: Enhanced night environmental perception by unsupervised thermal image translation. In Proceedings of the IEEE Conference on Computer Vision and Pattern Recognition Workshops, Salt Lake City, UT, USA, 18–22 June 2018; pp. 1153–1160. [Google Scholar] [CrossRef] [Green Version]
  32. Berg, A.; Ahlberg, J.; Felsberg, M. Generating visible spectrum images from thermal infrared. In Proceedings of the IEEE Conference on Computer Vision and Pattern Recognition Workshops, Salt Lake City, UT, USA, 18–22 June 2018; pp. 1143–1152. [Google Scholar] [CrossRef] [Green Version]
  33. Zhang, L.; Gonzalez-Garcia, A.; van de Weijer, J.; Danelljan, M.; Khan, F.S. Synthetic data generation for end-to-end thermal infrared tracking. IEEE Trans. Image Process. 2018, 28, 1837–1850. [Google Scholar] [CrossRef] [Green Version]
  34. Kniaz, V.V.; Knyaz, V.A.; Hladuvka, J.; Kropatsch, W.G.; Mizginov, V. Thermalgan: Multimodal color-to-thermal image translation for person re-identification in multispectral dataset. In Proceedings of the European Conference on Computer Vision (ECCV) Workshops, Munich, Germany, 8–14 September 2018. [Google Scholar] [CrossRef]
  35. Mizginov, V.A.; Danilov, S.Y. Synthetic thermal background and object texture generation using geometric information and gan. Int. Arch. Photogramm. Remote Sens. Spat. Inf. Sci. 2019, XLII-2/W12, 149–154. [Google Scholar] [CrossRef] [Green Version]
  36. Kniaz, V.V.; Mizginov, V.A. Thermal texture generation and 3d model reconstruction using sfm and gan. Int. Arch. Photogramm. Remote Sens. Spat. Inf. Sci. 2018, 42. [Google Scholar] [CrossRef] [Green Version]
  37. Yuan, X.; Tian, J.; Reinartz, P. Generating artificial near infrared spectral band from rgb image using conditional generative adversarial network. ISPRS Ann. Photogramm. Remote. Sens. Spat. Inf. Sci. 2020, 3, 279–285. [Google Scholar] [CrossRef]
  38. Uddin, M.S.; Li, J. Generative Adversarial Networks for Visible to Infrared Video Conversion. In Recent Advances in Image Restoration with Applications to Real World Problems; IntechOpen: London, UK, 2020. [Google Scholar] [CrossRef]
  39. Yun, K.; Yu, K.; Osborne, J.; Eldin, S.; Nguyen, L.; Huyen, A.; Lu, T. Improved visible to IR image transformation using synthetic data augmentation with cycle-consistent adversarial networks. In Pattern Recognition and Tracking XXX; International Society for Optics and Photonics: Bellingham, WA, USA, 2019; Volume 10995, p. 1099502. [Google Scholar] [CrossRef] [Green Version]
  40. Abbott, R.; Robertson, N.M.; del Rincon, J.M.; Connor, B. Unsupervised object detection via LWIR/RGB translation. In Proceedings of the IEEE/CVF Conference on Computer Vision and Pattern Recognition Workshops, Seattle, WA, USA, 14–19 June 2020; pp. 90–91. [Google Scholar] [CrossRef]
  41. Caballero, J.; Ledig, C.; Aitken, A.; Acosta, A.; Totz, J.; Wang, Z.; Shi, W. Real-time video super-resolution with spatio-temporal networks and motion compensation. In Proceedings of the IEEE Conference on Computer Vision and Pattern Recognition, Honolulu, HI, USA, 21–26 July 2017; pp. 4778–4787. [Google Scholar] [CrossRef] [Green Version]
  42. Jo, Y.; Oh, S.W.; Kang, J.; Kim, S.J. Deep video super-resolution network using dynamic upsampling filters without explicit motion compensation. In Proceedings of the IEEE Conference on Computer Vision and Pattern Recognition, Salt Lake City, UT, USA, 18–22 June 2018; pp. 3224–3232. [Google Scholar] [CrossRef]
  43. Kappeler, A.; Yoo, S.; Dai, Q.; Katsaggelos, A.K. Video super-resolution with convolutional neural networks. IEEE Trans. Comput. Imaging 2016, 2, 109–122. [Google Scholar] [CrossRef]
  44. Drulea, M.; Nedevschi, S. Total variation regularization of local-global optical flow. In Proceedings of the 2011 14th International IEEE Conference on Intelligent Transportation Systems (ITSC), Washington, DC, USA, 5–7 October 2011; pp. 318–323. [Google Scholar] [CrossRef]
  45. Liu, D.; Wang, Z.; Fan, Y.; Liu, X.; Wang, Z.; Chang, S.; Huang, T. Robust video super-resolution with learned temporal dynamics. In Proceedings of the IEEE International Conference on Computer Vision, Venice, Italy, 22–29 October 2017; pp. 2507–2515. [Google Scholar] [CrossRef]
  46. Yu, H.; Wang, J.; Huang, Z.; Yang, Y.; Xu, W. Video paragraph captioning using hierarchical recurrent neural networks. In Proceedings of the IEEE Conference on Computer Vision and Pattern Recognition, Las Vegas, NV, USA, 26 June–1 July 2016; pp. 4584–4593. [Google Scholar] [CrossRef] [Green Version]
  47. Venugopalan, S.; Xu, H.; Donahue, J.; Rohrbach, M.; Mooney, R.; Saenko, K. Translating videos to natural language using deep recurrent neural networks. arXiv 2014, arXiv:1412.4729. [Google Scholar]
  48. Huang, Y.; Wang, W.; Wang, L. Bidirectional recurrent convolutional networks for multi-frame super-resolution. In Proceedings of the 28th International Conference on Neural Information Processing Systems, Montreal, QC, Canada, 7–12 December 2015; Volume 1, pp. 235–243. [Google Scholar] [CrossRef]
  49. Shi, X.; Chen, Z.; Wang, H.; Yeung, D.Y.; Wong, W.K.; Woo, W.C. Convolutional LSTM network: A machine learning approach for precipitation nowcasting. In Proceedings of the Advances in Neural Information Processing Systems, Montreal, QC, Canada, 7–12 December 2015; pp. 802–810. [Google Scholar] [CrossRef]
  50. Sajjadi, M.S.; Vemulapalli, R.; Brown, M. Frame-recurrent video super-resolution. In Proceedings of the IEEE Conference on Computer Vision and Pattern Recognition, Salt Lake City, UT, USA, 18–22 June 2018; pp. 6626–6634. [Google Scholar] [CrossRef] [Green Version]
  51. Radford, A.; Metz, L.; Chintala, S. Unsupervised representation learning with deep convolutional generative adversarial networks. arXiv 2015, arXiv:1511.06434. [Google Scholar]
  52. He, K.; Zhang, X.; Ren, S.; Sun, J. Deep residual learning for image recognition. In Proceedings of the IEEE Conference on Computer Vision and Pattern Recognition, Las Vegas, NV, USA, 26 June–1 July 2016; pp. 770–778. [Google Scholar] [CrossRef] [Green Version]
  53. MOT Challenge. Available online: Motchallenge.net/ (accessed on 1 December 2020).
  54. Kingma, D.P.; Ba, J. Adam: A method for stochastic optimization. arXiv 2014, arXiv:1412.6980. [Google Scholar]
  55. Salimans, T.; Goodfellow, I.; Zaremba, W.; Cheung, V.; Radford, A.; Chen, X. Improved techniques for training gans. In Proceedings of the ADVANCES in Neural Information Processing Systems, Barcelona, Spain, 5–10 December 2016; pp. 2234–2242. [Google Scholar] [CrossRef]
  56. Szegedy, C.; Vanhoucke, V.; Ioffe, S.; Shlens, J.; Wojna, Z. Rethinking the inception architecture for computer vision. In Proceedings of the IEEE Conference on Computer Vision and Pattern Recognition, Las Vegas, NV, USA, 26 June–1 July 2016; pp. 2818–2826. [Google Scholar] [CrossRef] [Green Version]
  57. Heusel, M.; Ramsauer, H.; Unterthiner, T.; Nessler, B.; Hochreiter, S. Gans trained by a two time-scale update rule converge to a local Nash equilibrium. In Proceedings of the Advances in Neural Information Processing Systems, Long Beach, CA, USA, 4–9 December 2017; pp. 6626–6637. [Google Scholar] [CrossRef]
  58. Bińkowski, M.; Sutherland, D.J.; Arbel, M.; Gretton, A. Demystifying mmd gans. arXiv 2016, arXiv:1801.01401. [Google Scholar]
  59. Redmon, J.; Farhadi, A. Yolov3: An incremental improvement. arXiv 2018, arXiv:1804.02767. [Google Scholar]
  60. Ren, S.; He, K.; Girshick, R.; Sun, J. Faster R-CNN: Towards Real-Time Object Detection with Region Proposal Networks. Adv. Neural Inf. Process. Syst. 2015. [Google Scholar] [CrossRef] [PubMed] [Green Version]
  61. Haris, M.; Shakhnarovich, G.; Ukita, N. Recurrent back-projection network for video super-resolution. In Proceedings of the IEEE Conference on Computer Vision and Pattern Recognition, Long Beach, CA, USA, 15–20 June 2019; pp. 3897–3906. [Google Scholar] [CrossRef] [Green Version]
Figure 1. Framework highlighting the main parts of our paper. (a) Framework for converting optical videos to infrared videos using our proposed attention GAN; (b) baseline (left) and proposed framework for target detection and classification (training data were augmented using converted infrared videos in our system); (c) baseline classification and proposed classification system (training data augmented using converted IR videos) with the incorporation of video super-resolution (VSR).
Remotesensing 13 03257 g001
Figure 2. Architecture of attention GAN model. G and F are two generators and DX and DY are two discriminators. AM(x), AM(G(x)), AM(y), and AM(F(y)) are the attention maps of x, G(x), y, and F(y), respectively, which are generated by ResNet-18.
Remotesensing 13 03257 g002
Figure 3. Generator network architecture in our model.
Remotesensing 13 03257 g003
Figure 4. Discriminator architecture in our model.
Remotesensing 13 03257 g004
Figure 5. Five vehicles in DSIAC: (a) BTR70; (b) BRDM2; (c) BMP2; (d) T72; (e) ZSU23-4.
Remotesensing 13 03257 g005
Figure 6. Optical videos of DSIAC dataset.
Remotesensing 13 03257 g006
Figure 7. MWIR nighttime videos of DSIAC dataset.
Remotesensing 13 03257 g007
Figure 8. Training frames of optical and MWIR videos at 1500 m.
Remotesensing 13 03257 g008
Figure 9. Attention maps generated by the teacher network of our attention GAN model.
Remotesensing 13 03257 g009
Figure 10. Generated MWIR images from visible images.
Remotesensing 13 03257 g010aRemotesensing 13 03257 g010b
Figure 11. Generated MWIR images after post-processing.
Remotesensing 13 03257 g011
Figure 12. Block diagram of IR classification experimental setting. Stochastic gradient descent (SGD).
Remotesensing 13 03257 g012
Figure 13. Block diagram of VSR model.
Remotesensing 13 03257 g013
Figure 14. Baseline and proposed system setup in our experiments in this section. (a) Baseline (no synthetic videos); (b) proposed system with synthetic IR videos from 1500 m.
Remotesensing 13 03257 g014
Table 1. Performance metrics comparison among different methods. Bold numbers indicate best-performing methods.
VehicleDistanceCycle GANDual GANCUTGANOur Method
ISFIDKIDISFIDKIDISFIDKIDISFIDKID
T721000 m1.123.1648.571.133.3953.291.103.5255.411.172.9846.45
2000 m1.113.1549.401.083.0949.091.083.3551.371.173.0048.98
BRDM21000 m1.112.9646.411.054.0270.041.063.6357.911.143.4958.70
2000 m1.163.1649.111.062.7142.821.063.3350.941.113.2652.48
BTR701000 m1.193.0646.141.193.5557.661.113.5655.911.123.6059.18
2000 m1.052.9947.051.032.6240.561.043.4252.771.122.6942.72
BMP21000 m1.123.2849.711.143.7761.561.153.5455.381.232.9445.91
2000 m1.052.8545.141.052.3235.981.043.4152.631.193.0148.51
ZSU23-41000 m1.153.1848.681.123.3853.141.083.5455.671.272.9446.64
2000 m1.242.8444.151.043.2453.481.053.3752.121.142.9848.48
Overall Scores1.133.0647.441.093.2151.761.083.4754.011.173.0949.81
Table 2. Performance metrics comparison among different methods after post-processing. Bold numbers indicate best-performing methods.
VehicleDistanceCycle GANDual GANCUTGANOur Method
ISFIDKIDISFIDKIDISFIDKIDISFIDKID
T721000 m1.574.3972.851.313.8159.801.363.8965.631.282.3434.42
2000 m1.454.1868.791.233.5955.891.263.8261.541.432.0329.11
BRDM21000 m1.414.2671.891.273.2448.941.254.1871.661.302.2232.47
2000 m1.365.0388.621.243.4553.631.153.9264.411.382.1832.00
BTR701000 m1.654.2766.911.353.6555.781.354.2372.631.282.2332.56
2000 m1.355.3296.931.233.6558.301.123.9966.441.251.9628.72
BMP21000 m1.414.3270.091.333.7457.631.424.2771.631.392.3434.07
2000 m1.354.1170.691.203.7060.231.164.0968.521.352.2633.46
ZSU23-41000 m1.534.4171.781.373.7458.341.333.8364.081.272.2633.28
2000 m1.344.1168.561.243.8362.371.253.8162.251.362.1832.48
Overall Scores1.444.4474.711.283.6457.091.274.0066.881.332.2032.26
Table 3. Performance metrics comparison of our proposed model before and after post-processing. Bold numbers indicate best-performing methods.
VehicleDistanceBefore Post-ProcessingAfter Post-Processing
ISFIDKIDISFIDKID
T721000 m1.172.9846.451.282.3434.42
2000 m1.173.0048.981.432.0329.11
BRDM21000 m1.143.4958.701.302.2232.47
2000 m1.113.2652.481.382.1832.00
BTR701000 m1.123.6059.181.282.2332.56
2000 m1.122.6942.721.251.9628.72
BMP21000 m1.232.9445.911.392.3434.07
2000 m1.193.0148.511.352.2633.46
ZSU23-41000 m1.272.9446.641.272.2633.28
2000 m1.142.9848.481.362.1832.48
Overall Scores1.173.0949.811.332.2032.26
Table 4. Baseline YOLO detection results using only 1500 m infrared videos for training. The metrics are named as follows: center location error (CLE), distance precision (DP), estimates in ground truth (EinGT), intersection over union (IoU), average precision (AP), and detection percentage (% det.).
1000 mCLEDPEinGTIoU% det.
BTR704.075100.00%100.00%61.90%97.78%
BRDM23.194100.00%100.00%76.89%95.72%
BMP24.038100.00%100.00%73.90%88.33%
T723.574100.00%100.00%73.87%96.33%
ZSU23-43.607100.00%100.00%74.04%99.61%
Avg3.698100.00%100.00%72.12%95.56%
1500 mCLEDPEinGTIoU% det.
BTR701.201100.00%100.00%70.56%91.17%
BRDM21.279100.00%100.00%78.54%91.06%
BMP21.092100.00%100.00%87.70%91.06%
T721.497100.00%100.00%85.21%91.11%
ZSU23-41.233100.00%100.00%77.58%90.00%
Avg1.260100.00%100.00%79.92%90.88%
2000 mCLEDPEinGTIoU% det.
BTR701.861100.00%100.00%30.64%93.44%
BRDM23.023100.00%100.00%37.74%90.50%
BMP23.542100.00%100.00%58.01%41.83%
T722.276100.00%100.00%39.80%98.44%
ZSU23-48.95397.83%97.83%38.11%84.56%
Avg3.93199.57%99.57%40.86%81.76%
Table 5. Baseline ResNet classification results using only 1500 m infrared videos for training. Confusion matrices with overall accuracy (OA), average accuracy (AA), and kappa.
1000 mBTR70BRDM2BMP2T72ZSU23-4
BTR7018392481779
BRDM202107230
BMP207141227517
T72432251207092
ZSU23-4185401271982
Class StatsOA89.76%AA89.74%kappa0.900
1500 mBTR70BRDM2BMP2T72ZSU23-4
BTR7018490002
BRDM201808000
BMP200180000
T7200018290
ZSU23-400001882
Class StatsOA99.98%AA99.98%kappa1.00
2000 mBTR70BRDM2BMP2T72ZSU23-4
BTR701511491675684
BRDM201834181237
BMP273071502
T7215272159173995
ZSU23-409019101472
Class StatsOA84.99%AA86.50%kappa0.85
Table 6. Detection metrics for the YOLO model trained with augmented data from attention GAN.
1000 mCLEDPEinGTIoU% det.
BTR703.208100.00%100.00%69.02%99.78%
BRDM23.140100.00%100.00%75.59%95.61%
BMP23.326100.00%100.00%80.30%99.89%
T723.56899.84%99.88%76.50%99.61%
ZSU23-42.879100.00%100.00%75.79%100.00%
Avg3.22499.97%99.98%75.44%98.98%
1500 mCLEDPEinGTIoU% det.
BTR701.342100.00%100.00%79.79%100.00%
BRDM22.361100.00%100.00%73.46%97.67%
BMP21.134100.00%100.00%87.77%100.00%
T722.076100.00%100.00%77.60%99.94%
ZSU23-42.78299.39%99.39%79.47%100.00%
Avg1.93999.88%99.88%79.62%99.52%
2000 mCLEDPEinGTIoU% det.
BTR701.192100.00%100.00%52.53%98.44%
BRDM24.78199.28%99.28%49.90%89.28%
BMP22.34399.83%99.83%72.53%66.00%
T722.15199.88%99.88%67.05%98.28%
ZSU23-41.786100.00%100.00%64.00%87.67%
Avg2.45199.80%99.80%61.20%87.93%
Table 7. Confusion matrices and classification metrics for attention-GAN-trained ResNet model.
1000 mBTR70BRDM2BMP2T72ZSU23-4
BTR70152883125453
BRDM22201708250
BMP220306141334056
T7293123538971252
ZSU23-42269752228321
Class StatsOA54.26%AA54.30%kappa0.4283
1500 mBTR70BRDM2BMP2T72ZSU23-4
BTR7012584550793
BRDM2117208211210
BMP26171159233
T72173470178714
ZSU23-43351312551030
Class StatsOA79.89%AA78.94%kappa0.7487
2000 mBTR70BRDM2BMP2T72ZSU23-4
BTR70127267011920
BRDM24154635440
BMP20815179
T72632012790
ZSU23-42970208260
Class StatsOA33.75%AA30.76%kappa0.1719
Table 8. Testing dataset details.
Type of DataResolutionNumber of Frames Per Class
BTR70BRDM2BMP2T72ZSU23-4
MWIR Day1000 m18001800180018001800
2000 m18001800180018001800
MWIR Night1000 m18001800180018001800
2000 m18001800180018001800
Table 9. Classification results with different settings. Bold numbers indicate best-performing methods.
Video TypeRangeModelsAccuracy w/o Augmentation Using Attention GANAccuracy w Augmentation Using Attention GAN
(a) Test results using daytime infrared videos
MWIR Day1000 mWithout VSR36.4560.01
With VSR85.5685.83
2000 mWithout VSR53.9546.46
With VSR81.2392.562
(b) Test results using nighttime infrared videos
MWIR Night1000 mWithout VSR7691.82
With VSR 76.5164.206
2000 mWithout VSR87.271.94
With VSR 69.9877.92
Publisher’s Note: MDPI stays neutral with regard to jurisdictional claims in published maps and institutional affiliations.

