Communication

Position Inversion of Goafs in Deep Coal Seams Based on DS-InSAR Data and the Probability Integral Methods

1
Key Laboratory of Land Environment and Disaster Monitoring, Ministry of Natural Resources, China University of Mining and Technology, Xuzhou 221116, China
2
Beijing Urban Construction Exploration & Surveying Design Research Institute Co., Beijing 100101, China
3
Institute of Remote Sensing Satellite, China Academy of Space Technology, Beijing 100094, China
*
Author to whom correspondence should be addressed.
Remote Sens. 2021, 13(15), 2898; https://doi.org/10.3390/rs13152898
Submission received: 22 June 2021 / Revised: 20 July 2021 / Accepted: 21 July 2021 / Published: 23 July 2021
(This article belongs to the Special Issue InSAR in Remote Sensing)

Abstract

:
The goafs caused by coal mining cause great harm to the surface farmland, buildings, and personal safety. The existing monitoring methods cost a lot of workforce and material resources. Therefore, this paper proposes an inversion approach for establishing the locations of underground goafs and the parameters of the probability integral method (PIM), thus integrating distributed scatter interferometric synthetic aperture radar (DS-InSAR) data and the PIM. Firstly, a large amount of surface deformation observation data above the goaf are obtained by DS-InSAR, and the line-of-sight deformation is regarded as the true value. Secondly, according to the obtained surface deformations, the ranges of eight goaf location parameters and three PIM parameters are set. Thirdly, a correlation function between the surface deformation and the underground goaf location is constructed. Finally, a particle swarm optimization algorithm is used to search for the optimal parameters in the range of the set parameters to meet the requirement for minimum error between the surface deformation calculated by PIM and the line-of-sight deformation obtained by DS-InSAR. These optimal parameters are thus regarded as the real values of the position of the underground goaf and the PIM parameters. The simulation results show that the maximum relative error between the position of the goaf and the PIM parameters is 2.11%. Taking the 93,604 working face of the Zhangshuanglou coal mine in the Peibei mining area as the research object and 12 Sentinel-1A images as the data source, the goaf location and PIM parameters of the working face were successfully inverted. The inversion results show that the maximum relative error in the goaf location parameters was 16.61%, and the maximum relative error in the PIM parameters was 26.67%.

Graphical Abstract

1. Introduction

Coal is currently the main energy source in China, and coal mining has led to the existence of a large number of abandoned goafs. This often results in the reduction of ground elevation, which can cause serious ecological and environmental problems including farmland inundation, soil salinization, and desertification. It can also be detrimental to the safety of people’s lives and property [1,2]. Research examining mining subsidence has played a positive role in reducing surface subsidence disasters and economic losses [3,4,5,6]. With the efforts of experts and scholars worldwide, a series of research methods have been established to investigate this problem, including the typical curve method, the profile function method, and the probability integral method (PIM). The latter of these has become a relatively mature method to research the relationship between coal mining and land subsidence [7]. Inversion research on mining subsidence has two main aspects. Firstly, the PIM parameters are obtained by inversion from the underground mining information and surface subsidence observation data, and the mining subsidence caused by the other working faces can be predicted by the PIM [8]. Secondly, using the known PIM model parameters and surface subsidence observation values, the goaf positions in the mining area can be obtained by inversion [9].
In the process of realizing the inversion of PIM parameters related to goafs or geology, observed values of surface deformation need to be used; the establishment of surface movement observation stations therefore plays an important role in promoting research examining mining subsidence. Leveling, GPS, interferometric synthetic aperture radar (InSAR), and other technologies are widely used in mining subsidence monitoring [10,11]. Due to its large coverage, all-weather capability, and high monitoring accuracy [12], InSAR is widely used to measure deformations in glaciers [13,14], volcanoes [15,16], earthquakes [17,18], and other landscapes, as well as urban and general land surface deformations caused by resource exploitation. Scholars worldwide have also tried to apply InSAR technology to the observation of surface deformations caused by mining activities [19,20].
In most existing goaf-location inversion methods, the PIM parameters are given based on experience [21,22,23,24], which leads to large errors. To obtain more accurate model parameters, information should be known about the goaf to invert the model parameters [25,26,27]. However, the existing research still has the following shortcomings: (1) generally, PIM parameters are difficult to obtain accurately; at present, they are mainly given based on experience, which can be arbitrary and may lead to large errors. (2) Even if the PIM parameters are retrieved from surface observation station data, the calculated model parameters are not necessarily reliable due to errors in the monitoring data and the underground working face information. (3) Most previous studies have used differential InSAR (D-InSAR) and leveling and GPS observations from surface movement observation stations to obtain the surface deformation; however, D-InSAR is affected by temporal and spatial incoherence and atmospheric delay, so it is difficult to use this for obtaining accurate deformation information and the point density required for the inversion of underground goaf locations. (4) Most of the existing research cases are related to shallow or horizontal mining, and the influence of the coal seam dip angle is generally ignored; however, when the coal seam is deeply buried, the center coordinate offset is large, and the influence of the dip angle cannot be disregarded.
According to these shortcomings, this paper puts forward the following improvements. Firstly, aiming at shortcomings (1) and (2), both the goaf location parameters and the main PIM parameters are regarded as unknown parameters to participate in the inversion simultaneously; this means that the results are closer to the real values and avoid the large errors caused by the use of empirical values. Secondly, due to the influence of spatial–temporal decoherence, it is difficult to extract high-density surface monitoring points from D-InSAR. This work therefore used the current frontier technology of earth observation: distributed scatter (DS)-InSAR [28]. The core idea of this method is to treat objects (such as bare land, beach, and Gobi) with medium temporal coherence and continuous spatial distribution as homogeneous points. According to the statistical characteristics of these homogeneous points, the phase of distributed objects is optimized and the influence of noise on them is reduced; the density of point objects in non-urban areas is improved, and surface deformation observation values with higher order and accuracy are obtained. Thirdly, in the inversion model, the influence of the coal seam inclination angle and the mining depth on the center coordinate offset are considered. Finally, in view of the fact that there are many inversion parameters, resulting in a high-dimensional nonlinear continuous parameter model, a particle swarm optimization (PSO) algorithm, which has advantages in solving high-dimensional problems, is used for inversion.
The structure of the remainder of this paper is as follows. Section 2 introduces the basic principles and research methods; the results of simulations, and experiments with real data, are presented in Section 3, and a discussion of the inversion errors is given. Conclusions are presented in Section 4.

2. Materials and Methods

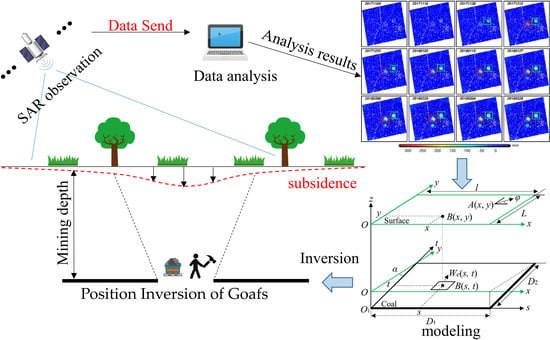
2.1. DS-InSAR Method

Recognition of homogeneous points and phase optimization are the prerequisites for extracting the deformation phases of distributed targets. The common homomorphic point-recognition methods mainly include two types: nonparametric and parametric hypothesis testing methods. Among these, the fast statistically homogeneous pixel selection (FaSHPS) method [29], which is a parametric test, has the advantage of small heterogeneity and a fast recognition speed, and it has been widely used.
According to the characteristics that the single-look SAR amplitude image obeys Rayleigh distribution in homogeneous regions, and their coefficients of variation are constants, the confidence interval based on the amplitude mean can be constructed as described in the FaSHPS method:
P { μ ( L ) z 1 α / 2 0.52 μ ( L ) N < A ¯ ( L ) < μ ( L ) + z 1 α / 2 0.52 μ ( L ) N } = 1 α
where P{·} is the probability, μ(L) is the expectation value of pixel L, Z1−α/2 is the (1 − α/2) quantile in the standard normal distribution, N is the number of SAR images in the time series, and A ¯ L is the mean value of SAR image amplitude.
According to the above formula, we only need to calculate the average amplitude of a SAR image pixel in a time series and then establish whether the value falls into the above confidence interval to judge whether it belongs to the set of homogeneous points.
After the identification of homogeneous points, our approach uses the coherent matrix decomposition method [30] to optimize the phase. In this method, the eigenvalues of the pixel covariance matrix of time-series SAR data are used to separate different scattering signals. The eigenvector corresponding to the largest eigenvalue is regarded as the main scatterer, and the eigenvectors corresponding to the other eigenvalues are regarded as noise. The phase component of the dominant scattering mechanism is separated to optimize the phase. The model is expressed as
T ˜ = T ˜ s i g n a l + T ˜ n o i s e = λ 1 μ 1 μ 1 H + i = 2 n λ i μ i μ i H
where T ˜ s i g n a l and T ˜ n o i s e are the main scatterer signal and the noise signal, respectively; the eigenvector μ1, corresponding to the maximum eigenvalue λ1, is the optimized phase of the distributed target; λi are the n eigenvalues of the coherence matrix; and μi is the eigenvector corresponding to the different eigenvalues λi and thus corresponding to different scattering mechanisms.
The processing flow of DS-InSAR is as follows: (1) the interferometric pairs are set up according to the small spatio-temporal baseline, and the differential interferograms are generated by removing the flat and terrain phase based on satellite orbit parameters and external DEM. (2) The homogeneity points are identified by the amplitude images, and the phases of the differential interferogram are optimized. Then, the spatio-temporal coherences of the homogeneous points are calculated by the optimized phase, and the DS points are obtained by setting the threshold. (3) The phase unwrapping of DS is carried out, and the observation equation among DS and deformation rate, DEM error and residual phase is established. (4) The singular value decomposition (SVD) is used to estimate the surface deformation phase and DEM residual phase. Then, the atmospheric phase, nonlinear deformation and noise phase are separated by the spatio-temporal filtering method. (5) The linear deformation and nonlinear deformation are added to obtain the time series of LOS subsidence [31].

2.2. Probability Integral Model

As shown in Figure 1, in the coal seam coordinate system, sO1t corresponds to the surface coordinate system xOy; in the surface coordinate system, xOy is the projection of sO1t in the coal seam coordinate system. If a unit B(s, t) is exploited at (s, t), the land subsidence value of A(x, y) at any point on the surface caused by this micro unit is:
d W ( x , y ) = W e ( x s ) W e ( y t ) d s = 1 r 2 e π ( x s ) 2 + ( y t ) 2 r 2 d s
If the strike length of the mining working face is D1 and the dip length is D2, the land subsidence value of point A(x, y) caused by coal mining of the whole working face is:
W ( x , y ) A = W 0 r 2 x l x e π ( x r ) 2 dx y L y e π ( y r 1 ( 2 ) ) 2 dy = 1 W 0 W 0 ( x ) W 0 ( y )
with
W 0 = m q c o s α
W 0 ( x ) = m q c o s α 2 ( e r f ( π x t a n β H ) e r f ( π ( x l ) t a n β H ) )
W 0 ( y ) = m q c o s α 2 ( e r f ( π y t a n β H 1 ) e r f ( π ( y L ) t a n β H 2 ) )
where m is the average mining thickness of the working face; q is the subsidence coefficient; α is the inclination angle; tanβ is the tangent of the main influence angle; H, H1, and H2 are the mining depths of the strike main section, the lower boundary of the working face, and the upper boundary of the working face, respectively; l is the calculated length of the working face strike, l = D1S1S3; and L is the calculated length of the working face dip, L = (D2S2S4) sin(θ + α)/sinθ, in which S1, S2, S3, and S4 are the offset distances in the left, down, right, and upper directions and θ is the propagation angle of the mining influence.
The horizontal movement U(x, y, φ) of any point A(x, y) on the surface in the φ direction (an angle value that rotates counterclockwise in the positive direction of the x axis to the specified direction), can be expressed as:
U ( x , y , φ ) = b r ( W ( x , y ) x c o s φ + W ( x , y ) y s i n φ ) + W 0 ( y ) c o t θ
where r is the main influence radius and b is the coefficient of horizontal movement. According to Equation (8), when φ is an angle value in the north–south direction, the calculated horizontal movement is UN. When φ is an angle value in the east–west direction, the calculated horizontal movement is UE.
It can be seen from Figure 2 that the surface deformation caused by the working face is biased to the inclination direction of the coal seam, and the offset value is
Δ Y = H c o t θ
From Equation (3), we know that the working face contains eight working face parameters and eight model parameters. These are recorded as M = [D1, D2, Xc, Yc, H, φn, α, m, q, b, tanβ, θ, S1, S2, S3, S4] due to a connection between the parameters
s i = k 1 H θ = 90 ° k 2 α
where k1 and k2 are proportional constants.
By introducing Equation (10) into Equations (4) and (8), M can be simplified as M = [D1, D2, Xc, Yc, H, φn, α, m, q, b, tanβ], and Equations (4) and (8) can be simplified as
W ( x , y ) = f W ( x , y , M ) U φ ( x , y ) = f φ ( x , y , M )

2.3. Establishment of Inversion Model

The LOS surface deformation obtained by DS-InSAR is recorded as DLOS; the LOS deformation is calculated by PIM according to the relationship between the three-dimensional surface deformation W, UN, and UE, and this is recorded as Dlos. The model for this is
D l o s = W c o s θ s i n θ U N c o s ( α h 3 π / 2 + U E s i n ( α h 3 π / 2 ) ] ,
where θ is the incident angle of the SAR satellite radar beam and αh is the satellite heading angle.
The DLOS obtained by DS-InSAR is taken as the true value, and the Dlos calculated by PSO and PIM each time is taken as the observed value. When the error is less than a given threshold, the calculated goaf location and PIM parameters are taken as the final results:
v = j = 1 k ( D L O S j D l o s j ) 2 k
where D l o s j is the LOS deformation of surface point j obtained by inversion using Equation (12), D L O S j is the LOS deformation of surface point j calculated by the SAR technique, k is the number of surface points involved, and v is the output of the final fitness value.

3. Results

3.1. Simulations

Numerical Simulations

In this work, the simulated mining depth was 900 m, the length was 1000 m, the width was 500 m, the mining thickness was 6 m, and the dip angle was 25°. In the simulations, the scale constants were k1 = 0.1 and k2 = 0.6, and the horizontal resolution of the model block was 20 m × 20 m. Figure 3 shows the surface subsidence and LOS deformations caused by this simulated coal mining. It can be seen that the maximum settlement point is in the center of the basin, and the maximum settlement value is 2.8 m. Due to the influence of the inclination angle and the coal seam burial depth, the center coordinate of the working face deviates from the settlement center.
Figure 4 shows settlement and horizontal movement plots of the main section based on Figure 3. It can be seen from Figure 4a that the horizontal movement between the boundary of the subsidence basin and its inflection point increases gradually; it is the largest at the inflection point of the subsidence curve, and it then decreases gradually from the inflection point to the point of greatest subsidence, where the horizontal movement is zero; the second half of the curve is a symmetrical reflection of the first. The difference between Figure 4a,b is that the horizontal movement of the coal seam in the downhill direction is greater than that in the uphill direction, and the curve is asymmetric. It can be seen from Figure 4 that the surface burial depth is large, and it is not easy to realize full mining after mining.
Based on the simulated underground goaf data in the previous section and the model parameters determined by geological conditions, the subsidence W of each point on the surface was generated by the PIM, providing the horizontal movement UN in the north–south direction and the horizontal movement UE in the east–west direction. Simulated InSAR surface deformation observation values were generated using Equation (12) and recorded as DLOS, and taking the underground goaf data and PIM parameters as unknown values, an inversion experiment was carried out. The inversion results were compared with the simulated values, and the inversion values of each parameter were obtained. The absolute and relative errors are shown in Table 1.
The following can be seen from Table 1. (1) Among the length parameters (D1, D2, Xc, Yc, H, m), the maximum relative error is 1.21% in the coal seam thickness m, the absolute error is 0.07 m, and the maximum absolute error is 6.5 m in the coal seam depth H. (2) The maximum absolute error and the maximum relative error of the two angle parameters appear in the inclination angle α, and the maximum absolute error and the maximum relative error are 0.53° and 2.11%, showing that the two angle parameters have a good inversion effect and can better approximate the true value. (3) For the PIM parameters (q, b, tanβ), the maximum relative error and absolute error appear at the tangent of the major influence angle tanβ; in this example, the absolute error is 0.01 and the relative error is 0.45%, which is similar to the angle parameters and can better approximate the real parameters. (4) The parameters (Xc and Yc, D1 and D2) have the same levels of error under the conditions of using simulated data for inversion. At the same time, the errors of Xc and D2 are slightly larger than those of Yc and D1, which is caused by the complexity of tendency calculation model being greater than that of the trend, which is more consistent with the actual situation.
These simulations show that the proposed method is feasible. For areas with unknown PIM parameters and underground goafs, the time-series surface deformation field is first obtained by InSAR imaging, and the inversion of the PIM parameters and the locations of goafs can then be obtained simultaneously.

3.2. Experiments with Real Data

3.2.1. Study Area

The surface of the Zhangshuanglou coal mine in the Peibei mining area (Figure 5) belongs to the Yellow River alluvial plain, which has ground elevations of 37–39 m. The terrain is high in the west and low in the east, and the surface water system is dense. Long-term and high-intensity underground coal mining has resulted in a large area of surface subsidence and even collapse, which not only affects the ecological environment of the area but also endangers the lives and property of residents. The coal seam in this area is stable and of medium thickness, with an average total thickness of 5.82 m, and the surface of the region is mostly covered by vegetation. It is difficult to obtain high-precision and long time-series surface deformations using the D-InSAR method. The shape of the 93,604 working face from April 2017 to July 2018 is shown in Figure 5. The coal seam in the north of 93,604 has not been mined, and the geology there is stable. The southern coal seam was mined in July 2016, and the surface deformation has been stable; this will therefore not affect the deformation monitoring of the 93,604 working face.

3.2.2. SAR Data Processing

Twelve repeatable-track sentinel images were selected for the experiment, and the pixel sizes in the distance and azimuth directions were 2.33 m and 13.91 m, respectively. The parameters of the observation time, vertical baseline, and time baseline of the images are shown in Table 2.
To reduce the computation time, the images were first cropped to 2400 × 500 pixels. The surface deformations obtained by the accumulated phase based on DS-InSAR are shown in Figure 5. In this experiment, the mask threshold was 0.4, and the multi-view ratio was 4:1 in the range and azimuth directions. A total of 78,605 high-coherence points were selected. The maximum surface deformation value generated by DS-InSAR was about 323 mm.
The locations of the mining subsidence basins can be judged according to the monitoring results in Figure 6. It can be seen that there are three areas with obvious surface deformation. In this experiment, it is necessary to verify the accuracy of three PIM parameters and eight goaf location parameters. Therefore, two groups of experiments were designed. (1) The cyan area was used to obtain accurate PIM parameters [8]; the aim of this group of experiments was to provide the PIM parameters of this area for the second experiment to verify the experimental results. (2) The red was used to obtain the positioning parameters and PIM parameters of the underground goaf to verify the feasibility of the proposed method. To reduce the effect of decoherence, SAR data obtained in spring and winter was used to ensure that the study area would not be covered by large-scale vegetation.

3.2.3. Inversion of Goaf Parameters

The real values of the goaf parameters (D1, D2, Xc, Yc, H, φn, α, m) can be accurately obtained from the mining map, and the errors in these data can be ignored. The parameters of the PIM model (q, b, tanβ) related to the geological mining conditions need to be obtained by geological survey, and they are often measured as the mean value of parameters in a large range of the region. Although this value is appropriate for general practical applications, it is not good enough for small-scale geological inversions due to the complexity of the geological environment. Therefore, in this work, we used the area indicated by the cyan frame in Figure 6 to obtain the PIM parameters of the area using accurate goaf parameters and surface observations of deformation obtained by InSAR. The inversion method is shown in [8], and the inversion result was q = 0.83, b = 0.3, tanβ = 1.8.
To evaluate the accuracy of this experiment, the absolute and relative errors between the inversion parameters and the real values were calculated, and the calculation results are shown in Table 3.
The following can be observed from Table 3. (1) In the inversion results of the goaf parameters (D1, D2, Xc, Yc, H, φn, α, m), the maximum relative error is 16.61%, and the absolute error is 26.57 m, which appears on the dip length D2. (2) Despite being the same type of parameters, the absolute error and relative error of the strike and dip length D1 and D2 are quite different. The main reason for this is that in PIM, the dip length needs to be projected onto the horizontal plane to calculate the horizontal distance, and in this process the parameter is also affected by the parameters α, H, while the strike length is only affected by the parameter H. (3) The absolute and relative errors of the angle parameter φn and α are small. This is because these two parameters are highly correlated with the surface deformation morphology, and the surface deformation morphology obtained by DS-InSAR technology can easily determine the approximate value range. (4) The inverted position of the center of the inclined coal seam and the deformation center observed by DS-InSAR deviates by ∆Y in the dip direction, as shown in Equation (9). Due to the offset considered in PIM, the inversion parameters Xc and Yc can approach the real values with better accuracy.
Figure 7 shows a projection of the real LOS deformation (upper layer) and the actual position of the mining working face on the horizontal plane (lower layer). The limited differences between the two rectangles indicates that the inverted result is similar to the real working face in terms of shape; the position deviation is small, and this demonstrates a good inversion effect.

4. Discussion

4.1. Goaf Inversion with Known PIM Parameters

Most previous studies have used known PIM parameters to invert the goaf position. In this section, we make a comparison of this approach with the method of this paper. To ensure that the experimental data are not affected by other errors, the LOS deformation observed by InSAR was generated based on the simulated data in Table 1 and Equation (12). Since the LOS deformation has no errors, when the PIM parameters are assumed to be known, the inverted goaf position parameters should be consistent with the simulated values. Based on this assumption, the inversion results were compared with the simulation results in this paper to explore the interaction between the PIM parameters and the goaf position. The inversion results are shown in Table 4.
Comparing Table 1 and Table 4, we can establish the following. (1) Assuming that the PIM parameters related to the geological conditions are known, the accuracy of the inverted parameters (D1, D2, Xc, Yc, H, m, α) is improved compared with the results in Table 1, but this improvement is not obvious. (2) For the parameter φn, the two inversion methods have the same effect and can obtain an accurate final result, which shows that this parameter has strong robustness. (3) Comparing the results of the two groups of simulation data, we can see that whether the PIM parameters (q, b, tanβ) are known or not has a little effect on the inversion accuracy of the goaf position parameters; the relative and absolute errors decrease slightly, which shows that the research method in this paper is feasible.

4.2. Influence of the LOS Deformation Obtained by DS-InSAR

There are many factors influencing DS-InSAR observations, including DEM errors, orbit errors, atmospheric delay, phase unwrapping errors, and noise. The final deformations generated by DS-InSAR may thus contain observation errors. To theoretically analyze the influence of LOS observation errors on the results of parameter inversion, deep coal seam data was used in simulations to verify the method in this paper. To observe changes in the parameters, random errors from −0.4 m to 0.4 m with an average interval of 10 mm were added to LOS observations without errors. Scatter plots of the variations in the 11 parameters with different error levels are shown in Figure 8.
The following can be seen from Figure 8. (1) The parameters D1, D2, Xc, Yc, φn, α, q, b, and tanβ change linearly with increasing LOS error; the inversion errors of parameters H and m do not change synchronously with the LOS error, but rather they fluctuate around the zero axis. (2) The LOS deformation errors directly affect the inversion parameters, so the LOS observations used should be highly accurate. This is why DS-InSAR was used here to provide high-quality observations.

5. Conclusions

This paper presents a method to simultaneously retrieve the parameters of the position and PIM parameters of underground goafs using DS-InSAR data. The method improves the target density of points in non-urban areas by reducing the influence of noise on distributed targets using DS-InSAR. It then establishes a correlation model between underground mining and surface deformation. Finally, a PSO algorithm is used to quickly optimize the parameters. The following conclusions were reached.
(1)
The amount of surface deformation data used is very important to constrain the inversion model. Therefore, DS-InSAR is applied to reduce the influence of spatio-temporal incoherence, and this can effectively increase the density and accuracy of the field-observed deformations.
(2)
For mining subsidence caused by exploitation of deep coal seams, the center of the surface deformation deviates from the position of the underground goaf due to the coal seam dip angle. Thus, the center deviation caused by inclined coal seams in the model must be considered, or the inversion error in the center coordinate will be larger.
(3)
Simulation results show that it is feasible to use the PIM parameters as unknown parameters in goaf inversion, and the inversion errors are relatively small. Experiments with real data verified the results of the simulations. In the case of the PIM parameters being involved in the inversion, the goaf position parameters can still be obtained with a high accuracy. Because the PIM parameters are difficult to obtain accurately, the method in this paper avoids the need for their selection according to experience in goaf location inversion.
(4)
The maximum relative error of the simulations was 2.11%, the maximum relative error in the experiments with real data was 26.67%, and the errors in other inversion parameters were relatively small. The experimental results show that the method has a good effect on the inversion of underground goaf locations and has the advantage of a large range of non-contact measurements.

Author Contributions

Conceptualization, T.L. and H.Z.; methodology, T.L., H.Z. and H.F.; software, T.L. and C.Z.; validation, T.L., J.L. and H.Z.; investigation, H.F.; resources, H.F.; writing—original draft preparation, T.L. and H.Z.; writing—review and editing, T.L., H.Z.; supervision, H.Z. and H.F.; project administration, H.F. All authors have read and agreed to the published version of the manuscript.

Funding

This research was funded by the Intergovernmental International Scientific and Technological Innovation Cooperation Project (Grant No. 2017YFE0107100), the Natural Science Foundation of China (Grant No. 41604005, 51774270).

Data Availability Statement

Data sharing not applicable.

Acknowledgments

The authors would like to thank the European Space Agency for providing Sentinel-1A data. We also express thanks to Jiang Mi for providing the fast statistically homogeneous pixel selection (FaSHPS) toolbox for this research.

Conflicts of Interest

The authors declare no conflict of interest.

References

  1. Wu, W.D.; Bai, J.B.; Yan, S.; Wang, X.Y.; Wu, B.W. Planning and design of underground space construction during longwall mining in coal mines. Energy Sources 2020. [Google Scholar] [CrossRef]
  2. Liu, H.; Zhang, M.; Su, L.J.; Chen, X.X.; Liu, C.F.; Sun, A.G. A boundary model of terrain reconstruction in a coal-mining subsidence waterlogged area. Environ. Earth Sci. 2021, 80, 187. [Google Scholar] [CrossRef]
  3. Blanchette, M.L.; Mark, A.L. Pit lakes are a global legacy of mining: An integrated approach to achieving sustainable ecosystems and value for communities. Curr. Opin. Environ. Sustain. 2016, 23, 28–34. [Google Scholar] [CrossRef]
  4. Cui, X.M.; Gao, Y.G.; Yuan, D.B. Sudden surface collapse disasters caused by shallow partial mining in Datong coalfield, China. Nat. Hazards 2014, 74, 911–929. [Google Scholar] [CrossRef]
  5. Guo, Q.B.; Guo, G.L.; Li, Y.M.; Wang, L.; Zhao, X.W. Stability evaluation of an expressway construction site above an abandoned coal mine based on the overlay and index method. Sustainability 2019, 11, 5163. [Google Scholar] [CrossRef] [Green Version]
  6. Bell, F.G.; Stacey, T.R.; Genske, D.D. Mining subsidence and its effect on the environment: Some differing examples. Environ. Geol. 2000, 40, 135–152. [Google Scholar] [CrossRef]
  7. Liu, B.C.; Dai, H.Y. Research development and origin of probability integral method. Coal Min. Technol. 2016, 21, 1–3. [Google Scholar]
  8. Wang, L.; Wei, T.; Li, N.; Chi, S.S.; Jiang, C.; Fang, S.Y. Research on probability integration parameter inversion of mining-induced surface subsidence based on quantum annealing. Environ. Earth Sci. 2018, 77, 740. [Google Scholar] [CrossRef]
  9. Yang, Z.F.; Li, Z.W.; Zhu, J.J.; Yi, H.W.; Feng, G.C.; Hu, J.; Wu, L.X.; Preusse, A.; Wang, Y.J.; Papst, M. Locating and defining underground goaf caused by coal mining from space-borne SAR interferometry. ISPRS J. Photogramm. Remote Sens. 2018, 135, 112–126. [Google Scholar] [CrossRef]
  10. Shi, Y.; Li, Q.W.; Meng, X.; Zhang, T.K.; Shi, J.J. On time-series InSAR by SA-SVR algorithm: Prediction and analysis of mining subsidence. J. Sens. 2020, 2020, 8860225. [Google Scholar] [CrossRef]
  11. Fan, H.D.; Wang, L.; Wen, B.F.; Du, S. A new model for three-dimensional deformation extraction with single-track InSAR based on mining subsidence characteristics. Int. J. Appl. Earth Obs. Geoinf. 2021, 94, 102223. [Google Scholar] [CrossRef]
  12. Kamali, M.E.; Abuelgasim, A.; Papoutsis, I.; Loupasakis, C.; Kontoes, C. A reasoned bibliography on SAR interferometry applications and outlook on big interferometric data processing. Remote Sens. Appl. Soc. Environ. 2020, 19, 100358. [Google Scholar]
  13. Du, W.B.; Ji, W.Q.; Xu, L.J.; Wang, S.T. Deformation time series and driving-force analysis of glaciers in the eastern Tienshan mountains using the SBAS InSAR method. Int. J. Environ. Res. Public Health 2020, 17, 2836. [Google Scholar] [CrossRef] [Green Version]
  14. Baffelli, S.; Frey, O.; Hajnsek, I. Geostatistical analysis and mitigation of the atmospheric phase screens in Ku-band terrestrial radar interferometric observations of an Alpine glacier. IEEE Trans. Geosci. Remote Sens. 2020, 58, 7533–7556. [Google Scholar] [CrossRef]
  15. Delgado, F. Rhyolitic volcano dynamics in the Southern Andes: Contributions from 17 years of InSAR observations at Cordón Caulle volcano from 2003 to 2020. J. South Am. Earth Sci. 2021, 106, 102841. [Google Scholar] [CrossRef]
  16. Gaddes, M.E.; Hooper, A.; Bagnardi, M.; Inman, H.; Albino, F. Blind signal separation methods for InSAR: The potential to automatically detect and monitor signals of volcanic deformation. J. Geophys. Res. Solid Earth 2018, 123, 10226–10251. [Google Scholar] [CrossRef] [Green Version]
  17. Pepe, A.; Calò, F. A review of interferometric synthetic aperture radar (InSAR) multi-track approaches for the retrieval of earth’s surface displacements. Appl. Sci. 2017, 7, 1264. [Google Scholar] [CrossRef] [Green Version]
  18. Xu, G.Y.; Xu, C.J.; Wen, Y.M.; Jiang, G.Y. Source parameters of the 2016–2017 central Italy earthquake sequence from the Sentinel-1, Alos-2 and GPS data. Remote Sens. 2017, 9, 1182. [Google Scholar] [CrossRef] [Green Version]
  19. Zheng, M.N.; Deng, K.Z.; Fan, H.D.; Du, S. Monitoring and analysis of surface deformation in mining area based on InSAR and grace. Remote Sens. 2018, 10, 1392. [Google Scholar] [CrossRef] [Green Version]
  20. Fan, H.D.; Gu, W.; Qin, Y.; Xue, J.Q.; Chen, B.Q. A model for extracting large deformation mining subsidence using D-InSAR technique and probability integral method. Trans. Nonferrous Met. Soc. China 2014, 24, 1242–1247. [Google Scholar] [CrossRef]
  21. Bu, P.; Li, C.K.; Liao, M.G.; Yang, W.T.; Zhu, C.G.; Fang, J. An approach for estimating underground-goaf boundaries based on combining DInSAR with a graphical method. Adv. Civ. Eng. 2020, 2020, 9375056. [Google Scholar]
  22. Hu, Z.; Ge, L.L.; Li, X.J.; Zhang, K.; Zhang, L. An underground-mining detection system based on DInSAR. IEEE Trans. Geosci. Remote Sens. 2013, 51, 615–625. [Google Scholar] [CrossRef]
  23. Xia, Y.P.; Wang, Y.J. InSAR-and PIM-based inclined goaf determination for illegal mining detection. Remote Sens. 2020, 12, 3884. [Google Scholar] [CrossRef]
  24. Du, S.; Wang, Y.J.; Zheng, M.N.; Zhou, D.W.; Xia, Y.P. Goaf locating based on InSAR and probability integration method. Remote Sens. 2019, 11, 812. [Google Scholar] [CrossRef] [Green Version]
  25. Wang, L.; Jiang, K.G.; Wei, T.; Jiang, C.; Zha, J.F.; Chi, S.S. Estimation of parameters of probability integral method model based on improved fireworks algorithm. Surv. Rev. 2020, 53, 366–382. [Google Scholar] [CrossRef]
  26. Li, P.X.; Peng, D.; Tan, Z.X.; Deng, K.Z. Study of probability integration method parameter inversion by the genetic algorithm. Int. J. Min. Sci. Technol. 2017, 27, 1073–1079. [Google Scholar] [CrossRef]
  27. Yang, J.Y.; Liu, C.; Chen, T.Y.; Zhang, Y.M. The invasive weed optimization-based inversion of parameters in probability integral model. Arab. J. Geosci. 2019, 12, 424. [Google Scholar] [CrossRef]
  28. Ferretti, A.; Fumagalli, A.; Novali, F.; Prati, C.; Rocca, F.; Rucci, A. A new algorithm for processing interferometric data-stacks: SqueeSAR. IEEE Trans. Geosci. Remote Sens. 2011, 49, 3460–3470. [Google Scholar] [CrossRef]
  29. Jiang, M.; Ding, X.L.; Hanssen, R.F.; Malhotra, R.; Chang, L. Fast statistically homogeneous pixel selection for covariance matrix estimation for multitemporal InSAR. IEEE Trans. Geosci. Remote Sens. 2015, 53, 1213–1224. [Google Scholar] [CrossRef]
  30. Cao, N.; Lee, H.; Jung, H.C. A phase-decomposition-based PSInSAR processing method. IEEE Trans. Geosci. Remote Sens. 2016, 54, 1074–1090. [Google Scholar] [CrossRef]
  31. Berardino, P.; Fornaro, G.; Lanari, R.; Sansosti, E. A new algorithm for surface deformation monitoring based on small baseline differential SAR interferograms. IEEE Trans. Geosci. Remote Sens. 2002, 40, 2375–2383. [Google Scholar] [CrossRef] [Green Version]
Figure 1. Schematic diagram of surface subsidence prediction at any point in unit mining.
Remotesensing 13 02898 g001
Figure 2. Schematic diagram of center coordinate offset.
Remotesensing 13 02898 g002
Figure 3. Results from simulation of surface deformation. The black rectangle indicates the working face, the red rectangle shows the projection surface of the working face, and the cyan lines show the main section of the observation. The upper panel in the three-dimensional view shows subsidence and the lower panel shows LOS deformation.
Remotesensing 13 02898 g003
Figure 4. Settlement and horizontal movement curves of main sections: (a) subsidence and horizontal movement curve in strike direction; (b) subsidence curve and horizontal movement curve in dip direction. The red dots indicate inflection points.
Remotesensing 13 02898 g004
Figure 5. Scope of goaf. The black rectangle in the lower-right panel is the final goaf to be inverted in this paper. The working face was mined from November 2017 to March 2018, and the mining length was 437 m.
Remotesensing 13 02898 g005
Figure 6. LOS deformation obtained by DS-InSAR.
Remotesensing 13 02898 g006
Figure 7. Comparison of inversion results: upper layer shows the LOS deformation observed by DS-InSAR; lower layer shows the LOS deformation calculated by inversion of the goaf. The red and black rectangles show the real and inverted mining working faces, respectively.
Remotesensing 13 02898 g007
Figure 8. Influence of random LOS errors on the parameter inversion.
Remotesensing 13 02898 g008
Table 1. Inversion results and errors of goaf and PIM parameters.
ParameterSimulatedEstimatedAbsolute ErrorRelative Error
D1 (m)1000999.750.250.03%
D2 (m)500501.671.670.33%
Xc (m)10131010.702.30-
Yc (m)1000999.200.80-
H (m)900893.506.500.72%
φn (°)9090.000.00-
α (°)2524.470.532.11%
m (m)65.930.071.21%
q0.750.750.000.42%
b0.350.350.000.33%
tanβ2.242.230.010.45%
Table 2. Image parameters.
Serial NumberDateVertical Baseline/mTime Baseline/Day
14 November 201700
216 November 201721.3312
328 November 201790.0524
410 December 201749.2436
526 December 201742.5148
63 January 201859.7360
715 January 20181.0072
827 January 201838.5284
98 February 201899.0996
1020 February 201887.94108
114 March 201871.14120
1228 March 201836.35144
Table 3. Inversion results and errors in goaf and PIM parameters.
ParameterSimulatedEstimatedAbsolute ErrorRelative Error
D1 (m)437461.9024.905.70%
D2 (m)160186.5726.5716.61%
Xc (m)395351.9743.03-
Yc (m)265229.0235.98-
H (m)946951.895.890.62%
φn (°)254262.048.04-
α (°)2322.250.753.28%
m (m)2.752.747.890.29%
q0.830.790.044.56%
b0.30.220.0826.67%
tanβ1.81.350.4524.98%
Note: the table does not show the actual coordinates.
Table 4. Inversion results and errors in goaf parameters.
ParametersSimulatedEstimatedAbsolute ErrorRelative Error
D1 (m)1000999.880.120.01%
D2 (m)500499.230.770.15%
Xc (m)10131013.450.45-
Yc (m)10001000.080.08-
H (m)900901.151.150.13%
φn (°)9090.000.00-
α (°)2525.210.210.85%
m (m)60.030.030.53%
Publisher’s Note: MDPI stays neutral with regard to jurisdictional claims in published maps and institutional affiliations.

