Article

Effect of Lunar Complex Illumination on In Situ Measurements Obtained Using Visible and Near-Infrared Imaging Spectrometer of Chang’E-4

1
Key Laboratory of Space Active Opto-Electronics Technology, Shanghai Institute of Technical Physics, Chinese Academy of Sciences, Shanghai 200083, China
2
Key Laboratory of Infrared System Detection and Imaging Technology, Shanghai Institute of Technical Physics, Chinese Academy of Sciences, Shanghai 200083, China
3
School of Information Science and Technology, ShanghaiTech University, Shanghai 201210, China
4
Key Laboratory of Earth and Planetary Physics, Institute of Geology and Geophysics, Chinese Academy of Sciences, Beijing 100029, China
5
School of Physics and Optoelectronic Engineering, Hangzhou Institute for Advanced Study, University of Chinese Academy of Sciences, Hangzhou 310024, China
*
Author to whom correspondence should be addressed.
These authors contributed equally to this work.
Remote Sens. 2021, 13(12), 2359; https://doi.org/10.3390/rs13122359
Submission received: 18 May 2021 / Revised: 11 June 2021 / Accepted: 13 June 2021 / Published: 16 June 2021
(This article belongs to the Special Issue Lunar Remote Sensing and Applications)

Abstract

:
In-situ measurements of the spectral information on the lunar surface are of significance to study the geological evolution of the Moon. China’s Chang’E-4 (CE-4) Yutu-2 rover has conducted several in-situ spectral explorations on the Moon. The visible and near-infrared imaging spectrometer (VNIS) onboard the rover has acquired a series of in-situ spectra of the regolith at the landing site. In general, the mineralogical research of the lunar surface relies on the accuracy of the in-situ data. However, the spectral measurements of the Yutu-2 rover may be affected by shadows and stray illumination. In this study, we analyzed 106 CE-4 VNIS spectra acquired in the first 24 lunar days of the mission and noted that six of these spectra were affected by the shadows of the rover. Therefore, a method was established to correct the effects of the rover shadow on the spectral measurements. After shadow correction, the FeO content in the affected area is corrected to 14.46 wt.%, which was similar to the result calculated in the normal regolith. Furthermore, according to the visible images, certain areas of the explored sites were noted to be unusually bright. Considering the reflectance, geometric information, and shining patterns of the multi-layer insulation (MLI), we examined the influence of the specular reflection of the MLI on the bright spot regionsd, and found that the five sets of data were likely not affected by the specular reflection of the MLI. The results indicated that the complex illumination considerably influences the in situ spectral data. This study can provide a basis to analyze the VNIS scientific data and help enhance the accuracy of interpretation of the composition at CE-4 landing sites.

1. Introduction

The reflectance spectra of lunar rocks and soils are used to identify the composition of minerals and their relative abundance. The Chang’E-3 (CE-3) mission was successfully launched on 2 December 2013, and the lander landed to the east of a 430 m crater in northwestern Mare Imbrium ( 19.51 W, 44.12 N) on 14 December 2013 [1]. In the China’s Chang’E-4 (CE-4) mission, the lander successfully landed in the Von Kármán crater of the South Pole—Aitken basin on the far side of the Moon on 3 January 2019 [2,3]. Considering the rock composition identified based on the data acquired by the CE-3 visible and near-infrared imaging spectrometer (VNIS), the researchers inferred that when ferropyroxene-ilmenite cumulates sank and mixed with the relatively deep ferrous olivine and orthopyroxene in a mixed mantle source, the basalt source rock was formed during the late magma-ocean differentiation [4]. Moreover, it was considered that materials at the CE-4 landing site may represent deep-seated materials, delivered to this site by ejecta from the Finsen crater [2,5,6,7,8].
Notably, the multi-layer insulation (MLI) wrapped around the outside of the rover and lander and the rover’s shadow likely affect the accuracy of the quantitative analysis based on the VNIS data. The results of ground simulation experiments performed under a specific solar altitude angle and different azimuth angles highlighted the effects of the shadow, specular reflection, and diffuse reflection on the imaging data [9]. Currently, researchers have focused on CE-3 VNIS data that in-situ detection can be constrained by the observation angles and surface roughness and unevenness, resulting in significant small-area shadow effects [10]. However, no studies have been conducted to examine the effects of large- area shadow occlusion caused by the illumination angle as well as the orientation of the rover. In the CE-4 photometric analysis, Lin found differences between the data characteristics and the minerals, and speculated that they might be influenced by stray illumination introduced by the MLI [11]. In general, when the CE-4 Yutu-2 rover advances, the VNIS simultaneously selects suitable observation points for spectral detection [3]. During operation on the lunar surface, considering the routes and areas of interest, it is hard to avoid the influence of shadows and stray illumination on the observation results. At certain observation angles (solar altitude angle and relative azimuth angle), the MLI reflected solar radiation, as shown in Figure 1a, and its specular reflection produce abnormally bright areas. In this study, we mainly focused on the specular reflection paths, from MLI to the lunar surface which was detected by VNIS, providing the basic analyzation for the MLI effects, as shown in Figure 1b. Furthermore, the shadows of the rover body may project onto the lunar surface at certain geometric angles and may also enter the VNIS detection area.
Considering these aspects, in this study, the data obtained by the VNIS and method to calculate the reflectance factor (RADF) [12] were considered. Because the rover shadows and MLI specular reflection spots can be easily distinguished in visible near-infrared (VIS/NIR) images, we focused on the spectral image data in the 450–945 nm band. The spectra of the specular reflection and diffuse reflection of the MLI F46 films were obtained through laboratory testing. Subsequently, based on the statistics of the first 24 lunar days of CE-4, we examined the effect of the large shadows generated by the rover on the VNIS in-situ data. In general, in the presence of considerable extensive shadows, the average reflectance of the image is low, which might affect the matter composition analysis based on the reflectance spectra. Finally, we proposed a method to determine whether the bright spot areas were affected by stray illumination introduced by the specular reflection of the MLI by considering the reflectance, geometric information, and shining patterns of the MLI.

2. Data and Methods

2.1. Chang’E-4 Spectral Data and Preprocessing

Under variations in the solar illumination and differences in the observation geometry, solar radiation may be reflected by the MLI wrapped around the rover, and shadows of the rover may be generated. These phenomena influence the data obtained from the detection area of the spectrometer. To clarify the effects of the complex illumination aspects, the angle information and spectral data must be considered. CE-3 and CE-4 adopt the same VNIS for target detection. On the first two lunar days, the CE-3 Yutu rover carried the VNIS, which obtained measurements in four areas. In the detection mode, four sets of data were obtained [13]. On 6 April 2021 (UTC), the CE-4 lander and Yutu-2 rover entered the 29th lunar day work period. The Yutu-2 rover has traveled approximately 682.8 m. In the first 24 lunar days, VNIS obtained 106 sets of spectral data under different light geometries. The amount of data detected by the CE-3 VNIS is smaller, and no effect of the rover body or MLI can be observed in the VIS/NIR images. Therefore, we examined the data obtained by the CE-4 VNIS.
The CE-4 VNIS is installed at the front of the Yutu-2 rover at a height of approximately 0.7 m, looking down at the lunar surface at 45 , as shown in Figure 2. The size of the observation area is ∼15 × 21 cm [14]. The device contains two channels: a VIS/NIR channel and a short-wave infrared (SWIR) channel. Single-band spectral or image information is passed through an acousto-optic tunable filter (AOTF) to form quasi-monochromatic light of a specific wavelength, which is then converged to the detector. The wavelength is selected by varying the drive frequency applied to the AOTF to obtain the spectral or imaging data in all wavelength bands [15,16]. The VIS/NIR channel adopts a complementary metal-oxide semiconductor (CMOS) array detector to obtain data in the wavelength range of 450 nm∼945 nm, with a sampling interval of 5 nm; 100 bands of data are obtained at a spectral resolution of 2∼10 nm. The SWIR channel involves a InGaAs unit detector to obtain data in the wavelength range of 900 nm∼2395 nm wavelength range, with a sampling interval of 5 nm; 300 bands of data are obtained at a spectral resolution of 3∼12 nm [15,16]. The field of view of the SWIR detector is a circle with a diameter of 107.6 CMOS pixels, and the center located at sample 98, line 127.5 of the CMOS imager field of view [15]. The uncertainties in the CMOS imager and SWIR detector spectral calibrations are ±0.39 nm and ±0.62 nm, respectively [15,17]. The uncertainties in the corresponding radiometric calibrations were 4.97% and 6.63% [15].
The VNIS 2B data used in this study were subjected to dark current and scattering background deductions, flat field and instrumental temperature corrections, and radiometric and geometric corrections by using the Ground Research and Application System (GRAS) of the Chinese Lunar Exploration Program [2,18]. The RADF data were calculated using a solar irradiance-based calibration method involving the following steps [19,20,21]. First, the scientific data were read frame by frame, and the average value was determined as the single-band radiance data. The irradiance data of the other bands were calculated and finally stitched into a complete VNIS irradiance spectral curve L, in units of W·m 2 sr 1 nm 1 . Next, the reflectance was obtained by its ratio to the solar spectral irradiance data F by using Equation (1) [18,22]. The distance d between the Sun and Moon was considered to be approximately 1 AU [23].
R A D F ( i ) = π × L ( i ) × d 2 F ( i ) , i = 1 , 2 , 3 100
The main angle information was obtained by reading the tag data corresponding to the auxiliary file, including the solar altitude angle (90 -solar incidence angle), solar incidence azimuth angle, emergence azimuth angle, and relative azimuth angle obtained of the two parameters.
Figure 2, shows that at certain geometric angles, the rover body produces shadows on the lunar surface, and the reflectance measurements exhibit significantly low values. In addition, the MLI exhibits specular reflection, and the reflected solar radiation enters the VNIS detection area. The reflectance measurement is thus biased, and notable brightness anomalies may be found in the VIS/NIR image.
In general, the MLI, applied to the exterior of the Yutu-2 rover to reduce the heat exchange between the rover and solar radiation, lunar surface reflection, and cold space, consists of F46 auxiliary surface mirrors. The reflectivity of the MLI F46 film wrapped around the outside of Yutu-2 was measured in the laboratory to provide a reference for subsequent studies. The test procedure is described in the following sections.

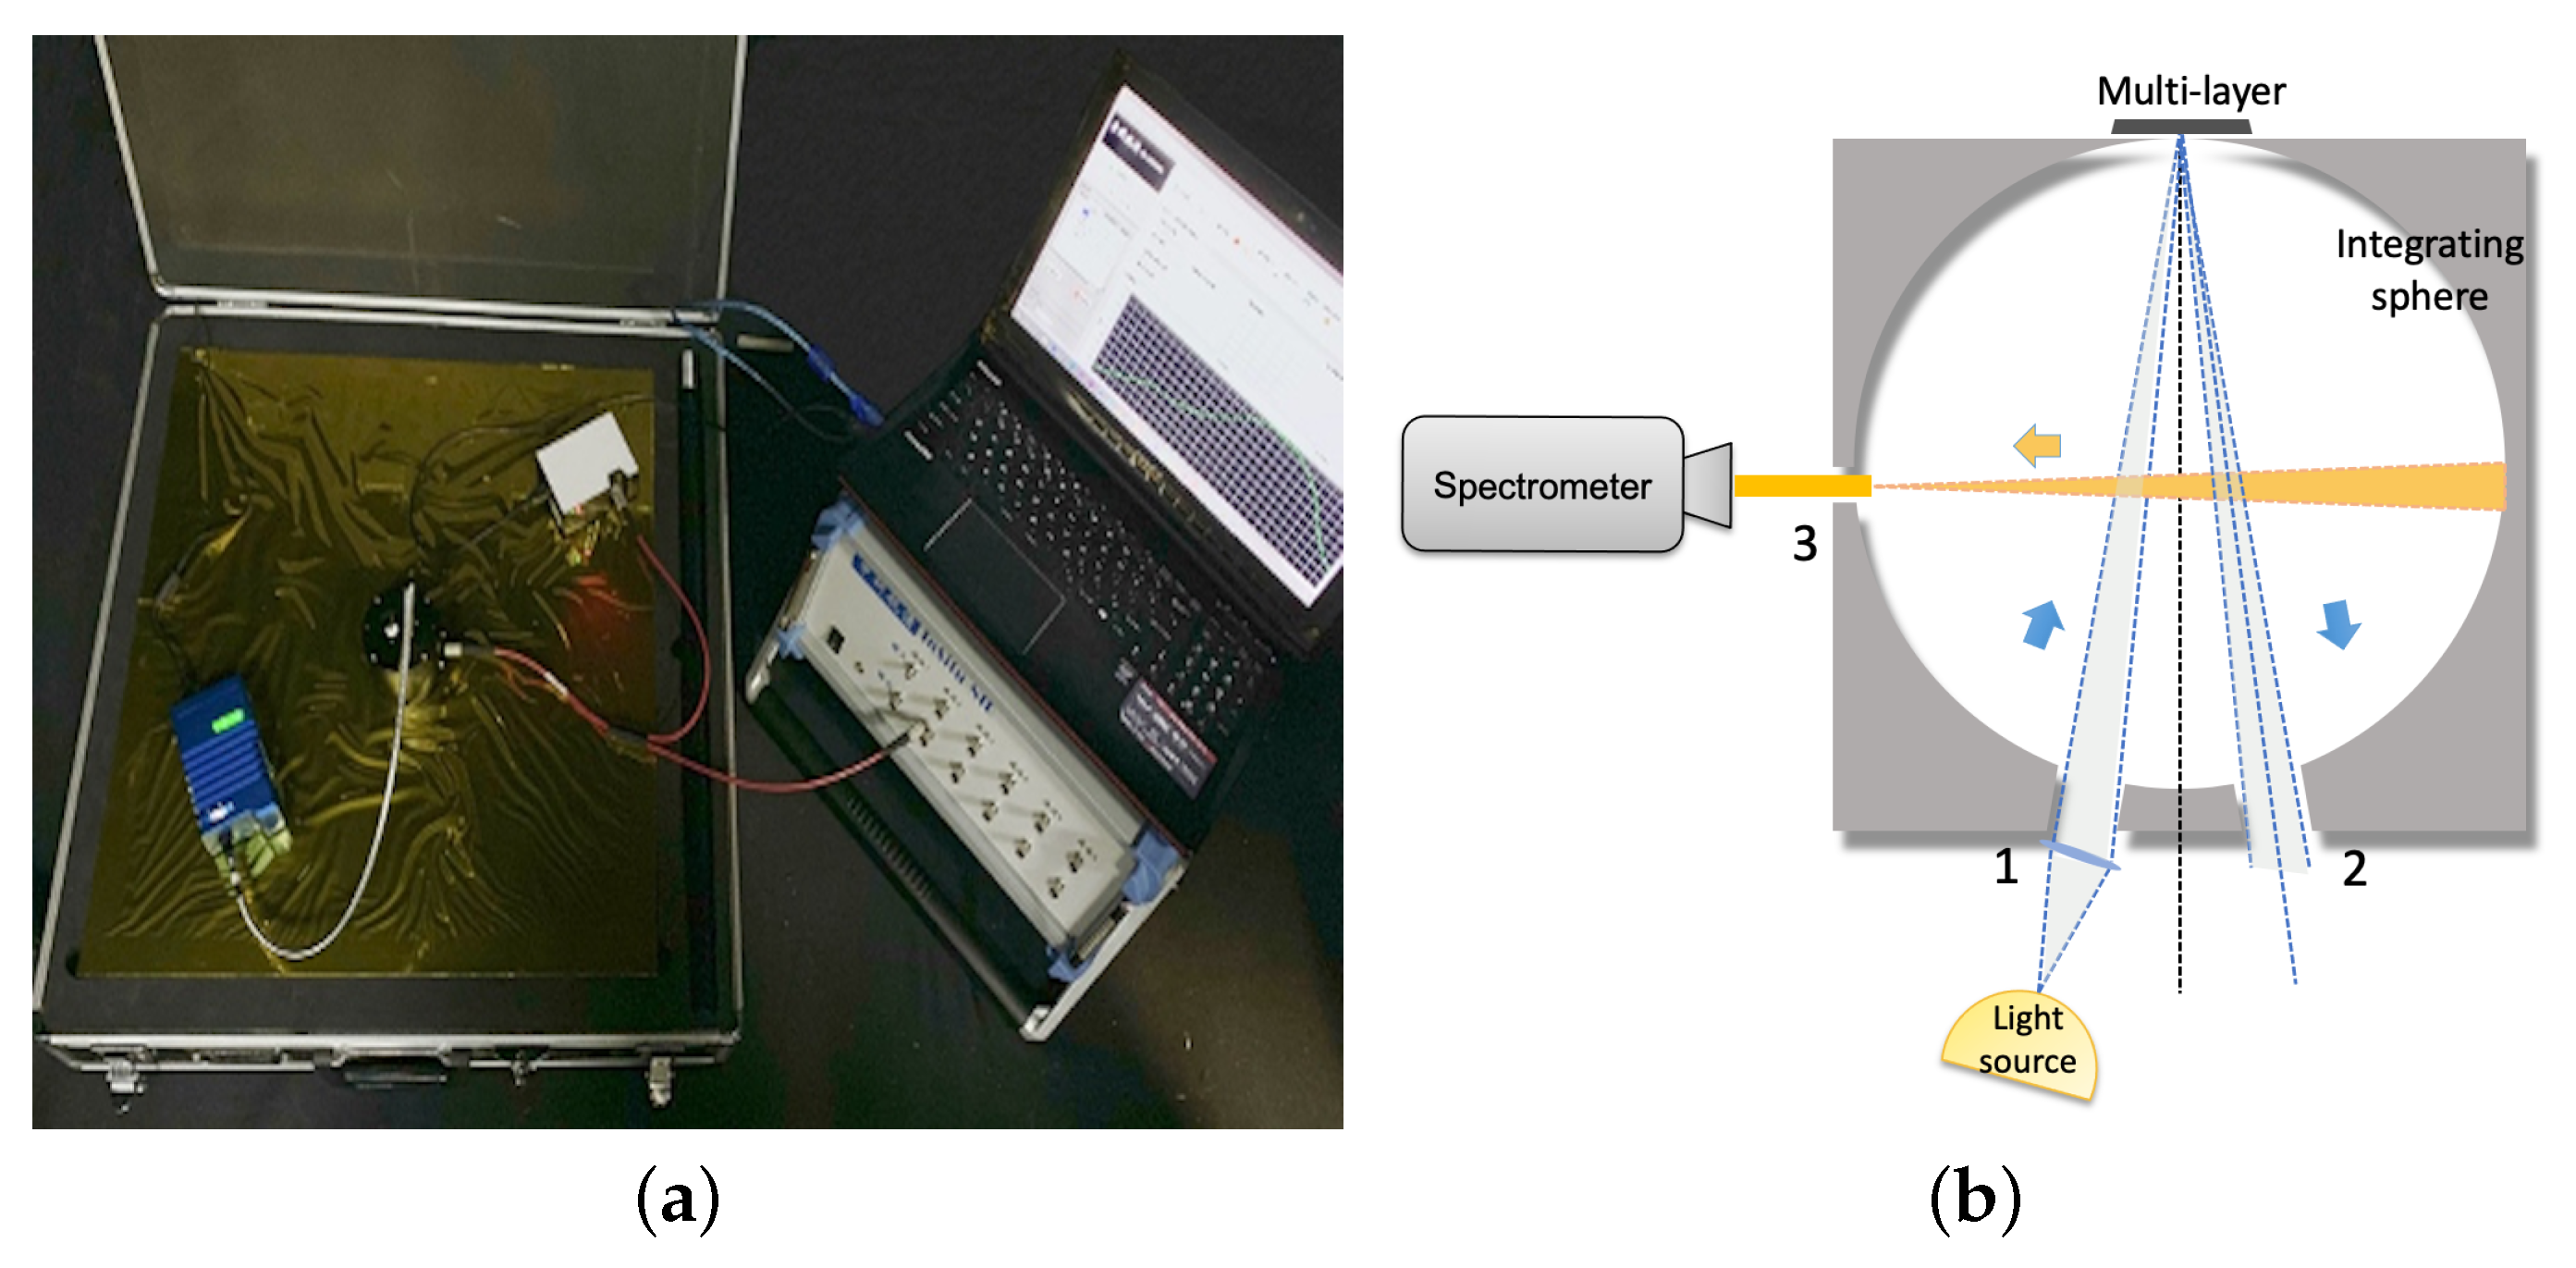
2.2. Laboratory Testing of F46 Film Spectrum

The experimental test system consisted of a halogen lamp, an optical fiber, an integrating sphere, a spectrometer, and the F46 film. A broad-spectrum halogen lamp was used as the light source, and a 600 μ m optical fiber transmitted the optical signal. The detection target, that is, the F46 film has a strong specular reflection and weak diffuse reflection, and thus, the reflected light was collected using a diffuse integrating sphere. The grating type spectrometer was used to evaluate the light emitted from the integrating sphere. The principle is shown in Figure 3: The incident light from the light source passed through the optical fiber from window-1 into the integrating sphere. An exit window-2 was present in the integrating sphere, symmetric with the incident window-1. It was necessary to evaluate the diffuse reflection spectrum of the F46 film, as well as the superimposed spectrum of the diffuse reflection and specular reflection. When measuring the superposition of the specular reflectance and diffuse reflection, window-2 was closed. In this configuration, the specularly reflected light together with the diffuse reflected light were collected by the integrating sphere by the outgoing fiber (from window-3) into the spectrometer. To measure only the diffuse reflection of the F46 film, window-2 was opened. In this configuration, the specular reflectance light was emitted directly from the integrating sphere, and only the diffuse spectrum of the F46 film was measured. Finally, we obtained the diffuse reflection spectra of the F46 film and the spectra of the specular reflection superimposed on the diffuse reflection in the band of 450–2300 nm.
Furthermore, in the experiments, a diffuse reflectance integrating sphere was used to ensure traceability to a standard reflectance plate. The digital number (DN) value of the diffuse reflectance of the standard reflectance plate and that of the F46 film when the reflection occurred were measured separately. In addition, a set of dark noise data was tested without light incidence. The specular reflection and specular reflection superimposed on the diffuse reflection were measured by opening and closing window-2. The final conversion from DN value to reflectance is achieved by the comparison method.
The experimental layout is shown in Figure 3.
To ensure the accuracy of the data, we conducted several experiments at different integration times to eliminate the errors caused by the nonlinearity of the detector.
Through the above mentioned experiment, we obtained the reflectance curves of the specular reflection and diffuse reflection of the F46 film. As shown in Figure 4, the reflectance characteristics of the F46 film are relatively distinct. The reflectance curve tends to be flat in the visible band 0.4–0.7 μ m and infrared band. A distinct broad absorption appears at 0.75–0.85 μ m, and this feature is used to analyze the influence of the specular reflections from the F46 film on the spectral data collected during the first 24 lunar days by the VNIS.

3. Results and Discussion

Based on the laboratory test data and in-situ geometric angle and spectral data, we investigated the effect of the MLI specularly reflected solar radiation and rover shadow on the VNIS data. It was noted that the VNIS will be affected by the MLI and shadow at a specific angle, owing to which, the reflectance of the affected area is significantly different from that of the normal area. Moreover, these aspects considerably influence the quantitative analysis of the data. Therefore, we performed a statistical analysis of the geometric angle information obtained in the first 24 lunar days and examined the effect of shadows and stray illumination on the in-situ spectral data by analyzing the spectral images and data.

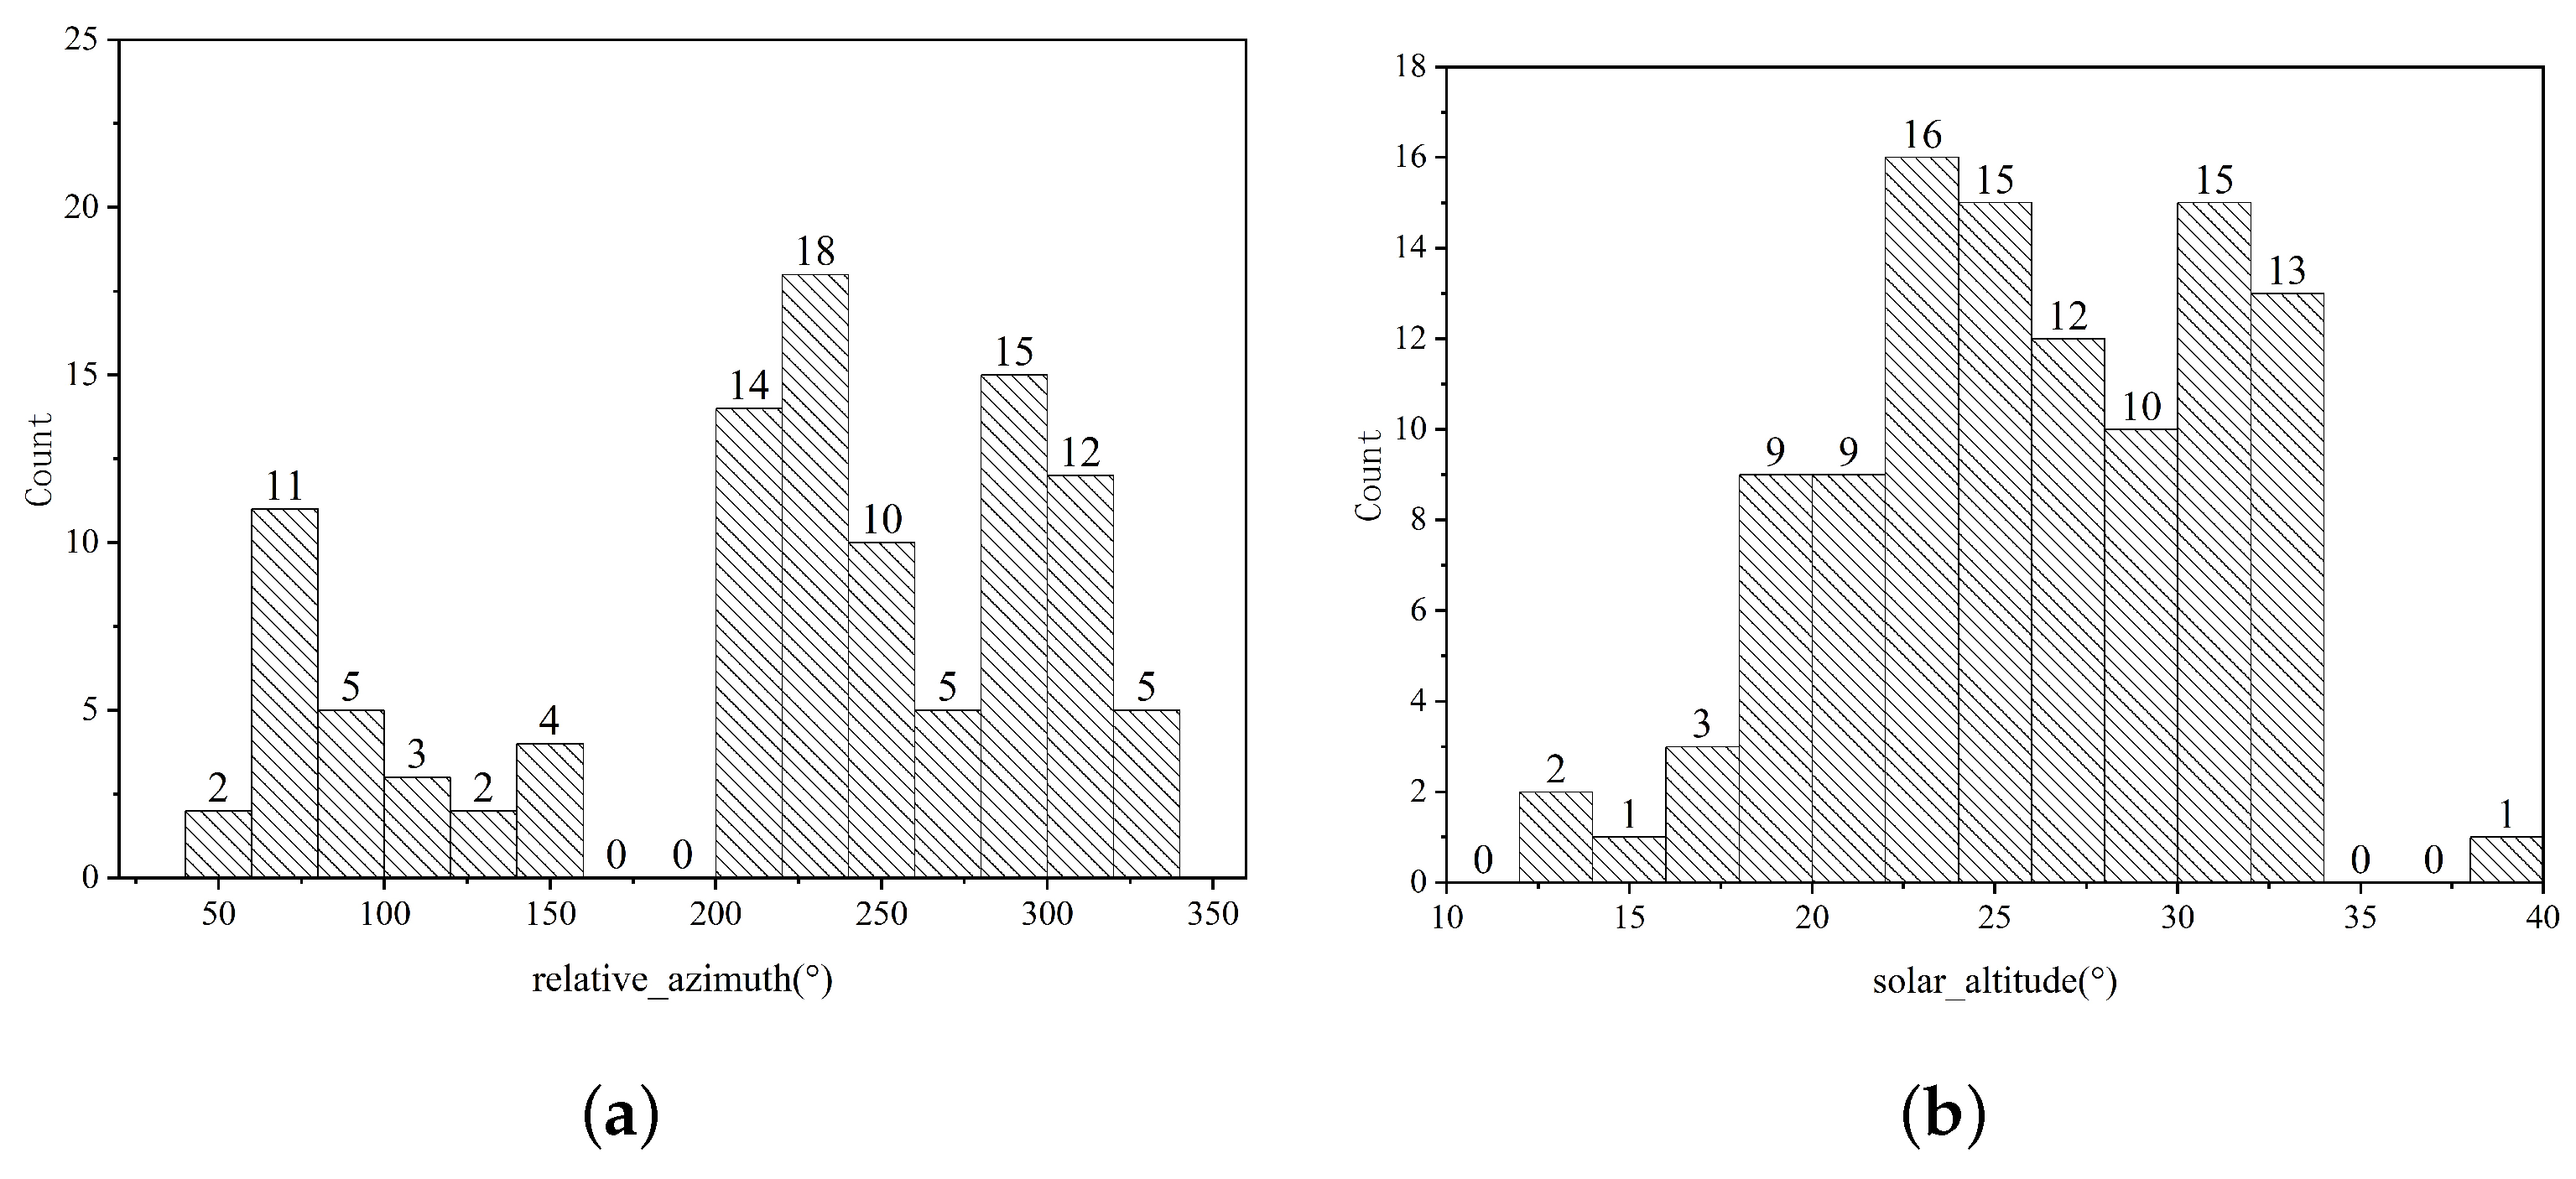
3.1. Statistics of Illumination and Observation Geometry
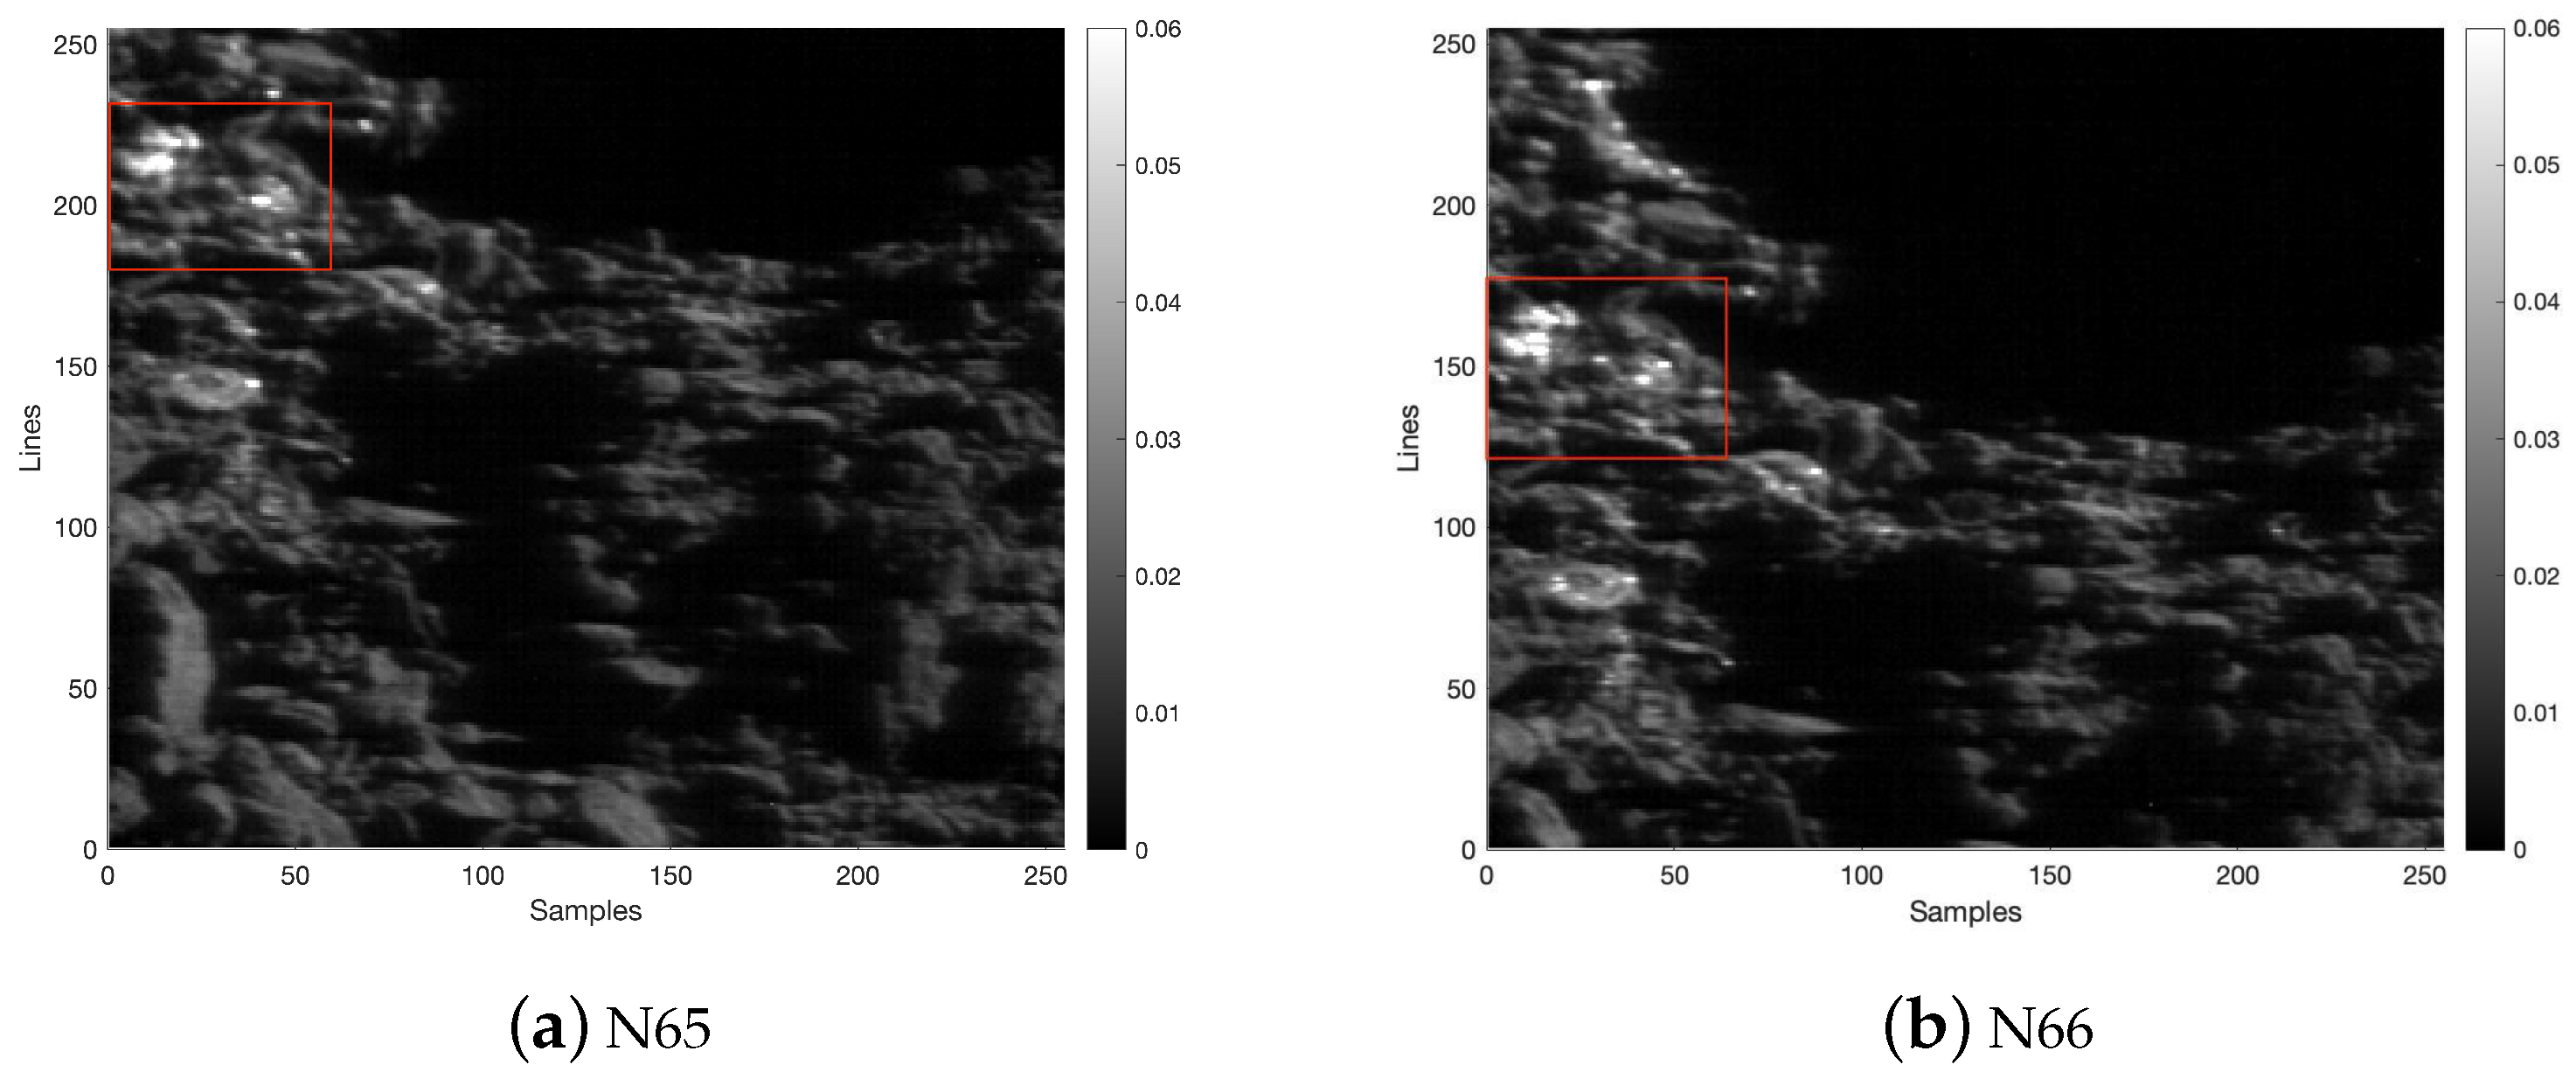
To investigate the angle relationship between the illumination and rover orientation, we conducted a statistical analysis based on the auxiliary information for the first 24 lunar days. There were 106 sets of data on the whole, and through statistical analysis, the solar altitude angle ranged from 12 ∼39 and the relative azimuth angle ranged from 56 ∼328 . The relative azimuth angle was calculated by the solar azimuth angle minus the emission azimuth angle, and the negative values added 360 to limit the range of the relative azimuth to 0∼360 . The statistical histograms are shown in Figure 5.

3.2. Shadow Effect

The observation area is affected by the shadow of the rover owing to the geometric relationship among the orientation of the rover, solar altitude angle, and relative azimuth angle of the incident light and emission light. Six sets of images exhibited notable large-area shadowing effects (Table 1). In this study, we primarily analyzed the large-area shadows caused by the rover occlusion, as shown in Figure 6.
In general, to calculate the reflectance of the VIS/NIR band, we considered the average value of the complete image as the reflectance of this band. Owing to the effect of the shadows in large areas, the calculated reflectance is extremely low and inconsistent with that for the normal areas. This aspect can introduce a large error in the analysis of the lunar surface mineral composition based on the reflectance. The average reflectance of the normal area can be used as the reflectance of the complete image by discarding the shadow-affected area in the visible band. However, considering the infrared band, we cannot directly distinguish the shadow-affected areas. Therefore, a series of shadow compensation methods must be used to reduce the impact of the wide range of shadows introduced by the rover and enhance the validity of the data. Considering these requirements, we adopted Hu’s [10] method of shadow correction for CE-3 data. In particular, the researchers analyzes the shadow effect in small areas caused by the observation angle in VIS/NIR images. The results indicated that the reflectivity of the shadow area was lower than that of the illuminated area, and after shadow correction, the reflectivity of the image was enhanced by 24 % . Correcting the shading effects could significantly reduce the estimated FeO content by up to 4.9 wt.% [10]. Therefore, we selected the appropriate threshold to divide the shadow-affected and unaffected areas and later calculated the compensation parameters considering the ratio of their reflectance to compensate for the impact.
We selected four sets of data, N30, N39, N56, and N140, as typical examples for the analysis. To distinguish the effect of the shadow areas, R 750 (reflectance at 750 nm) was considered to divide the complete image into shadow areas and normal areas. To determine the threshold value for the shadow region, N30 was considered as an example. The following Figure 7 shows the histogram of the reflectance distribution of the visible image at 750 nm after photometric correction [21]. The most frequent occurrence pertains to the value 0, which represents a large area of notable shadow occlusion in the VIS/NIR image. The first trough appears at a reflectivity of 0.02, and the peak position occurs at a reflectivity of 0.058. Thus, the intermediate value (approximately 0.036) for the trough and peak was considered as the threshold to distinguish the shadow and normal areas. The reflectance range 0.02∼0.036 exists as an excessive band between the shadow and normal areas, and this part was also affected by the shadow. Furthermore, the threshold value was chosen higher not only to remove the large shadowing area but also to remove the “micro” shadows induced by the regolith topography. As shown in Figure 6c, the N56 shadow area occupies almost the complete image, and the results of shadow compensation are not notable. Therefore, this set of data was not considered. The histogram results for the other two sets of data (N39 and N140) were compared using the same method. Reflectance values of 0.023 and 0.025 were selected as the thresholds to distinguish the shadow and normal areas. We obtained the coefficient of reflectivity enhancement by using Equation (2) [10].
k = 1 N i λ = 1 100 R i l l u m i n a t e d λ R λ
where k represents the shadow correction factor, i λ represents the ith band of the VIS/NIR band, and λ is the wavelength corresponding to this band, with an interval of 5 nm. R i l l u m i n a t e d λ denotes the average RADF of the remaining pixels at λ , excluding the shadow region; R λ is the average RADF of the complete image at λ ; and N = 100 denotes the total number of VIS/NIR bands. The correction factor for the whole detection area is wavelength-independent to eliminate the slight variation of different bands. The correction factor was calculated by averaging the factors of VIS/NIR 100 bands. The shadow correction coefficients (k) were calculated to be 1.63, 2.00, and 2.50 for the N30, N39, and N140 data, respectively. After shadow correction, the reflectance spectrum of the VNIS in the VIS/NIR band was significantly enhanced compared to the uncorrected one, as shown in Figure 7.
To verify the results of the shadow compensation correction, we compared the corrected average reflectance with the lunar surface soil reflectance in areas not affected by the shadows. We selected the normal area in N30, as shown in Figure 8a, marked through the red box. However, this area may contain fewer “micro” shadows induced by the regolith topography. So we picked 100 pixels for the red box outside the shadowed region randomly five times and calculated their mean reflectance and standard deviation. The reflectance after shadow correction was compared with that of the complete image, as shown in Figure 8b. The reflectance was considerably enhanced after the shadow correction, although its value was lower than that of the normal area. These findings indicate that researchers can exclude the shaded parts when performing the quantification of the matter composition based on VIS/NIR bands. The value for only the area not affected by the shadows must be considered as the average reflectance of the complete image. Nevertheless, shadow correction must be implemented in the infrared band. The set of data for images that are more than 80 % shaded, such as N56 and N101, must be eliminated.
Furthermore, the FeO content can be calculated considering the VIS/NIR data. We calculated the FeO composition content in N30 based on Lucey’s method [24] to analyze the effect of large shadows on the analysis of the mineral composition. θ F e for the Fe parameter can be calculated using Equation (3) [24,25], and a linear relationship exists between FeO and θ F e , as shown in Equation (4) [21]. It is known from previous studies that the photometric correction of the reflectance are important for the retrieval of the contents of FeO [24]. So the reflectance here were corrected photometrically to the standard viewing geometric angle ( 30 , 0 , 30 ) based on the Lommel-Seeliger empirical model. We used the photometric function parameters obtained by Lin [21].
θ F e = a r c t a n R 950 / R 750 1.23 R 750 0.04
F e O = 14.42 × θ F e 6.884
where R 950 and R 750 represent the reflectance spectra of the VNIS at 950 nm and 750 nm, respectively. The calculated average reflectance was low in N30 when large shadows are present. Moreover, the presence of a negative denominator ( R 750 0.04 ) in the calculation of the Fe parameter θ F e precluded the analysis of its composition. After the shadow correction, the FeO content was 14.46 wt.%, calculated based on the average reflectance of the complete image. For the normal lunar soil area marked by the red rectangle in Figure 8, the FeO content was calculated as 14.60 wt.%. The two values were similar. The results showed that shadow correction is of significance, and the presence of large shadow areas may affect the analysis of the FeO contents.

3.3. MLI Effect

We analyzed the VIS/NIR images of 106 sets of data for the first 24 lunar days, among which five sets of data (N65, N66, N130, N131, and N132) were noted to have obvious bright spots or bright areas. We speculated that these spots could be attributed to the solar radiation reflected from the MLI entering the VNIS detection field. Note that N65 and N66 represent two consecutive detections performed on the ninth lunar day. N130, N131, and N132 represent three consecutive detections performed on the nineteenth lunar day. The geometric angle information is summarized in Table 2.
We analyzed the data sets N130, N131, and N132. We determined whether the detection area was affected by stray light from the MLI considering three aspects: (1) relationship between the illumination angle and vehicle body orientation; (2) comparison of the VIS/NIR images of nearby detections; (3) comparison of the average reflectance spectra of the abnormal region with the reflectance spectra of the MLI, measured in the laboratory. First, we compared the azimuth angles of the incident and emission light for the three sets of data and schematically illustrated the corresponding angle relationships. As shown in Figure 9, the Sun rays were incident from the rear left of the rover body. Consequently, the stray illumination introduced by the specular reflection of the MLI did not enter the detection area. Therefore, the bright spots were likely not caused by the stray illumination. To verify this aspect, we selected the bright spot areas and compared the average reflectance spectrum with the reflectance curve of the F46 film measured in the laboratory. If the stray light effects were indeed present, the reflectance spectrum of the bright spot region was expected to be superimposed with the reflectance characteristics of the F46 film. We selected these abnormal brightness regions and obtained their average RADF curves by using Equation (1). Next, we smoothed the reflectance data by using the cubic splines method with a smoothing parameter of 0.9999 [26]. Furthermore, we compared the reflectance through normalization ( R i n o r m a l i z a t i o n = R i / i = 1 i = n R i [11], where i is the number of bands). According to Figure 10, the F46 film exhibits a wide absorption at 750–850 nm, whereas the average reflectance spectrum of the bright spot region does not exhibit such an absorption feature. These two aspects demonstrate that the apparent bright spots in this region were not caused by the stray illumination introduced by the specular reflection of the MLI.
Next, we analyzed the geometric angles for N65 and N66 and noted that the solar illumination and VNIS detection directions were similar. The relevant values were calculated using the coordinate information of the vehicle and detection area pertaining to the 2BL, with the vehicle moving 7 cm backward and forward for the two detections. The area marked by the red box in Figure 11 represented the area in which the bright spot appeared for two consecutive detections; it was observed that the bright spot appeared in the same lunar soil area. According to the analysis, the bright spot area was expected to shift if stray light was introduced by the MLI after the rover moved. We speculated that the bright spot area was not likely caused by the stray light introduced by the specular reflection of the MLI. In a previous study, researchers analyzed data from the ninth lunar day detection and reported the presence of glass in the pit fragments [11]. Consequently, we considered that this abnormally bright region in the VIS/NIR images may be the micro specular reflection of the glass. Notably, because of the solar incidence from the front of the rover, the impact of scattered light from the MLI could not be excluded in this area. The effect of MLI may also be superimposed on the glass spectra with high albedo features, resulting in a broad absorption feature near 800 nm, as described in Lin [11].
In general, if notably bright areas are observed in a VIS/NIR image of the VNIS, it must be analyzed considering three aspects to established the influence of the specular reflection of the MLI. First, the relationship between the illumination angle and vehicle body orientation must be considered. Only when the solar light is incident from the front of the rover is there a possibility of the specular reflection of the MLI entering the detection area. Second, we must consider the absorption properties of the spectra. We measured the reflection spectra of the MLI in the laboratory. If specular reflection occurs, the absorption characteristics of the MLI should be superimposed on the area affected by the stray light. For example, as mentioned previously, the F46 film exhibits a wide absorption at 750–850 nm. Third, in the presence of continuous detections such as N65 and N66 with similar illumination angles, the VIS/NIR images must be considered for the analysis. Under the same illumination conditions, if stray light is introduced by specular reflection, the bright spot should shift with the rover movement.

4. Conclusions

The Yutu-2 rover of the CE-4 mission has performed notable explorations on the lunar surface and obtained considerable scientific data. We performed laboratory tests and in-flight data validation to demonstrate that the complex illumination in the lunar environment, including the shadows of the rover, affect the spectra data of the VNIS. This influence may introduce errors in the quantitative analysis of the VNIS spectra data. The following key conclusions were derived:
(1)
Six sets of data pertaining to the VIS/NIR images obtained in the first 24 lunar days involved large shadows caused by the rover occlusion. The shadow correction significantly improved the reflectance of the affected images and influenced the interpretation of the FeO composition. We analyzed the data from statistical and geometric perspectives and concluded that the observation area is more likely to be influenced by the rover occlusion when the relative azimuth angle ranges from 300 ∼320 ;
(2)
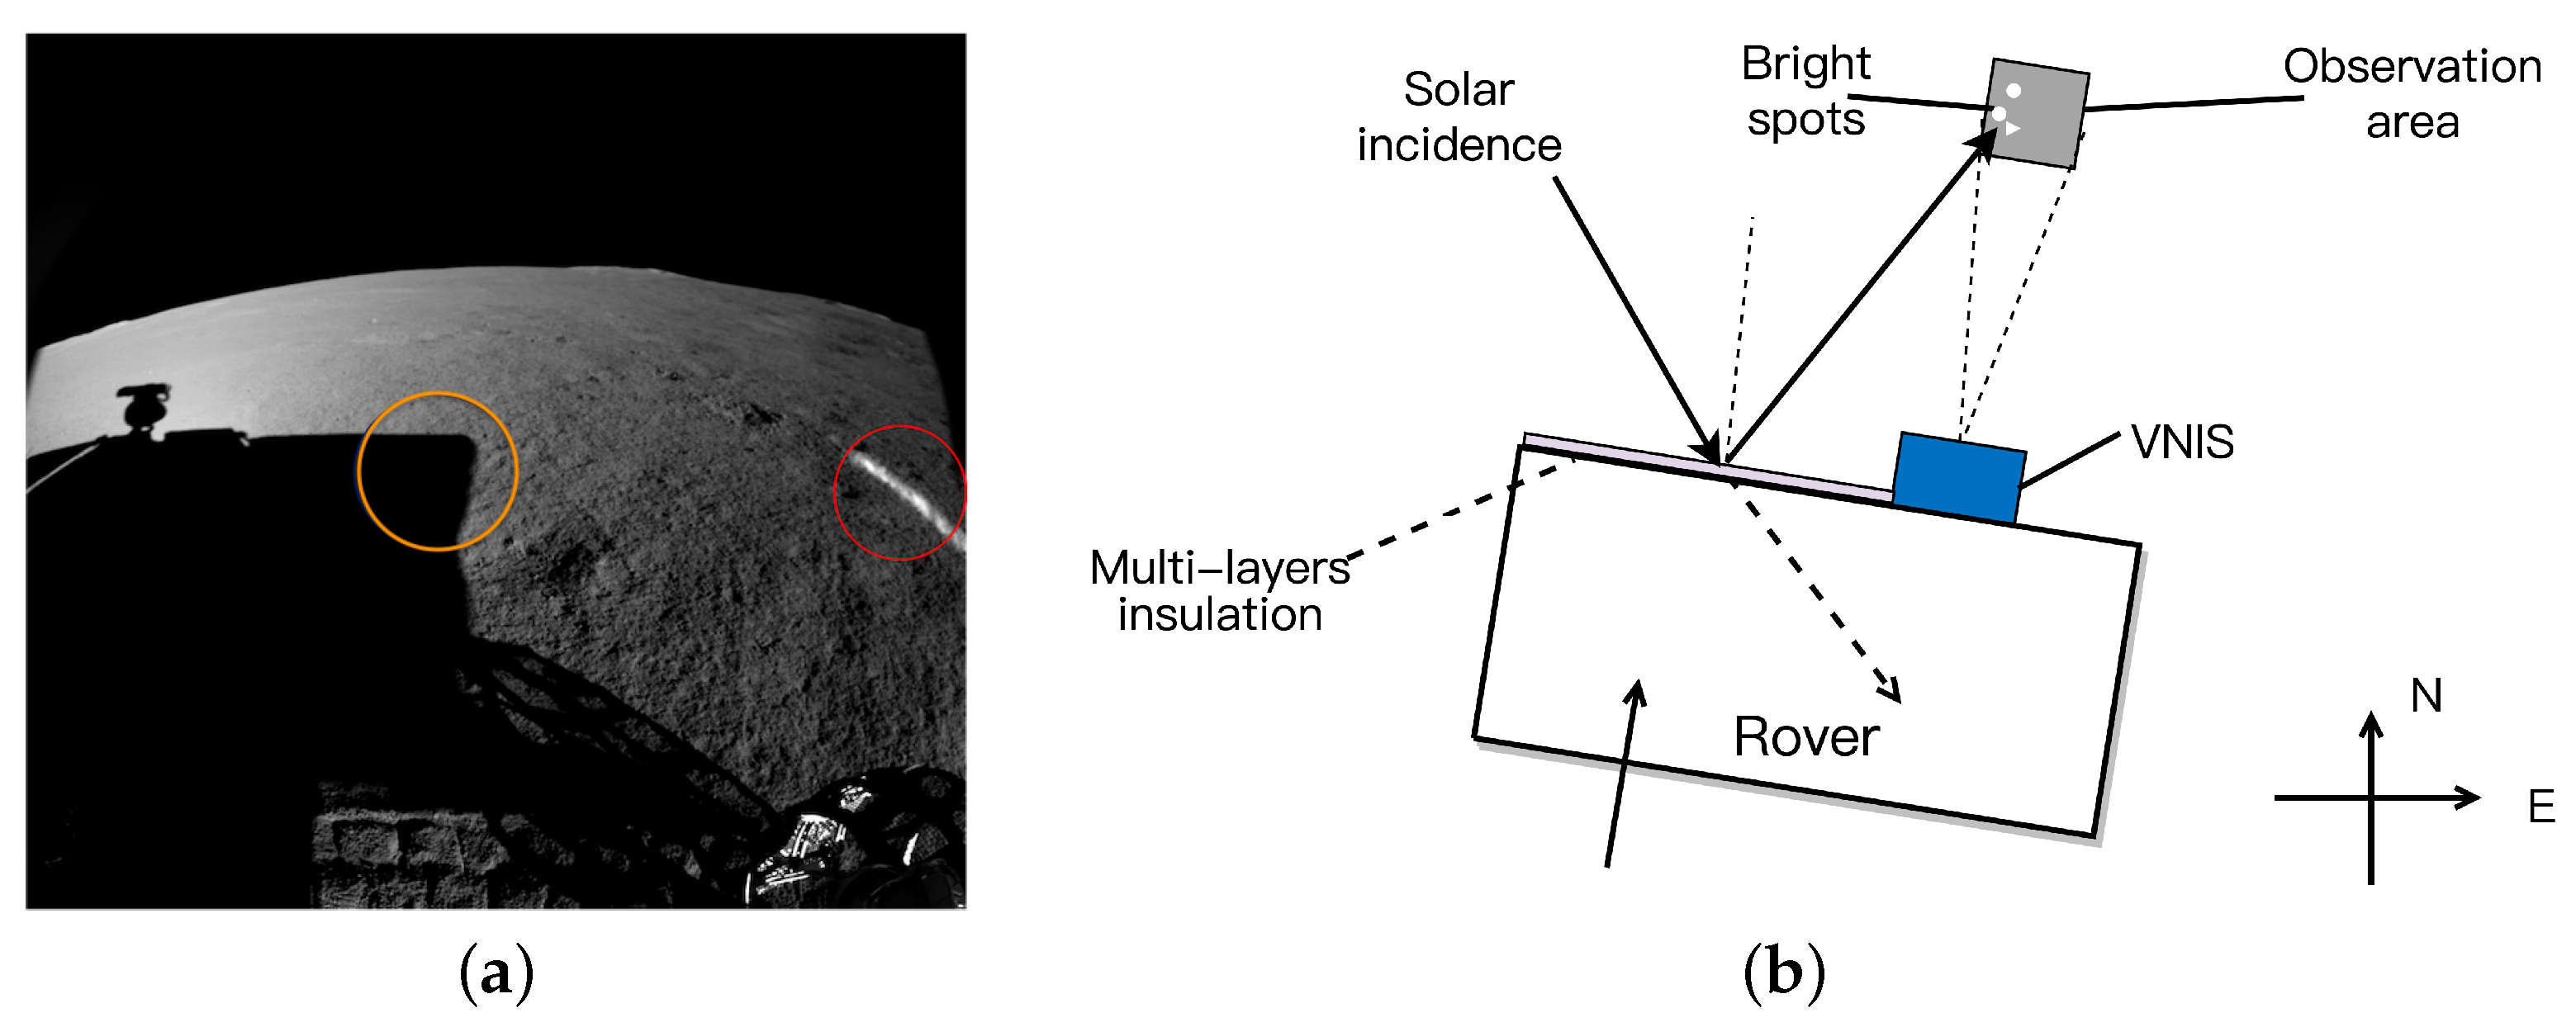
Five sets of data exhibited bright spots that were significantly different from the normal areas. We proposed an analytical method that involved the comprehensive consideration of three aspects to determine the potential influence of the stray light from the specular reflections of the MLI. The results indicated that the five sets of data were likely not affected by the specular reflection of the MLI. However, diffuse reflection of MLI, specular reflection of MLI that entered the detector directly, and stray lights from rover wheels might also affect the spectral images, the influence of these portions needed further analysis in the future.
Overall, we calculated the spectral data for the first 24 lunar days, identified the areas in which the shadows and stray lights may exert a notable influence, and compensated for the shadow effects. The findings can provide a reference for the analysis of VNIS scientific data and help enhance the accuracy of the interpretation of the lunar surface mineral composition.

Author Contributions

Conceptualization, J.X., M.W. and H.L.; Formal analysis, J.X., M.W. and R.W.; Funding acquisition, M.W., R.W. and X.X.; Methodology, J.X., M.W., R.W., Q.F., X.X. and H.L.; Software, R.W. and X.X.; Supervision, Q.F.; Writing—original draft, J.X.; Writing—review and editing, M.W., Q.F. and H.L. All authors have read and agreed to the published version of the manuscript.

Funding

This work was supported by the China Lunar Exploration Program (CLEP) and China National Space Administration (CNSA) and also funded by the National Natural Science Foundation of China (NSFC) (Grant No. 61605231, and No. 11941002), Program of Shanghai Academic/Technology Research Leader (No. 19XD1424100), and Shanghai Outstanding Academic Leaders Plan.

Institutional Review Board Statement

Not applicable.

Informed Consent Statement

Not applicable.

Data Availability Statement

Not applicable.

Acknowledgments

The scientific data are provided by the Science and Application Center for Moon and Deep Space Exploration, Chinese Academy of Science. The data reported in this work are archived at https://moon.bao.ac.cn (accessed on 20 January 2021).

Conflicts of Interest

The authors declare that they have no conflict of interest.

Abbreviations

The following abbreviations are used in this manuscript:
AOTFAcousto-Optic Tunable Filter
CEChang’E
CMOSComplementary Metal-Oxide-Semiconductor
DNDigital Number
GRASGround Research and Application System
MLIMulti-Layer Insulation
RADFReflectance Factor
SWIRShort-Wave Infrared
TCAMTerrain Camera
VNISVisible and Near-Infrared Imaging Spectrometer
VIS/NIRVisible and Near-Infrared

References

  1. Li, C.; Liu, J.; Ren, X.; Zuo, W.; Tan, X.; Wen, W.; Li, H.; Mu, L.; Su, Y.; Zhang, H.; et al. The Chang’e 3 mission overview. Space Sci. Rev. 2015, 190, 85–101. [Google Scholar] [CrossRef]
  2. Li, C.; Liu, D.; Liu, B.; Ren, X.; Liu, J.; He, Z.; Zuo, W.; Zeng, X.; Xu, R.; Tan, X.; et al. Chang’E-4 initial spectroscopic identification of lunar far-side mantle-derived materials. Nature 2019, 569, 378–382. [Google Scholar] [CrossRef]
  3. Li, C.; Zuo, W.; Wen, W.; Zeng, X.; Gao, X.; Liu, Y.; Fu, Q.; Zhang, Z.; Su, Y.; Ren, X.; et al. Overview of the Chang’e-4 Mission: Opening the Frontier of Scientific Exploration of the Lunar Far Side. Space Sci. Rev. 2021, 217, 1–32. [Google Scholar] [CrossRef]
  4. Ling, Z.; Jolliff, B.L.; Wang, A.; Li, C.; Liu, J.; Zhang, J.; Li, B.; Sun, L.; Chen, J.; Xiao, L.; et al. Correlated compositional and mineralogical investigations at the Chang’e-3 landing site. Nat. Commun. 2015, 6, 1–9. [Google Scholar] [CrossRef] [Green Version]
  5. Hu, X.; Ma, P.; Yang, Y.; Zhu, M.H.; Jiang, T.; Lucey, P.G.; Sun, L.; Zhang, H.; Li, C.; Xu, R.; et al. Mineral abundances inferred from in situ reflectance measurements of Chang’E-4 landing site in South Pole-Aitken basin. Geophys. Res. Lett. 2019, 46, 9439–9447. [Google Scholar] [CrossRef]
  6. Gou, S.; Di, K.; Yue, Z.; Liu, Z.; He, Z.; Xu, R.; Lin, H.; Liu, B.; Peng, M.; Wan, W.; et al. Lunar deep materials observed by Chang’e-4 rover. Earth Planet Sci. Lett. 2019, 528, 115829. [Google Scholar] [CrossRef]
  7. Lin, H.; He, Z.; Yang, W.; Lin, Y.; Xu, R.; Zhang, C.; Zhu, M.H.; Chang, R.; Zhang, J.; Li, C.; et al. Olivine-norite rock detected by the lunar rover Yutu-2 likely crystallized from the SPA-impact melt pool. Natl. Sci. Rev. 2020, 7, 913–920. [Google Scholar] [CrossRef] [Green Version]
  8. Huang, J.; Xiao, Z.; Xiao, L.; Horgan, B.; Hu, X.; Lucey, P.; Xiao, X.; Zhao, S.; Qian, Y.; Zhang, H.; et al. Diverse rock types detected in the lunar South Pole–Aitken Basin by the Chang’E-4 lunar mission. Geology 2020, 48, 723–727. [Google Scholar] [CrossRef]
  9. Tao, D.; Jia, G.; Zhao, H. End-to-end simulation model of rover-based hyperspectral remote-sensing systems: Application to VNIS. Int. J. Remote Sens. 2014, 35, 7279–7302. [Google Scholar] [CrossRef]
  10. Hu, S.; Lin, Y.T.; Liu, B.; Yang, W.; He, Z.P.; Xing, W.F. Reflectance calibration and shadow effect of VNIS spectra acquired by the Yutu rover. Res. Astron. Astrophys. 2015, 15, 1587. [Google Scholar] [CrossRef]
  11. Lin, H.; Lin, Y.; Yang, W.; He, Z.; Hu, S.; Wei, Y.; Xu, R.; Zhang, J.; Liu, X.; Yang, J.; et al. New insight into lunar regolith-forming processes by the lunar rover Yutu-2. Geophys. Res. Lett. 2020, 47, e2020GL087949. [Google Scholar] [CrossRef]
  12. Hapke, B. Theory of Reflectance and Emittance Spectroscopy; Cambridge University Press: Cambridge, UK, 2012. [Google Scholar]
  13. He, Z.; Xu, R.; Li, C.; Lv, G.; Yuan, L.; Wang, B.; Shu, R.; Wang, J. Visible and near-infrared imaging spectrometer (VNIS) for in-situ lunar surface measurements. In Sensors, Systems, and Next-Generation Satellites XIX; International Society for Optics and Photonics: Toulouse, France, 2015; Volume 9639, p. 96391S. [Google Scholar]
  14. Yang, Y.; Lin, H.; Liu, Y.; Lin, Y.; Wei, Y.; Hu, S.; Yang, W.; Xu, R.; He, Z.; Zou, Y. The effects of viewing geometry on the spectral analysis of lunar regolith as inferred by in situ spectrophotometric measurements of Chang’E-4. Geophys. Res. Lett. 2020, 47, e2020GL087080. [Google Scholar] [CrossRef]
  15. Li, C.; Xu, R.; Lv, G.; Yuan, L.; He, Z.; Wang, J. Detection and calibration characteristics of the visible and near-infrared imaging spectrometer in the Chang’e-4. Rev. Sci. Instrum. 2019, 90, 103106. [Google Scholar] [CrossRef] [Green Version]
  16. He, Z.; Li, C.; Xu, R.; Lv, G.; Yuan, L.; Wang, J. Spectrometers based on acousto-optic tunable filters for in-situ lunar surface measurement. J. Appl. Remote Sens. 2019, 13, 027502. [Google Scholar]
  17. He, Z.P.; Wang, B.Y.; Lv, G.; Li, C.L.; Yuan, L.Y.; Xu, R.; Liu, B.; Chen, K.; Wang, J.Y. Operating principles and detection characteristics of the Visible and Near-Infrared Imaging Spectrometer in the Chang’e-3. Res. Astron. Astrophys. 2014, 14, 1567. [Google Scholar] [CrossRef]
  18. Liu, B.; Li, C.L.; Zhang, G.L.; Xu, R.; Liu, J.J.; Ren, X.; Tan, X.; Zhang, X.X.; Zuo, W.; Wen, W.B. Data processing and preliminary results of the Chang’e-3 VIS/NIR Imaging Spectrometer in-situ analysis. Res. Astron. Astrophys. 2014, 14, 1578. [Google Scholar] [CrossRef]
  19. Gueymard, C.A. The sun’s total and spectral irradiance for solar energy applications and solar radiation models. Sol. Energy 2004, 76, 423–453. [Google Scholar] [CrossRef]
  20. Wu, Y.; Wang, Z.; Cai, W.; Lu, Y. The absolute reflectance and new calibration site of the Moon. Astron. J. 2018, 155, 213. [Google Scholar] [CrossRef]
  21. Lin, H.; Xu, R.; Yang, W.; Lin, Y.; Wei, Y.; Hu, S.; He, Z.; Qiao, L.; Wan, W. In situ photometric experiment of lunar regolith with visible and near-infrared imaging spectrometer on board the Yutu-2 lunar rover. J. Geophys. Res. Planets 2020, 125, e2019JE006076. [Google Scholar] [CrossRef]
  22. Liu, B.; Liu, J.Z.; Zhang, G.L.; Ling, Z.C.; Zhang, J.; He, Z.P.; Yang, B.Y.; Zou, Y.L. Reflectance conversion methods for the VIS/NIR imaging spectrometer aboard the Chang’E-3 lunar rover: Based on ground validation experiment data. Res. Astron. Astrophys. 2013, 13, 862. [Google Scholar] [CrossRef]
  23. Qi, X.; Ling, Z.; Zhang, J.; Chen, J.; Cao, H.; Liu, C.; Qiao, L.; Fu, X.; He, Z.; Xu, R.; et al. Photometric Normalization of Chang’e-4 Visible and Near-Infrared Imaging Spectrometer Datasets: A Combined Study of In-Situ and Laboratory Spectral Measurements. Remote Sens. 2020, 12, 3211. [Google Scholar] [CrossRef]
  24. Lucey, P.G.; Blewett, D.T.; Jolliff, B.L. Lunar iron and titanium abundance algorithms based on final processing of Clementine ultraviolet-visible images. J. Geophys. Res. Planets 2000, 105, 20297–20305. [Google Scholar] [CrossRef]
  25. Lin, H.; Lin, Y.; Wei, Y.; Xu, R.; Liu, Y.; Yang, Y.; Hu, S.; Yang, W.; He, Z. Estimation of Noise in the In Situ Hyperspectral Data Acquired by Chang’E-4 and Its Effects on Spectral Analysis of Regolith. Remote Sens. 2020, 12, 1603. [Google Scholar] [CrossRef]
  26. De Boor, C.; De Boor, C. A Practical Guide to Splines; Springer: New York, NY, USA, 1978; Volume 27. [Google Scholar]
Figure 1. Image obtained using the obstacle avoidance camera on the fourth lunar day of Chang’E-4 (CE-4) [3]. (a) The area marked by the red circle shows the stray light introduced by the specular reflection of the multi-layer insulation (MLI). The area marked by the yellow circle indicates the projection of the shadow of the rover onto the lunar surface. (b) Light paths of bright spots introduced by MLI specular reflection.
Remotesensing 13 02359 g001
Figure 2. Image of Yutu-2 rover at exploration site A. Visible and near-infrared imaging spectrometer (VNIS) mounted at the front of the rover, marked by the red rectangle in the picture. The VNIS detection area was marked by the white rectangle, which is approximately 1 m below the spectrometer, and less than 5 m from the center of the rover. This figure was obtained from the CE-4 Terrain Camera (TCAM) [1].
Remotesensing 13 02359 g002
Figure 3. (a) Laboratory test setup. (b) Schematic. Numbers 1, 2 and 3 correspond to the three windows. Light source from window 1 entering the integrating sphere.
Remotesensing 13 02359 g003
Figure 4. Diffuse reflection and specular reflection reflectance curve of the F46 film.
Remotesensing 13 02359 g004
Figure 5. Histogram of the distribution of illuminance and observation angle in the first 24 lunar days. (a) Relative azimuth angle statistics, with an interval of 20 . The relative azimuth is the difference in the solar incident light azimuth and emission light azimuth. (b) Solar altitude angle statistics, with an interval of 2 .
Remotesensing 13 02359 g005
Figure 6. Radiance images of the lunar surface observed by the Yutu-2 rover at 750 nm, affected by shadows. All the images are stretched from 0 to 0.05 to illustrate the albedo variation. (af) correspond to image IDs N30, N39, N56, N57, N101 and N140, respectively.
Remotesensing 13 02359 g006
Figure 7. (a) Reflectance histogram of N30 detection area at 750 nm. (b) Shadow-corrected and uncorrected spectra of N30, N39, N140 in the VIS/NIR band after photometric correction.
Remotesensing 13 02359 g007
Figure 8. Comparison of reflectance after shadow correction and normal area reflectance. (a) Radiance image at 750 nm; the red rectangle marks the area in which the normal lunar soil is not obscured by shadows. (b) We randomly chose 100 pixels of the normal areas marked in (a) five times. The blue curve shows the mean reflectance factor (RADF) curve of them and their standard deviation; the reflectance is significantly enhanced after shadow correction.
Remotesensing 13 02359 g008
Figure 9. (ac) Radiance images of lunar surface observed by the Yutu-2 rover. The images are stretched from 0 to 0.08 to illustrate the albedo variation. The red rectangles indicate the obvious bright spot areas. The normal areas were marked by the green rectangle. The image IDs are N130, N131, and N132. (d) Schematic of the angle relationships between the illumination angle and vehicle body orientation.
Remotesensing 13 02359 g009
Figure 10. (ac) Comparison of normalized reflectance in the VIS/NIR band of N130, N131, N132, and F46 film. The arrow indicates the wide absorption (750–850 nm) of the F46 film measured in the laboratory. The bright region marked by the red rectangle in Figure 9 is considered to calculate the average reflectance of the abnormal region.
Remotesensing 13 02359 g010
Figure 11. Radiance images of the lunar surface observed by the Yutu-2 rover at 750 nm. The images are stretched from 0 to 0.06 to illustrate the albedo variation. The image IDs are N65 and N66. The area marked by the red rectangle is the same lunar soil area considered for image matching.
Remotesensing 13 02359 g011
Table 1. Observation angles of data affected by shadows.
Data IDSolar Altitude ( )Solar Azimuth Angle ( )Emission Azimuth Angle ( )Relative Azimuth Angle ( )
N3028.6359.26106.42312.84
N3912.2578.84116.83320.01
N5622.5563.14114.90308.23
N5724.5560.36111.47308.90
N10124.1862.536.1756.35
N14021.0064.94118.14306.80
Table 2. Observation angles for data involving bright spots.
Data IDSolar Altitude ( )Solar Azimuth Angle ( )Emission Azimuth Angle ( )Relative Azimuth Angle ( )
N6519.93293.7257.74235.97
N6619.00292.5557.73234.82
N13021.6866.36356.0070.35
N13127.9057.64356.2861.36
N13228.9755.95356.3159.64
Publisher’s Note: MDPI stays neutral with regard to jurisdictional claims in published maps and institutional affiliations.

