Article

Performance of the IMERG Precipitation Products over High-latitudes Region of Finland

by
Mohammed T. Mahmoud
1,2,
Safa A. Mohammed
1,
Mohamed A. Hamouda
1,3,
Miikka Dal Maso
4 and
Mohamed M. Mohamed
1,3,*
1
Department of Civil and Environmental Engineering, United Arab Emirates University, Al Ain P.O. Box 15551, United Arab Emirates
2
Department of Civil Engineering, University of Khartoum, Khartoum P.O. Box 321, Sudan
3
National Water and Energy Center, United Arab Emirates University, Al Ain P.O. Box 15551, United Arab Emirates
4
Aerosol Physics, Faculty of Natural Sciences, Tampere University of Technology, 33014 Tampere, Finland
*
Author to whom correspondence should be addressed.
Remote Sens. 2021, 13(11), 2073; https://doi.org/10.3390/rs13112073
Submission received: 28 April 2021 / Revised: 18 May 2021 / Accepted: 20 May 2021 / Published: 25 May 2021
(This article belongs to the Special Issue Remote Sensing of Precipitation at the Mid- to High-Latitudes)

Abstract

:
Highly accurate and real-time estimation of precipitation over large areas remains a fundamental challenge for the hydrological and meteorological community. This is primarily attributed to the high heterogeneity of precipitation across temporal and spatial scales. Rapid developments in remote sensing technologies have made the quantitative measurement of precipitation by satellite sensors a significant data source. The Global Precipitation Measurement (GPM) mission makes precipitation data with high temporal and spatial resolutions available to different users. The objective of this study is to evaluate the accuracy of Integrated Multi-satellite Retrievals for GPM (IMERG) V06 (Early, Late, and Final) satellite precipitation products (SPPs) at high latitudes. Ground-based observation data across Finland were used as a reference and compared with IMERG data from 2014 to 2019. Three aspects were evaluated: the spatial coverage of the satellite estimates over Finland; the accuracy of the satellite estimates at various temporal scales (half-hourly, daily, and monthly); and the variation in the performance of SPPs over different spatial regions. The results showed that IMERG SPPs can be used with high confidence over Southern, Eastern, and Western Finland. These SPPs can be used with caution over the region of the historical province of Oulu but are not recommended for higher latitudes over Lapland. In general, the IMERG-Final SPP performed the best, and it is recommended for use because of its low number of errors and high correlation with ground observation. Furthermore, this SPP can be used to complement or substitute ground precipitation measurements in ungauged and poorly gauged regions in Southern Finland.

Graphical Abstract

1. Introduction

Precipitation is a critical component in ensuring a water balance and is a vital element of the hydrological cycle. It is the key factor in the analysis of hydrological processes [1,2]. However, because precipitation is highly dependent on the topographic features and climatic conditions of a specific study area, meteorological authorities have been burdened with the task of obtaining temporally and spatially dense precipitation measurements. Obtaining continuous and reliable ground observations with sufficient spatial and temporal resolutions is challenging because of the operational and maintenance costs [3]. Accurately estimating precipitation over large areas in real-time remains a fundamental challenge for the hydrological and meteorological community owing to the high heterogeneity of precipitation across temporal and spatial scales [4,5,6]. The two main sources of reliable precipitation data are ground-based measurements using rain gauges and radar observations [7]. Rain gauges directly measure precipitation at any given point; however, they cannot represent spatial variations [4,8]. Therefore, different interpolation methods have been adopted to derive the spatial distribution from point-based precipitation values [9,10]. The number and distribution of data points measured in a specific region affect the accuracy of such interpolation methods. Moreover, spatial interpolation leads to accuracy-related errors, particularly in regions where the network of gauges is sparse and scarce [11,12]. Alternatively, ground-based weather radar delivers high resolution and almost constant precipitation measurements spanning large areas depending on the radar spectrum, which is approximately 250 km [13]. However, precipitation data from weather radar are subject to major limitations, such as range-dependent systematic and randomized errors [8,14]. In addition, the data quality can be affected by surrounding obstructions, such as high-rise buildings, mountains, and other topographical features. Furthermore, radar networks are expensive to purchase, install, manage, and repair, which severely limits their availability in many countries around the world. Thus, obtaining reliable precipitation measurements across several climatic/topographic regions remains a challenge.
Recent advances in remote sensing and the use of satellite-dependent technologies has made the quantitative measurement of precipitation by satellite sensors a significant data source [15]. Satellite precipitation products (SPPs) have been proven to provide high spatiotemporal accuracy efficiently. Several SPPs have been made available to users and have been comprehensively evaluated over various climatological and topographical regions, such as the Climate Prediction Center (CPC) MORPHing technique (CMORPH), Precipitation Estimation from Remotely Sensed Information using Artificial Neural Networks (PERSIANN), Tropical rainfall measuring mission Multi-satellite Precipitation Analysis (TMPA), and Integrated Multi-satellitE Retrievals for Global Precipitation Measurement (IMERG) [16,17,18,19,20]. The coverage and availability of precipitation data with such high spatial and temporal resolutions have provided an alternative data source, particularly for regions with data scarcity. Furthermore, the data provide global coverage with subdaily intervals that, in many cases, surpass those used in traditional ground-based measurements.
NASA released the Tropical Rainfall Measuring Mission (TRMM) satellite at the end of 1997. This satellite provides the TMPA SPP, which has been made available to the public and covers regions between 50° N and 50° S. The precipitation estimates are provided with fine spatial (0.25° longitude × 0.25° latitude) and temporal (3 h) resolutions. The TMPA SPP is one of the most accurate and commonly used precipitation products because of its good performance at detecting moderate to high rainfall over tropical and subtropical regions [21,22]. Over 17 years of operation, the TMPA SPP not only delivered global high-resolution precipitation estimates but also accumulated sufficient knowledge and a reliable methodology for the next GPM tool to be used.
Since the launch of the GPM mission in 2014, evaluating and benchmarking its SPPs have been the focus of research attention. In particular, IMERG has received considerable attention lately because it provides precipitation estimates with the finest resolution [18]. Major enhancements in GPM include the improved orbital inclination (65°), which allows coverage of additional climatic zones; double wavelength, which improves its detection of light precipitation; and high-frequency channels (165.5 and 183.3 GHz), which enhance the detection of both light and solid precipitation [23]. GPM offers IMERG SPPs with spatial (0.1° longitude × 0.1° latitude) and temporal (half an hour) resolutions higher than TMPA SPPs.
Considerable work has been conducted to assess the accuracy and inconsistencies among upgraded versions (V3, V4, V5, and V6) of the IMERG algorithm [18]. Liu [24] analyzed the global systemic discrepancies between TMPA and IMERG and found major systematic variations according to the nature of the surface and precipitation intensity. Recent studies have shown that IMERG generally performs well, although various erroneous features are observed across different regions. Most findings have reported that the SPP performance can vary considerably across diverse ecosystems, climatic conditions, latitudes, altitudes, etc. [25,26,27]. The usefulness of IMERG SPPs has been investigated for regions of specific characteristics. For example, Prakash et al. recently showed that IMERG significantly improves monsoon precipitation detection compared with TMPA [28]. Omranian et al. concentrated on IMERG’s potential for hurricane replication [29], whereas Khan and Maggioni assessed IMERG’s performance over oceans [30]. Assessments at the country level have been reported for mainland China [31,32,33], India [34], Iran [35], the United Arab Emirates [4], Saudi Arabia [36], Brazil [37,38], the Netherlands [39], Germany [40], Austria [41], Spain [42], and Cyprus [43]. However, IMERG SPPs have rarely been evaluated for countries at high latitudes.
GPM SPPs represent a feasible data source with high temporal and spatial resolutions that may help minimize the propagation of uncertainty in hydrological modeling [44]. However, systemic bias and random errors are typically found in satellite precipitation estimates [45,46]. Mei et al. [47] showed that SPPs are likely to underestimate extreme events and thus contribute to the overall error of hydrological modeling. While they are currently rarely used in European modeling scenarios related to hydrology, GPM data have been provided for various future applications. These topics include flood modeling in mountainous regions [30] and calculating the landslide threshold and debris flow-triggering rainfall [28]. More importantly, GPM data were recently integrated as part of the Global Flow Detection System (GFDS) [31,32]. The deficient performance across different European countries in many validation studies [33] has led to ambiguity over its potential applicability. Therefore, studying the GPM performance across Finland is warranted to allow better understanding of GPM SPP performance at high latitudes in Europe. Studies on the SPP performance are highly location-dependent, particularly in difficult topographies with a broad range of correlation values to gauge measurements [17,46]. Consequently, assessing SPPs is crucial before they are implemented at particular locations.
Finland is situated inside the transition zone from oceanic to continental climates with various apparent precipitation patterns, which makes it an extremely interesting and difficult case study site. Finland extends between 60° and 70° N; therefore, GPM coverage and precipitation detection capability of the SPPs at high latitudes could be evaluated. According to the GPM mission, their satellites can detect various precipitation types and intensities between 65° N and 65° S. To date, however, no study has investigated their satellite coverage [23]. In recent documentation of IMERG V06, NASA reported that the complete sets of sensors can accurately detect precipitation up to latitudes of 60° N and 60° S [18,48,49]. To the best of our knowledge, this study is the first to evaluate the coverage of IMERG SPPs at higher latitudes of 60–70° N. The findings may also suggest a better use of IMERG SPPs over the best-covered regions.
Herein, the performance of IMERG SPPs was evaluated through a comparison with subdaily, daily, and monthly ground-based observation data as a reference across Finland for the 6-year period of 2014–2019. This evaluation focused on determining the temporal and spatial variability in rainfall detection. Three aspects were evaluated: the spatial coverage or extent of satellite estimates at high latitudes; the variability of the satellite detection at various temporal scales (half-hourly, daily, and monthly); and spatial accuracy of the satellite detection depending on the climatological and topographical regions. The following research questions were addressed:
  • What is the difference in detection accuracy between the performances of near-real-time and calibrated IMERG SPPs?
  • Do topographic and climatic features have a significant impact on the satellite detection performance of the rainfall intensity?
  • What is the extent of satellite coverage for regions at high latitudes?
  • Does data aggregation to monthly and daily timescales reduce or increase the satellite estimation errors compared with the subdaily dataset (half-hourly)?
Answering these questions can help improve the detection performance of the IMERG algorithm at high-latitude countries, such as Finland.

2. Study Area

Finland’s proximity to the North Pole makes its climate one of the coldest (Figure 1). While the topography of Finland is largely flat, there are hills and mountains located toward the northwest [50]. As a northern European country, Finland is known for its steep temperature gradient, particularly during winter, which influences the freeze and thaw cycles across the country. It was reported that the average annual temperature during the period between 1981 and 2010 varied from 5 °C to −2 °C, while the average annual precipitation was reported to have varied between 450 mm to 700 mm [51,52,53]. Moreover, there are significant seasonal variations in rainfall distribution. Summer (June–August) is the rainiest season, with an average precipitation of more than 200 mm for most of the country [53]. In autumn (September–November), the average precipitation is several tens of millimeters lower than that in summer; however, the number of rainy days is higher. Spring (March–May) is the driest season, with an average precipitation of approximately 100 mm. The average precipitation in winter (December–February) is within the ranges of spring and autumn [53]. Spatial distribution of precipitation (Figure 1c) in the period 1981–2010 indicates that, on average, more precipitation is received in the Southern and Eastern parts of the country and less in the Northern parts. However, it should be noted that the year-to-year variation is large for both the spatial and temporal distribution of precipitation.
Several factors control the climate of Finland, typical examples of which are longitudinal gradient, maritime climate from Eurasia, the Scandinavian mountain range, and the Baltic Sea [52]. The Köppen–Geiger climate classification categorizes Finland as a cold climate region with no dry season, with cold summers in almost all of the country and warm summers in a small coastal area in southern Finland [54]. Southwestern Finland is familiar with a thermal winter season that lasts on average 14 weeks, while in northern Finland, thermal winter is almost twice as long. Moreover, the permanent snow season is about 22 to 27 weeks long [53,55]. In terms of watersheds, it can be said that Finland is the home of three categories of watersheds: those characterized by a multitude of lakes in the central part of the country; small and medium-sized coastal rivers; and large and medium-sized rivers of northern Finland (Figure 1b). The central part of Finland is mostly covered by lakes. It is estimated the thousands of lakes in this part of the country cover about 10% of the total area of Finland [56].

3. Methodology

This section explains the procedure that was used to evaluate the accuracy of the post- and near-real-time IMERG SPPs. The following subsections provide details of the procedure, and Figure 5 at the end of the section summarizes the implemented procedure.

3.1. Data Acquisition

3.1.1. Finnish Meteorological Institute Precipitation Datasets

The Finnish Meteorological Institute (FMI) produces high-quality observational data for various uses, such as meteorology. The data range from basic climatic conditions to air quality, sea, and oceanic information (Figure 1). The FMI conducts various research programs, such as the impact of the atmosphere on the environment and people, climate change, adaptation, and marine research. In 2013, the FMI decided to make data openly available to the public, including precipitation data [57]. The FMI has multiple departments that are responsible for producing such data, and the Service Development Unit is responsible for quality control [58].
The precipitation data are provided at three temporal resolutions: monthly, daily, and subdaily (10 min). For this study, the three resolutions were downloaded from the FMI website (https://en.ilmatieteenlaitos.fi/download-observations/; accessed on 28 April 2021) for 88 stations that performed observations over the 6-year period of 2014–2019. Figure 2 compares the spatial resolution of the SPPs and the rain gauge distribution across Finland.

3.1.2. GPM SPP Datasets

GPM SPPs range from raw non-distributed data to high-resolution processed precipitation data. NASA is the data provider and classifies the data into four levels of 0–3 (Figure 3). They recommend the level-3 SPP data for research purposes, which is produced with the Day-1 IMERG algorithm. The advantage of this algorithm is its capability to merge, incorporate, and intercalibrate all microwave and infrared (IR) satellite estimates, all other estimators from the TRMM satellite era, and ground measurements of the precipitation [23,59]. The resultant algorithm has high temporal (half-hourly) and spatial (11 km × 11 km) resolutions. The IMERG algorithm generates three primary SPPs: near-real-time (early and late runs) and post-real-time/calibrated (final run). The final run product is calibrated using GPCC data, which include data from ground stations in Finland, preventing a completely independent evaluation. However, the final product of IMERG is calibrated using monthly rainfall data, whereas this study evaluates the performance of IMERG by comparing it to subdaily, daily, and monthly temporal resolution. IMERG V06 SPPs were downloaded from NASA servers (https://gpm.nasa.gov/data/directory; accessed on 1 December 2020). Figure 2 shows the spatial extent (intersections/grids) of the GPM satellite that covers the study area. The ground observation data were aggregated from 10 min to half-hourly precipitation rates to match the finest temporal resolution of the satellite owing to the use of subdaily data.

3.2. Data Processing and Analysis

3.2.1. Processing of IMERG SPP Data

The IMERG data were provided in HDF5 files, which require processing and converting to a more applicable format. In addition, the data cover the whole world; therefore, only the data files concerning Finland were extracted. Then, the data were adjusted to match Finland’s time zone. A post-processing verification was performed randomly to ensure all data spatially matched Finland. Finally, the data were stored in CSV files to facilitate the subsequent analysis.

3.2.2. Matching Coordinates of SPPs and Ground Stations

The main step of the data analysis was a point-to-point evaluation. The location of each rain-gauge station was matched with the closest GPM satellite intersection. The core concept of this step was driven by the spatial resolution of the GPM data (pixels), which was approximately 11 km × 11 km. Creating a hypothetical pixel centered on a station and adding half of the spatial resolution (11 km/2 = 5.5 km) to each side resulted in a box within which GPM intersections were identified (Figure 4). The identified GPM intersection was the closest match to the rain-gauge station. The two datasets of GPM estimates and rain gauge observations could then be compared.

3.3. Evaluation Techniques

3.3.1. Statistical Performance Measures

The performances of the IMERG SPPs were assessed according to seven frequently used statistical performance measures (Table 1). These measures were used to quantify the precipitation detection accuracy of the IMERG SPPs. The measures were divided into three groups; each group served as an assessment tool for the IMERG SPPs [26,33,38,60]. The first group was used to measure the contingency (i.e., detection accuracy) of the SPPs and included the probability of detection (POD), false alarm ratio (FAR), and critical success index (CSI). The second group was used to assess the error and bias associated with the satellite estimates and included the root mean squared error (RMSE), mean absolute error (MAE), and relative bias (RB). Finally, the consistency between the SPPs and corresponding rain gauge measurements was assessed using the correlation coefficient (CC).

3.3.2. Spatial and Temporal Assessments

Spatial matching between the point observations of rain gauges and areal estimates of satellites is a challenging and difficult process [61]. Various errors may affect the matching process, such as propagation errors in the satellite estimates, satellite retrieval algorithm errors, sampling errors, and gauge-associated errors (e.g., instrumental error) [62,63,64]. Although the uncertainties associated with the SPPs and ground measurements were not within the scope of this study, they could not be neglected from the evaluation of the overall performances of the near- and post-real-time SPPs.
The spatial and temporal assessments were conducted in Finland for the period of 2014–2019. The FMI observations were used as a reference; all rainfall events were compared against the corresponding satellite estimates. For the spatial assessment, the coverage of the satellite estimates over Finland was examined. A station-based analysis was conducted to evaluate the performance of the satellite at each rain-gauge station. Finally, the overall performance of the satellite was evaluated for different climatological and administrative regions. For the temporal assessment, the consistency in the different IMERG SPPs (IMERG-Early, IMERG-Late, and IMERG-Final) was evaluated for multiple ground observation resolutions (monthly, daily, and subdaily). In other words, a two-dimensional assessment was performed using the measures listed in Table 1. Different gauge temporal resolutions (monthly, daily, and subdaily) were used to evaluate the IMERG SPPs, and the detection accuracies of the near-real-time (IMERG-Early and IMERG-Late) and post-real-time (IMERG-Final) SPPs were compared for precipitation events. Figure 5 shows a summary of the spatial and temporal assessment evaluation of IMERG SPPs.

4. Results and Discussion

The statistical performance measures were used to quantify the detection accuracy, consistency, and errors associated with the IMERG SPPs compared to ground observations of FMI stations. The obtained results are discussed comprehensively in the following sections.

4.1. GPM Satellite Spatial Coverage

Spatial coverage of the GPM satellite over high latitudes was evaluated using different techniques. The percent coverage of the GPM satellite data over Finland was evaluated for FMI ground stations and the different regions (Figure 6). The coverage was calculated as the ratio of the difference between detected values retrieved by the satellite over a specific location during the study period to the complete number of data. The results showed that the regions between 60° N and 63° N, which contain 56% of the FMI stations, had a superior satellite detection coverage of more than 60%. These stations covered the South part of Finland, which includes the Southern, Eastern, and Western Finland regions (Figure 6b). The central region of Oulu (63°–66° N) contained 27% of the FMI stations and experienced moderate detection coverage. The SPPs detected about 50%–60% of the precipitation events that occurred during the study period of 2014–2019. Conversely, the IMERG SPPs over the Lapland region in Northern Finland (66°–70° N) showed an extremely poor detection coverage of less than 50%. Although the coverage was poor, the SPPs still detected more than 40% of the overall precipitation events that occurred during the study period.

4.2. Spatial Assessment

4.2.1. SPP Detection Accuracy

The detection accuracy of the IMERG SPPs was assessed through the performance measures POD, FAR, and CSI. Regional assessments were conducted within each region to compare the detection accuracies. Overall, all assessed regions throughout Finland exhibited extremely high detection accuracy for the entire study period with an average POD of 0.85–0.9, FAR of 0.2–0.3, and CSI of >0.7 (Figure 7).
POD ranged from 0.8 to >0.9 for most of the regions (Figure 7). Eastern and Southern Finland showed the highest detection accuracy with a POD of more than 0.9. Oulu and Western Finland exhibited slightly lower detection accuracies with a POD of 0.85. Conversely, Lapland had relatively low detection accuracy—especially the mountainous region in Lapland—with more than 50% of the region exhibiting a POD of <0.85. With regard to the IMERG SPPs, IMERG-Late, and IMERG-Final showed a significantly improved detection performance compared with IMERG-Early for most of Finland.
FAR was used to evaluate false precipitation detection by the satellite (Figure 7). IMERG-Early showed good performance with an average FAR of 0.1 for most regions, except for Eastern and Southern Finland. Surprisingly, IMERG-Late and IMERG-Final showed higher FAR values for most regions, from 0.2 in Oulu and Eastern, Southern, and Western Finland to 0.5 in Lapland. Overall, the mountainous regions clearly showed higher FAR values than the plain or coastal regions, which supports the POD results. In addition, the calibrated SPP (IMERG-Final) did not lead to improved results compared with the near-real-time SPPs (IMERG-Early and IMERG-Late).
Most regions (>80%) had extremely high CSI values of more than 0.7 (Figure 7). A significant poor performance of the satellite was observed for the mountainous region of Halti in Lapland. Although the coverage of the GPM satellite was extremely poor for Lapland overall, this result questions the precipitation detection capability of the satellite for mountainous regions at high latitudes. Furthermore, the IMERG products showed a relatively low performance over a limited number of stations in the western and southwest coast sites as well as in Eastern Finland (Figure 7). Overall, the calibrated SPP did not indicate a significant improvement in CSI compared with the near-real-time SPPs. All IMERG SPPs demonstrated the same precipitation detection performance for most of Finland.

4.2.2. Correlation between SPPs and Ground Observations

The correlation coefficient (CC) was calculated to assess the consistency between the rain gauge observations and IMERG SPPs (Figure 8). Overall, all IMERG SPPs exhibited a high correlation with an average CC of more than 0.7. IMERG-Final had the highest CC compared with the near-real-time products with a range of 0.7–0.75. The consistency between the ground observations and satellite estimates was remarkable for most of Finland. IMERG-Early showed a high correlation over both Southern and Northern Finland with an average CC of 0.69. IMERG-Late exhibited a slight improvement for most of Finland with an average CC of 0.70. IMERG-Final had the highest correlation with a remarkable average CC of 0.74. Surprisingly, the highest CC values were observed for Northern Finland (i.e., Lapland and Oulu).

4.2.3. Satellite Error

Errors associated with satellite precipitation estimates were evaluated according to RMSE, MAE, ME, and BIAS (Figure 9). The error indicators were applied to quantify the errors associated with each IMERG product over each region in Finland during the study period of 2015 to 2019. Overall, the calibrated SPP (IMERG-Final) had the lowest estimation errors than the near-real-time SPPs (IMERG-Early and IMERG-Late).
Although the RMSE values were not significant, IMERG-Early showed the highest error among the other IMERG products with an average RMSE of 4–5 mm for Oulu and Western and Southern Finland (Figure 9). For Lapland and Eastern Finland, IMERG-Early had a lower average RMSE of 4 mm. IMERG-Late showed a slightly lower RMSE with an average of 4 mm for Oulu and Eastern and Western Finland, and average RMSE values of 4.5 and 3.7 mm for Southern Finland and Lapland, respectively. In contrast, IMERG-Final significantly reduced RMSE with a range of 3.1–3.5 mm and average of 3.25 mm for all Finland regions. Among all regions, Lapland had the lowest RMSE compared with other parts of Finland. Among SPPs, IMERG-Final exhibited the best performance over the region of Finland.
MAE, ME, and BIAS showed a similar trend as the RMSE results (Figure 9). Lapland and Western Finland had the lowest MAE for all IMERG SPPs with averages of 1.6 mm for IMERG-Early, 1.55 mm for IMERG-Late, and 1.4 mm for IMERG-Late. Similarly, Oulu, Eastern Finland, and Southern Finland had average MAE values of 1.7 mm for IMERG-Early, 1.65 mm for IMERG-Late, and 1.4 mm for IMERG-Final. BIAS indicated that all IMERG SPPs overestimated the precipitation by an average of 1%–2%. Overall, the calibrated SPP (IMERG-Final) had the lowest MAE, ME, and BIAS values and thus the lowest estimation error.

4.3. Temporal Assessment

The differences between the IMERG SPPs (IMERG-Early, IMERG-Late, and IMERG-Final) were evaluated by comparison against ground observation datasets with monthly, daily, and subdaily temporal scales.

4.3.1. Satellite Detection Accuracy

The detection accuracy of the IMERG SPPs was assessed through POD, FAR, and CSI (Figure 10, Figure 11 and Figure 12). Furthermore, the half-hourly, daily, and monthly datasets for each FMI station were used. Overall, the IMERG SPPs had relatively similar detection accuracies, with IMERG-Final and IMERG-Late performing slightly better than IMERG-Early. The highest detection accuracy was observed in the case of the half-hourly dataset, whereas the lowest detection accuracy was observed for the case of the monthly dataset. This was particularly observed for the Northern regions of Finland due to missing data in IMERG SPPs. This may have resulted in an error in detection when IMERG data were aggregated to the daily and monthly levels.
For the half-hourly dataset, all IMERG SPPs showed POD values of 0.91–0.97 (Figure 10). For the daily dataset, the SPPs showed significantly reduced POD values of 0.75–0.9. For the monthly dataset, the SPPs performed extremely poorly with POD values of <0.5. This covered a considerable number of stations (more than 40%) located in the middle and Northern Finland (Oulu and Lapland). The average POD values were 0.72, 0.9, and 0.95 with the monthly, daily, and half-hourly datasets, respectively. The CSI results supported the POD results (Figure 11). In the case of the half-hourly dataset, the SPPs had the highest precipitation detection accuracy with an average CSI of 0.88 (>0.7 for all stations). In the case of the daily dataset, the SPPs showed a relatively high detection accuracy with an average CSI of more than 0.7 for approximately 60% of FMI stations. The only exception was stations in Lapland, which had an average CSI of 0.68–0.7. In the case of the monthly dataset, the SPPs showed relatively poor performance for Oulu and Lapland with CSI values of 0.43–0.6. Meanwhile, Southern, Eastern, and Western Finland had high detection accuracy with CSI values of more than 0.7.
The FAR results were interesting regarding the false detection of precipitation. The half-hourly and monthly datasets yielded the lowest FAR values with averages of 0.06 and 0.03, respectively. Conversely, the daily dataset yielded several false detections with an average FAR of 0.22. Although FAR was not high for the daily dataset, the results captured false detections when subdaily data were aggregated. The monthly results also indicated that the FAR values could be sensitive to data aggregation. Aggregating fine-resolution precipitation data into a monthly dataset will definitely conceal the false detections of precipitation by the satellite.

4.3.2. Gauge–Satellite Correlation

CC was used to evaluate the consistency between the rain gauge observations and SPPs at different temporal scales (Figure 13). CC showed almost no difference between the near-real-time SPPs (IMERG-Early and IMERG-Late) and calibrated SPP (IMERG-Final), but CC clearly differed depending on the temporal scale. With the half-hourly dataset, CC was lowest with an average range of 0.3–0.4 for most FMI stations spread across the country. With the monthly data, CC improved to 0.5–0.6 for most stations, except for 10% of the stations in the southern area, which had a very low CC of <0.3. With the daily dataset, CC was much higher at >0.6 for around 90% of the FMI stations.
The poor performance at the half-hourly temporal resolution indicates that any slight difference between the ground measurements and satellite estimates would reduce CC. In addition, dealing with a large number of data can result in a large accumulation of differences, which can affect the sensitivity of the performance measure. This interpretation also applies to the monthly resolution because the aggregation of fine-resolution precipitation data to the monthly timescale would certainly result in a high propagation error for the satellite precipitation estimates.

4.3.3. Satellite Error Evaluation

RMSE, MAE, and BIAS were used to evaluate the errors of the IMERG SPPs at different temporal scales. The IMERG SPPs did not show significant differences when compared at the same temporal resolution. Interestingly, the error associated with the satellite estimates was found to be insignificant. With the half-hourly dataset, RMSE was 0.24–0.44 mm for IMERG-Early and 0.2–0.4 mm for IMERG-Late and IMERG-Final (Figure 14). With the daily and monthly datasets, RMSE was 2.5–4 mm and 20–40 mm, respectively. When data are aggregated from a fine resolution (e.g., half-hourly) to a coarse resolution (e.g., monthly), the amount of error is generally expected to increase. Thus, the errors were evaluated on a relative scale. The monthly resolution resulted in the highest error with increased RMSE and MAE of >30 mm and 20 mm, respectively (Figure 14 and Figure 15). RMSE showed no significant differences between IMERG-Early and IMERG-Late. However, IMERG-Final showed a slight improvement (20% reduction in errors) compared with the near-real-time SPPs with an average RMSE of 2 mm for most parts of the country at a daily temporal resolution. MAE showed similar results as RMSE, except that IMERG-Final outperformed the other SPPs for the three temporal datasets with an error reduction of more than 30%. The BIAS results indicated that the SPPs tended to slightly overestimate the precipitation at the half-hourly and daily scales by 0.03% and 1.5%, respectively (Figure 16). In contrast, the SPPs underestimated the precipitation with an average BIAS of 18% at the monthly scale.

4.4. Discussion

This study investigated the spatial coverage of IMERG SPPs over high-latitude regions of Finland. To date, one study has reported the poor performance of IMERG SPPs at high altitudes over Sweden [65]. This above-mentioned study used the statistical performance measures CC, Bias, and CSI to validate the IMERG SPPs and the sensitivity of their results at different latitudes over Sweden. However, it did not investigate the spatial and temporal variations in the satellite coverage or performance at high altitudes or the extent that the IMERG SPPs detected precipitation events in the study area. Previous studies have reported similar limitations of satellites when measuring precipitation at high altitudes. For example, Tan et al. [49] reported that the passive microwave imager (PMI) performs poorly at high latitudes, implying that GPM satellites can only use direct infrared (IR) sensors to estimate precipitation. The spatial coverage results indicate that IMERG SPPs can be used in Southern, Western, and Eastern Finland because they have extremely good coverage, whereas they need to be used with caution in Oulu and Lapland.
The results of the spatial assessment indicate that the calibrated and near-real-time SPPs had extremely high precipitation detection accuracy. However, IMERG-Final showed slightly better detection accuracy and had the highest correlation with the ground observation and low error. The IMERG SPPs showed remarkable performances in Southern, Western, and Eastern Finland, whereas the correlation and accuracy decreased and the errors increased in Northern Finland, particularly Lapland. Although most of Finland exhibits a flat topography, there are high hills and mountains in Halti, Ridnitšohkka, and Kovddoskaisi, which are in the far north of Lapland. High errors associated with satellite estimates have been reported by several groups for various locations around the world. For instance, Navarro et al. reported that the IMERG SPPs performed poorly at detecting precipitation over Europe in general and the Alps and Scandinavian mountains in particular [48]. Similar conclusions have been reported in Asia and the Middle East. In India, Prakash et al. [13] found that the orographic process contributed to higher errors and negative bias for IMERG estimates over mountainous areas. In the Kingdom of Saudi Arabia, IMERG SPPs performed the worst at high altitudes, which was attributed to high uncertainty of the satellite detection owing to rapid changes in the climatic conditions [60].
The temporal assessment showed that all IMERG SPPs had a high detection accuracy at different temporal scales. However, the half-hourly dataset resulted in the highest detection accuracy, whereas the daily dataset resulted in the lowest estimation error and highest correlation between the satellite estimates and ground observations. Thus, the daily IMERG datasets are recommended for detecting precipitation over Finland. Similar results were obtained by Asong et al. [66], who conducted a study over Southern Canada using two datasets. They found that the precipitation detection accuracy was high for both datasets; however, the error was lower, and correlation was higher in the case of the daily dataset than in the case of the 6-h dataset.

4.5. Study Limitations

Although the aim of this study was to comprehensively evaluate the performance of IMERG SPPs over Finland at different spatial and temporal scales, it had some limitations that should be addressed to enhance the overall results:
  • The information about specific stations used to calibrate IMERG-Final was limited, which prevented a completely independent evaluation of the three SPPs. However, IMERG-Final had similar results to the near-real-time SPPs on multiple occasions.
  • Although the FMI rain gauges are distributed well across the country, a denser distribution would allow for a more comprehensive evaluation with mutable spatial scales [65]. A dense gauge network would also allow a grid box-level evaluation of the IMERG SPPs, which could help in quantifying the errors and uncertainties associated with satellite estimates [66].
  • An uncertainty analysis should be performed to comprehensively investigate whether the errors were due to surrounding factors such as the geological features and climatological patterns or due to faults with the satellite instruments or algorithms.

5. Conclusions

Herein, a point-to-point matching technique was used to evaluate the accuracy of calibrated and near-real-time IMERG SPPs over Finland. Ground precipitation measurements were used as a reference. The following three aspects were assessed: the spatial coverage of the satellite estimates at high latitudes, the spatial distribution of the detection accuracy at the station and regional scales, and the detection accuracy at different temporal scales. Multiple performance measures were used: POD, FAR, and CSI for the satellite detection accuracy; RMSE, MAE, ME, and BIAS for bias and errors in the SPPs; and CC for the correlation between the ground observations and SPPs. The key findings were as follows:
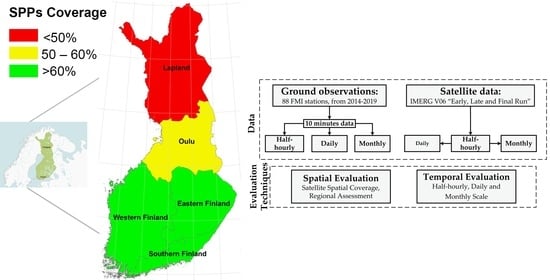
  • Overall, the regions lying between 60° and 63° N (Southern, Eastern, and Western Finland) had superior detection coverage of >60%. Oulu had moderate detection coverage of 50%–60%. Conversely, Lapland (66°–70° N) showed extremely poor detection coverage, with approximately half of the precipitation events not being detected. However, the satellite was still able to detect >40% of the precipitation events that occurred in Lapland during the study period.
  • The results of the spatial assessment indicated that the calibrated and near-real-time IMERG SPPs had extremely high precipitation detection accuracy. IMERG-Final showed slightly better detection accuracy than the other SPPs, the highest correlation with the ground observation, and the lowest error. The IMERG SPPs performed remarkably well in Southern, Western, and Eastern Finland, whereas they performed poorly in the Northern Finland, particularly Lapland.
  • The temporal assessment showed that all IMERG SPPs had high detection accuracy at different temporal scales (half-hourly, daily, and monthly). However, the detection accuracy was highest in the case of the half-hourly dataset. The estimation error and correlation results were the best with the daily dataset. Thus, the IMERG daily dataset is recommended for detecting precipitation events over Finland.
These findings indicate that the IMERG SPPs can be used with high confidence for Southern, Eastern, and Western Finland, and they need to be used with caution for Oulu. They are not recommended for use in Lapland. IMERG-Final is the best SPP to use because of its low estimation error and high correlation with ground observations. IMERG-Final can be used to complement or substitute ground precipitation measurements in ungauged and poorly gauged regions in Southern Finland.
Further studies are strongly recommended to clarify the deficiencies of satellite detection for high-latitude regions. Uncertainty analysis should also be included in future studies because errors from ground measurements (e.g., instrumental complications, atmospheric conditions, and gaps in the data) and from satellite sensors may be sources of detection uncertainties. Various variables may influence the satellite precipitation estimates, including the brightness of the visible spectrum clouds and cloud error [49] and should be considered. Uncertainties owing to errors can spread through IMERG algorithms to applications that depend on IMERG data, such as hydrological models.

Author Contributions

Conceptualization, M.T.M., M.A.H. and M.M.M.; Data curation, M.T.M., and M.A.H.; Formal analysis, M.T.M.; Funding acquisition, M.M.M., and M.A.H.; Investigation, M.T.M.; Methodology, M.T.M.; Project administration, M.A.H. and M.M.M.; Resources, M.M.M., and M.A.H.; Supervision, M.A.H. and M.M.M.; Validation, S.A.M.; Visualization, M.T.M.; Writing—original draft, M.T.M. and S.A.M.; Review and editing, M.D.M., M.M.M., and M.A.H. All authors have read and agreed to the published version of the manuscript.

Funding

This research was funded by the national water and energy center, United Arab Emirates University through the Asian University Alliance (AUA) program, grants number 31R281-AUA- NWEC -4- 2020 and 12R023-AUA- NWEC -4- 2020.

Institutional Review Board Statement

Not applicable.

Informed Consent Statement

Not applicable.

Data Availability Statement

Precipitation data were provided by Finnish Meteorological Institute under the Creative Commons Attribution 4.0 International (CC BY 4.0 License, https://creativecommons.org/licenses/by/4.0/, accessed on 28 April 2021). The data available in a publicly accessible repository and can be found here: [https://en.ilmatieteenlaitos.fi/download-observations/] (accessed on 28 April 2021).

Acknowledgments

We thankfully acknowledge the Finnish Meteorological Institute for providing access to the rain gauge dataset and Antti Mäkelä for creating the precipitation map.

Conflicts of Interest

The authors declare no conflict of interest.

References

  1. Kidd, C.; Huffman, G. Global precipitation measurement. Meteorol. Appl. 2011, 18, 334–353. [Google Scholar] [CrossRef]
  2. Schneider, U.; Ziese, M.; Meyer-Christoffer, A.; Finger, P.; Rustemeier, E.; Becker, A. The new portfolio of global precipitation data products of the Global Precipitation Climatology Centre suitable to assess and quantify the global water cycle and resources. Proc. Int. Assoc. Hydrol. Sci. 2016, 374, 29–34. [Google Scholar] [CrossRef] [Green Version]
  3. Terink, W.; Leijnse, H.; van den Eertwegh, G.; Uijlenhoet, R. Spatial resolutions in areal rainfall estimation and their impact on hydrological simulations of a lowland catchment. J. Hydrol. 2018, 563, 319–335. [Google Scholar] [CrossRef]
  4. Mahmoud, M.T.; Hamouda, M.A.; Mohamed, M.M. Spatiotemporal evaluation of the GPM satellite precipitation products over the United Arab Emirates. Atmos. Res. 2019, 219, 200–212. [Google Scholar] [CrossRef]
  5. Yong, B.; Liu, D.; Gourley, J.J.; Tian, Y.; Huffman, G.J.; Ren, L.; Hong, Y. Global view of real-time TRMM multisatellite precipitation analysis: Implications for its successor global precipitation measurement mission. Bull. Am. Meteorol. Soc. 2015, 96, 283–296. [Google Scholar] [CrossRef]
  6. Chen, C.; Chen, G.; Chen, H.; Yue, C. Research on robust reduction control method of steering-by-wire based on MBSE. Int. J. Wirel. Mob. Comput. 2019, 16, 27. [Google Scholar] [CrossRef]
  7. Kidd, C.; Becker, A.; Huffman, G.J.; Muller, C.L.; Joe, P.; Skofronick-Jackson, G.; Kirschbaum, D.B. So, how much of the Earth’s surface is covered by rain gauges? Bull. Am. Meteorol. Soc. 2017, 98, 69–78. [Google Scholar] [CrossRef] [PubMed]
  8. Tang, G.; Ma, Y.; Long, D.; Zhong, L.; Hong, Y. Evaluation of GPM Day-1 IMERG and TMPA Version-7 legacy products over Mainland China at multiple spatiotemporal scales. J. Hydrol. 2016, 533, 152–167. [Google Scholar] [CrossRef]
  9. Tapiador, F.J.; Turk, F.J.; Petersen, W.; Hou, A.Y.; García-Ortega, E.; Machado, L.A.T.; Angelis, C.F.; Salio, P.; Kidd, C.; Huffman, G.J.; et al. Global precipitation measurement: Methods, datasets and applications. Atmos. Res. 2012, 104–105, 70–97. [Google Scholar] [CrossRef]
  10. Lee, J.; Kim, S.; Jun, H. A study of the influence of the spatial distribution of rain gauge networks on areal average rainfall calculation. Water (Switzerland) 2018, 10, 1635. [Google Scholar] [CrossRef] [Green Version]
  11. Ma, Y.; Zhang, Y.; Yang, D.; Farhan, S. Bin Precipitation bias variability versus various gauges under different climatic conditions over the Third Pole Environment (TPE) region. Int. J. Climatol. 2015, 35, 1201–1211. [Google Scholar] [CrossRef]
  12. Yong, B.; Wang, J.; Ren, L.; You, Y.; Xie, P.; Hong, Y. Evaluating four multisatellite precipitation estimates over the Diaoyu Islands during typhoon seasons. J. Hydrometeorol. 2016, 17, 1623. [Google Scholar] [CrossRef]
  13. Guo, H.; Chen, S.; Bao, A.; Behrangi, A.; Hong, Y.; Ndayisaba, F.; Hu, J.; Stepanian, P.M. Early assessment of Integrated Multi-satellite Retrievals for Global Precipitation Measurement over China. Atmos. Res. 2016, 176–177, 121–133. [Google Scholar] [CrossRef]
  14. Yang, S.; Olson, W.S.; Wang, J.J.; Bell, T.L.; Smith, E.A.; Kummerow, C.D. Precipitation and latent heating distributions from satellite passive microwave radiometry. Part II: Evaluation of estimates using independent data. J. Appl. Meteorol. Climatol. 2006, 45, 721–739. [Google Scholar] [CrossRef]
  15. Hobouchian, M.P.; Salio, P.; García Skabar, Y.; Vila, D.; Garreaud, R. Assessment of satellite precipitation estimates over the slopes of the subtropical Andes. Atmos. Res. 2017, 190, 43–54. [Google Scholar] [CrossRef]
  16. Joyce, R.J.; Janowiak, J.E.; Arkin, P.A.; Xie, P. CMORPH: A Method that Produces Global Precipitation Estimates from Passive Microwave and Infrared Data at High Spatial and Temporal Resolution. J. Hydrometeorol. 2004, 5, 487–503. [Google Scholar] [CrossRef]
  17. Huffman, G.J.; Bolvin, D.T.; Nelkin, E.J.; Wolff, D.B.; Adler, R.F.; Gu, G.; Hong, Y.; Bowman, K.P.; Stocker, E.F. The TRMM Multisatellite Precipitation Analysis (TMPA): Quasi-Global, Multiyear, Combined-Sensor Precipitation Estimates at Fine Scales. J. Hydrometeorol. 2007, 8, 38–55. [Google Scholar] [CrossRef]
  18. Huffman, G.J.; Bolvin, D.T.; Nelkin, E.J. Integrated Multi-satellitE Retrievals for GPM (IMERG) Technical Documentation. In IMERG Tech Document; NASA: Washington, DC, USA, 2017; pp. 1–54. Available online: https://pmm.nasa.gov/sites/default/files/document_files/IMERG_technical_doc_3_22_17.pdf (accessed on 2 May 2021).
  19. Huffman, G.J.; Adler, R.F.; Bolvin, D.T.; Gu, G. Improving the global precipitation record: GPCP Version 2.1. Geophys. Res. Lett. 2009, 36. [Google Scholar] [CrossRef] [Green Version]
  20. Nguyen, P.; Ombadi, M.; Sorooshian, S.; Hsu, K.; AghaKouchak, A.; Braithwaite, D.; Ashouri, H.; Rose Thorstensen, A. The PERSIANN family of global satellite precipitation data: A review and evaluation of products. Hydrol. Earth Syst. Sci. 2018, 22, 5801–5816. [Google Scholar] [CrossRef] [Green Version]
  21. Su, J.; Lü, H.; Wang, J.; Sadeghi, A.M.; Zhu, Y. Evaluating the applicability of four latest satellite-gauge combined precipitation estimates for extreme precipitation and streamflow predictions over the upper yellow river basins in China. Remote Sens. 2017, 9, 1176. [Google Scholar] [CrossRef] [Green Version]
  22. Tong, K.; Su, F.; Yang, D.; Hao, Z. Evaluation ofsatellite precipitation retrievals and their potential utilities in hydrologic modeling over the Tibetan Plateau. J. Hydrol. 2014, 519, 423–437. [Google Scholar] [CrossRef]
  23. Huffman, G.J.; Bolvin, D.T.; Braithwaite, D.; Hsu, K.; Joyce, R.; Kidd, C.; Nelkin, E.J.; Xie, P. NASA Global Precipitation Measurement (GPM) Integrated Multi-satellitE Retrievals for GPM (IMERG). In Algorithm Theoretical Basis Document (ATBD) Version 4.5; National Aeronautics and Space Administration: Washington, DC, USA, 2015; pp. 1–26. Available online: https://gpm.nasa.gov/sites/default/files/document_files/IMERG_ATBD_V4.5.pdf (accessed on 2 May 2021).
  24. Liu, Z. Comparison of Integrated Multisatellite Retrievals for GPM (IMERG) and TRMM Multisatellite Precipitation Analysis (TMPA) monthly precipitation products: Initial results. J. Hydrometeorol. 2016, 17, 777–790. [Google Scholar] [CrossRef]
  25. Maggioni, V.; Meyers, P.C.; Robinson, M.D. A review of merged high-resolution satellite precipitation product accuracy during the Tropical Rainfall Measuring Mission (TRMM) era. J. Hydrometeorol. 2016, 17, 1101–1117. [Google Scholar] [CrossRef]
  26. Wang, Z.; Zhong, R.; Lai, C.; Chen, J. Evaluation of the GPM IMERG satellite-based precipitation products and the hydrological utility. Atmos. Res. 2017, 196, 151–163. [Google Scholar] [CrossRef]
  27. Zambrano-Bigiarini, M.; Nauditt, A.; Birkel, C.; Verbist, K.; Ribbe, L. Temporal and spatial evaluation of satellite-based rainfall estimates across the complex topographical and climatic gradients of Chile. Hydrol. Earth Syst. Sci. Discuss. 2016, 1–43. [Google Scholar] [CrossRef] [Green Version]
  28. Prakash, S.; Mitra, A.K.; Pai, D.S.; AghaKouchak, A. From TRMM to GPM: How well can heavy rainfall be detected from space? Adv. Water Resour. 2016, 88, 1–7. [Google Scholar] [CrossRef]
  29. Omranian, E.; Sharif, H.O.; Tavakoly, A.A. How well can Global Precipitation Measurement (GPM) capture hurricanes? Case study: Hurricane harvey. Remote Sens. 2018, 10, 1150. [Google Scholar] [CrossRef] [Green Version]
  30. Khan, S.; Maggioni, V. Assessment of level-3 Gridded Global Precipitation Mission (GPM) products over oceans. Remote Sens. 2019, 11, 255. [Google Scholar] [CrossRef] [Green Version]
  31. Wang, J.; Liu, G.; Liu, H.; Lam, P.K.S. Multivariate statistical evaluation of dissolved trace elements and a water quality assessment in the middle reaches of Huaihe River, Anhui, China. Sci. Total Env. 2017, 583, 421–431. [Google Scholar] [CrossRef] [PubMed]
  32. Zhao, H.; Yang, B.; Yang, S.; Huang, Y.; Dong, G.; Bai, J.; Wang, Z. Systematical estimation of GPM-based global satellite mapping of precipitation products over China. Atmos. Res. 2018, 201, 206–217. [Google Scholar] [CrossRef]
  33. Zhou, Z.; Guo, B.; Xing, W.; Zhou, J.; Xu, F.; Xu, Y. Comprehensive evaluation of latest GPM era IMERG and GSMaP precipitation products over mainland China. Atmos. Res. 2020, 246. [Google Scholar] [CrossRef]
  34. Prakash, S.; Mitra, A.K.; AghaKouchak, A.; Liu, Z.; Norouzi, H.; Pai, D.S. A preliminary assessment of GPM-based multi-satellite precipitation estimates over a monsoon dominated region. J. Hydrol. 2018, 556, 865–876. [Google Scholar] [CrossRef] [Green Version]
  35. Maghsood, F.F.; Hashemi, H.; Hosseini, S.H.; Berndtsson, R. Ground validation of GPM IMERG precipitation products over Iran. Remote Sens. 2020, 12, 48. [Google Scholar] [CrossRef] [Green Version]
  36. Mahmoud, M.T.; Al-Zahrani, M.A.; Sharif, H.O. Assessment of global precipitation measurement satellite products over Saudi Arabia. J. Hydrol. 2018, 559, 1–12. [Google Scholar] [CrossRef]
  37. Rozante, J.R.; Vila, D.A.; Chiquetto, J.B.; Fernandes, A.D.A.; Alvim, D.S. Evaluation of TRMM/GPM blended daily products over Brazil. Remote Sens. 2018, 10, 882. [Google Scholar] [CrossRef] [Green Version]
  38. Gadelha, A.N.; Coelho, V.H.R.; Xavier, A.C.; Barbosa, L.R.; Melo, D.C.D.; Xuan, Y.; Huffman, G.J.; Petersen, W.A.; Almeida, C. das N. Grid box-level evaluation of IMERG over Brazil at various space and time scales. Atmos. Res. 2019, 218, 231–244. [Google Scholar] [CrossRef] [Green Version]
  39. Rios Gaona, M.F.; Overeem, A.; Leijnse, H.; Uijlenhoet, R. First-year evaluation of GPM rainfall over the Netherlands: IMERG day 1 final run (V03D). J. Hydrometeorol. 2016, 17, 2799–2814. [Google Scholar] [CrossRef]
  40. Ramsauer, T.; Weiß, T.; Marzahn, P. Comparison of the GPM IMERG final precipitation product to RADOLAN weather radar data over the topographically and climatically diverse Germany. Remote Sens. 2018, 10, 2029. [Google Scholar] [CrossRef] [Green Version]
  41. Sungmin, O.; Foelsche, U.; Kirchengast, G.; Fuchsberger, J.; Tan, J.; Petersen, W.A. Evaluation of GPM IMERG Early, Late, and Final rainfall estimates using WegenerNet gauge data in southeastern Austria. Hydrol. Earth Syst. Sci. 2017, 21, 6559–6572. [Google Scholar] [CrossRef] [Green Version]
  42. Tapiador, F.J.; Navarro, A.; García-Ortega, E.; Merino, A.; Sánchez, J.L.; Marcos, C.; Kummerow, C. The contribution of rain gauges in the calibration of the IMERG product: Results from the first validation over Spain. J. Hydrometeorol. 2020, 21, 161–182. [Google Scholar] [CrossRef]
  43. Retalis, A.; Katsanos, D.; Tymvios, F.; Michaelides, S. Validation of the first years of GPM operation over Cyprus. Remote Sens. 2018, 10, 1520. [Google Scholar] [CrossRef] [Green Version]
  44. Nikolopoulos, E.I.; Anagnostou, E.N.; Hossain, F.; Gebremichael, M.; Borga, M. Understanding the Scale Relationships of Uncertainty Propagation of Satellite Rainfall through a Distributed Hydrologic Model. J. Hydrometeorol. 2010, 11, 520–532. [Google Scholar] [CrossRef]
  45. Li, Y.; Grimaldi, S.; Walker, J.P.; Pauwels, V.R.N. Application of remote sensing data to constrain operational rainfall-driven flood forecasting: A review. Remote Sens. 2016, 8, 456. [Google Scholar] [CrossRef] [Green Version]
  46. Maggioni, V.; Massari, C. On the performance of satellite precipitation products in riverine flood modeling: A review. J. Hydrol. 2018, 558, 214–224. [Google Scholar] [CrossRef]
  47. Mei, Y.; Anagnostou, E.N.; Shen, X.; Nikolopoulos, E.I. Decomposing the satellite precipitation error propagation through the rainfall-runoff processes. Adv. Water Resour. 2017, 109, 253–266. [Google Scholar] [CrossRef]
  48. Navarro, A.; García-Ortega, E.; Merino, A.; Sánchez, J.L.; Kummerow, C.; Tapiador, F.J. Assessment of IMERG precipitation estimates over Europe. Remote Sens. 2019, 11, 2470. [Google Scholar] [CrossRef] [Green Version]
  49. Tan, J.; Petersen, W.A.; Tokay, A. A novel approach to identify sources of errors in IMERG for GPM ground validation. J. Hydrometeorol. 2016, 17, 2477–2491. [Google Scholar] [CrossRef]
  50. Jylhä, K.; Ruosteenoja, K.; Räisänen, J.; Venäläinen, A.; Tuomenvirta, H.; Ruokolainen, L.; Saku, S.; Seitola, T. Arvioita Suomen Muuttuvasta Ilmastosta Sopeutumistutkimuksia Varten; Finnish Meteorological Institute: Helsinki, Finland, 2009. [Google Scholar]
  51. Veijalainen, N.; Ahopelto, L.; Marttunen, M.; Jääskeläinen, J.; Britschgi, R.; Orvomaa, M.; Belinskij, A.; Keskinen, M. Severe drought in Finland: Modeling effects on water resources and assessing climate change impacts. Sustainability 2019, 11, 2450. [Google Scholar] [CrossRef] [Green Version]
  52. Veijalainen, N.; Lotsari, E.; Alho, P.; Vehviläinen, B.; Käyhkö, J. National scale assessment of climate change impacts on flooding in Finland. J. Hydrol. 2010, 391, 333–350. [Google Scholar] [CrossRef]
  53. Pirinen, P.; Simola, H.; Aalto, J.; Kaukoranta, J.-P.; Karlsson, P.; Ruuhela, R. Tilastoja Suomen Ilmastosta 1981–2010; Finnish Meteorological Institute: Helsinki, Finland, 2012. [Google Scholar]
  54. Peel, M.C.; Finlayson, B.L.; McMahon, T.A. Updated world map of the Köppen-Geiger climate classification. Hydrol. Earth Syst. Sci. 2007, 11, 1633–1644. [Google Scholar] [CrossRef] [Green Version]
  55. Drebs, A.; Nordlund, A.; Karlsson, P.; Helminen, J.; Rissanen, P. Climatological Statistics of Finland 1971–2000; Finnish Meteorological Institute: Helsinki, Finland, 2002. [Google Scholar]
  56. Korhonen, J.; Kuusisto, E. Long-term changes in the discharge regime in Finland. Hydrol. Res. 2010, 41, 253–268. [Google Scholar] [CrossRef]
  57. Finland Ministry of Transport and Communications Finnish Meteorological Institute Makes its Data Sets Public. Available online: https://www.lvm.fi/-/finnish-meteorological-institute-makes-its-data-sets-public-738767 (accessed on 18 December 2020).
  58. Finnish Meteorological Institute Observing and Information Systems Centre-Finnish Meteorological Institute. Available online: https://en.ilmatieteenlaitos.fi/observing-and-information-systems-centre (accessed on 18 December 2020).
  59. NASA Global Precipitation Measurement (GPM) Mission Overview|Precipitation Measurement Missions. Available online: http://pmm.nasa.gov/GPM (accessed on 20 February 2016).
  60. Mahmoud, M.T.; Mohammed, S.A.; Hamouda, M.A.; Mohamed, M.M. Impact of topography and rainfall intensity on the accuracy of imerg precipitation estimates in an arid region. Remote Sens. 2021, 13, 1–17. [Google Scholar] [CrossRef]
  61. Hu, Q.; Li, Z.; Wang, L.; Huang, Y.; Wang, Y.; Li, L. Rainfall spatial estimations: A review from spatial interpolation to multi-source data merging. Water (Switzerland) 2019, 11, 579. [Google Scholar] [CrossRef] [Green Version]
  62. Mei, Y.; Nikolopoulos, E.I.; Anagnostou, E.N.; Zoccatelli, D.; Borga, M. Error analysis of satellite precipitation-driven modeling of flood events in complex alpine terrain. Remote Sens. 2016, 8, 293. [Google Scholar] [CrossRef] [Green Version]
  63. Oliveira, R.; Maggioni, V.; Vila, D.; Porcacchia, L. Using satellite error modeling to improve GPM-Level 3 rainfall estimates over the central Amazon region. Remote Sens. 2018, 10, 336. [Google Scholar] [CrossRef] [Green Version]
  64. Elmahdy, S.; Mohamed, M. Groundwater of Abu Dhabi Emirate: A regional assessment by means of remote sensing and geographic information system. Arab. J. Geosci. 2015, 8, 11279–11292. [Google Scholar] [CrossRef]
  65. Moravej, M. Ground Validation and Bias Correction of GPM-IMERG V6 Satellite Precipitation Product over Sweden; Lund University: Lund, Sweden, 2020. [Google Scholar]
  66. Asong, Z.E.; Razavi, S.; Wheater, H.S.; Wong, J.S. Evaluation of Integrated Multisatellite Retrievals for GPM (IMERG) over Southern Canada against Ground Precipitation Observations: A Preliminary Assessment. J. Hydrometeorol. 2017, 18, 1033–1050. [Google Scholar] [CrossRef]
Figure 1. (a) Study area and FMI rain-gauge stations, (b) hydrological regions in Finland [52,56]. (c). Average annual precipitation in Finland (1981–2010). Courtesy: Finnish Meteorological Institute, with permission.
Remotesensing 13 02073 g001
Figure 2. (a) GPM satellite intersections/grids over Finland. (b) Finland historical districts and distribution of FMI rain-gauge stations.
Remotesensing 13 02073 g002
Figure 3. Definition of GPM SPP levels.
Remotesensing 13 02073 g003
Figure 4. Coordinate-matching process layout.
Remotesensing 13 02073 g004
Figure 5. IMERG SPPs evaluation process.
Remotesensing 13 02073 g005
Figure 6. Spatial coverage of satellite estimates: (a) rain-gauge stations and (b) regional scale.
Remotesensing 13 02073 g006
Figure 7. Satellite detection accuracy according to POD, FAR, and CSI.
Remotesensing 13 02073 g007
Figure 8. Scatterplots of gauge–IMERG correlation for each region in Finland: IMERG-Early, IMERG-Late, and IMERG-Final.
Remotesensing 13 02073 g008
Figure 9. Boxplots comparing the errors associated with SPP estimates using RMSE, MAE, ME, and BIAS for each region in Finland.
Remotesensing 13 02073 g009
Figure 10. Spatial distributions of the hourly, daily, and monthly POD for IMERG-Early, IMERG-Late, and IMERG-Final.
Remotesensing 13 02073 g010
Figure 11. Spatial distributions of the hourly, daily, and monthly CSI for IMERG-Early, IMERG-Late, and IMERG-Final.
Remotesensing 13 02073 g011
Figure 12. Spatial distributions of the hourly, daily, and monthly FAR for IMERG-Early, IMERG-Late, and IMERG-Final.
Remotesensing 13 02073 g012
Figure 13. Spatial distributions of the half-hourly, daily, and monthly CC for IMERG-Early, IMERG-Late, and IMERG-Final.
Remotesensing 13 02073 g013
Figure 14. Spatial distributions of the half-hourly, daily, and monthly RMSE for IMERG-Early, IMERG-Late, and IMERG-Final.
Remotesensing 13 02073 g014
Figure 15. Spatial distributions of the half-hourly, daily, and monthly MAE for IMERG-Early, IMERG-Late, and IMERG-Final.
Remotesensing 13 02073 g015
Figure 16. Half-hourly, daily, and monthly BIAS for IMERG-Early, IMERG-Late, and IMERG-Final.
Remotesensing 13 02073 g016
Table 1. Statistical measures used for evaluating IMERG SPPs.
Contingency of Satellite Estimates
Probability of Detection (POD) P S G P S G + P G (1)
Critical Success Index (CSI) P S G P S G + P S + P G (2)
False Alarm Ratio (FAR) P S P S + P S G (3)
Bias and error of Satellite Estimates
Mean Absolute Error (MAE) 1 n i = 1 n | X i Y i | (4)
Root Mean Squared Error (RMSE) 1 n i = 1 n ( X i Y i ) 2 (5)
Relative Bias (RB) 1 n i = 1 n ( X i Y i ) i = 1 n Y i   ×   100 % (6)
Consistency between the Rain-Gauge Data and Satellite Estimates
Correlation Coefficient (CC) 1 n i = 1 n ( X i X ¯ ) ( Y i Y ¯ ) σ x σ y (7)
n: number of observations; X: satellite precipitation estimates; X ¯ : average of satellite precipitation estimates; Y: gauge precipitation measurement; Y ¯ : average of gauge precipitation measurements;   σ x : standard deviation for satellite data; σ y : standard deviation for gauge data; P S G : probability of the GPM satellite and rain gauge when both detected precipitation; P S : number of data points of the satellite estimates when the precipitation was detected by rain gauges; and P G : number of data points when the rain gauges observed precipitation while the satellite does did.
Publisher’s Note: MDPI stays neutral with regard to jurisdictional claims in published maps and institutional affiliations.

