1. Introduction
In recent years, the frequency of earthquakes in Korea has increased, and the possibility of damage to existing buried objects in the process of facility redevelopment and maintenance is increasing [
1]. Therefore, it is necessary to obtain information on buried objects not shown in drawings, as well as objects at a given location that can be confirmed from existing drawings. In addition, because it is necessary to acquire information for the execution of subsidiary work such as cutting rebars or compensating for missing rebars, a method for inspecting rebars to supplement information, such as that offered by facility drawings, is required. Examples of reinforcement work conducted as a result of missing rebars or the cutting of rebars include work conducted to address the missing rebars at the Mokgam Water Quality Restoration Center in 2013 [
2], the missing rebars at the Daewoo E&C apartment in 2014, and the cutting of ceiling beams at the Dongbu E&C apartment [
3].
When such sub-construction occurs, the facilities are vulnerable to shaking, resulting in deteriorations in the seismic performance. Therefore, the construction of reinforcements that do not follow design drawings and the use of nonstandard rebars can cause safety vulnerabilities. In particular, information on rebar diameter is necessary for safety diagnosis using devices that inspect the depth, diameter, arrangement, etc., of rebars in existing facilities. Such devices have rebar detectors; however, they measure an extensive range of rebars, in terms of their degree of interaction, by applying a magnetic field to a coil that approaches the rebars [
4]. In addition, it is difficult to simultaneously measure the depth and diameter of rebars. One citation alternative is to use ground-penetrating radar (GPR), which analyzes the signal reflected after electromagnetic waves are passed into the ground or facilities; such waves pass through buried objects, such as non-metallic materials. This approach has the advantage of easily detecting rebars but depends on the surrounding environment. However, compared with a conventional rebar detector, it is easier to measure rebars buried relatively deeply, and this method has the advantage of shortening the time required for safety diagnosis by detecting a wide area of rebars at once.
Therefore, in this study, GPR image data obtained for the detection of rebars inside a facility are subjected to signal processing based on existing studies exploring rebar detection [
5,
6]. Using the processed data, an object recognition algorithm is employed to estimate the diameter of the detected rebars to improve the accuracy of rebar detection.
1.1. Research Trend
Research on obtaining the diameter information of buried materials using the electromagnetic wave method has been actively conducted. Studies have focused on estimating the diameter of a pipe embedded in concrete using the electromagnetic wave method [
7] and on estimating the diameter of a rebar embedded in concrete by graphing data using the electromagnetic wave method [
8]. In addition, full-waveform inversion was used to study the diameter of the buried pipe and the estimated value of the infilling material [
9].
Recently, several studies have been conducted regarding the detection and diameter estimation of buried objects using deep learning, in which a convolutional neural network (CNN) was applied to image data acquired through the electromagnetic wave method [
10,
11,
12]. Additionally, in recent years, many studies have been conducted to estimate the diameter using machine learning [
13]. However, methods that employ deep learning based on the electromagnetic wave method mainly use B-scan data, which are not highly accurate, and focus on data visualization. In addition, it is difficult to measure and estimate the diameter of a buried rebar using existing methods because of signal interference. Thus, there is a need for a technique that can overcome the problem to increase accuracy and minimize signal interference.
1.2. Research Content and Method
In this study, the rebar diameter was estimated using GPR, one of the tools that uses the electromagnetic wave method. Using GPR has the advantage of rapid safety diagnosis because a wide range of safety diagnoses can be performed.
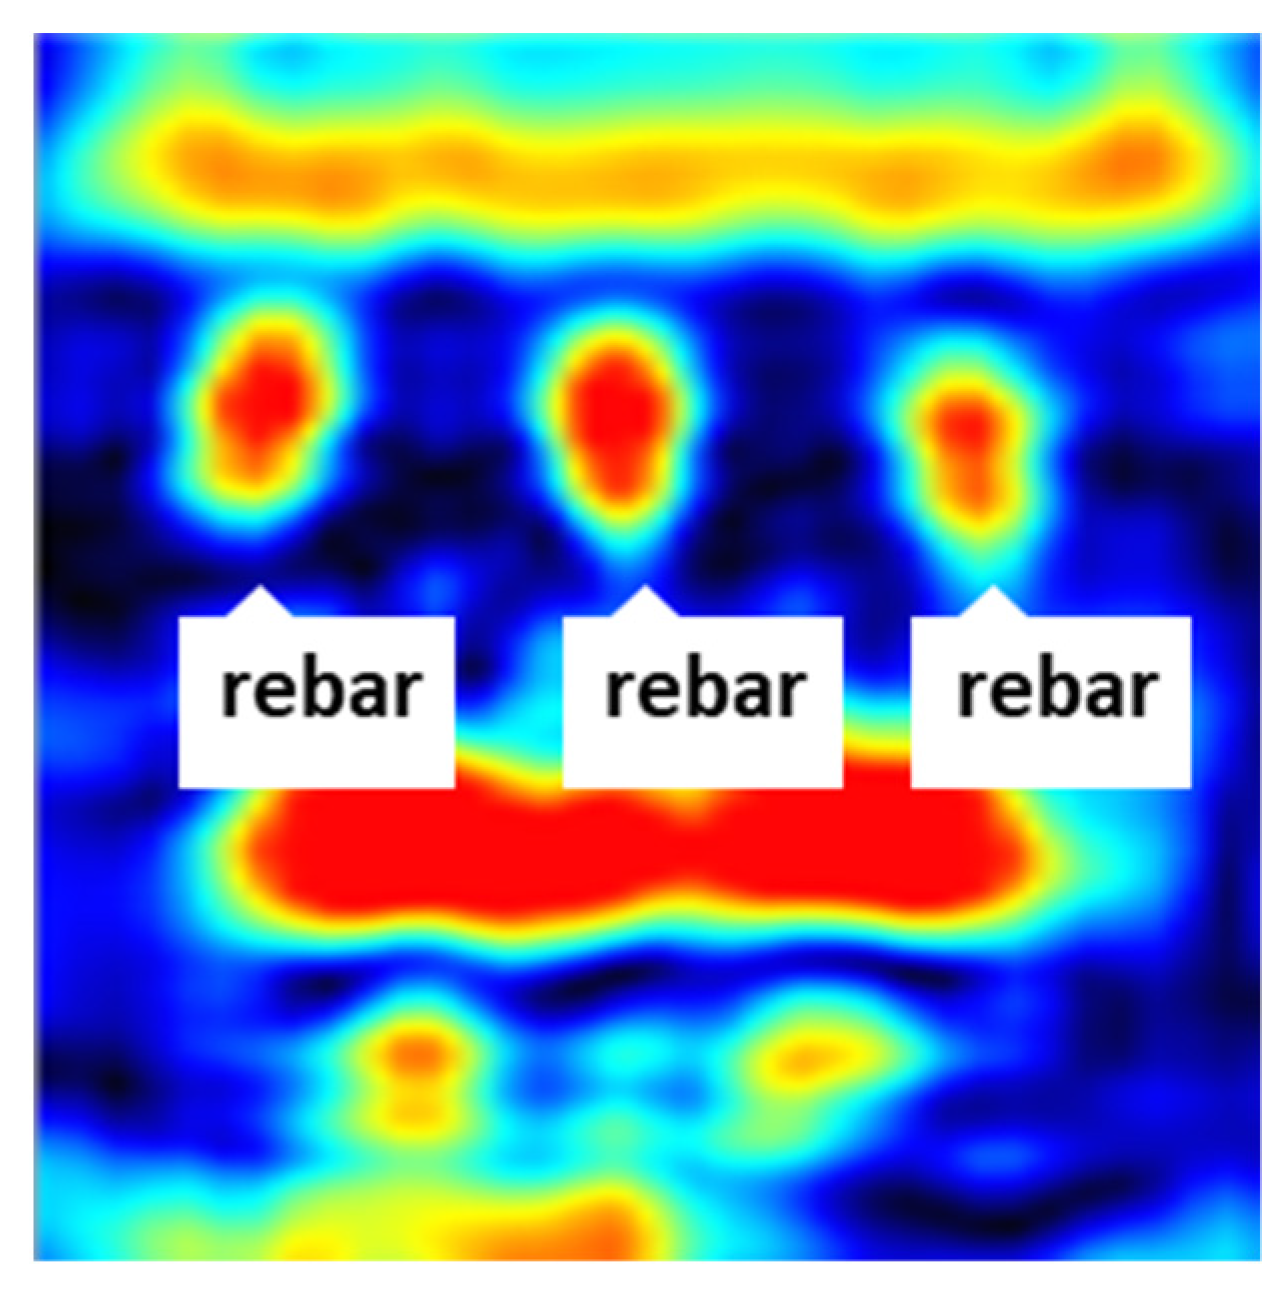
However, the poor visibility of B-scan image data, as shown in
Figure 1, which are commonly used for buried objects in GPR, remains a significant disadvantage. In addition, in the case of rebars buried closely, it is difficult to apply a deep learning–based CNN because the regions of the rebars overlap. So, in effort to solve this problem, we attempted to use signal processing such as migration and f–k. This method can improve the accuracy of the diameter estimation of buried rebars using a CNN based on B-scan image data and can address the difficulty of signal overlap due to closely buried rebars.
The possibility of applying this approach to rebar diameter estimation was confirmed by converting the B-scan GPR image data into heatmap images with good visibility through data processing and color correction.
Rebar specimens were prepared to obtain GPR B-scan image data to measure their diameter; the image data were then transformed into processed data with improved visibility through structural and color correction. The technique was validated by applying the YOLO-v3 object recognition algorithm using the B-scan image data and migrated image data to compare the resulting accuracies with regard to the detection and diameter estimation of rebars.
2. Research Methods
2.1. GPR Detection Principle and YOLO-v3 Principle for Rebar Diameter Estimation
2.1.1. GPR Exploration Principles
When GPR is employed, electromagnetic waves in the frequency range of megahertz to gigahertz are transmitted through a transmitting antenna (Tx antenna), and reflected signals from media with different dielectric constants are received by a receiving antenna (Rx antenna).
Information on the two-way travel time and amplitude of electromagnetic waves is stored in the received signal, and the depth and presence of buried objects are confirmed through analysis of the shape, amplitude, and travel time of the received wave.
GPR operates as shown in
Figure 2. A-scan, B-scan, and C-scan transformations are used to investigate the radar velocity, and a calibration process is presented to obtain this velocity. In the case of A-scan, there is a single reception wave, and B-scan refers to a method of visualizing a set of consecutive reception waves along a specific direction. The method of collecting B-scan data and visualizing the horizontal area of the x- and y-axes along the
z-axis is called C-scan.
In the case of B-scan image data, which is commonly used to detect buried objects through GPR, it appears differently depending on the shape of the object, but in the case of a circular object, it has a hyperbola shape. The horizontal axis of the B-scan data represents the moving distance of the GPR equipment (antennas), and the vertical axis represents the depth at which the arrival time of the reflected wave is converted into a distance. Through this approach, it is possible to determine the locations of steel materials, the spacing between reinforcements, and the depth of the steel materials.
2.1.2. Frequency–Wavenumber Migration
The term migration refers to a series of data processing steps employed to obtain a depth section in which the reflective surface is moved to the actual position based on the time sections obtained after the processing of GPR data. In addition, it focuses the hyperbola’s echoes on a punctual echo located at the apex.
To obtain this information, the speed of the transmitted waves in the target medium is recorded. In the case of the finite difference structural correction method, there is a limitation regarding the stratum slope that may cause vulnerabilities. Structural correction methods, such as frequency–wavenumber migration (f–k migration) using the fast Fourier transform (FFT), have a fast calculation speed and no limitation of finite difference structural correction. For this reason, they are often used for the structural correction of GPR data [
14].
Equation (1) represents a two-dimensional scalar wave equation. In the case of a GPR that employs high-frequency electromagnetic waves, because the frequency propagates as a wave, frequency–wave structural correction is performed using a wave equation, and the basic principle of frequency–wave structural correction assumes that the wave equation, shown below, is satisfied.
In the above equation, x refers to the horizontal distance, z is the depth, t is the time, v is the speed, and p(x, z, t) represents the wave field propagating through the target medium.
Through the Fourier transform and the inverse Fourier transform, Equation (1) can be adapted for a section that is to be structurally corrected, as shown in Equation (2), through which a depth section is obtained by moving the reflective surface to the actual position from the time section.
An example of GPR data before and after structural correction was performed, via a series of processes, is shown in
Figure 3. This structural correction involves data processing to collect the energy dispersion of electromagnetic waves diffracted at the top of the diffraction point, thereby improving the visibility of GPR buried detection data [
14,
15,
16,
17].
2.1.3. YOLO (You Only Look Once)-v3
Algorithms based on region-based CNNs (R-CNNs) are frequently used to recognize objects in images. This method uses a domain-based composite product in which several neural networks are continuously connected, and weight values correspond to each neural network. The weight values are determined via learning, and the determined weight values are used for object recognition. The R-CNN family of algorithms includes Fast R-CNN, Faster R-CNN, Mask R-CNN, etc., and further research is underway [
18].
The YOLO algorithm has evolved into the YOLO-v3 algorithm [
19], which features approximately 100 to 1000 times faster object recognition than other algorithms such as Faster R-CNN, which previously exhibited the best performance. In addition, the YOLO-v3 model has the advantage of learning the universal forms of objects well.
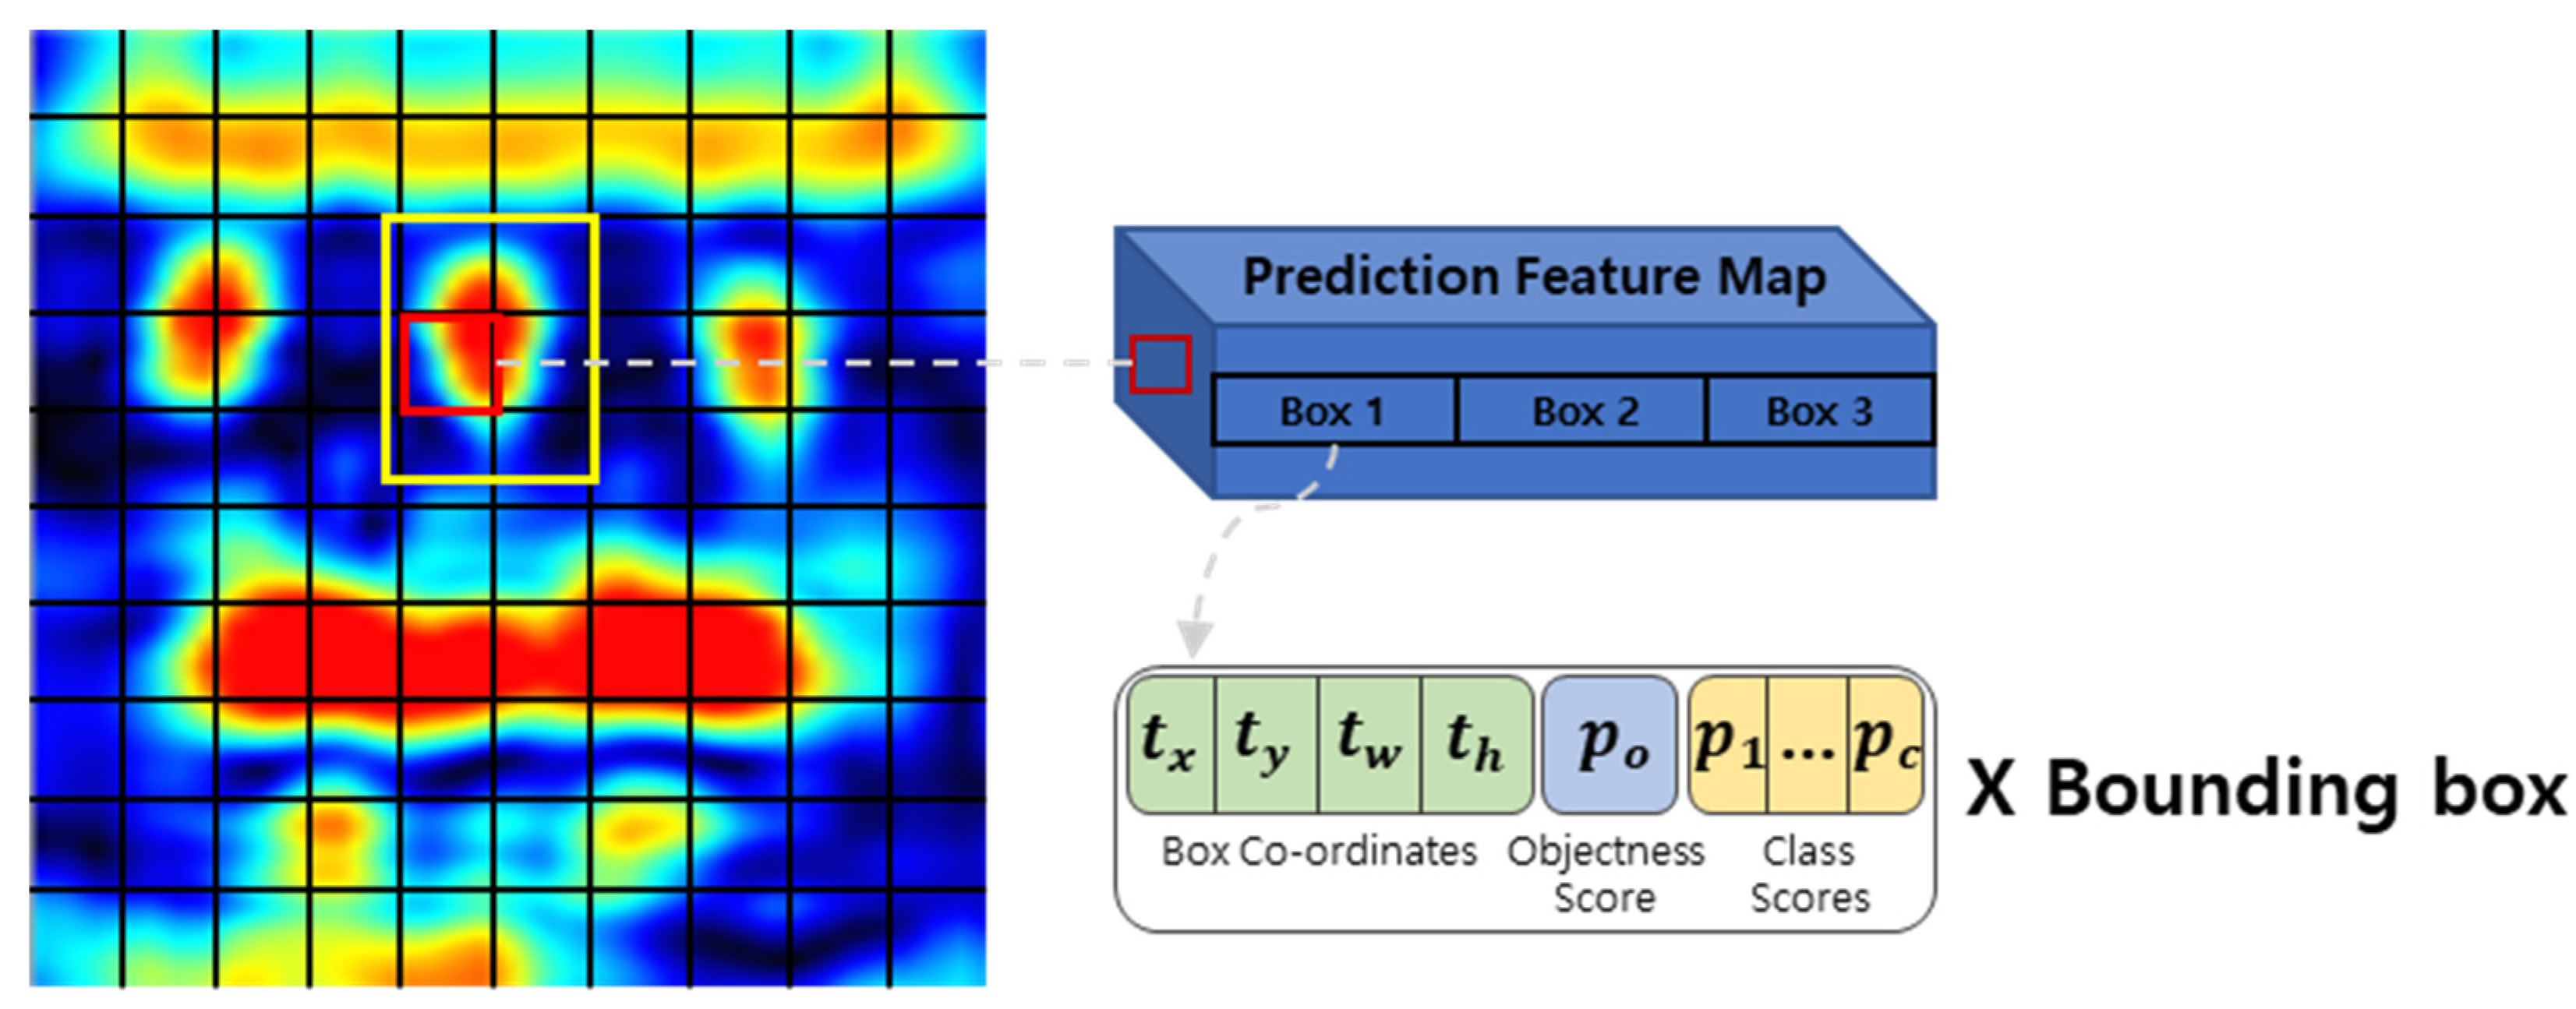
As shown in
Figure 4, YOLO-v3 estimates multiple bounding boxes simultaneously for one CNN in addition to estimating the class probability for each bounding box. The CNN used here is called the backbone network, which is used for generating feature maps. This feature map comprises several grid cells, and YOLO-v3 can simultaneously determine the type and location of the target object by applying the score method to each cell [
20,
21,
22].
2.2. Experimental Planning and Configuration
For GPR data acquisition, as shown in
Figure 5, an acrylic box specimen and a rebar specimen were prepared. The size of the acrylic box specimen was 80 × 80 × 50 cm
3, and each of the holes was ∅31 mm at a height of 25 cm, and was made for the installation of the rebar.
Figure 5b shows rebar specimens with diameters of ∅10, ∅20, and ∅30 mm, from the left to the right. In the case of data acquisition, data were acquired from the air where the noise of the GPR data was minimized for the basic experiment. This is to maximize the learning result. The specifications of the Proceq GPR Live equipment used in the experiment are shown in
Table 1, and the photographs and data collection methods of the equipment are shown in
Figure 6.
The B-scan data acquired via GPR Live were subjected to migration and noise filtering using the Proceq GPR Live software called GPR-SLICE. The structure-corrected image data are shown in
Figure 7; the samples were more clearly visible subsequent to heatmap color correction. B-scan and migrated image data were obtained by changing the diameter and arrangement of the rebars in the acrylic box specimen. Data were acquired for cases in which rebars of two diameters were installed, a rebar with a single diameter was installed, and no rebar was installed. A total of 77 data points were acquired. After establishing the dataset, an experiment was conducted to compare and verify the object recognition accuracy in terms of rebar diameter using the YOLO-v3 algorithm.
To execute the YOLO-v3 algorithm, a computer equipped with an Intel i5-6300 CPU, NVIDIA GeForce GTX 960M GPU, and 8 GB of memory was used, and
Figure 8 network architecture was selected as the backbone network [
23]. In terms of the acquired data, 80% was used as learning data and 20% was used as verification data.
3. Results and Discussion
3.1. Learning Dataset Using the YOLO-v3 Algorithm
Before proceeding with object recognition using YOLO-v3, the algorithm was trained using B-scan and migrated data. After the labelling work for AI-based learning was completed, the learning rate of the YOLO-v3 algorithm was set to 0.001, and the gradient correction coefficient was set to 0.9.
In addition, the decay value, which is a weight penalty that reduces overfitting, was set to 0.0005, and the active function used a leaky rectified linear unit (ReLU) to maintain a constant learning rate. The weight value was obtained by 9000 iterations of learning, and the learning time was approximately 30 h. The results are shown in
Figure 9 and
Figure 10.
Additionally,
Table 2 and
Table 3 show the values of precision, recall, F1-score, and mAP for the learning result. Precision is used to indicate how accurate the predicted result is, and it is calculated by dividing TP (true positive; if positive is predicted as positive) by the sum of TP and FP (false positive; in the case of incorrectly predicting negative as positive). Recall is used to indicate how well a positive is predicted when a positive is given as an input, and it is calculated by dividing TP by the sum of TP and FN (false negative; when the actual positive is incorrectly predicted as negative). In the case of F1-score, harmonic mean is used, and F1-score is used when the values of precision and recall differ substantially or do not differ very much. mAP is the value obtained by averaging the AP for all classes, where AP means an average of precision values according to the recall value.
As a result of training, the learning curves of both the B-scan and migrated data showed a tendency whereby the loss rate gradually approached zero. The decreasing trend indicates that both datasets were well learned, without overfitting. However, as the number of learning iterations increased, the loss rate decreased; therefore, if the test is performed using the weights learned after too many iterations, an overfitting problem may arise in the trained model. Therefore, the test in this study was conducted using the weights learned after 8000 iterations, which is the point where the loss rate becomes relatively constant.
Table 2 and
Table 3 show the learning results for the weights learned 8000 times. As a result of training, it was confirmed that the mAP of the migrated data was higher than that of the B-scan data. This indicates that when learning with migrated data, more accurate learning was performed, and a more accurately classified rebar diameter is possible.
3.2. Rebar Recognition and Diameter Estimation using YOLO-v3 Algorithm
The obtained B-scan and migrated data regarding rebar diameters were compared with the location and diameter of the reinforcing area acquired from the trained YOLO-v3 algorithm, with respect to different rebar diameters and positions.
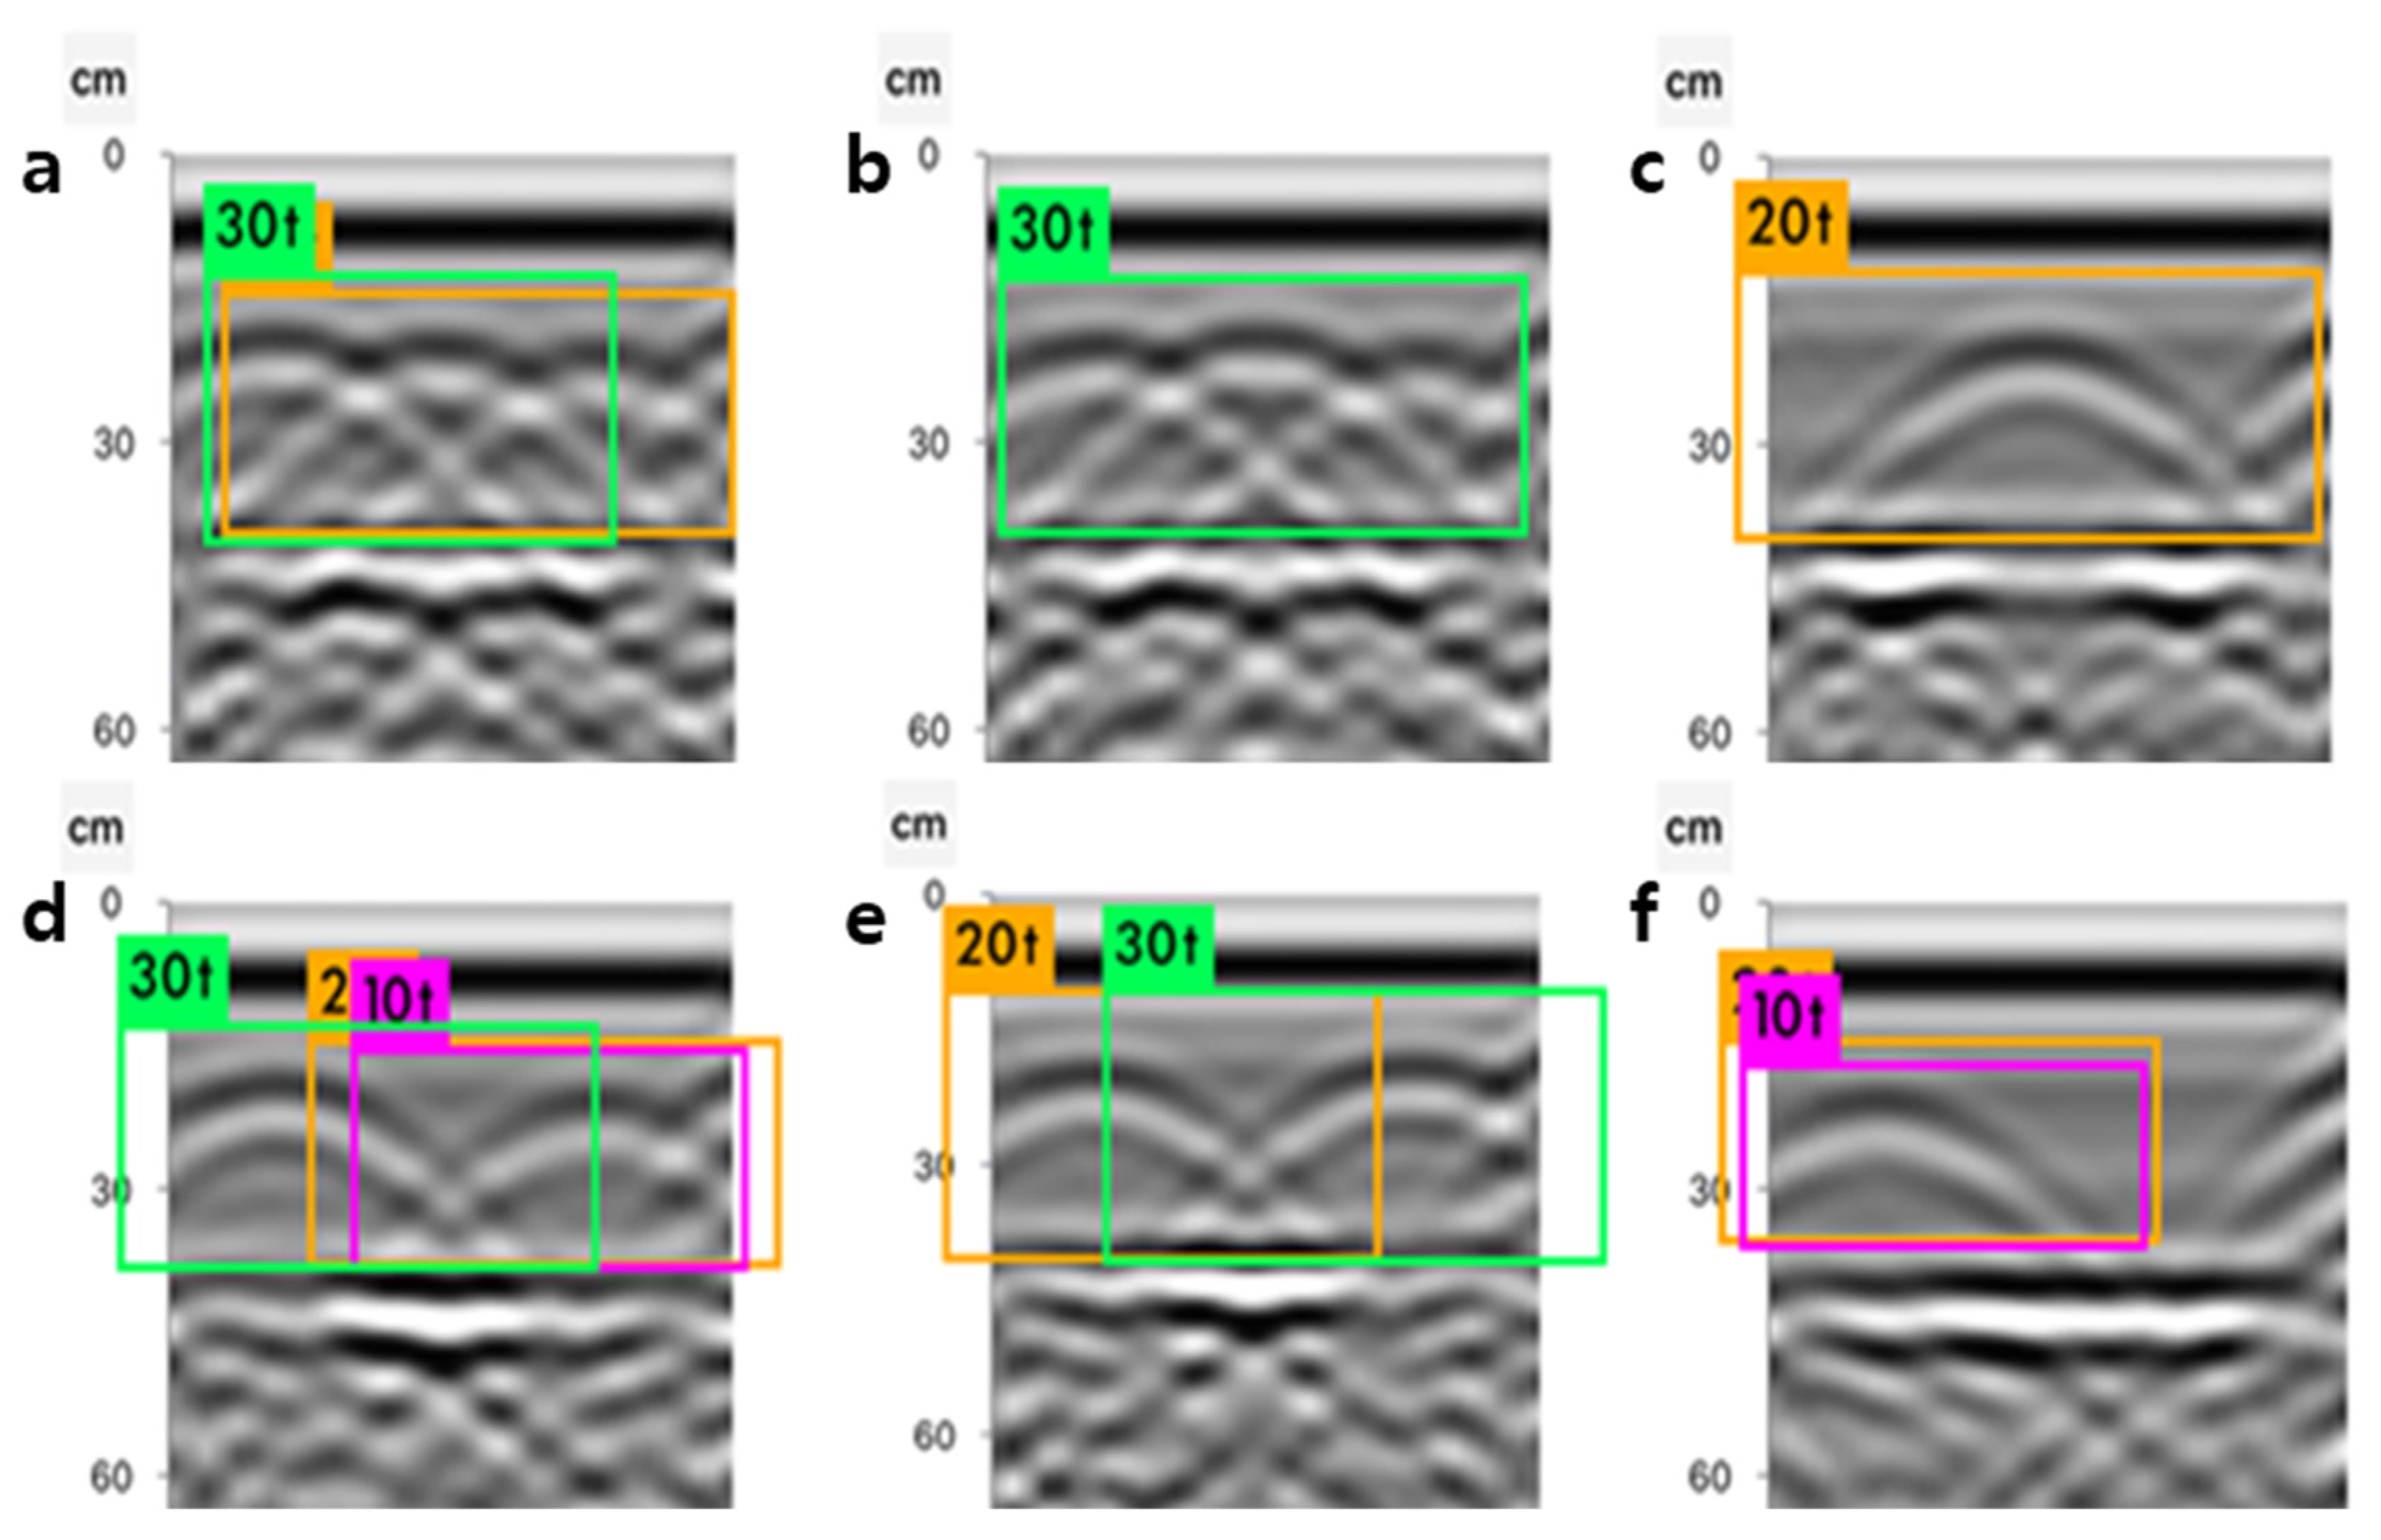
Figure 11 shows the bounding box and estimation results of rebar diameters obtained by applying the trained weight model to the B-scan image data, and
Table 4 shows the arrangement of the rebars by diameter and the results estimated using the YOLO-v3 algorithm.
Figure 11c–f demonstrates the installation of one or two rebars with different diameters. The result of applying the YOLO-v3 algorithm,
Figure 11c,e, indicated that the detection and classification of the diameter was accurate, and in
Figure 11d,f the detection showed the correct result, but it was confirmed that the classification of the diameter was incorrect.
When three rebars were installed, as shown in
Figure 11a,b, it was confirmed that rebar detection and classification with respect to diameter were incorrect, owing to the superposition of signals. The average rebar diameter estimation accuracy was 77%.
Figure 12 shows the result of using a weight model trained using migrated data, and the arrangement of the rebars by diameter. The results estimated using the YOLO-v3 algorithm are shown in
Table 5. With regard to
Figure 12, it was confirmed in all cases that the rebar detection and diameter classification were correct. The average accuracy of the estimated rebar diameters was 98% for each result. It was confirmed that the time to process one image for both the B-scan and migrated data was approximately 26 to 60 ms.
4. Conclusions
We studied a rebar diameter estimation technique for quickly estimating rebar diameter and obtaining extensive information in the field, using GPR data, during the safety diagnosis of rebars inside facilities. GPR B-scan data are commonly used to detect buried materials, and the presence and depth information of buried materials can be quickly obtained using such a method. As a basic study on rapid rebar diameter prediction by learning GPR image data in advance, an experiment was conducted to obtain accurate rebar diameter prediction results using a CNN, which is widely used for image classification based on GPR image data.
Acrylic box specimens and rebar specimens were prepared for GPR data acquisition, and B-scan and migrated data were obtained by varying the diameter and arrangement of the rebars. Using the acquired data, after performing the labeling task for AI-based learning, the weight values were obtained by 9000 iterations of learning. By performing rebar area detection and diameter estimation using the trained model, it was found that when the migrated data were used, more accurate results were obtained compared to when the B-scan image data were employed. The possibility of using this technique for rebar area detection and diameter estimation was confirmed.
Based on this research, data sets for various rebar diameters, depths, and permittivity will be constructed, and experiments will be conducted to verify the field applicability of the proposed method.
Author Contributions
Conceptualization, S.P. (Seunghee Park); methodology, S.P. (Sehwan Park); validation, K.J., and S.P. (Sehwan Park); writing—review and editing, J.K.; visualization, S.P. (Sehwan Park); project administration, J.K. All authors have read and agreed to the published version of the manuscript.
Funding
This research received no external funding.
Acknowledgments
This research was supported by a grant (20CTAP-C157163-01) from Infrastructure and Transportation Technology Promotion Research Program funded by Ministry of Land, Infrastructure and Transport of Korean government.
Conflicts of Interest
The authors declare no conflict of interest.
References
- Hu, J.; Cha, Y. Seismic Behavior of 3-Story Steel Frame Structures Subjected to Ground Motions. J. Korean Soc. Steel Constr. 2016, 28, 383–394. [Google Scholar] [CrossRef] [Green Version]
- Incheonilbo. Available online: http://www.incheonilbo.com/news/articleView.html?idxno=522727 (accessed on 1 June 2014).
- Ilyoweekly. Available online: http://ilyoweekly.co.kr/news/newsview.php?ncode=179567037545376&dt=m (accessed on 11 April 2013).
- Kim, Y.J.; Lee, S.S.; Ahn, B.Y.; Kim, Y.G. Examination on the influence of Depth, Size and Interval of Rebar on the Signal of Ground Penetrating Radar. J. Korea Inst. Struct. Maint. Insp. 2000, 4, 167–174. [Google Scholar]
- Wang, Y.H.; Cui, G.Y.; Xu, J. Semi-Automatic Detection of Buried Rebar in Gpr Data Using a Genetic Algorithm. J. Autom. Constr. 2020, 114, 12. [Google Scholar] [CrossRef]
- Pouria, A.; Mayrai, G.; Marco, A.; Alireza, A. A computer vision based rebar detection chain for automatic processing of concrete bridge deck GPR data. J. Autom. Constr. 2020, 112, 12. [Google Scholar]
- Windsor, C.; Capineri, L.; Falorni, P.; Matucci, S.; Borgioli, G. The estimation of buried pipe diameters using ground penetrating radar. J. Insight 2005, 47, 394–399. [Google Scholar] [CrossRef]
- Shihab, S.; AI-Nuaimy, W. Radius Estimation for Cylindrical Objects Detected by Ground Penetrating Radar. J. Subsurf. Sens. Technol. Appl. 2005, 6, 151–166. [Google Scholar] [CrossRef]
- Jazayeri, S.; Klotzsche, A.; Kruse, S. Improving estimates of buried pipe diameter and imfilling material from ground-penetrating radar profiles with full-waveform inversion. J. Geophys. 2018, 83, 1–15. [Google Scholar]
- Chae, J.; Ko, H.Y.; Ko, B.G.; Kim, N. A Study on the Pipe Position Estimation in GPR Images Using Deep Learning Based Convolutional Neural Network. J. Internet Comput. Serv. 2019, 20, 39–46. [Google Scholar]
- Ko, H.Y.; Kim, N. Performance Analysis of Detecting buried pipelines in GPR images using Faster R-CNN. J. Converg. Inf. Technol. 2019, 9, 21–26. [Google Scholar]
- Lei, W.; Luo, J.; Hou, F.; Xu, L.; Wang, R.; Jiang, X. Underground Cylindrical Objects Detection and Diameter Identification in GPR B-Scans via the CNN-LSTM Framework. Electronics 2020, 9, 1804. [Google Scholar] [CrossRef]
- Giannakis, I.; Giannopoulos, A.; Warren, C. A Machine Learning Scheme for Estimating the Diameter of Reinforcing Bars Using Ground Penetrating Radar. IEEE Geosci. Remote Sens. Lett. 2021, 18, 461–465. [Google Scholar] [CrossRef] [Green Version]
- Andrea, B.; Fabio, T.; Luca, B.C.; Fabrizio, D. An overview of ground-penetrating radar signal processing techniques for road inspections. Signal Process. 2016, 132, 201–209. [Google Scholar]
- Wi, C.B. Application of f-k Migration on GPR Data. Master’s Thesis, Chonnam National University, Gwangju, Korea, 1999. [Google Scholar]
- Caner, O.; Sevket, D.; Enes, Y.; Betul, Y. A Review on Migration Methods in B-Scan Ground Penetrating Radar Imaging. Math. Probl. Eng. 2014, 2014, 280738. [Google Scholar]
- Fang, Y.; Wang, B.P.; Sun, C.; Song, Z.X.; Wang, S.Z. Accelerating near-field 3D imaging approach for joint high-resolution imaging and phase error correction. J. Multidimens. Syst. Signal Process. 2019, 30, 69–92. [Google Scholar] [CrossRef]
- Shim, S.; Choi, S. Development on Identification Algorithm of Risk Situation around Construction Vehicle using YOLO-v3. J. Korea Acad. Ind. Coop. Soc. 2019, 20, 622–629. [Google Scholar]
- Venceslav, K.; Sinisha, P.; Dimitar, T. Detection and Classification of Land Mines from Ground Penetrating Radar Data Using Faster R-CNN. In Proceedings of the IEEE Telecommunications Forum, Belgrade, Serbia, 20–21 November 2018. [Google Scholar]
- Seo, J.; Ju, M.; Choi, Y.; Lee, J.; Chung, Y.; Park, D. Separation of Touching Pigs using YOLO-based Bounding Box. J. Korea Multimed. Soc. 2018, 21, 77–86. [Google Scholar]
- Redmon, J.; Divvala, S.; Girshick, R.; Farhadi, A. You Only Look Once: Unified, Real-Time Object Detection. In Proceedings of the 2016 IEEE Conference on Computer Vision and Pattern Recognition (CVPR), Las Vegas, NV, USA, 27–30 June 2016; pp. 779–788. [Google Scholar] [CrossRef] [Green Version]
- Bae, J.; Kim, J. Deep Learning Music genre automatic classification voting system using Softmax. J. Korea Inst. Inf. Commun. Eng. 2019, 23, 27–32. [Google Scholar]
- Li, Y.; Zhao, Z.; Luo, Y.; Qiu, Z. Real-Time Pattern-Recognition of GPR Images with YOLO v3 Implemented by Tensorflow. Sensors 2020, 20, 6476. [Google Scholar] [CrossRef] [PubMed]
| Publisher’s Note: MDPI stays neutral with regard to jurisdictional claims in published maps and institutional affiliations. |
© 2021 by the authors. Licensee MDPI, Basel, Switzerland. This article is an open access article distributed under the terms and conditions of the Creative Commons Attribution (CC BY) license (https://creativecommons.org/licenses/by/4.0/).


