Article

GPR Clutter Reflection Noise-Filtering through Singular Value Decomposition in the Bidimensional Spectral Domain

by
Rui Jorge Oliveira
1,2,3,*,
Bento Caldeira
1,2,3,
Teresa Teixidó
4 and
José Fernando Borges
1,2,3
1
Instituto de Ciências da Terra, ICT, Universidade de Évora, Apartado 94, 7002-554 Évora, Portugal
2
Departamento de Física, Escola de Ciências e Tecnologia, Universidade de Évora, Apartado 94, 7002-554 Évora, Portugal
3
Earth Remote Sensing Laboratory, EaRSLab, Universidade de Évora, Apartado 94, 7002-554 Évora, Portugal
4
Instituto Andaluz de Geofísica, Campus Universitario de Cartuja, Universidad de Granada, 18071 Granada, Spain
*
Author to whom correspondence should be addressed.
Remote Sens. 2021, 13(10), 2005; https://doi.org/10.3390/rs13102005
Submission received: 4 May 2021 / Accepted: 15 May 2021 / Published: 20 May 2021
(This article belongs to the Special Issue Advanced Techniques for Ground Penetrating Radar Imaging)

Abstract

:
Usually, in ground-penetrating radar (GPR) datasets, the user defines the limits between the useful signal and the noise through standard filtering to isolate the effective signal as much as possible. However, there are true reflections that mask the coherent reflectors that can be considered noise. In archaeological sites these clutter reflections are caused by scattering with origin in subsurface elements (e.g., isolated masonry, ceramic objects, and archaeological collapses). Its elimination is difficult because the wavelet parameters similar to coherent reflections and there is a risk of creating artefacts. In this study, a procedure to filter the clutter reflection noise (CRN) from GPR datasets is presented. The CRN filter is a singular value decomposition-based method (SVD), applied in the 2D spectral domain. This CRN filtering was tested in a dataset obtained from a controlled laboratory environment, to establish a mathematical control of this algorithm. Additionally, it has been applied in a 3D-GPR dataset acquired in the Roman villa of Horta da Torre (Fronteira, Portugal), which is an uncontrolled environment. The results show an increase in the quality of archaeological GPR planimetry that was verified via archaeological excavation.

Graphical Abstract

1. Introduction

1.1. Ground-Penetrating Radar Surveys in Archaeologic Environment

The main feature in applied geophysics for subsurface exploration is the use of remote sensing techniques. This feature becomes more important in archaeological environments as a previous stage to excavations and can play an important role in site delimitation, being able to make heritage protection endeavors more effective. The data processing is usually performed by fully automatic routines that produce acceptable results when the physical conditions of the terrain are favorable but fail under adverse conditions creating doubt regarding the validity of the geophysical techniques used in archaeological exploration arises.
Ground-penetrating radar (GPR) is one of the most common electromagnetic methods used in Archaeology. It has become popular since 1970 [1] due to its advantages of quick data acquisition and high resolution. The range and resolution are functions of the antenna frequency used, which typically varies between 200 MHz and 1.6 GHz in archaeological environment [2]. This method allows us to determine the spatial distribution of structures buried in the ground, such as walls, ditches, floors, cavities, and even water levels. For a high detection, two conditions should be given: a high dielectric contrast between the buried structures and a lower background noise. Currently, the standard processing flow [3] operate well when the datasets have good-medium quality, but specific routines are required for the datasets with low signal/noise ratio.

1.2. The Noise Problem in the GPR Datasets

This study focuses on those cases where the archaeological context allows us to infer that there is a strong possibility that buried structures are present, but the acquired datasets are not capable of detecting it. In these adverse conditions of low contrast, the elimination, as far as possible, of the clutter background noise on radargrams (usually designated B-scans) without significantly affecting the signal level is a crucial factor to increasing the amplitude of the useful signal. Therefore, a filter approach operating in the spectral domain using automatic data selection techniques is proposed.
Considering that the GPR signal contains two types of information: the useful signal that arrives at the receiver antenna after being reflected by buried structures; and the noise that arrives at the same time but is produced by undefined mechanisms and paths. The coherent noise as a coupled air wave, ground surface fluctuations, diffractions, environmental wave interferences, can be removed with standard filtering processes [3]. However, the clutter-scattering reflections produced by non-target objects, e.g., soil heterogeneities, stones and archaeological collapses [4] are difficult to remove without creating artefacts or producing suppressions in the useful signal.
In archaeological sites this noise is very frequent and expressive. When it is in excess in GPR signals, it is not possible to distinguish between it and the part corresponding to the buried structures (the useful signal), because its amplitudes and frequencies are similar to this useful signal components. For example, the presence of drops or corners can produce as many reflections as those originating from structures that may exist, preventing a good assessment of the subsurface content. The problem related to the identification and selection of the useful signal in GPR datasets is the main target of this research. In next sections we will present an effective algorithm that removes the clutter noise from the 3D-GPR datasets and increases the quality of the GPR images.

1.3. GPR Filtering Approaches

Regarding clutter noise removal techniques in GPR datasets, there are several approaches to perform it, which can be grouped into three main categories [5].
The first category corresponds to the classical filtering methods used to eliminate most of the coherent noise. E.g., average trace or moving average subtraction [6], time-gating with zero padding [7], entropy-based [8], Kalman filtering [9], F–K filtering [10], multiresolution wavelet analysis [11,12], wavelet filtering [13] and directional total variation minimization filter [14].
The second category comprises filters based on parametric or statistical-based methods that require reference datasets, making them dependent on the assumptions used to estimate the clutter parameters and their statistical features [15,16,17].
The third category is classified as subspace technique [15] that explores the statistical properties of the data decomposing it into different subspaces, such as the useful information and the noise. Examples of this type of approach are eigen image filtering [18], independent component analysis [19], principal component analysis (PCA) [20], singular value decomposition (SVD) [20] and robust principal component analysis [21,22].

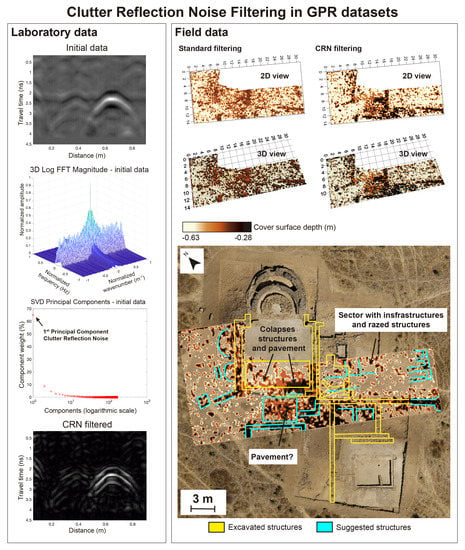
1.4. Proposed CRN Filter

The proposed method, framed in SVD-based filtering approach [5], intends to establish a new methodology to eliminate clutter reflection noise present in the B-scans as effectively as possible without modifying the useful GPR signal and as automatic.
The method considers the 2D spectral domain to perform the selection using SVD. This approach is intended to complement the common processing operations of GPR datasets. As a complementary operation to others, it is assumed that the data must be filtered out of random noise, migrated, and deconvolved.
To develop and configure this method, a laboratory experiment was prepared. The procedure consists of the identification of clutter reflection noise under controlled conditions using data obtained in a laboratory model. Then, the extraction of clutter signal was performed through the study of the signal in the 2D spectral domain and using the SVD factorization technique. The methodology was also applied to field data (uncontrolled conditions) in 3D-GPR datasets.

2. Implementation of the CRN Filter in GPR Datasets

2.1. General Overview

This research began with some laboratory experiments to study the influence of geophysical parameters on the direct problem, for the calculation of synthetic B-scans [23]. In the laboratory, a model (Figure 1a) was built to recreate a field scenario on a small scale [24]. In this, a B-scan was acquired for use in processing operations (Figure 1b), using a 1.6 GHz antenna. In parallel, a synthetic model was created in a numerical environment (Figure 1c) for later calculation of the synthetic B-scan (Figure 1d). These steps were implemented in MATLAB using the matGPR package (release 2) [25].
Comparing both datasets, in the acquired B-scan there is an amount of background noise while in synthetic one this is absent. Evidently, the difference is because the synthetic model a homogeneous medium has been considered (a limitation of the model parametrization). From which we can deduce that the soil embedded of the laboratory model produces clutter reflections when it is scanned by a 1.6 MHz GPR antenna. The attempt to filter the acquired data to bring them closer to the synthetic ones was not possible with conventional operations to process GPR data (Figure 2). This standard flow mainly consists of the correction of the surface position, deconvolution and infinite impulse response (IRR) filters [3]. This limitation motivated the study of new and more effective data filtering methodology.
The main goal rises to distinguish between useful and clutter reflections. Related literature suggests several approaches applied to images with noise using spatial filtering. These methods can be applied pixel by pixel in the raster image [26,27] that allow only a local control of the input and does not require any information about the general structure of the image, or in the spectral domain of the data using the Fourier transform [27,28] which allows to consider the structure of the image.
The CRN filter operates in the spectral domain. In the next subsections we describe the main steps taken to design it to apply to GPR datasets.

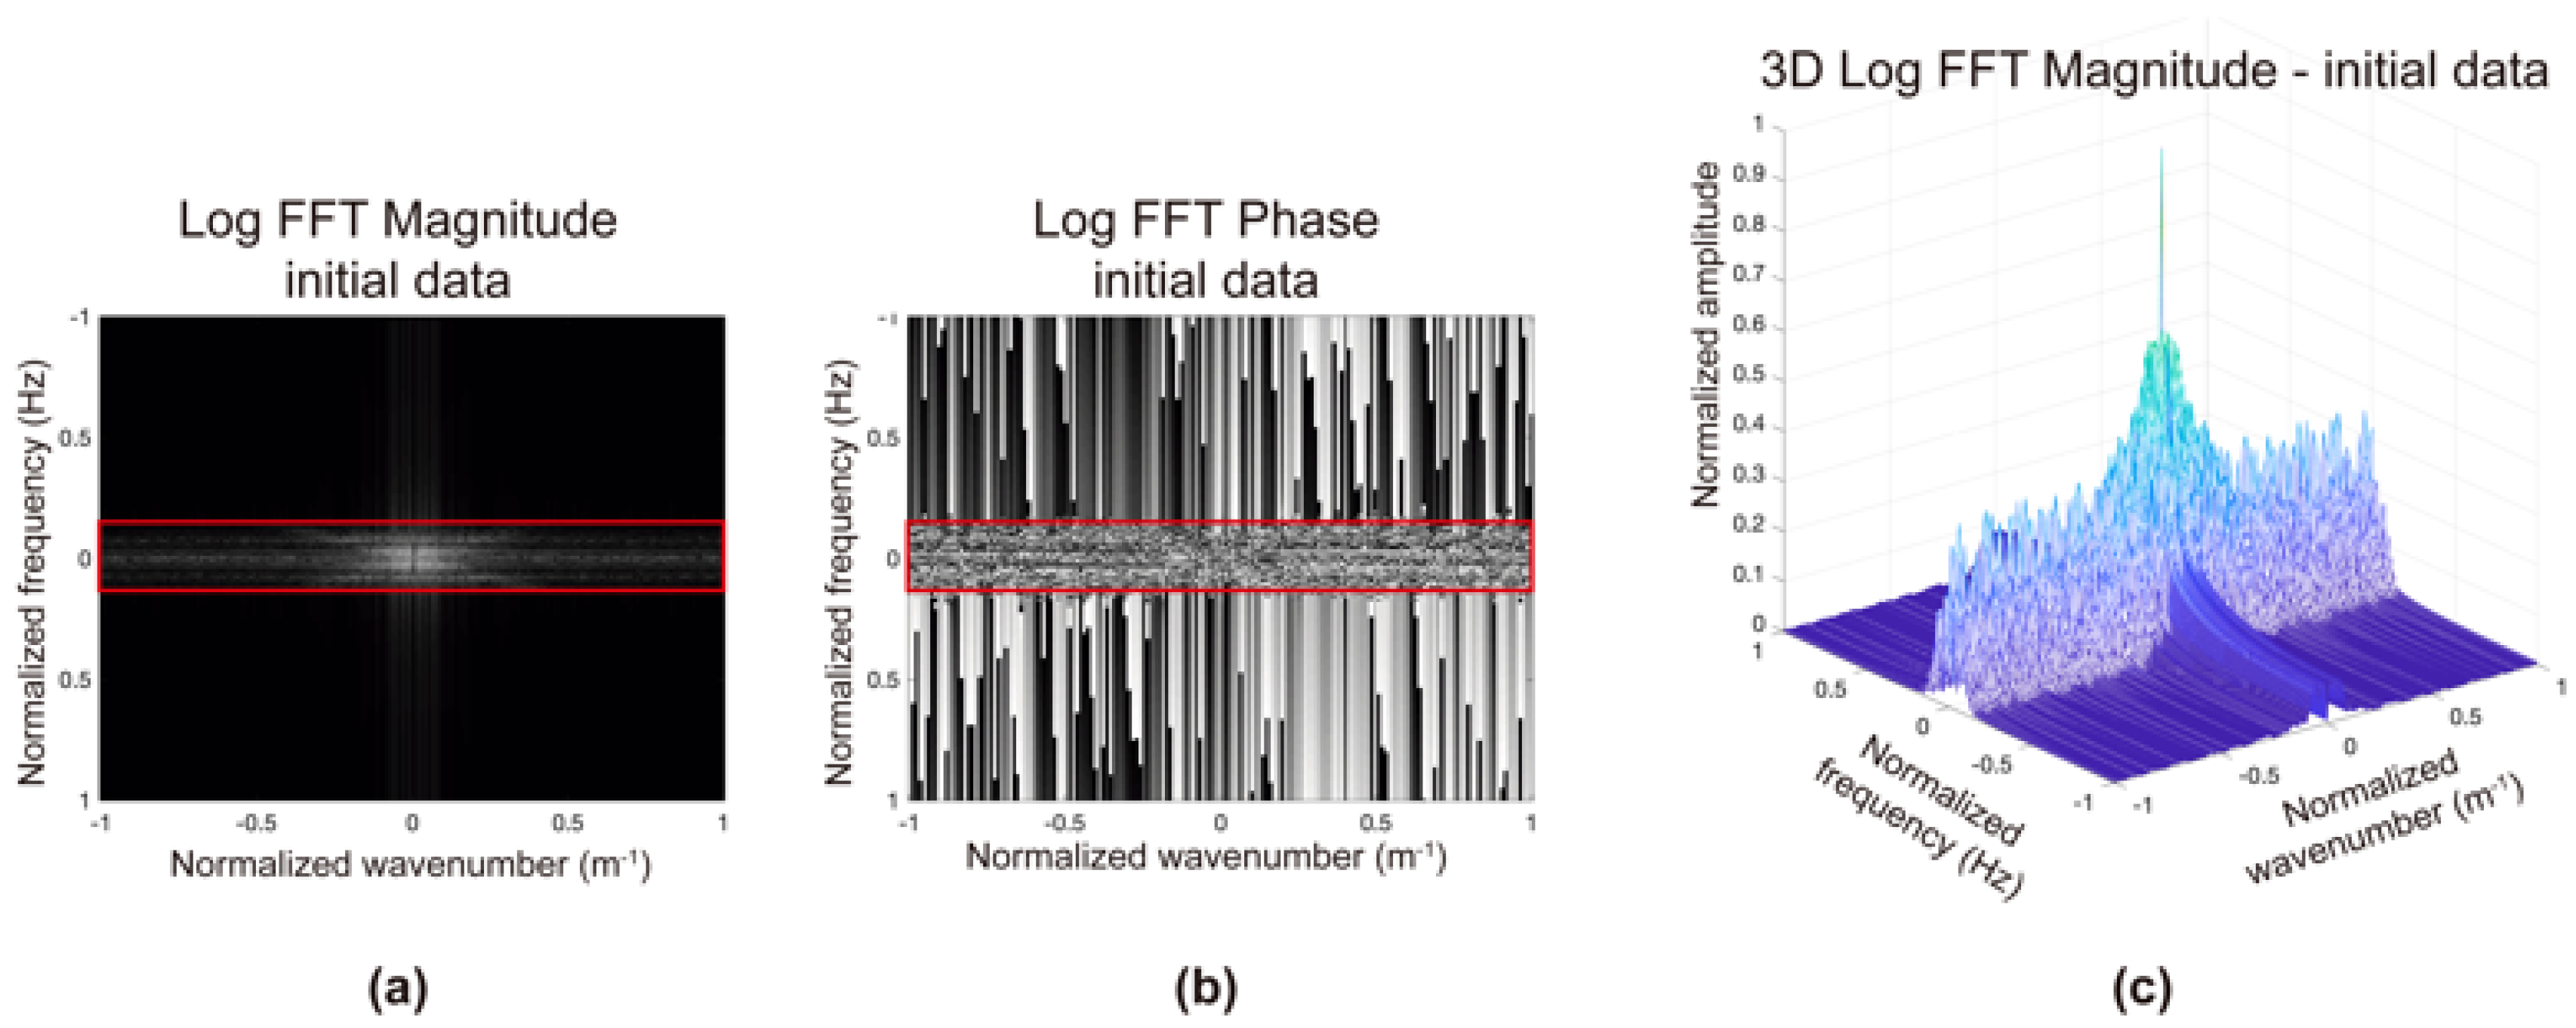
2.2. Bidimensional Spectral Analysis of a GPR Dataset

From a B-scan, which consists a set of GPR traces as a function of the position, x (x-axis), and the travel time, t (y-axis), after applying the 2D Fourier transform, the position is converted into wavenumber, k, and the time is converted into frequency, f. Figure 3a,b shows the 2D Fourier transform of the acquired B-scan (Figure 2a). In both the magnitude and phase spectra it is possible to verify that the useful signal is in the internal area delimited by the red lines. To better identify the area of interest, a 3D representation of the magnitude spectrum was generated (Figure 3c). This allows the classification of the spectrum in larger amplitudes corresponding to the coherent reflections, and the smaller ones to the clutter reflections. The outlier observed in the center of the magnitude spectrum corresponds to the wavenumber values near zero.

2.3. Parametrization and Application of the Filter Matrix

To assess how the removal of a given spectra sector impacts on the original signal, an elliptical shape (Figure 4a) was created covering the entire light-colored band observed in the magnitude spectrum. To remove the anomalous values around k = 0, a small circular area had to be created around the center of the spectrum. Thus, the total area that parameterizes the filter corresponds to the interior of the elliptical shape, except the central part defined by the circular shape. The filter to remove clutter signals will be applied as a bandpass filter, which maintains the unit values and eliminates the null values in the area (Figure 4b).
This filter (Figure 4b) can be considered to be a matrix where the parameters are the frequency range limits and the 2D finite impulse response (FIR) of the filter. To determine the matrix coefficients a dedicated MATLAB code has been made using the Image Processing Toolbox routines [29], where the outputs are the filter-matrix coefficients. The next step is the application of the 2D Fourier transform to the matrix that contains the filter coefficients and its multiplication by the transformed GPR data. Therefore, the inverse of Fourier transform is applied to restore the initial space-time domain. The results can be observed in Figure 5.
The proposed approach is very effective, but in this case the matrix parameterization process was made by trial-and-error. This was easily implemented under controlled conditions due to the knowledge of the location of the buried objects and the corresponding reflections in the B-scan. However, in a scenario more complex or with larger amounts of clutter reflections, this task may be compromised due to the high dependence of the parameterization on the user. For this reason, the possibility of applying mathematical techniques for the automatic classification of the GPR data to reduce the user dependence on this filtering approach was investigated.

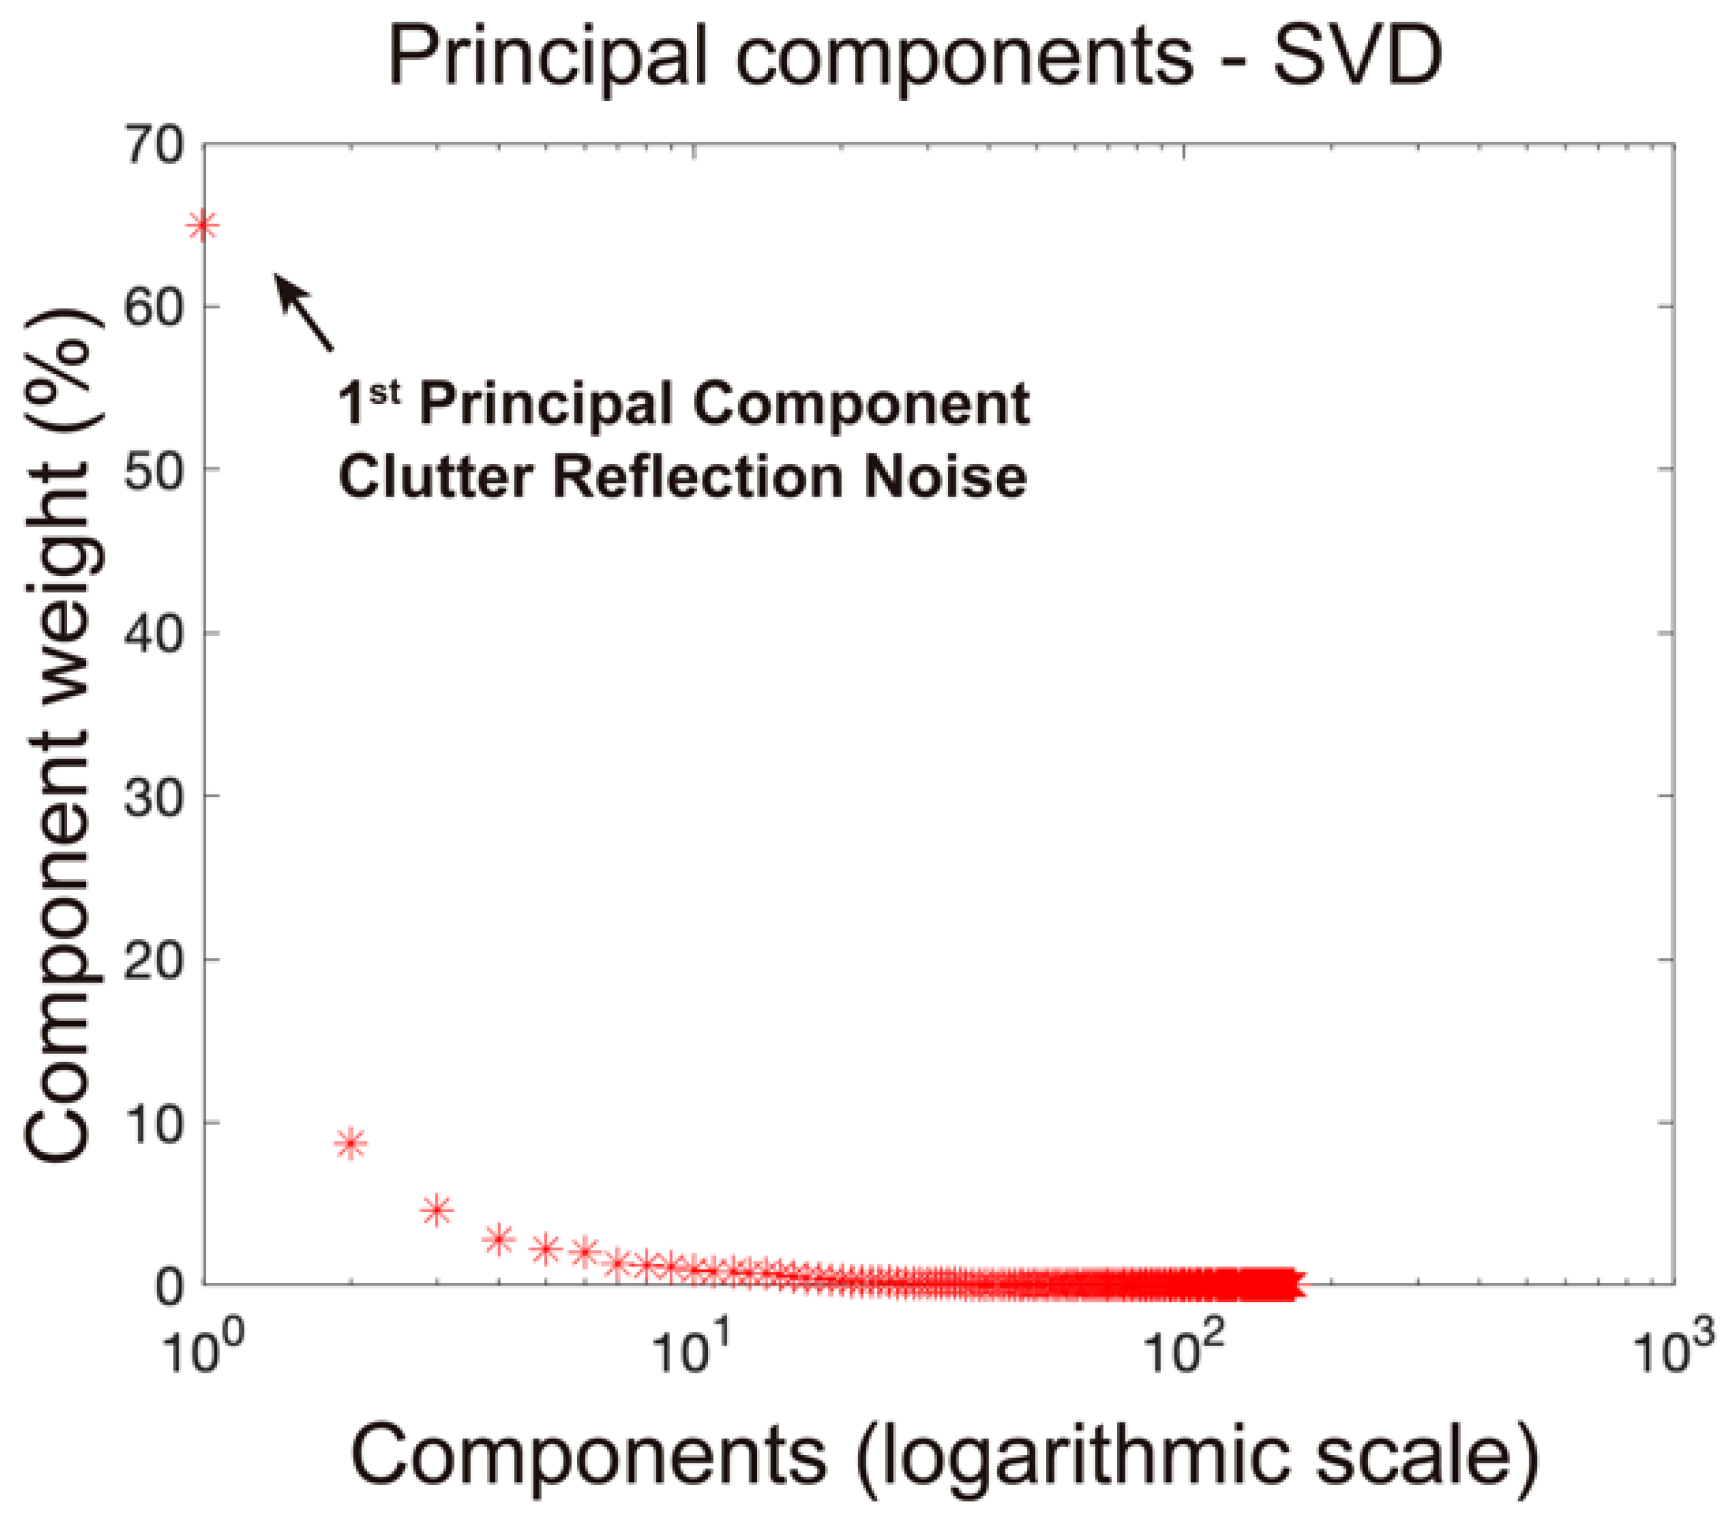
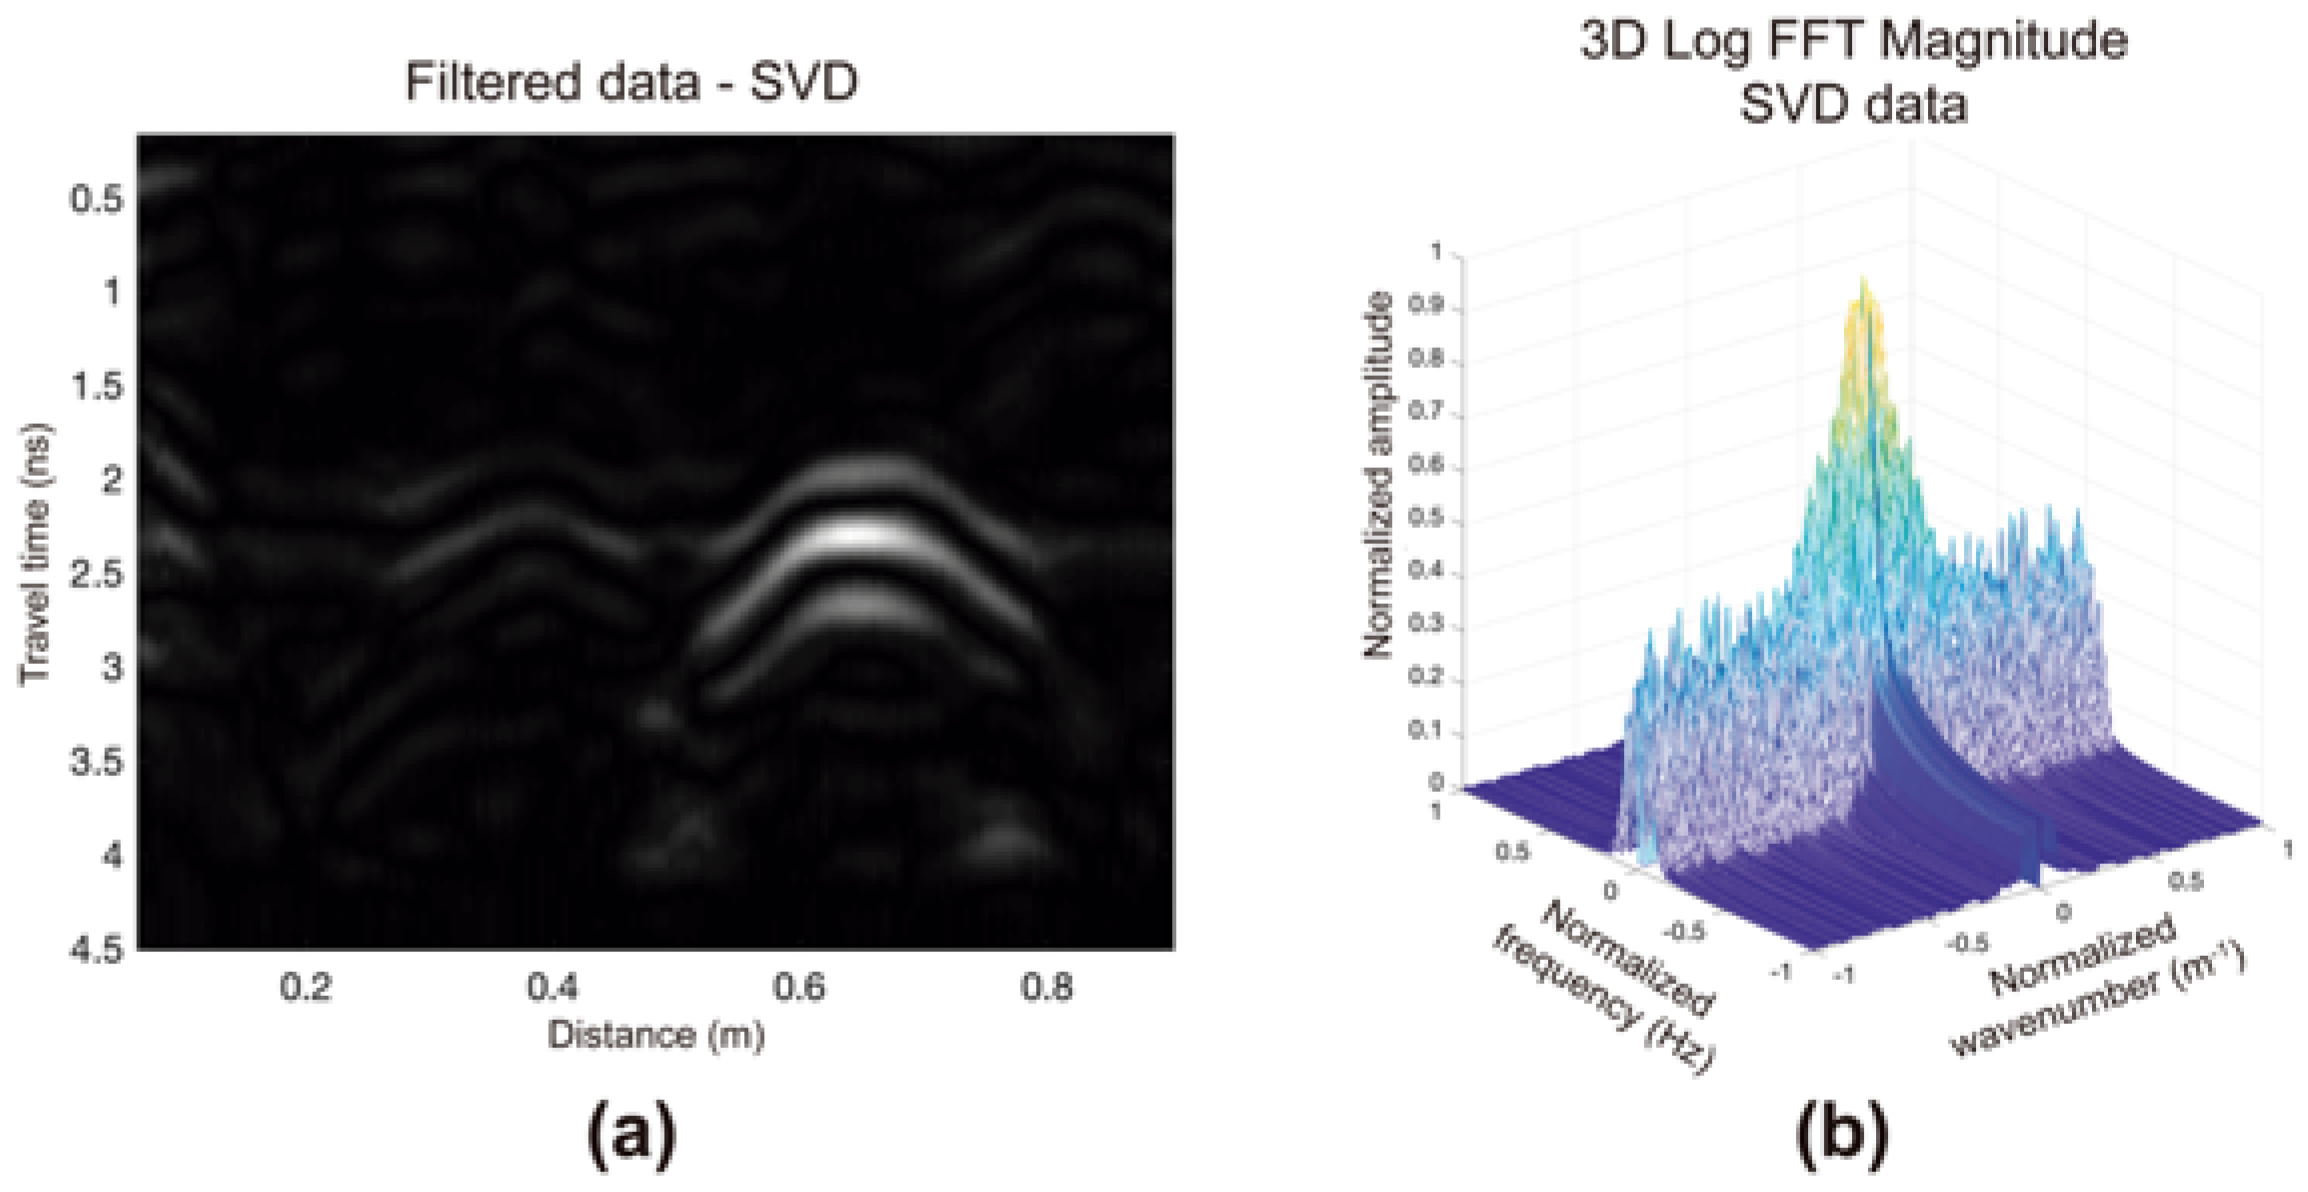
2.4. Using Singular Value Decomposition (SVD) in the CRN Filtering

There is a great diversity of multivariate statistical techniques that allow the classification of a dataset into their principal components, where each one receives a weight. Principal component analysis (PCA) is a technique that allows us to estimate the number of principal components present for a given dataset by calculating its dominant vectors [30,31,32]. In the PCA, the covariance matrix of the data contains the values related to the spectral decomposition. It is a square matrix (X), which in the case of being symmetric, then they the singular values are the absolute values of the eigenvalues of X. Taking this into account, after applying the 2D Fourier transform to the GPR data, it become symmetrical (Figure 3a), so that the PCA can be applied to classify these types of datasets.
The numerical implementation of PCA to matrix-based image data is carried out using SVD algorithms, which can be applied to matrices of real numbers and complex numbers. SVD is a very effective and stable factorization technique to diagonalizing matrices [30,31,32], because the system can be decomposed into a set of linearly independent components, each with an associated weight. This technique is generally used in data compression [33,34,35,36] and is very useful for filtering out noise [35,37].
According to [32], when SVD is applied to a dataset defined by a X matrix ( M × N ;   M > N ) , the reconstruction can be performed through the linear combination of the calculated parameters after the selection of the principal components to be used in reconstruction (1).
X = U S V T
U is an M × N orthogonal matrix, where the columns represent the left singular vectors that are eigenvectors of X X T . V is an N × N orthogonal matrix, where the columns represent the right singular vectors that are eigenvectors of X T X . S is an M × N matrix, where the diagonal values represent the singular values of X, which are different from zero; these values are sorted ordered in descending order and sum to 1.
The reconstruction of a system decomposed by SVD is carried out through the linear combination of the principal components, and some noise can be excluded without compromising the structural integrity of the image itself [32,38]. For example, in the SVD of an image, the singular values specify the luminance of the layers image and the respective pairs of singular vectors specify the geometry of each layer [30,31]. The principal components of an image with largest amplitudes usually are associated with larger singular values [32].
For a GPR dataset, the numerical environment corresponds to an amplitude matrix defined by real numbers. When the 2D Fourier transform is applied, the matrix becomes defined by complex numbers, and its spectra have symmetry. These two characteristics are compatible with the theoretical assumptions behind the SVD technique [32]. Therefore, we have the expectation that it will be effective in this type of data.
A test was carried out in MATLAB using the svd function. The input data are the 2D Fourier transform acquired B-scan. When applying SVD, the singular values and vectors of the matrix are calculated and stored in the variables U, S, and V. From S (the singular values), the weights of each principal component are calculated.
The graphical projection of the weights of each principal component will allow us to determine which ones will have greater expression in the dataset and to decide which components should be considered in the reconstruction of the data, to the detriment of the exclusion of the other components. In Figure 6, it is possible to verify that the first component has a much larger weight (approximately 65%) than the other components (<10% each). To determine which components should be considered in the reconstruction of the initial matrix, while maintaining only the useful signal of the B-scan and excluding the clutter noise, it is necessary to perform some tests by trial-and-error to ascertain the effect of removing components from the initial dataset.
The first test consists of the reconstruction of the initial data matrix considering only the first principal component to ascertain whether this component, since it has a much larger weight than the other components, corresponds to the useful signal. To verify the effect of excluding a set of principal components, the data must be restored in the space-time domain. The magnitude spectrum (3D view) will also be represented.
Keeping only the first principal component (Figure 7a,b), the filtered data shows an amplitude distribution that does not resemble the initial B-scan (Figure 2a). The magnitude spectrum reveals that most of the information has been eliminated; only remains the part corresponding to the center frequency. This result suggests that the hypothesis of the correspondence of the first principal component to the useful signal of the B-scan can be ruled out.
The second test has been the reconstruction of the initial matrix keeping only the first two principal components. The filtered data (Figure 7c,d) shows that there is also no similarity with the initial data, and the range of amplitudes also shows that most of the information it contains has been eliminated.
Following the tests, keeping the first three principal components, the filtered data already begin to show similarities with the initial data (Figure 7e,f), and the magnitude spectrum also begins to show similarities with the initial magnitude spectrum.
The next test consists of restoring the initial matrix while keeping all the principal components, excluding only the first one. The results show that the filtered data do not have the CRN that was observed in the initial data (Figure 8a), and the magnitude spectrum (Figure 8b) maintains the morphology of the initial spectrum (Figure 3c).
The result shown in Figure 8 reveals that all the principal components except the first one, with about 35% weight (less than the first) are sufficiently to represent the data. Thus, the removal of the first principal component does not compromise the structural integrity of the dataset. It can be verified that the erased component corresponds to the clutter reflections noise contained in B-scan and the remain principal components corresponds to useful reflections signal.
The next step will be to eliminate the amplitudes around k = 0. These amplitudes, which are generated by low frequencies (i.e., located at the center of the spectra), are not included in the noise since they are part of the data themselves. Their elimination must be carried out by trial-and-error until it can be seen that their removal has been successful. The numerical implementation consists of the creation of a unitary matrix, in which the center value is null (a binary filter), in the space-time domain. This implementation occurs in the application of the 2D Fourier transform, so that the filter is applied in the spectral domain through the multiplication of the filter by the data filtered by SVD.
To visualize the results of the whole CRN filter approach, it is necessary to restore the data into space-time domain. Figure 9 allows us to verify that this CRN filter has been successful. Only the reflections corresponding to the objects buried in the laboratory model were maintained.

3. Application of the CRN Filter to a 3D-GPR Dataset (Uncontrolled Environment)

A definitive test of this approach will be carried out with a 3D-GPR dataset. This test intends to verify whether the methodology improves the GPR planimetry of the buried structures. The considered 3D-GPR dataset was acquired in the Roman villa of Horta da Torre (Fronteira, Portugal), obtained with a 400 MHz antenna. Before the implementation, the profiles were partially processed with a standard flow [3] where the applied operations mainly consisted of background and vertical filtering, deconvolution, and gain adjustments. Then, the data were prepared to be processed in MATLAB, to apply the CRN proposed filtering iteratively. After that, the processed data were exported again to the commercial GPR-software to generate the 3D-GPR images (time depth-slices).
To evaluate the effectiveness of CRN filtering approach, two datasets were compared at the same depth-slices. The first one is the 3D-GPR dataset processed with the better standard flow (labelled as Standard in Figure 10), and the other is the same processed 3D-GPR dataset where the CRN filtering has been added (labelled as CRNF in Figure 10).
The analysis of the depth-slices of both datasets allows us to verify that the CRN filtering highlights reflection alignments that correspond to buried wall-type structures, and the visible alignments in both datasets were also verified as a better definition in the dataset. These observations allow us to conclude that the proposed filtering approach increases the detection of the buried structures.
To enhance the effectiveness of the CRN filter, cover surfaces [39] were generated from both datasets, considering all reflections between the depths 0.28 and 0.63 m (Figure 11a). In this 2D and 3D cover views, an improvement of the planimetry for the CRNF dataset can be verified again. In Figure 11b, the CRNF dataset was overlaid to an aerial image of the site, which allowed us to point out the excavated structures (yellow lines) and the alignments that can be seen in CRNF dataset (blue lines, unexcavated). The planimetry overlay obtained by the CRNF dataset with the archaeological excavation shows that in addition to increasing the geometric sharpness, the CRN filtering has not produced any artefacts or suppression of important reflections.

4. Discussion of the Results

The results obtained from the laboratory and field datasets show that the proposed approach is effective for filtering CRN in GPR datasets. The selection of the noise next to the signal, using the SVD technique applied in the 2D spectral domain, allowed the implementation in a customized and automated way.
In the laboratory test, a GPR profile was obtained with a 1.6 GHz antenna. The considered model was created in controlled conditions. In this study, there is a prior knowledge about the buried structures as well as their locations.
The first test carried out consisted of a manual filter parametrization by trial-and-error. Despite the good results, this scheme is highly dependent on the user decision, which prevents a possible automation of this procedure. Therefore, the next step was to study an automatic way to filter the clutter noise, to produce results similar to the obtained in the manual approach. SVD applied in the 2D spectral domain allowed to perform it effectively. However, the isolated use of SVD did not solve the noise problem completely. It is necessary to filter the amplitudes around k = 0, located in the center of the spectra, to reduce the banded graphical effect due to the high wavelength reflections. In this step, the user must use a trial-and-error approach that consists of the parametrization of the size of the filter and the cut off value until its successful removal. This is the weakest part of the approach, because it does not allow for a complete automation.
The application of the proposed filtering methodology to the laboratory dataset allowed us to isolate the reflections corresponding to the buried structures and exclude the remaining reflections corresponding to the CRN. The filtered B-scan shows that this processing considerably increased the contrast between the reflections that corresponds to buried structures and the remaining reflections; only the latter remained with values tending towards zero. The increase of the contrast allows us to enhance the perception about the existence of buried structures in the subsurface.
The approach was also applied to a 3D-GPR field data, obtained with a 400 MHz antenna in an archaeological site. This was later excavated exposing walls and floors, which was crucial to confirm the correspondence with the reflections alignments visible in the GPR results and to verify that the applied filtering approach is effective in removing the background noise while maintaining only the information corresponding to those structures.
The produced results were compared with the standard processing results, after the production of depth-slices at same depths of the 3D reflectivity model and the cover surfaces of each dataset. The graphical representation of both allows us to observe that the proposed approach can provide more useful information, with an automatic parametrization, than the obtained by classical processing. In the data obtained by the CRNF approach, the reflections corresponding to buried structures are visible at all the considered depths, showing high contrast between the background and the alignments of the reflections that correspond to buried structures that seem to have better definition. In the data obtained by standard processing, it is possible to interpret the alignments of the reflections as buried structures. However, the contrast and graphical resolution are not as clear as in the case of the proposed methodology. This comparison may seem unfair; the standard processing depends on the user experience; thus, another filter configuration can produce better results than the obtained with the standard parametrization used. Thus, we highlight that the great advantage of the proposed approach is the automation that SVD allows the introduction of the CRNF, i.e., a user with less experience in data processing can obtain a more accurate result.
Despite the effectiveness of the approach, there are some limitations that have been noted. It is necessary to remove the amplitude values around k = 0 manually, as described to the laboratory case. The good results are not so evident when we analyze the individual processed B-scans. The improve is verified after considering the depth-slices extracted from 3D reflectivity model (Figure 10 and Figure 11).
As mentioned before, this approach is complementary to the conventional processing operations used for GPR datasets. It cannot be used without first applying the common procedures. Several tests were provided to study at what stage of processing this approach works best. If it is applied before, although the amplitude values of the useful signal have not been modified, as the noise values no longer exist, then the GPR signal is anatomically different, which corrupts the application of the remaining processing operations.
The main advantage of this technique compared to others that already exist is the way in which useful information is identified in a dataset with high amount of CRN. The use of a filtering procedure combining the SVD technique with the advantages of the 2D Fourier transform has a better adaptation than the classic filtering methods that fail if the requirements for its implementation are not verified [6,7,8,9,10,11,12,13,14]. Nor do they depend on prior knowledge of the structure or standard information as with statistical-based filtering methods [15,16,17]. The proposed method depends on the data itself [15] and its application is in a two-dimensional way, unlike the most common approaches that usually consider the 1D Fourier transform, which results in a not complete effectiveness in the data selection. Using the 2D Fourier transform will improve de data selection. This approach is based on the one applied to improve noisy images by transform it into the 2D spectral domain and the selection of the useful information using parametrization based on the symmetry characteristics of the transformed dataset. Selecting the data of interest using the SVD technique turns this operation more automated from the user. The user only needs to choose the principal component that corresponds to the noise to be eliminated. This knowledge is achieved after the spectral study of the GPR data and the effect of principal components removal in the data. This procedure does not modify the structural integrity of the data.
The continuation of this study should focus on the complete automation of this GPR data filtering approach, namely the removal of the amplitudes around k = 0.

5. Conclusions

This study proposes a new methodology to perform clutter reflection noise (CRN) filtering present in ground-penetrating radar (GPR) datasets, which the standard processing flows usually cannot mitigate effectively. This approach has the advantage of the use of the 2D spectral domain, through the 2D Fourier transform, to turns easier the filter parametrization, due to its symmetry characteristics and the constant computational effort whatever the amount of data.
The high dependency of the user to parametrize the spectral filtering decreased using singular value decomposition factorization technique. This study allowed to conclude that the CRN corresponds to the first principal component of the GPR dataset. It is dominant, about 60–65% of the transformed data. Their exclusion, i.e., restoring the initial matrix considering all the principal components except the first one, eliminates most of the CRN of the B-scans considered.
The approach was effectively tested in a laboratory GPR dataset, with controlled conditions. The tests have peaked with the application to 3D-GPR dataset obtained in the Roman villa of Horta da Torre (Fronteira—Portugal, an uncontrolled environment) which produced better results with the CRN filtering methodology than using the standard processing flow. This allowed to increase the geometric sharpness of the GPR planimetry and has not produced any numerical artefacts.

Author Contributions

Conceptualization, R.J.O., B.C. and T.T.; methodology, R.J.O., B.C. and T.T.; software, R.J.O.; validation, R.J.O., B.C., T.T. and J.F.B.; formal analysis, R.J.O., B.C., T.T. and J.F.B.; investigation, R.J.O., B.C., T.T. and J.F.B.; resources, R.J.O., B.C., T.T. and J.F.B.; data curation, R.J.O., B.C., T.T. and J.F.B.; writing—original draft preparation, R.J.O.; writing—review and editing, R.J.O., B.C., T.T. and J.F.B.; visualization, R.J.O., B.C., T.T. and J.F.B.; supervision, R.J.O., B.C., T.T. and J.F.B. All authors have read and agreed to the published version of the manuscript.

Funding

This work has been partially supported by the research project “Innovación abierta e inteligente en la EUROACE” with the reference 0049_INNOACE_4_E, by the European Union through the European Regional Development Fund included in COMPETE 2020, and through the Portuguese Foundation for Science and Technology (FCT) projects UIDB/04683/2020-ICT (Institute of Earth Sciences) and SFRH/BSAB/143063/2018.

Institutional Review Board Statement

Not applicable.

Informed Consent Statement

Not applicable.

Data Availability Statement

Data sharing not applicable.

Acknowledgments

The aerial orthophotography from Roman villa of Horta da Torre was provided by Geodrone.

Conflicts of Interest

The authors declare no conflict of interest.

References

  1. Vickers, R.S.; Dolphin, L.T. A Communication on archaeological radar experiment at Chaco Canyon, New Mexico. MASCA Newsl. 1975, 11, 6–8. [Google Scholar]
  2. Conyers, L.B.; Goodman, D. Ground-Penetrating Radar: An Introduction for Archaeologists; AltaMira Press: Walnut Creek, CA, USA, 1997. [Google Scholar]
  3. Jol, H.M. (Ed.) Ground Penetrating Radar Theory and Applications; Elsevier Science: Amsterdam, The Netherlands, 2009. [Google Scholar]
  4. Bi, W.; Zhao, Y.; An, C.; Hu, S. Clutter Elimination and Random-Noise Denoising of GPR Signals Using an SVD Method Based on the Hankel Matrix in the Local Frequency Domain. Sensors 2018, 18, 3422. [Google Scholar] [CrossRef] [PubMed] [Green Version]
  5. Chen, G.; Fu, L.; Chen, K.; Boateng, C.; Ge, S. Adaptative Ground Clutter Reduction in Ground-Penetrating Radar Data Based on Principal Component Analysis. IEEE Trans. Geosci. Remote Sens. 2019, 57, 3271–3282. [Google Scholar] [CrossRef]
  6. Nobes, D. Geophysical surveys of burial sites: A case study of the Oaro urupa. Geophysics 1999, 64, 357–367. [Google Scholar] [CrossRef]
  7. Hamran, S.; Gjessing, D.; Hjelmstad, J.; Asrholt, E. Ground penetrating synthetic pulse radar: Dynamic range and modes of operation. J. Appl. Geophys. 1995, 33, 7–14. [Google Scholar] [CrossRef]
  8. Solimene, R.; D’Alterio, A. Entropy-based clutter rejection for intrawall diagnostics. Int. J. Geophys. 2012, 2012, 41804. [Google Scholar] [CrossRef] [Green Version]
  9. Kempen, K.; Sahli, H. Signal processing techniques for clutter parameters estimation and clutter removal in GPR data for landmine detection. In Proceedings of the 11th IEEE Signal Processing Workshop on Statistical Signal Processing, Singapore, Singapore, 6–8 August 2001; pp. 158–161. [Google Scholar]
  10. Haysashi, N.; Sato, M. F-K filter designs to supress direct waves for Bistatic ground penetrating radar. IEEE Trans. Geosci. Remote Sens. 2010, 48, 1433–1444. [Google Scholar] [CrossRef]
  11. Mohideen, S.; Perumal, S.; Sathik, M. Image de-noising using discrete wavelet transform. Int. J. Comput. Sci. Netw. Secur. 2008, 8, 213–216. [Google Scholar]
  12. Jeng, Y.; Lin, C.; Li, Y.; Chen, C.; Huang, H. Application of multiresolution analysis in removing ground-penetrating radar noise. In Proceedings of the CSPG CSEG CWLS Convention, Calgary, AB, Canada, 4–8 May 2009; pp. 416–419. [Google Scholar]
  13. Shi, X.; Yang, Q. Supperssion the direct wave noise in GPR data via the 2-D physical wavelet frame. In Proceedings of the International Conference on Transportation, Mechanical, and Electrical Engineering (TMEE), Changchun, China, 16–18 December 2011; pp. 1161–1164. [Google Scholar]
  14. Wang, W.; Zhao, B.; Liu, X.; Fang, G. Total-variation improved split Bregman method for ground penetrating radar image restoration. J. Appl. Geophys. 2013, 99, 146–153. [Google Scholar] [CrossRef]
  15. El-Shenawee, M.; Pappaport, C. Monte Carlo simularions for clutter statistics in minefields: AP-mine-like-target buried near a dielectric object beneath 2-D random rough ground surfaces. IEEE Trans. Geosci. Remote Sens. 2002, 40, 1416–1426. [Google Scholar] [CrossRef]
  16. Soldovieri, F.; Lopera, O.; Lambot, S. Combination of advanced inversion techniques for an accurate target localization via GPR for demining applications. IEEE Trans. Geosci. Remote Sens. 2011, 49, 451–461. [Google Scholar] [CrossRef]
  17. Lo Monte, F.; Soldovieri, D.; Erricolo, M.; Wicks, M. Radio frequency tomography for below ground imaging and surveillance of targets under cover. In Effective Surveillance for Homeland Security: Balancing Technology and Social Issues; Taylor & Francis/CRC Press: Boca Raton, FL, USA, 2013. [Google Scholar]
  18. Freire, S.; Ulrych, T. Application of singular value decomposition to vertical seismic profiling. Geophysics 1988, 53, 778–783. [Google Scholar] [CrossRef]
  19. Vuksanovic, B.; Bostanudin, N. Clutter removal techniques for GPR images in structure inspection tasks. Proc. SPIE 2012, 8334, 833413. [Google Scholar]
  20. Liu, C.; Song, C.; Lu, Q. Random noise de-noising and direct wave eliminating based on SVD method for ground penetrating radar signals. J. Appl. Geophys. 2017, 144, 125–133. [Google Scholar] [CrossRef]
  21. Kalika, D.; Knox, M.; Collins, L.; Torrione, P.; Morton, K. Leveraging robust principal component analysis to detect buried explosive threats in handheld ground-penetrating radar data. Proc. SPIE 2015, 9454, 94541D. [Google Scholar]
  22. Song, X.; Xiang, D.; Zhou, K.; Su, Y. Improving RPCA-based clutter suppression in GPR detection of antipersonnel mines. IEEE Geosci. Remote Sens. Lett. 2017, 14, 1338–1442. [Google Scholar] [CrossRef]
  23. Oliveira, R.J.; Caldeira, B.; Teixidó, T.; Borges, J.F. Influência da forma de onda emitida na comparação de radargramas. Comun. Geol. 2016, 103, 149–154. [Google Scholar]
  24. Bitri, A.; Grandjean, G. Frequency-wavenumber modelling and migration of 2D GPR data in moderately heterogeneous dispersive media. Geophys. Prospect. 1998, 46, 287–301. [Google Scholar] [CrossRef]
  25. Tzanis, A. matGPR Release 2: A freeware MATLAB® package for the analysis & interpretation of common and single offset GPR data. FastTimes 2010, 15, 17–43. [Google Scholar]
  26. Hirani, A.N.; Totsuka, T. Combining Frequency and Spatial Domain Information for Fast Interactive Image Noise Removal. In Proceedings of the 23rd Annual Conference on Computer Graphics and Interactive Techniques-SIGGRAPH 96, New Orleans, LA, USA, 4–9 August 1996; pp. 269–276. [Google Scholar]
  27. Fialka, O.; Čadík, M. FFT and convolution performance in image filtering on GPU. Proc. Int. Conf. Inf. Vis. 2006, 5, 609–614. [Google Scholar]
  28. Gonzalez, R.C.; Woods, R.E. Digital Image Processing; Prentice Hall: Upper Saddle River, NJ, USA, 2002. [Google Scholar]
  29. Lim, J.S. Two-Dimensional Signal and Image Processing; Prentice Hall: Englewood Cliffs, NJ, USA, 1990. [Google Scholar]
  30. Andrews, H.C.; Patterson, C.L. Singular Value Decompositions and Digital Image Processing. IEEE Trans. Acoust. 1976, 24, 26–53. [Google Scholar] [CrossRef] [Green Version]
  31. Kamm, J.; Nagy, J.G. Kronecker product and SVD approximations in image restoration. Linear Algebra Appl. 1998, 284, 177–192. [Google Scholar] [CrossRef] [Green Version]
  32. Sadek, R.A. SVD Based Image Processing Applications: State of The Art. Contrib. Res. Chall. 2012, 3, 26–34. [Google Scholar]
  33. Ganic, E.; Eskicioglu, A.M. Robust DWT-SVD domain image watermarking: Embedding data in all frequencies. Proc. Multimed. Secur. Work. 2004, 4, 166–174. [Google Scholar]
  34. Konstantinides, K.; Natarajan, B.; Yovanof, G.S. Noise estimation and filtering using block-based singular value decomposition. IEEE Trans. Image Process. 1997, 6, 479–483. [Google Scholar] [CrossRef] [PubMed]
  35. Sadek, R.A. Blind synthesis attack on SVD based watermarking techniques. In Proceedings of the 2008 International Conference on Computational Intelligence for Modelling Control & Automation, Vienna, Austria, 10–12 December 2008. [Google Scholar]
  36. Xu, X.; Dexter, S.D.; Eskicioglu, A.M. A hybrid scheme for encryption and watermarking. Secur. Steganography Watermarking Multimed. Contents VI 2004, 5306, 725–736. [Google Scholar]
  37. Yang, J.; Lu, C. Combined Twhniques of Singular Value Decomposition and Vector Quantization for Image Coding. IEEE Trans. Image Process. 1995, 4, 1141–1146. [Google Scholar] [CrossRef] [PubMed]
  38. Moonen, M.; Van Dooren, P.; Vandewalle, J. A singular value decomposition updating algorithm for subspace tracking. SIAM J. Matrix Anal. Appl. 1992, 13, 1015–1038. [Google Scholar] [CrossRef]
  39. Peña, J.A.; Teixidó, T. Cover Surfaces as a new technique for 3D GPR image enhancement. Archaeological applications. In RNM104—Nformes; Universidad de Granada–Instituto Andaluz de Geofísica: Granada, Spain, 2013; pp. 1–10. [Google Scholar]
Figure 1. (a) Model created in the laboratory using soil from an archaeological site in which objects were buried are: 1—cement slopes and base; 2—soil, layer 1; 3—soil, layer 2; 4—hollow plastic cylinder; 5—solid aluminum prism. (b) Synthetic model. (c) Acquired B-scan. (d) Synthetic B-scan. The B-scans are similar in terms of the object reflections. The differences lie in the background noise present in the acquired data.
Remotesensing 13 02005 g001
Figure 2. (a) Acquired B-scan (raw data) obtained in the laboratory model. (b) Processed B-scan using conventional flow (correction of the surface position, deconvolution and IRR filters). The standard processing does not remove the clutter reflections corresponding to the disperse elements of the lab soil.
Remotesensing 13 02005 g002
Figure 3. (a) Magnitude and (b) phase spectra of the acquired B-scan. (c) 3D magnitude spectrum of the same B-scan. The area inside the red lines indicates the location of useful signal in the spectra. In the 3D view, an outlier value is observed in the center of the spectrum, which corresponds to the k values near zero.
Remotesensing 13 02005 g003
Figure 4. (a) Magnitude spectrum with the elliptical red lines corresponding to the filter design. (b) Filter design of this dataset. This bandpass filter has unit value in the area to be maintained and null value in the area to be eliminated.
Remotesensing 13 02005 g004
Figure 5. Results from the spectral filtering approach. (a) Input data in the space-time domain. (b) Magnitude spectrum of the filtered data. (c) Phase spectrum of the filtered data. (d) Filtered data in the space-time domain. The applied filter was effective to erase the CRN. However, this is highly dependent on the user parametrization.
Remotesensing 13 02005 g005
Figure 6. Principal components of a B-scan obtained by SVD after the application of the 2D Fourier transform. The first principal component is dominant (65%). The remaining components have a weight less than 10% each.
Remotesensing 13 02005 g006
Figure 7. Results of the performed tests to verify the effect of the data restoration and its magnitude spectra considering only some principal components. (a,b) Filtered data keeping only the first principal component. (c,d) Filtered data keeping the first two principal components. (e,f) Filtered data keeping the first three principal components.
Remotesensing 13 02005 g007
Figure 8. Results of the test to verify the effect of the initial data restoration considering all the principal components except the first one. (a) Filtered data. (b) 3D magnitudes of the filtered data. By removing the first principal component, which corresponds to the CRN, the restored signal corresponds to the useful information contained in the B-scan.
Remotesensing 13 02005 g008
Figure 9. Results from the application of the filter in the spectral domain. (a) Input data in the space-time domain. (b) Magnitude spectrum of the filtered data. (c) Phase spectrum of the filtered data. (d) Resulting data CRN filtered in the space-time domain.
Remotesensing 13 02005 g009
Figure 10. Comparison between the same GPR depth-slices without (Standard) and with spectral filtering (CRNF). The CRN filtered results allow us to observe that there was an increase in the contrast between the background and the coherent reflections of buried structures.
Remotesensing 13 02005 g010
Figure 11. (a) Cover surfaces from Standard and CRNF datasets (2D and 3D views). (b) Cover surface from CRNF dataset superimposed on an aerial image obtained by a drone (provided by Geodrone). A schematic representation of the visible structures (yellow lines) and the alignments obtained by the geophysical prospection (blue lines, unexcavated) is included. The CRNF results show that the structures visible in the Standard dataset become more defined and better individualized.
Remotesensing 13 02005 g011
Publisher’s Note: MDPI stays neutral with regard to jurisdictional claims in published maps and institutional affiliations.

