1. Introduction
Precision agriculture (or site-specific crop management) is an internationally recognized concept and term referring to land cultivation by means of nontraditional technologies that were first designed and developed at the end of the 1980s [
1,
2,
3]. The aim of the concept rests in adjusting cultivating procedures to suit local conditions, the main principle being to perform the crop-growing tasks at the right place, intensity, and time [
4,
5].
The standard process to estimate the condition of crops during the growth phase, especially when the correct harvest time has to be defined, involves a land survey in which sample plants are manually collected and then chemically analyzed in a laboratory. Such an approach, however, is labor- and time-intensive because it relies mainly on direct human inspection inside the crop fields, which are usually inhomogeneous and thus difficult to characterize accurately through a single analysis. An effective alternative then appears to lie in remote sensing, a technique applicable in determining crop maturity degrees over large areas. The procedure yields rapid information on spatial and temporal changes in the monitored quantities [
6], allowing farmers to recognize and differentiate between the specific conditions that characterize individual portions of the land; this task can also be performed via other survey methods, but only with considerable difficulty. The noninvasive evaluation of crop quality by means of multispectral imaging facilitates reform steps in agricultural management [
7,
8,
9,
10]. In the discussed field, remote sensing generally offers two functional options, namely, satellite imagery [
11,
12,
13,
14,
15] and unmanned aerial vehicle (UAV) photogrammetry [
16,
17,
18,
19,
20].
Advancements in unmanned aerial vehicles (UAVs) and the related developments concerning their use in remote sensing have made the technology a promising tool in recent decades [
21]. Most importantly, UAVs (drones) as a remote sensing platform have shown major potential in crop-growth monitoring [
22,
23], where they ensure a proper balance between the image quality, sensing efficiency, and operating cost. The spectral information and vegetation indices derived from UAV-delivered multispectral or hyperspectral data have now been widely tested for this purpose [
24,
25,
26].
This article describes the monitoring of a selected corn hybrid within pre-defined growth intervals, to find a relationship between the variation in the nutritional values of crops and changes in UAV-based photogrammetry images. In this context, one of the main problems investigated is the connection between the data obtained from chemical analyses of sample plants and the vegetation indices calculated from spectral reflectivities, which are monitored by using a multispectral camera. The aim of the research is to establish experimentally whether the optimum corn harvest time and quantity can be predicted, with an emphasis on searching for a mathematical relationship between a variation in the content of dry matter in the sampled corn and changes in the vegetation indices. The dry matter content constitutes a significant nutritional parameter for both biogas stations and livestock production [
27,
28]. The optimum corn harvest time differs according to the intended use of the crop and the technical equipment and installations in the relevant works; for this reason, it is then important to specify the ideal harvest time as precisely as possible, considering the circumstances [
29,
30,
31].
At present, the maturity of silage corn is normally estimated based on the targeted sampling of plants over large corn-growing farm areas (usually having an acreage of dozens of hectares). The counts of samples differ markedly, depending on the desired accuracy. The proportion of dry matter, nutritional substances, and other parameters are defined by means of a 7- to 10-day laboratory analysis. Due to the cost, the heterogeneity of the samples, and labor intensity, the actual survey can be carried out with only a limited set of samples and does not effectively cover the areal changes in the vegetation. Within the Czech Republic, by extension, the diversity of pedoclimatic conditions and the sizes of land units point to a substantial imbalance in the properties of land managed by enterprises, and embody preconditions for the successful implementation of the principles of precision agriculture.
Currently, systems are available that can assess comprehensively the quantity and quality of crops; to provide relevant examples, we can refer to John Deere’s HarvestLab 3000 and the Evo NIR sensor by Dinamica Generale S.p.A. Such systems utilize NIR (near-infrared) cameras mounted on the harvesters, and are operated only during the harvest period [
32,
33,
34]. When seeking the optimum nutritional values, agricultural technologists and researchers employ various types of prediction; the authors of source [
35], for instance, exploited superspectral airborne imagery to predict corn grain yield and ear weight, and to discriminate between growth stages and irrigation treatments. The use of multispectral imaging to determine the phenophase, however, is somewhat contrasted by the fact that the authors focused solely on utilizing the normalized difference vegetation index (NDVI). Predicting the optimum harvest time is associated with diverse factors, including the volume of dry matter in the plants. The problem of dry matter in forage corn grown for silage is discussed in paper [
36], with an emphasis on measuring the NDVI of the plants.
By contrast, our concept has been formulated to deliver area-specific harvest estimates that involve more input elements than merely the NDVI or chemical analyses performed with a limited number of plants from over the entire field. This article thus outlines original options for predicting the optimum harvest time, and these are based on searching for correlations between the chemical analysis of sampled corn and the images acquired with a spectral camera in the course of a UAV photogrammetry cycle. By another definition, the novelty of this article rests in that the statistical analysis is applied to reveal hitherto unexplored relationships between nutritional parameters, acquired through chemical analyses and vegetation indices yielded via processing data collected by a multispectral camera. These relationships will be utilized in estimating the optimum harvest time for the entire area of the selected cornfield.
To summarize the various views and perspectives, we can point out that this subsector still offers ample room for new approaches and interpretations.
As regards the actual structure of this article, the text is organized into three sections:
Section 2 presents the chemical analysis of the samples, the remote sensing, and the data correlation methodology,
Section 3 introduces the results, and
Section 4 contains the discussion and conclusion.
2. Materials and Methods
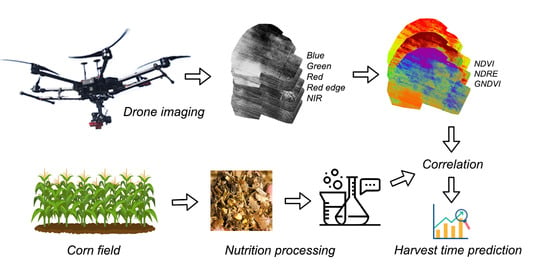
The data collection and mathematical processing are characterized in the block diagram in
Figure 1. The information relating to the investigated agricultural land is captured via UAV photogrammetry and manual selection.
The multispectral images delivered by the UAV-mounted camera enable us to compile relevant reflectivity maps, which then facilitate computing the vegetation indices. To obtain the nutritional indicators in the sampled corn, we performed laboratory-based chemical analysis. The vegetation indices and the results of the analysis were then correlated at various stages of the growth phenophases; this step allowed identifying the time when the crop yield is ideal for ensuring the production of silage or methane.
2.1. Study Site
The experimental monitoring and sampling were carried out over agricultural land managed by the enterprise Bonagro Blažovice, a.s., the type of crop involved being the corn hybrid LG Apotheos FAO 500, delivered by Limagrain Central Europe S.E. The land is located in the vicinity of the village of Prace (
Figure 2), in the South Moravian Region, Moravia, the Czech Republic; the coordinates of the test fields are 49.1472789N, 16.7701758E. In terms of the climate, the land, being situated within a temperate zone and at an altitude of 260 m, generally experiences warm to hot summers. During the monitored phenophase, the average air temperature and precipitation reached 14.7 °C and 12.7 mm a week, respectively. The average amounts of precipitation differed between the individual sampling cases. The concrete values equaled 17.5 mm per week in the first 3 weeks, zero (no rain) in the following 3 weeks, and 45.5 mm in the last week.
The experiment started with the initial corn sampling on 12 August 2020, when the crop was going through the second half of the phenological stage of growth and was still earless. Procedurally, in the area of interest, we performed imaging and collected samples for chemical analysis, invariably at weekly intervals. In total, the samples were collected at eight time intervals, and the last sampling took place on 5 October 2020; by that date, compared to corn not involved in the experiment, the condition of the plants had already corresponded to a later post-harvest stage. The sampling and imaging were regularly executed between 12 p.m and 2 p.m.
2.2. Imaging Methodology
The initial step consisted of acquiring a sufficient quantity of various data by using a multispectral camera mounted on a UAV (
Figure 3a,b). For this purpose, we employed a MicaSense RedEdge camera on a DJI Matrice 600 Pro aerial vehicle. The camera operates in 5 narrow spectral bands, and each of the sensors has a resolution of 1280 × 940 pixels. The device ensures the narrowband recording of wavelengths in regions sensitive to the human eye, namely, the range of 400 to 700 nm in blue—B, green—G, and red—R, and also within the rim of the red sector of visible light (red edge—RE); the near-infrared (NIR) range, invisible to the human eye, is recorded also. The concrete parameters of the bands are summarized in
Table 1. To carry out the scanning, we preset the automatic sequential image shooting mode, based on the exact position of the aerial vehicle. The images were stored on a memory card, together with the metadata comprising the concrete GPS locations where the images were taken. Importantly, the camera contains a light sensor module to correct the exposure at varying light intensities; the sensor thus automatically adjusts the camera exposure according to the angle of the incident beams and the brightness. To compensate for the reflectivity, we calibrated the sensors before each flight by taking images of the gray calibration panel indicating the known parameters (
Figure 3c). The panel ensures that the images remain stable regardless of the light conditions.
The flight path was created via the application Pix4D Capture [
37]. The total area of the monitored crops exhibited a rectangular shape and dimensions of 401 m × 331 m (approximately 13.2 ha) (
Figure 4). The length of the flight path equaled 4477 m, and the actual survey flight took 31 min, with an image overlap of 70%. The UAV performed the imaging at a speed and height above ground level of 8.6 km/h and 40 m, respectively. In each monitored band, we acquired 450 images with a resolution of 2.78 cm/pixel.
2.3. Nutrition Value Processing
The biomass from the harvested crops comprises exclusively whole corn plants. The basic indicator relating to the phenophase of crops rests in determining the dry matter content; the term dry matter then represents the solid, waterless portion of fodder. In corn, the dry matter indicates vegetation maturity [
29]. During the vegetation growing season, the chemistry of corn plants changes; in the course of the earless phases, the energy is stored particularly in the fibers. Fodder for dairy cows, however, requires ear starch. Thus, to ensure that the silage contains both the fibers and the starch, the crops are harvested at wax maturity, when the plants’ dry matter content reaches 280 to 330 g/kg. In such cases, the milk line stage attains the level of 2/3 in the corn grain. Another vegetation maturity indicator lies in the corn’s capability of being silaged, namely, producing the fermentation acids that conserve the silage.
The quality of the fermentation processes is fundamentally influenced by the harvest time and the total biomass quantity.
Every year, the properties of the crops and the silaging are highly variable, depending on the weather, the selected hybrid and its Food and Agriculture Organization (FAO) designation (the number of vegetation days), and the quality of sowing and care. During the growth, the dry matter content increases, and the fibers lignify. Furthermore, the development of the ears causes the volume of starch to rise, while the amount of sugars decreases due to their transformation into grain starch. In this manner, an easily silageable plant becomes one that can be silaged with medium difficulty, and the chopped crop then has to be shortened to allow effective packing-down and air removal. All of these changes play a major role in the specification of the harvest time [
6,
30].
The sampling was invariably performed at identical time intervals, together with the multispectral imaging. To monitor the quality of the corn hybrid, we opted for sampling according to the methodology recommended by the Central Institute for Supervising and Testing in Agriculture, Brno, Moravia, the Czech Republic [
38]. Before commencing the inspection, we selected 3 spots in various sectors inside the area to obtain representative data of the growth homogeneity. Each of the spots provided 10 successively neighboring plants, and these were immediately transported to the Pohořelice-based laboratories operated by the company NutriVet, s.r.o. After being separated, the samples were ground and dried at 60 °C for approximately 24 h to yield a stable content of dry matter. At the sampling and measurement stage, the plants were still earless and could thus be shredded without prior disjoining. The dried mass was homogenized by grinding in a laboratory mill with 1-mm screen openings. Subsequently, each sample was analyzed twice to supply, at different stages of the procedure, information relating to the following structural, nutritional, and chemical quantities: FM—fresh matter; EW—ear weight; DM—dry matter; CP—crude protein (established from the dry matter); CF—crude fiber; starch—starch content; ash—ash content; NDF—neutral detergent fiber; DNDF—digestibility (NDF); and DOM—organic matter digestibility. The data obtained then facilitated computing the hectare yield indicators, namely, the yields of fresh matter (YFM) and dry matter (YDM).
All of the analyses involving the chemical quantities indicated above were executed by applying common techniques. The contents were determined via the methods specified by the Association of Official Analytical Chemists (AOAC), which are represented through numerical codes; here, each code stands for a method used with a particular substance. Thus, we can provide the following list: DM (# 934.01), ash (# 942.05), crude protein (# 976.05), starch (# 920.40), NDF (# 2002.04), and DNFD (# 973.18) [
39,
40,
41,
42]. The outcomes then enabled us to compute, for each sampling phase, the average values in the monitored substances. After the fifth sampling, when the corn had already developed the ears, the analysis already involved separating the ears from the parent plants and weighing them without the leaves. The procedures were completed by establishing the dry matter and starch contents.
Usually, corn sampling to assess the condition and phenophase takes place at diverse spots. At the milk line stage, the samples began to be transported to laboratories to determine the dry matter contents in both the grain and the entire plant. Based on the level of plant development and the dry matter volume, the harvest time is preliminarily specified and differentiated according to the intended use, namely, milk or methane production (the latter in biogas stations).
2.4. Vegetation Reflectivity Preprocessing
The scanned multispectral wavelength bands for the blue, green, red, red edge, and near-infrared sectors interact with the vegetation differently, depending on the solar radiation, the absorption and reflection of which result from and show dissimilarities in the overall chemical composition and the contents of water, pigments, and nutrients. The high contrast of variations in the near-infrared band ensures broad usability when setting up vegetation indices. Furthermore, the narrow red edge band also exhibits strong reflectivity changes, from the absorption of red to the considerable reflection of near-infrared radiation. Out of the monitored bands, the near-infrared spectrum has the strongest reflectivity, and, together with the red band, is the most frequently applied option when assembling vegetation indices [
20].
The data sensing was carried out at eight time intervals corresponding to specific 7-day phenophases of plants. For each of the monitored spectral bands, we formed a TIF image that embodied a reflectivity map covering the entire area. In these maps, we defined the homogeneous growth subareas that matched the sampling spots. The multispectral images of the individual scanned phases were processed using the Pix4D Mapper software. We then set up a color matrix of the vegetation pixels, assigning this matrix to each image data band. The images of the gray calibrating body indicating the known reflectivity values allowed us to acquire the mean reflectivity value in the preset section of the monitored growth area.
The patterns of the scanned spectral band values will produce a spectral reflectance curve, which represents the quantity of radiation reflected over the entire range of the wavelength bands observed. The spectral reflectance,
, defines the energy proportion between the reflected
and the incident
solar radiation at a certain wavelength; utilizing the formulas employed in sources [
43,
44,
45,
46], we then have:
2.5. Multispectral Indices
The indices usually originate from computing at least two spectral images, selected in such a manner that the vegetation reflectivity changes become prominent. In the majority of cases, the indices are functionally equivalent, and more than 150 have been presented in the literature to date; however, only a small subset of these rest on a solid biophysical basis or were systematically tested [
47,
48,
49,
50,
51,
52]. Our experiment verifies possible correlations in three proportional indices, computed via a normalized proportion of surface reflectivities.
Each vegetation index focuses on certain vegetation properties and has a specific applicability. To facilitate the analysis, we used the proportional indices NDVI, NDRE, and GNDVI; all of these instruments are computed identically, the only difference being that they contain diverse spectral bands. Together, the indices then embody a comprehensive cross-section through the observed wavelengths (
Figure 4).
The formula for calculating the normalized vegetation indices and the spectral band reflectivities reads:
The normalized difference vegetation index, NDVI, constitutes a numerical indicator of plant health and a source of details on vegetation changes. The index also performs the following functions of informing on the amounts of water stress and the chlorophyll in a plant, assessing the monitored vegetation surface through the proportion between the red and infrared sectors of the spectrum, and recognizing tiny vegetation differences, due to the reflectivity of the near-infrared spectrum [
41].
The NDVI takes values between −1 and 1; the higher values usually represent “greener” plants having a photosynthetic capacity greater than that of the other components within the area of interest. In permanent crops, grasses, and cereals, but also in some row crops at the later stages of full growth, the chlorophyll content reaches a point where the index “saturates” close to the maximum value (NDVI 1.0). In such cases, detecting differences between plants by using the NDVI becomes problematic. At the later growth stages, the vegetation aging causes the NDVI values to decline [
53,
54,
55].
The NDVI utilizes the red band, which is intensively absorbed by the upper portions of the overall plant surface. The lower levels of the plant thus do not contribute significantly to the actual measurement, worsening the correlation between the NDVI and the volumetric properties of the plant. This effect becomes more important in tall plants that carry multiple layers of leaves, especially at the later stages [
53].
The normalized difference red edge index (NDRE) utilizes, similarly to the NDVI, the near-infrared band and the frequency band that is situated in the transition region between the visible and the infrared spectra, namely, the red edge band (
ρRedEdge) [
56].
In the NDRE, the computation allows us to better penetrate permanent or late crops, as the absorption by only or primarily the upper level of the plant is not as intensive as in the NDVI. Moreover, the NDRE is somewhat less sensitive to saturation in thick vegetation and therefore offers superior effectivity in the measurement of changes, when the NDVI takes near values +1.0 [
53,
56].
The green normalized difference vegetation index (GNDVI) exploits for the computation the wavelength of the green spectrum instead of that of the red one, with ρ
NIR representing the reflectivity values in the near-infrared band and
ρGreen denoting the values in the green band [
57].
The benefit of this index lies in its high correlation with the biophysical parameters of the investigated plants and its low sensitivity to other areas monitored. At the green wavelengths, the reflectivity better responds to variation in the biomass quantity. Furthermore, the green band delivers a higher probability of capturing differences in the lack of nutrients, which then manifest themselves in the resulting production of crops. Assuming these advantages, the index has the potential to eliminate the insufficient sensitivity of the NDVI (due to the green component of the spectrum) [
58].
Figure 5 below shows the maps of the vegetation indices characterizing the examined land at the fifth stage of scanning.
2.6. Correlation Analysis
To determine the relationships between the chemical analyses and the reflectivities of the spectral images, we sought the correlation coefficients. In this context, correlation does not imply causality: we only searched for a mutual linear relationship. The correlation rate was specified through the calculated correlation coefficient, which may take a value from −1 to +1. The resulting values of the correlation coefficient +1 establish a completely direct relationship, and the first variable tends to grow; by contrast, the values of the coefficient −1 establish a wholly indirect relationship, and the first variable tends to decline. If the coefficient equals zero, then no linear relationship exists between the monitored parameter and the reflectivity or the vegetation index.
To decide whether the correlation coefficients were large enough to enable us to plausibly assume a mutual relationship, we needed to calculate their statistical significance. The statistically significant value was calculated according to Student’s
t-distribution, with degrees of freedom
n − 2. We used:
where
r is the Pearson correlation coefficient.
When searching for the statistically significant value, we selected a significance level of 2%, and the Student’s critical value equaled 3.143. If the coefficient is higher than the critical value, the correlation can be considered statistically significant.
3. Results
This section outlines the results obtained from the nutritional analysis and presents the spectral curves of the reflectivities at the scanned wavelengths, acquired via processing the multispectral images and computing the vegetation indices. These aspects were completed with a description of the process of calculating the correlation coefficients associated with the relationships between the laboratory results‘ variation and the data from the multispectral images.
3.1. Nutrition Analysis
In each of the corn samples, on the individual sampling days, we invariably weighed the total mass of 10 plants. Subsequently, the FM (fresh matter) and EW (ear weight) rates were established in each sample; the latter rate, however, began to be determined only with the 5th sampling. The relevant chemical analysis then allowed us to establish the contents of structural, nutritional, and other substances. Out of all the sampled and analyzed values, we computed—invariably for one sampling stage—the average value of the given parameter. The values resulting from the individual sampling instances are summarized in
Table 2.
3.2. Multispectral Image Processing
The spectral reflectivities acquired from the spectral maps capturing the monitored vegetation are minimal—in all the scanning phases—in the visible part of the spectrum as compared to the reflectivity changes in the near-infrared band (see
Table 3).
Figure 6 displays the spectral curves of the reflectivities to define the condition of the plants with respect to that of the overall vegetation. The green spectrum, with a wavelength of 560 nm, forms the local reflectivity maximum in the visible sector of the spectrum; the higher reflectivity, compared to those of the blue (475 nm) and red (668 nm) bands, stems from a strong correlation with the chlorophyll contained in the plants. The intensive absorption exhibited by the chlorophyll in the photosynthesis within the blue and the red spectra causes low reflectivity; in these spectra, the chlorophyll absorbs approximately 90% of the incident radiation.
In the near-infrared band, the vegetation shows 840 nm, with 717 nm being the value for the red-edge portion; the reflectivity is thus markedly higher than in the visible spectrum. The discussed band allows us to clearly discern the growth variation between the individual scanning stages. With the progressing phenophase, the reflectivity in the near-infrared band exhibits a tendency to rise; however, a decrease begins after the maximum period has been reached and the plants have started to age.
To select suitable indicators for defining the vegetation changes in a time sequence, we first need to distinguish the differences in the reflectivities at the separate wavelengths and in the computed indices. The calculated average values of the indices from the investigated portions of land as related to the eight time intervals within the crop growth period are outlined in
Table 4.
3.3. Correlation Analysis
All the measured spectral band reflectivity averages (blue, green, red, red edge, and near-infrared) and the calculated values of the vegetation indices (the NDVI, NDRE, and GNDVI) were correlated with the average nutritional values established at the individual sampling stages via laboratory analyses performed on the sampled plants (see
Table 5). The linear correlation rates from
Table 5 are presented in
Table 6.
In the individual correlation coefficients, we calculated the statistical significance values, and these were subsequently compared with the critical value of 3.143. The statistically significant values are highlighted in
Table 7.
3.4. Classifying the Vegetation Relationships
The charts below visualize the linear relationships between the selected nutritional values and the monitored reflectivities or calculated vegetation indices (see
Figure 7).
Of the established nutritional values, we selected the dry matter, nitrogen substances, and starch, due to their high statistical significance with respect to all of the imaging values, and also because they embody the most vital organic nutrients that determine the eventual quality of the corn at harvest. Using these organic nutrient values, which exhibit the most significant correlation indices, we compared the vegetation indices and major spectral bands, namely, red, green, and blue.
4. Discussion
Analyzing multispectral images based on an exact knowledge of vegetation health is one of the procedures that support the transition from traditional agricultural methods to precision agriculture. An increase in the quality of harvested corn and a reduced fodder consumption following on from the ability to closely determine the optimum harvest time will generate novel approaches to the contactless analysis of plants at various growth stages, together with a major potential for automated and rapidly expandable applicability in most types of vegetation. In the case of corn, the optimum harvest time is established according to the content of dry matter, depending on whether the chopped crop is intended to be silaged or to produce methane in a biogas station. For an identification of the correct period, it is therefore necessary to know exactly the nutritional values of the crop on the entire land concerned.
Within the research, we achieved the preset goals, namely, defining the relationships between the nutritional parameters acquired through chemical analyses and the vegetation indices yielded via multispectral imaging of the entire area of the cornfield.
The subsections below characterize the results of the nutritional analysis and the outcomes of the multispectral image processing, including the computation of the vegetation indices. The core subsection presents the mutual correlation analysis of the relationships between the patterns of changes in the laboratory results and the data obtained from the UAV-based multispectral images. In this context, possible correlation uncertainties are also considered.
4.1. Nutritional Analysis
The evaluated nutritional indicators (
Table 2) show that, in corn, the progressing phenophase is associated with an increasing content of dry matter (DM). Furthermore, the rising proportion of the grain is accompanied by a growing share of starch in the entire plant; the starch then embodies the central source of energy for the plant to be harvested. In the other parts of the organism, a decrease occurs in the nitrogen substances, and the digestibility of the fiber is markedly reduced due to lignification. Interestingly in this context, no correlation has been found to date between the fiber content and digestibility. The ideal harvest time was identified with the interval separating the 4th and 5th sampling stages. This optimum period was determined through the dry matter values, which, in the discussed phases, amount to 280–330 g/kg. More concretely, in all of the laboratory samples, the values at the 4th stage ranged from 277.9 g/kg to 349.8 g/kg, while at the 5th stage they already ranged between 291.8 g/kg and 347.4 g/kg. Another factor of importance rests in the average volumes of starch; at the 4th stage, the relevant value reached 273 g/kg/DM, and in the 5th phase it already equaled 319.8 g/kg/DM, with the ideal level of 300 g/kg/DM corresponding to ⅔ of the milk line stage. The intensive increase in the dry matter between the third and the fourth phases was induced by considerable precipitation; however, the fall of the precipitation rate down to zero then caused a sharp change in the nutritional values.
4.2. Multispectral Image Processing
The reflectivity relationships in the various portions of the spectrum confirm the expected scenario and represent the changing condition of the monitored crops over time (
Figure 6). From the perspective of the reflectivity level, the spectral curves can be divided between two regions, namely, the visible part of the spectrum and the near-infrared sector. We can then observe a very low reflectivity in the visible portion of the spectrum (up to 670 nm), the relevant value being not more than 14% (the green band); thus, the radiation is mostly absorbed. The reason for this rests in the large quantity of biomass in the observed area, suggesting that the radiation is consumed through photosynthesis. The other set of monitored wavelengths gradually passes into the near-infrared region. This progressive transition is accompanied by more prominent differences (the red edge band) between the sampling stages, with the increasing reflectivity being the highest—at 39%—in the red edge band in the 6th observed phase. After the maximum, the reflectivity values decline slightly. The most conspicuous differences characterize the NIR band (840 nm), where the greatest reflectivity divergence in the monitored growth stage reaches up to 45%. Similarly to the red edge region, the NIR band attains the maximum value in the 6th phase, which, too, is followed by a decline in the values. All of the monitored spectra are important for the subsequent computation of the vegetation indices.
Considering the calculated vegetation indices in
Table 4, the tendency towards a steady minor decrease allows us to assume, without prior knowledge of the nutritional values, a later phenological phase in the plants. Through the monitored period, the vegetation index NDVI ranged between 0.72 and 0.97, the average value being 0.85. This index exhibited higher values than its counterparts. In the NDRE, the range was 0.36–0.65, with an average of 0.52, and the GNDVI showed a scope of 0.64–0.84 and an average of 0.77. The GNDVI thus possesses the smallest resolving ability. By contrast, the best sensitivity is obtained from the NDRE, where differences in a broad band of reflectivities are discernible.
The values of the NDRE enable us to observe a reflectivity shift towards lower levels, compared to the other two indices; such a scenario arises from calculating the proportion between the reflectivities with the red edge spectral component, which exhibits higher reflectivity variations.
4.3. Correlation Analysis
Within the research, we established that, as regards determining the changes through the eight investigated growth phases in the selected corn hybrid, the best correlation is found between the dry matter values and the NDRE index,
Table 5. To evaluate the statistical significance of the correlation coefficients, we employed Student’s
t-test, applying the significance level of 2%; this is matched by the Student’s T critical value of 3.143,
Table 7.
This subsection discusses the statistically significant values of the correlation coefficients. A strong correlation can be established in the GNDVI (−0.901) and NDVI (−0.920). Furthermore, statistically significant values lie also in the correlations between the CP and the NDVI (0.922), the NDRE (0.854), and the GNDVI (0.746). The previously mentioned starch content, which also exerts a major impact on the resulting quality of the harvested corn, markedly correlates with the indices NDVI (−0.884) and NDRE (−0.867). The values of the indices NDVI, NDRE, and GNDVI also correlate very well with the calculated OM values. We can then infer from these facts that the strong correlations in the indices NDVI and NDRE are usable not only for determining the convenient harvest time but also for predicting the quantity of the organic matter (OM) obtainable from the yielded crop (correlation with the NDVI at −0.924); these steps are then prominent in establishing the organic matter yield.
The evaluated correlations in the individual narrow spectral bands lead to the assumption of a strong correlation in the red band, which correlates markedly with all the determined nutritional values, the strongest correlation being that with the CP (−0.953). By contrast, the weakest values of the correlation coefficient R are found in the NIR spectral band.
4.4. Classification of the Vegetation Relationships
The diagrams capturing the vegetation relationships (see
Figure 7) allow us to derive formulas that facilitate predicting the most optimum harvest values by utilizing the dry matter-, crude protein-, and starch-related data. In this context, the details outlined in the previous subsection indicate that the greatest importance for the prediction rests particularly with the indices NDRE, as related to the DM, and the NDVI, as related to starch. The obtained NDRE linear relationship (
y = −0.007
x + 1.0836) proposes that the ideal index values for the DM range within the NDVI value interval of 0.888–0.853. As regards the NDVI relationship (
y = −0.0045
x + 0.9594), the ideal value amounts to 300 g/kg DM and 0.824 (NDVI starch).
4.5. Comparing the Results with Previous Research Data
As this article contains unique, novel results, we can only refer to research papers that associate with our experiment in a merely marginal manner. However, let us note that a similar investigation was described in source [
40], whose authors demonstrated that the relative data of the NDVI, PH, and a combination of both are usable when predicting the DM yield of fodder corn grown for silage. By comparison, we can point out that our study includes more types of chemical analyses; moreover, we established that the NDRE index best correlates with dry matter variations and is, besides the NDVI, therefore suitable for determining the ideal harvest time in the selected corn hybrid.
Another project that marginally resembles ours is characterized in source [
24], with a focus on exploiting superspectral airborne imagery to predict corn grain yield and ear weight, and to discriminate between growth stages and irrigation treatments. Although the authors of [
24] utilize multispectral imaging to determine the phenophase in plants, they concentrate solely on the NDVI index and do not state any correlations with chemical analyses, as is the case with our study.
4.6. Limitations and Future Work
The use of the methods characterized herein is accompanied by uncertainties including, for example, adverse weather conditions that may impair or destroy the entire concept of the fieldwork. For the purposes of future research, some of these uncertainties can be minimized via diversifying the land to support the experiments.
The vegetation indices are unstable due to short-term changes in the weather and in the solar radiation intensity. To minimize the error in the results of the multispectral imaging, we needed to carry out relevant calibration (
Figure 3c). This task was executed for the individual crops, at various vegetation periods and in diverse weather conditions, but at identical times of the day. In plant imaging, this calibration will eliminate the inaccuracies that arise from the single-use sampling.
Another drawback to our method probably consists in that we employ data for a given hybrid, site, and year. However, as we do not follow absolute values but instead changes in the chemical composition and vegetation indices, it is possible to assume that the results will be applicable more widely to diverse corn hybrids.
The repeatability and stability of the results are certainly limited by the initial choice of a sown hybrid. The established linear relationships between the nutritional values and vegetation indices, and possibly also the reflectivities of the individual spectral bands, relate to hybrids that exhibit common plant phenophases. Different values may be revealed in stay-green hybrids, characterized by prolonged vitality and lower dry matter volumes; these hybrids, however, must be distinguished separately, via the criteria of nutritional values and reflectivity in the different wavelength spectra.
An alternative to UAV-based remote sensing rests in satellite imaging; this procedure may embody a more easily available and less costly option where the reflectivities have to be computed over a very large or highly particularized land area.
The planned expansion of corn growth monitoring research involves, among other steps, assigning images to already completed measurement cycles and improving the precision of the correlation curves. Importantly, we intend to compare the individual crops at the various vegetation stages, realizing that nutrition differences constitute merely one of the sources of variations in spectral behavior; other relevant factors include, for example, marked discrepancies between hybrids of the same crop.
5. Conclusions
To characterize the main outcomes of the research in general terms, we can claim that the preset aims and objectives were met. We revealed
new mathematical relationships between the nutritional parameters acquired through chemical analyses and the vegetation indices (such as the NDRE and NDVI) established via multispectral imaging. The defined relationships then allowed us to compute the relevant nutritional values from the multispectral images of the entire monitored cornfield, without the need to perform a chemical analysis (see
Figure 7). The nutritional value data corresponded to the average value of the field and may significantly help the farmers in estimating the optimum harvest time.
Considering the applied methodology and procedural options, the optimum harvest time can be predicted solely via remote sensing with a multispectral camera and by utilizing the formulas set out in
Figure 7, which enable us to compute the optimum values of the multispectral index (the
y variable in the formula) by applying the known concrete values of the monitored substances (the
x variable in the formula). Remarkably, the NDRE and NDVI indices facilitate, based on their high statistical significance (
Table 7), predicting the contents of not only the dry matter, namely, the most significant value in this context, but also the starch and crude protein.
Such innovative evaluation of the discussed factors will effectively reduce the cost of additional chemical analyses, and both farmers and researchers will be able to estimate the required quantity over the entire area of the field(s). Thus, compared to a chemical analysis of a limited number of samples, it is possible to estimate more precisely in heterogeneous vegetation the optimum harvest time with respect to the nutritional values. The authors of this paper consider determining the optimum harvest time important as regards the quantity of dry matter to generate methane and the actual production chain between the fodder and the milk.
The multispectral imaging method nevertheless features certain limitations, as described in
Section 4.6. The relationships indicated in
Figure 7 then can (and will) be made more precise via further experimentation.


 ,
, 


