Article

High Quality Zenith Tropospheric Delay Estimation Using a Low-Cost Dual-Frequency Receiver and Relative Antenna Calibration

by
Andreas Krietemeyer
*,
Hans van der Marel
,
Nick van de Giesen
and
Marie-Claire ten Veldhuis
Faculty of Civil Engineering, Delft University of Technology, 2628CN Delft, The Netherlands
*
Author to whom correspondence should be addressed.
Remote Sens. 2020, 12(9), 1393; https://doi.org/10.3390/rs12091393
Submission received: 4 April 2020 / Revised: 24 April 2020 / Accepted: 25 April 2020 / Published: 28 April 2020
(This article belongs to the Special Issue Remote Sensing of Precipitation: Part II)

Abstract

:
The recent release of consumer-grade dual-frequency receivers sparked scientific interest into use of these cost-efficient devices for high precision positioning and tropospheric delay estimations. Previous analyses with low-cost single-frequency receivers showed promising results for the estimation of Zenith Tropospheric Delays (ZTDs). However, their application is limited by the need to account for the ionospheric delay. In this paper we investigate the potential of a low-cost dual-frequency receiver (U-blox ZED-F9P) in combination with a range of different quality antennas. We show that the receiver itself is very well capable of achieving high-quality ZTD estimations. The limiting factor is the quality of the receiving antenna. To improve the applicability of mass-market antennas, a relative antenna calibration is performed, and new absolute Antenna Exchange Format (ANTEX) entries are created using a geodetic antenna as base. The performance of ZTD estimation with the tested antennas is evaluated, with and without antenna Phase Center Variation (PCV) corrections, using Precise Point Positioning (PPP). Without applying PCVs for the low-cost antennas, the Root Mean Square Errors (RMSE) of the estimated ZTDs are between 15 mm and 24 mm. Using the newly generated PCVs, the RMSE is reduced significantly to about 4 mm, a level that is excellent for meteorological applications. The standard U-blox ANN-MB-00 patch antenna, with a circular ground plane, after correcting the phase pattern yields comparable results (0.47 mm bias and 4.02 mm RMSE) to those from geodetic quality antennas, providing an all-round low-cost solution. The relative antenna calibration method presented in this paper opens the way for wide-spread application of low-cost receiver and antennas.

Graphical Abstract

1. Introduction

The use of Global Navigation Satellite Systems (GNSS) data is well established for a range of professional and scientific applications, including atmospheric research. Precipitable Water Vapor (PWV) can be derived from radiosonde measurements, but also estimated with GNSS phase measurements processing techniques [1]. Zenith Tropospheric Delays (ZTDs) are estimated along with other parameters, such as the station position and receiver clock offset. The estimated ZTD is related to the refractive index of air, it can be used directly in atmospheric models, or ZTD can be used to estimate PWV. These values are of essential interest for accurate short-term weather forecasts.
The use of cost-efficient GNSS equipment is of great scientific interest to meteorology and atmospheric research. Traditionally, atmospheric research and meteorology made use of already existing GNSS infrastructures which were set-up for surveying and geodetic applications. Therefore, low-cost GNSS equipment can be a good solution for regions where (commercial) high grade equipment is not readily available.
Analysing ZTDs or PWV from GNSS receivers has proven to be a valuable tool for analysing and forecasting extreme rainfall events [2]. Nowadays Numerical Weather Prediction (NWP) models exist that use these parameters in their data assimilation schemes to improve their rainfall predictions [3]. To estimate ZTD at existing GNSS receivers on the ground, numerous Analysis Centers (ACs) apply techniques such as Double-Differenced (DD) processing of large GNSS networks, or, the stand-alone Precise Point Positioning (PPP) technique [4]. In contrast to network or relative positioning strategies in general, PPP uses undifferenced GNSS observations and relies on precise satellite clock and positions to be available from the International GNSS Service (IGS). Dual-frequency observations are used to form the ionosphere-free linear combination, which removes the majority of the error associated with the delay in the ionosphere layer, but increases the noise by a factor of 3 [5]. In the past, estimating ZTD for meteorological purposes using cost-efficient equipment was only possible with single-frequency receivers, which required interpolation of the ionospheric delay from a network of dual-frequency receivers (e.g., References [6,7]). Recently, also low-cost dual-frequency receivers became available, which in combination with low-priced antennas, inspired the experiment in this paper. This experiment aims to investigate the potential use of low-cost dual-frequency receivers for ZTD estimation, something that was formerly only possible using expensive receiver equipment, or relied on existing geodetic networks to perform corrections. For this experiment different quality antennas, ranging from geodetic to mass-market, are deployed consecutively on a short-baseline. The new low-cost design of the receiver supplemented by a low-cost antenna may enable the cost-efficient estimation of high-quality tropospheric delays.
For high-precision applications, both satellite and receiver antenna corrections need to be applied [8]. These corrections are not only frequency dependent, but they also depend on the azimuth and elevation of the transmitting satellite. The delay caused by the antenna and the near field environment is not the same in every direction. Neither is it possible to find, for a specific frequency, a single point in the antenna for which the delay is the same for every direction. Therefore, a geometric center is something that does not really exists, and concepts like Antenna Phase Center (APC) are only approximate. These variations in antenna delay cause errors in the horizontal and vertical position, but also in the ZTD estimation. In order to correct the carrier phase signals for this effect, antenna calibrations are performed. The result of an antenna calibration is represented by a Phase Center Offset (PCO) with respect to a chosen Antenna Reference Point (ARP), and azimuth- and elevation dependent Phase Center Variations (PCV) with respect to the PCO. PCV and PCO corrections are provided per frequency. They are not independent, and should always be used together in high-precision positioning applications. Applications that require less precision can use only PCO values. On the other hand, for ZTD estimation, the PCO values are not important, and only the PCV values matter.
To obtain PCO and PCV corrections, relative and absolute antenna calibrations can be used. Absolute calibrations are typically expensive and involve sending the antenna to a calibration facility, while a relative calibration can be performed more easily by yourself. The relative calibration is performed over a short baseline, with on one side the antenna to be calibrated, and on the other side a reference antenna that has already been calibrated before (see e.g., Reference [9]). Double-differenced carrier phase residuals are used to compute the relative pattern between the antenna’s. It uses the fact that over short baselines for DD observations most errors (e.g., satellite clock and atmospheric delays) are eliminated. The drawback of this calibration method is that it is a relative calibration. Since 2006 [10] it has been common for geodetic applications to use absolute antenna calibrations. Therefore, to obtain an absolute calibration for our antenna, we must add the absolute calibration for the reference antenna to the relative calibration. Absolute calibrations are typically obtained from measurements in an anechoic chamber (see e.g., Reference [11] or Reference [12]) or robotic field calibrations (see Reference [13]). Robotic calibrations have the advantage that they are not affected by multipath effects as in a relative correction.
While high quality geodetic antennas are typically manufactured with highest precision to enable the repetition of phase patterns on the receiving phase center, this is only partially the case for low-cost antennas. Companies specialized in antenna calibrations, such as Geo++ [14] in Germany, generate individual absolute antenna calibrations for geodetic antennas. Absolute antenna calibrations are typically supplied in an Antenna Exchange Format (ANTEX) file [15] that contains PCO as well as azimuth- and elevation dependent PCV for different frequencies and satellite systems. Various individual calibrations of the same antenna type are averaged to type mean calibrations and distributed, such as by the IGS. Using these antenna patterns is a standard practice in geodesy and essential for high precision positioning and also for tropospheric delay estimations. Several studies were performed that compare the differences between type mean and individual antenna phase center calibrations for example, by Araszkiewicz and Völksen (2016) [16], Schmid et al. 2005 [17] and Sidorov and Teferle 2016 [18]. They found a typical difference of only 2 mm horizontal and up to 4 mm vertical between type mean and individual antenna calibrations. For one antenna an offset of up to 17 mm in the vertical and 10 mm in the horizontal direction was observed. The vertical positioning performance gives an indication about the accuracy of the troposphere estimations since both parameters are correlated [19]. Only few studies were performed that analyze the impact of the antenna PCV on tropospheric parameter estimations. Ejigu et al. 2018 [20] investigated the impact of individual and type mean calibrations on Zenith Wet Delays (ZWDs) and tropospheric gradients [21]. They report a mean ZWD bias of 1.8 mm. A study by Pacione et al. 2017 [22] demonstrate similar results with ZTD errors in the mm range between utilizing individual and type mean calibrations.
The low-cost GNSS chips, being affordable and produced for the mass-market, are also of interest for scientific applications, but this only makes sense if also a low-cost antenna can be used. Geodetic antennas are generally characterized by special manufactured designs (e.g., choke ring) to suppress multipath induced effects. With low-cost antennas this is typically not the case. An analysis of low-cost antennas is especially important since they are expected to be particularly prone to multipath effects that are reflected in the antenna phase patterns.
In this paper we investigate the PPP ZTD performance of a recently introduced low-cost dual-frequency receiver connected to antennas of ranging quality (geodetic to mass-market) with and without applying relative antenna calibrations. Additionally, using L1-only data we investigate how well the (un-)corrected single-frequency data from the dual-frequency receiver can be used for meteorological applications. This is achieved by trimming the original data to L1-only datasets and generating a second frequency observation with the Satellite-specific Epoch-differenced Ionospheric Delay (SEID) model which is adjusted to the ionospheric delay based on a surrounding dual-frequency network. The paper is structured as follows—Section 2 describes the methodology, experimental setup and data analysis, Section 3 illustrates the PPP-derived ZTD results, Section 4 the discussion and Section 5 the conclusion.

2. Methods

Our experiment includes several steps to estimate the impact of different quality antennas on the ZTD performance using a low-cost dual-frequency receiver. The fundamental step upon which our investigation is based is a short-baseline analysis to perform a relative antenna calibration. Thereafter, different relative antenna calibration results are evaluated using the ZTD from two different PPP experiments. The experimental setup and overview of the data analysis procedure are described in Section 2.1 and Section 2.2. The antenna calibration procedure is explained in Section 2.3. Section 2.4 describes the evaluation of the ZTD estimations with dual-frequency data in more detail. The antenna calibration impact on single-frequency data is covered in Section 2.5.

2.1. Experimental Setup

This subsection describes the test site, instrument setup, data handling as well as the receivers and antennas that were used in the experiment.
Our experiment consists of a series of consecutive short-baseline experiments using the International GNSS Service (IGS) station DLF1 as a base station and a U-blox ZED-F9P as rover. The DLF1 station is located on the rooftop of the Nederlands Metrology institute (NMi) in Delft. The station uses a Trimble NetR9 receiver, capable of tracking most GNSS signals, with a Leica AR25.R3 (LEIAR25.R3) chokering antenna with LEIT radome. The antenna has been calibrated by Geo++. The antenna is installed on the permanent marker with DOMES number 13502M009.
The rover receiver is an engineering sample of recently released low-cost dual-frequency receivers, that was obtained from the manufacturer for testing purposes. It covers the following frequencies: GPS L1C/A, L2C, GLONASS L1OF, L2OF, Galileo E1, E5b and BeiDou B1l, B2l and QZSS L1C/A, L2C. Notably missing GNSS signals are GPS L2P/Y, GPS L5 and Galileo E6. However, with the new generation GPS satellites, the L2C signal becomes rapidly available on almost all satellites and enables obtaining dual-frequency measurements from an increasing number of available GPS satellites. With up to 184 channels available, the receiver is capable of tracking two frequencies on each of the described satellite constellations and is still able to receive correction service data from augmented GNSS (e.g., Reference [23]).
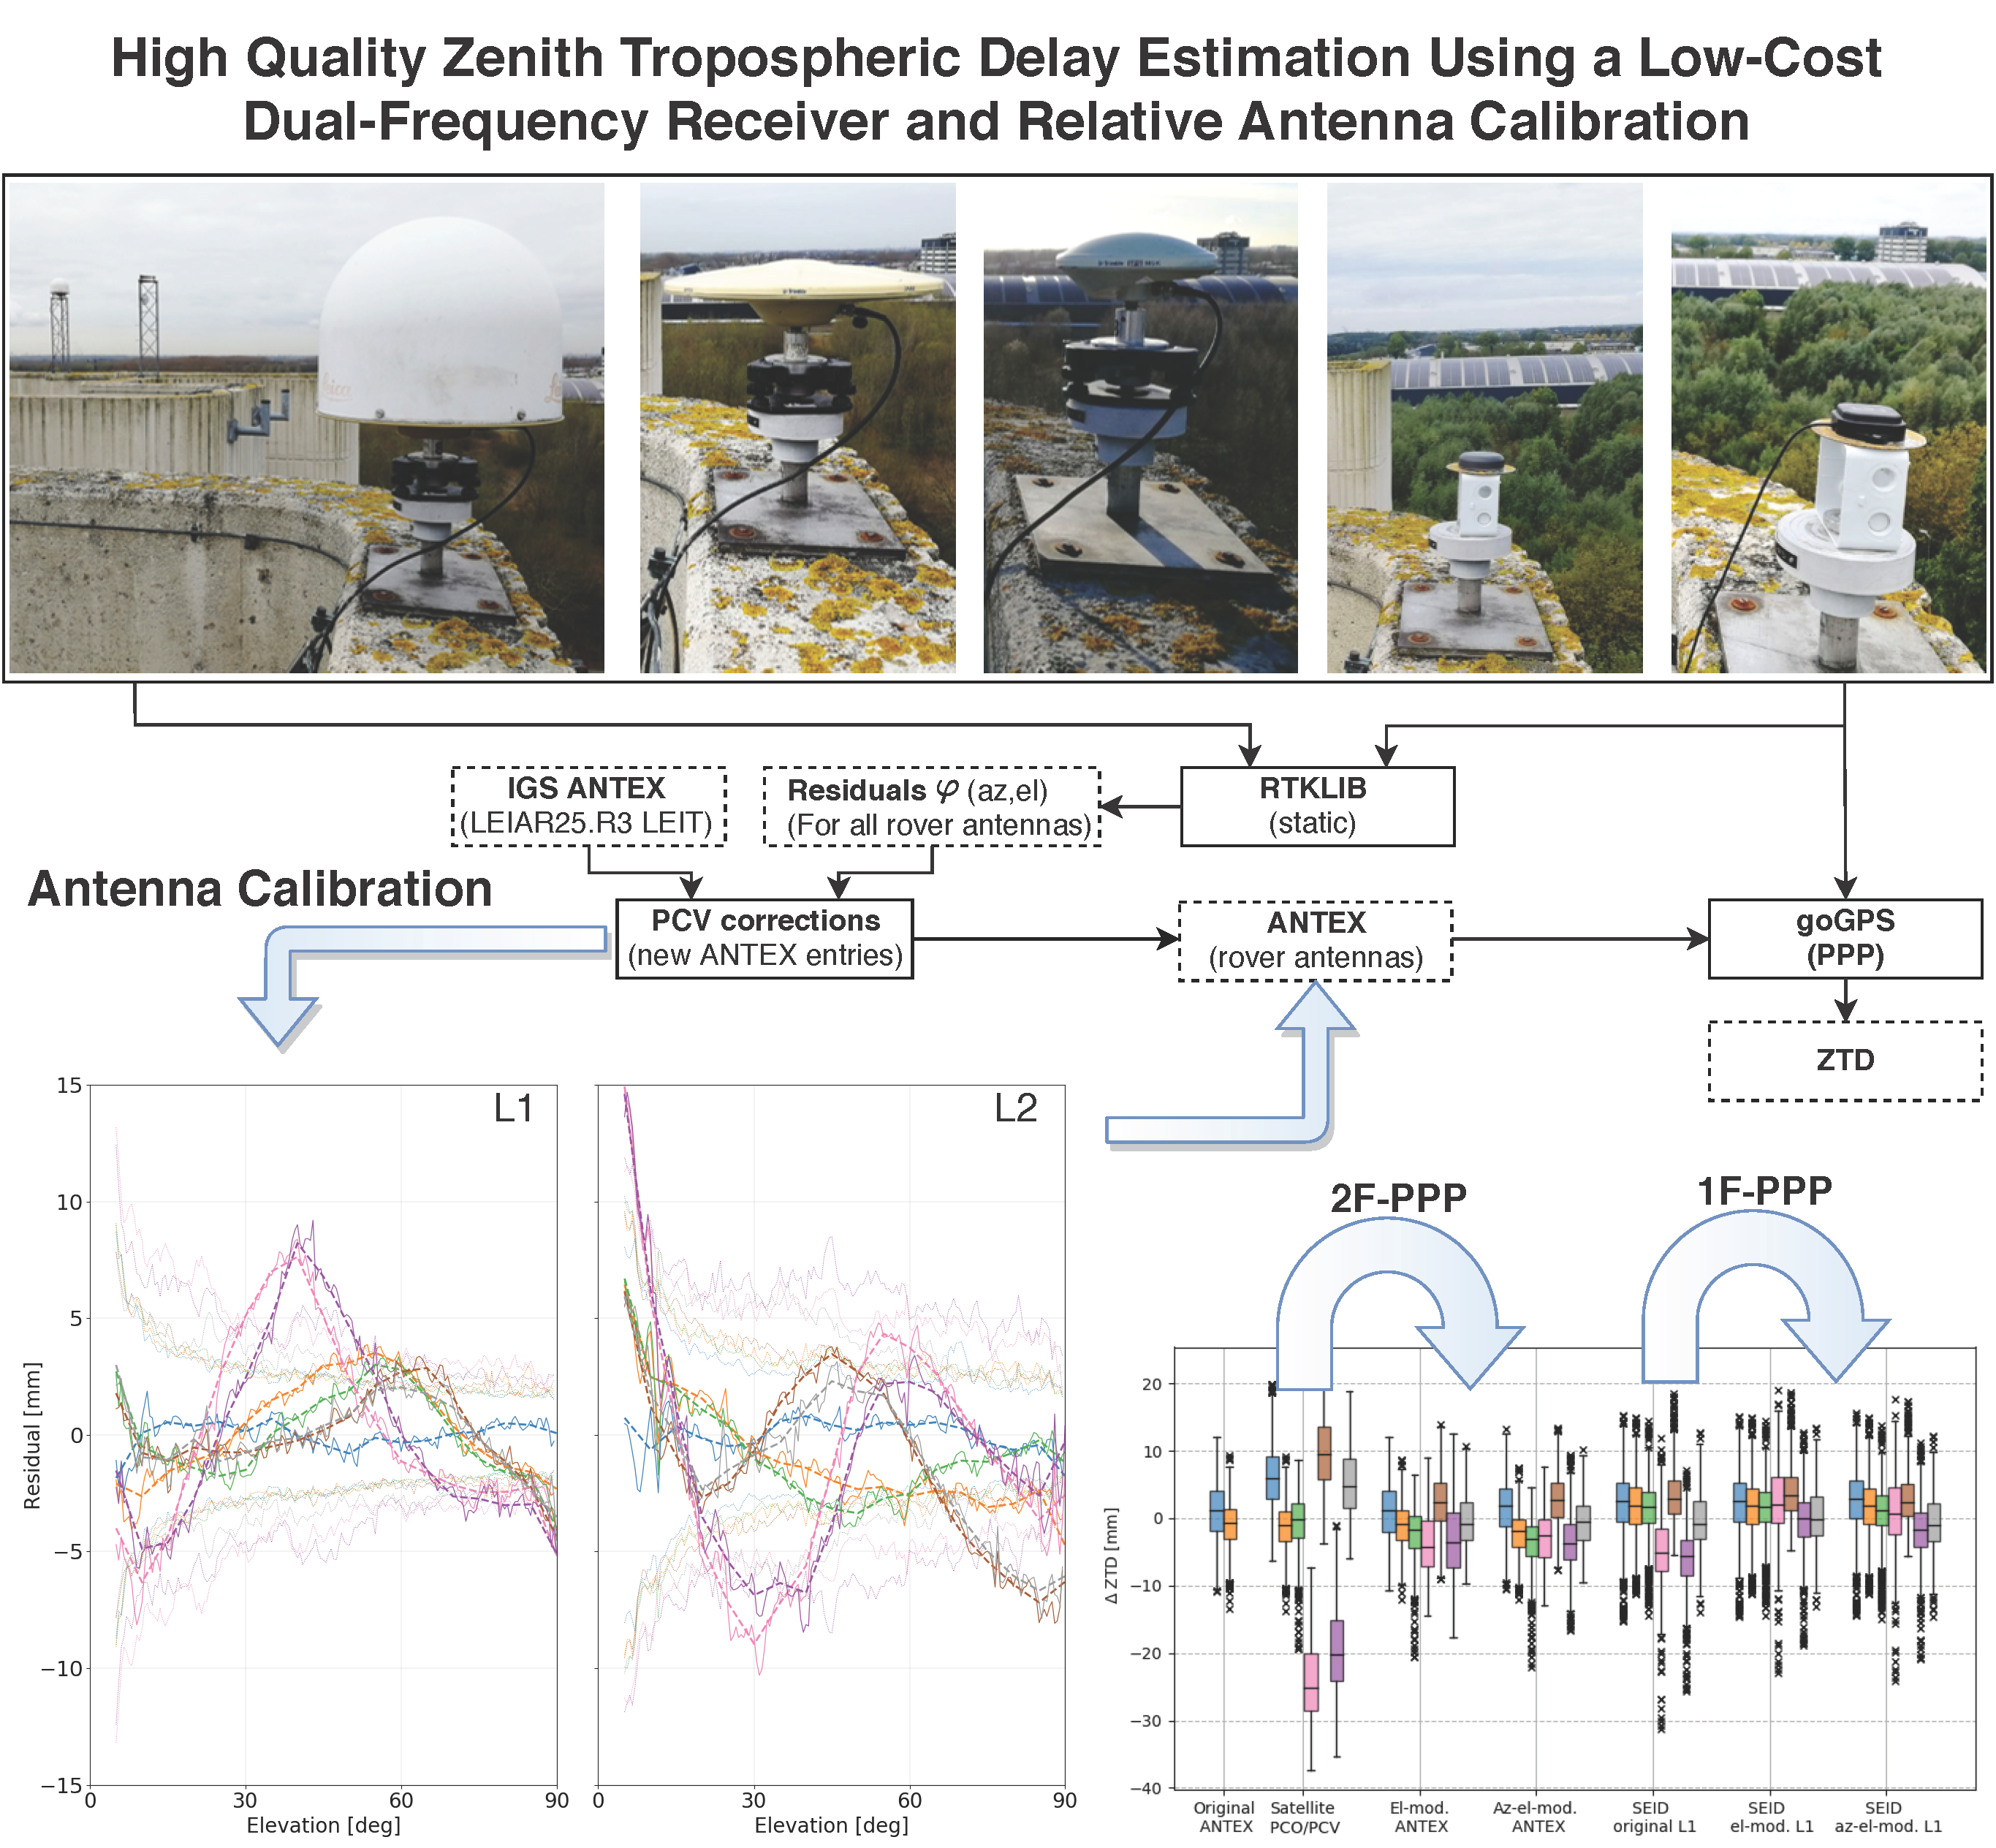
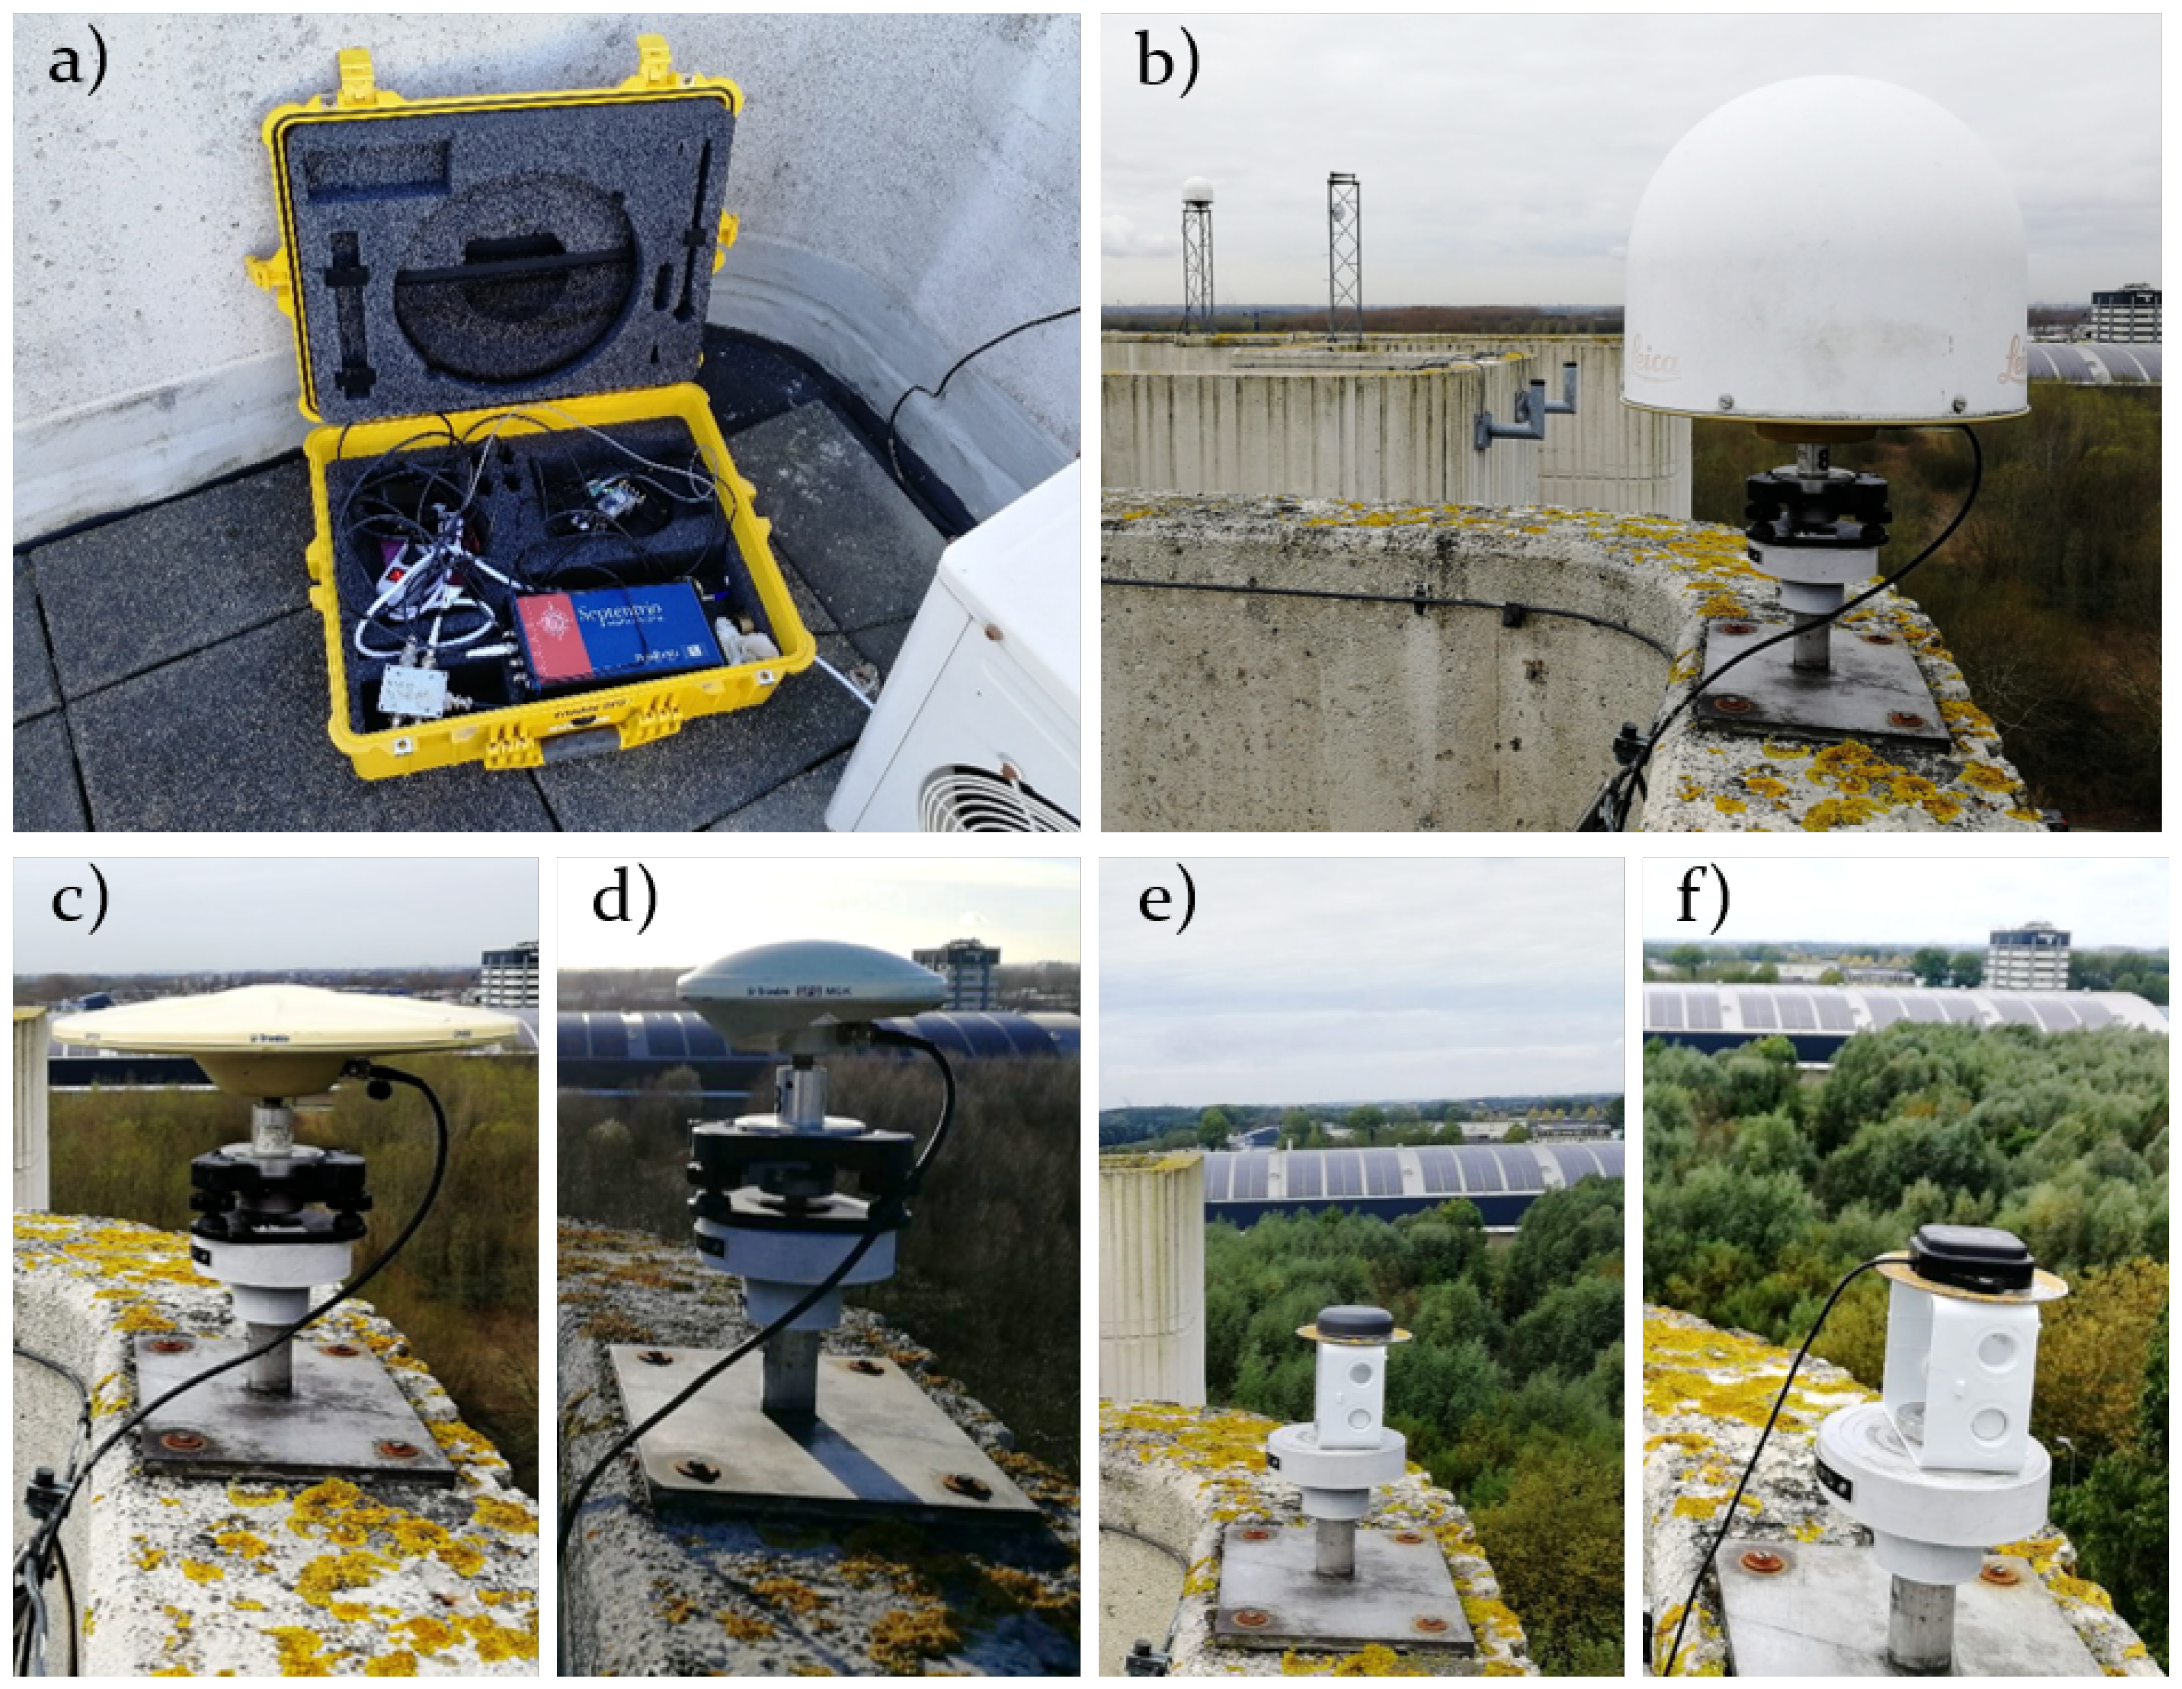
The antennas of the rover are placed on a geodetic marker at a horizontal distance of approximately 10 m and 1.5 m height difference from DLF1. Different antenna types have been installed during consecutive periods from 15 February 2019 onwards. The investigated rover antennas cover a range of prices, starting with the lowest cost antennas U-blox ANN-MB-00 and Taoglas AQHA50 between about 50 and 100 euros, the middle price segment antennas Trimble AV28 and Trimble GA530 and antennas with a price of above 1000 euros, LEIAR25.R3 LEIT and TRM55971.00 NONE (also known as Trimble Zephyr 2 Geodetic). For these antennas, the mount point DOMES 13502M003 (GPS Mark 15) is used (Figure 1b). The antennas with hole-mount design (Trimble AV28) and without screw-hole at the bottom (U-blox ANN-MB-00) are mounted on top of a metallic rectangular extension bracket and also with a circular metallic ground plane with 10 cm diameter. For the other tested antennas, a tribrach with an adjustable circular level is used. The receiver itself is placed in a pelican case in the proximity and data logging is performed with a Raspberry Pi Zero on a local SD card (Figure 1a). Depending on weather conditions and observation time, antennas are switched after at least having recorded three full days of raw data. Data is transferred manually from the SD card for post-processing purposes.
The installation environment (regarding near-field effects and multipath) can be regarded as relatively clean. Both antenna positions (DLF1 and GPS Mark 15) are characterized by an unobstructed view over the full horizon. The time frame of antenna placements is depicted in Table 1. All antennas are active and, depending on the type, require different voltage as input. The antennas GA530, LEIAR25.R3 and TRM55971.00 require 12 V input voltage which cannot be supplied by the Raspberry Pi. Instead, the antennas are powered by a Septentrio receiver and the antenna signal is split to the U-blox ZED-F9P. The other antennas are working with voltage at or below 5 V that is supplied via the USB port of the Raspberry Pi and is considered as stable.
The GA530 lost satellite tracking on L1 on 15 March 2019 17.23 UTC and one day later also L2 data was lost, presumably due to moisture in the antenna connector. Data from 15 March 2019 onwards is therefore discarded from the GA530 observations. The AQHA50 data was not processed due to very low Signal-to-Noise (SNR) ratio, despite free-sky conditions, which we were unable to resolve. After quick and uncomplicated communication with the manufacturer the antenna could be returned and a replacement was provided. It was, however, not examined further in this experiment because of time limitations and practical considerations. A power outage in the Delft region, in the morning of Monday 25 March 2019, ended the data tracking for the LEIAR25.R3 antenna. Except for the AQHA50 antenna, sufficient data have been recorded for the remaining antennas for the analysis. Details about the data logging and conversion can be found in Appendix A.
The data is analysed in post-processing, with DLF1 as base station, and the antennas under investigation as rover. The rover data is available as 1-s daily RINEX 3 observation files. For the base station data, high-rate (1 Hz) RINEX3 data from the IGS station DLF1 were downloaded. High-rate 15-min RINEX 3 DLF1 observations were merged into daily files. Broadcast navigation data from the satellites were collected from the Crustal Dynamics Data Information System (CDDIS) [24]. For simplicity reasons and driven by the fact that most antenna calibrations are available for GPS, we used GPS-only data for our analysis.

2.2. Antenna Calibration and ZTD Evaluation Procedure

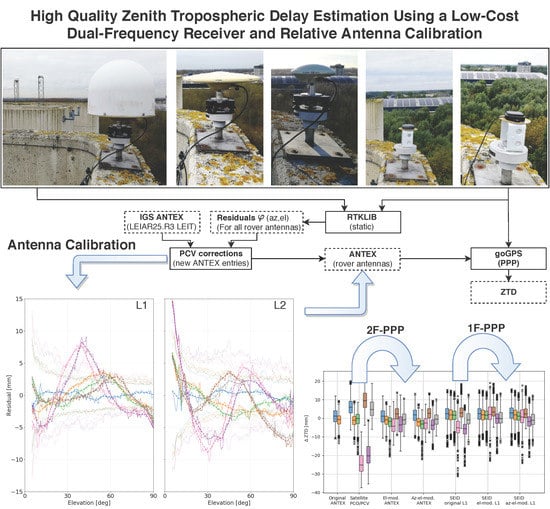
This subsection aims to provide a general overview of the antenna calibration and ZTD evaluation procedure. The experiment basically follows the steps illustrated in Figure 2. First, the antenna calibration is performed by retrieving residuals in a short baseline experiment, for which errors caused by the troposphere and ionosphere delays can be safely neglected. The original L1 + L2 RINEX data of base and rover were processed in RTKLIB, in static mode, to obtain the carrier phase residuals for each frequency, as well as azimuth (az) and elevation (el) angles of the corresponding satellites. The residuals, that can be considered as relative PCVs, together with IGS ANTEX type mean PCVs of the base station antenna (LEIAR25.R3 LEIT), were processed to create absolute PCVs which are saved in new ANTEX entries for each rover antenna. Details on the antenna types used in the experiment are provided in Table 1.
Subsequently, the L1 + L2 RINEX data from the rover antennas, with the new ANTEX entries, were processed in goGPS (PPP-mode) to obtain absolute ZTD estimations. The obtained set of ZTD estimations for the low-cost receiver and different antennas was compared against the IGS final ZTD estimations by the US Naval Observatory (USNO) based on Bernese 5.2 in PPP mode from the IGS station DLF1. Further details on the antenna calibration and ZTD estimation procedures can be found in the following subsections.

2.3. Antenna Calibration and Retrieval of New ANTEX Entries

This subsection details the antenna calibration process. It is a fundamental step in our experiment and consists of an elevation-only and an azimuth and elevation dependent correction.
Near-field, multipath and antenna PCVs, summed up as multipath, affect all estimated parameters and residuals in the processing. Objects that are close to the antenna (near-field) affect the antenna patterns especially in the antenna PCO and azimuth- and elevation dependent PCVs. This effect cannot be covered in existing antenna calibrations without conducting the calibration procedure at the same location where the observation is taking place.
The main part of the antenna calibration consists of obtaining satellite phase residuals and is performed using RTKLIB. For each frequency, in our case GPS L1 and L2, the residuals are ‘stacked’ into elevation and azimuth bins. Two types approaches are used: (1) an elevation-only correction by averaging over all azimuth directions and (2) an azimuth and elevation dependent correction.
The GNSS processing engine RTKLIB [25] is open source and contains a range of Application Programs (APs) to perform real-time and post-processing precise positioning with GNSS data. It employs an Extended Kalman Filter (EKF) to obtain final differential solutions. In our analysis, the baseline processing was performed using the RTKLIB 2.4.3 Command-line User Interface (CLI) RNX2RTKP. Its functions are equivalent to the Graphical User Interface (GUI) program RTKPOST. In its standard configuration the program uses the highest elevation satellite as reference to obtain DDs. The residuals are written to a file for each satellite in view, with a zero value for the reference satellite, actually using a single difference (SD) format to store the DD residuals. For the analysis of the phase center variation we need however SD residuals. To obtain the SD residuals the average of the DD residuals (reference satellite included) must be subtracted from the DD residuals (again reference satellite included). This is the same as using the average DD residuals as reference. In order to use the average DD residuals as a reference, the source code was modified and recompiled. The observed measurement errors now had an expected zero mean of all satellite residuals on each frequency and not only for the highest elevation satellite. In our version the residuals were computed as in previous (legacy) RTKLIB releases. To avoid unintended behavior, the changes were discussed and changed in correspondence with the author of the package on github (see github issue: [26]).
Table 2 shows the processing settings used for the baseline analysis. Important processing options are the positioning solution to static (-p 3), elevation cut-off 5 degrees (-m 5), AR fix-and-hold (-h) and output residuals (-y 2). For Ambiguity Resolution (AR), the LAMBDA algorithm [27] is used within RTKLIB. The basic strategy in RTKLIB is to fix the ambiguities to integer after a float solution has been obtained. In our analysis we decided to use the fix-and-hold method. Further details on a conducted sensitivity case study can be found in Appendix B. The static processing option will strictly constrain the receiver movements for the observation period. It is preferred over a kinematic solution for the residual analysis since the rover antenna position does not change and the measurement errors should reflect this in the residuals and not in the estimated position. Driven by uncertainty about the implementation of applying ANTEX PCV corrections in RTKLIB, the antenna calibrations were not applied directly in the processing. Instead, their influence was analyzed separately. Each observation file of each antenna was processed and the generated output consisted of East, North and Up (ENU) components as well as frequency and azimuth and elevation dependent satellite residuals on code and phase measurements. For the relative antenna calibration, only the phase residuals were utilized.
To reduce noise and avoid outliers in the data, the residuals of each antenna are stacked over generally three selected DOYs (LEIAR25.R3: 79, 81, 83; TRM55971.00: 87, 88, 90; GA530: 65, 66, 70; AV28 with rectangular bracket: 47, 48, 49; AV28 with circular plane: 285, 286, 287; ANN-MB with rectangular bracket: 58, 61, 62) which were selected after a visible inspection. Only the ANN-MB-00 circular plane data is stacked over two days (DOYs 289 and 290) driven by the short observation period and evident outliers in the observed residuals.
In the first approach, the elevation-only phase patterns are visualised based on a first stacking, by taking the mean from all observations within 0.5 degree elevation bins. Afterwards, to correspond to the ANTEX standard, the stacked elevation-only phase residuals were averaged to 5 degree elevation bins using a moving-average filter. The resulting smoothed curve is shifted and start and end point (5 and 85 degrees) are substituted with the fitted data from a 10th order polynomial that was fitted over the 0.5 degree data. The resulting smoothed residual curve is the relative antenna calibration PCV (see also Section 3.1).
For the second approach, the azimuth and elevation dependent calibration, the number of residuals in each bin is not very large, and there will be many bins that are empty. To obtain meaningful azimuthal PCVs one should typically use longer observation time spans and rotate the antenna during the experiment in order to sample all azimuth directions. Since our experiment did not include rotating the antenna, and the observation period is only a few days, we do not expect very reliable azimuth corrections. To obtain azimuth dependent antenna patterns, the observed residuals were averaged over 5 degree elevation and azimuth bins and stacked over selected days. Since these measurements are generally noisy, the binned residuals are looped through the elevation bins and smoothed by fitting a 10th order polynomial to the data. To avoid evident outliers by fitting a polynomial to the data, gaps and missing data (especially in the North direction, see also Section 3.1) are filled by the nearest value from the current elevation bin. The 5 degree binned data used for the PCV calibration are taken from the resulting fitted polynomial curves.
For both approaches, to obtain absolute PCVs for each tested antenna, the estimated relative PCVs (averaged residuals) must be added to the absolute PCV of the base station antenna. For the absolute PCV of the base station antenna (LEIAR25.R3 LEIT) we used the IGS type mean azimuth and elevation dependent PCVs. Equation (1) shows how the rover antenna PCV is created:
φ i r ( a z , e l ) = φ i b ( a z , e l ) + φ ˜ i b r ( a z , e l ) .
The superscripts b and r denote the base and rover, the subscript i the frequency, a z and e l the azimuth and elevation angles. By adding the estimated relative PCV of the rover ( φ ˜ b r ) to the absolute base antenna PCV ( φ b ), we obtained the absolute PCVs ( φ r ) for the tested antenna. To use the newly generated PCVs in PPP tests, a new entry for each antenna was added to, or replaced in, the ANTEX file. Though individual calibrations are available for our base station antenna, we use the IGS I14.ATX ANTEX file that contains type mean calibrations for the base antenna PCV. A recent study by Araszkiewicz et al., 2019 [28] investigated the height variation on the LEIAR25.R3 antenna with type mean and individual calibrations. They conclude that both methods show similar results.
For each approach (elevation-only and azimuth-elevation), a new ANTEX file is created with one new entry for each antenna that can be used for ZTD estimation using PPP. In this way, the antenna names given in the RINEX files do not have to be modified by instead supplying a respectively differently generated ANTEX file.

2.4. Evaluation of ZTD Estimates from Dual-Frequency PPP

This subsection describes the PPP processing configuration and ZTD evaluation procedure with dual-frequency GNSS measurements.
To estimate absolute ZTD values and to evaluate the newly obtained antenna PCVs, the open source tool goGPS [29] was used. Its ZTD estimations are comparable to existing reference datasets [6,7]. The ZTD results are computed for all available DOYs and compared to IGS final ZTD estimations from the IGS station DLF1 [24] in approximately 10 m distance. The closest available data point from the high rate ZTD estimations was used to match the IGS reference (5-min) interval.
We used goGPS PPP with the same configuration for all runs but with different ANTEX file configurations for the different antennas. The goGPS configuration used for our comparisons can be found in Table 3. The concept of the ZTD evaluation is summarized in Figure 3.
For all goGPS ZTD estimations, data from GPS-only satellites were used. An elevation cutoff angle of 10 degrees and ocean loading effects obtained from the FES2004 model [30] were applied. The IGS antenna calibration, final orbits, 30-s satellite clocks and earth rotation products were used [31].
The ZTD analysis consisted of up to five different cases. Two of our tested rover antennas, the LEIAR25.R3 LEIT and TRM55971.00 NONE, had already calibration entries in the IGS ANTEX file. This provided another set of PCVs for testing with PPP and serves as a verification of our estimations. The first case consists of the verification antennas (LEIAR25.R3 LEIT and TRM55971.00 NONE antennas). For this, a goGPS PPP run is performed using the original IGS I14.ATX ANTEX file. To investigate the impact of not using an ANTEX file at all, another run without the ANTEX file was performed in a second run. The third case applies only satellite PCO/PCV corrections by removing the receiver antenna-specific entries. The last two cases evaluate the elevation-only and azimuth-elevation corrected ANTEX entries obtained from the calibration step. One has to note that the full observation period (up to ten days observed data) is used as RINEX input for the ZTD estimation, while only two or three days are utilized to compute the PCVs.
If one runs PPP software, for example, goGPS, over which one has full control, one can use the newly generated ANTEX entries directly in the software. However, when PPP is performed in a server environment, one does not have the possibility to modify the ANTEX files. In these cases it is more convenient to correct the original RINEX phase data for the antenna patterns. To achieve this, we corrected the original RINEX phase data for the PCV estimations retrieved from the calibration step by the following formula:
L ˜ i = L i φ i r ( e l , a z ) λ i ,
where L ˜ i is the corrected phase data on frequency i and L i the original RINEX phase observation. φ i r ( e l , a z ) is the azimuth and elevation dependent antenna phase pattern on frequency i. λ i denotes the wavelength on each frequency. A comparison between ANTEX-corrected and RINEX-corrected PPP ZTD comparisons resulted in no or negligible differences.

2.5. Evaluation of ZTD Estimates from Single-Frequency PPP

This subsection illustrates the single-frequency ZTD evaluation using the Satellite-specific Epoch-differenced Ionospheric Delay model (SEID) from a surrounding dual-frequency network. PPP uses the ionosphere-free linear combination to eliminate the first order effect of the ionospheric delay error. The drawback of this method is that the errors and multipath on L1 is increased by a factor 2.546, and on L2 by a factor 1.546. The effect is that, when the errors are not correlated, the noise of the ionosphere free linear combination is increased by a factor 3. Also for antennas that are sensitive to multipath, or are placed in a multipath-prone environment, this effect may cause the performance to decrease significantly. In these cases the performance of using L1-only measurements may outperform the dual-frequency ionosphere-free linear combination results (see also Reference [32]).
Instead, the SEID algorithm [33], combined with L1 data, generates a synthesized L2 measurement by utilizing data from a network of existing dual-frequency receivers. The synthesized signal contains in principle the same information as L1 but is adjusted to the ionospheric delay on that frequency based on the dual-frequency measurements from the surrounding network. This effectively reduces the noise effect. As part of the evaluation, we apply the SEID model on L1-data using a network of three receivers. By removing the second frequency observations from the RINEX data and correcting the L1 data for elevation and azimuth-elevation patterns, we also investigate the performance of the SEID algorithm on L1-corrected data. Though stations in the close proximity to DLF1 are available, the outside station network distances are chosen between 55 and 130 km to simulate a more realistic scenario to densify existing networks. The SEID evaluation process is depicted in Figure 4.
The following section describes the results of the experiment by analyzing the satellite phase residuals and ZTD estimations.

3. Results

3.1. Residuals Analysis and PCV Estimation to Obtain Corrected ANTEX Entries

First, we analyzed the residuals as a crucial step to correct for existing phase patterns caused by the receiving antenna. The residuals are derived from the static RTKLIB solution. The RTKLIB output contains the residuals for each satellite, epoch and frequency on code and phase. Table 4 shows the mean residuals and their respective RMSE.
The LEIAR25.R3 LEIT antenna demonstrated the lowest phase RMSE on both frequencies. It is also evident that the L2 phase residuals are generally higher than the L1 residuals for all antennas. The Trimble AV28 and U-blox ANN-MB-00 show generally higher phase RMSE values on both frequencies compared to the other antennas. The phase RMSE is considerably smaller when using a circular metallic ground plane. The antennas in Table 4 are ordered by approximated acquisition costs. A quality difference with generally lower phase residuals for the upper price category antennas compared to the less expensive ones is evident. As known from GNSS basics, the code residuals have higher deviations than the phase measurements. The mean code error is not zero because they are less precise and the mean single-difference phase residuals are utilized as reference in computing the double-differences. Though interesting, the code residuals are less important for the analysis because precise applications employ phase measurements. L1 and L2 mean phase residuals averaged over the elevation angle are shown in Figure 5.
Figure 5 shows the averaged elevation-based pattern for L1 and L2 observations with all tested antennas using a bin size of 0.5 degrees (continuous line), its standard deviations (thin dotted line in the background) and the residuals smoothed over 5 degree bins to correspond to the ANTEX format (thick dashed line). Generally apparent are higher variations at lower elevation angles for all antennas and a higher standard deviation of L2 compared to L1. A clear signal is evident for the Trimble AV28 and U-blox ANN-MB-00 antennas using the rectangular metal bracket as base. This effect can be seen on L1 with satellites between 30 and 50 degrees and on L2 at about 25 and 40 degrees. Since these results evoked further investigation, the experiment was repeated with a circular ground plane. The identified pattern could be reduced when using a circular ground plane. However, on L2 the observed variations above 60 degrees are noticeable greater compared to the other antennas. Evident is that both antennas, although being produced by a different manufacturer and having an inherently different design, demonstrate a comparable elevation-based pattern. The reference antenna LEIAR25.R3 LEIT demonstrated no clear elevation-based phase bias at any elevation angle since both, base and rover antenna are of the same model and the resulting residual error in differential analysis mostly cancels out. The antennas GA530 and TRM55971.00 also demonstrate a slightly visible mean phase pattern.
Typically, azimuth dependent residuals are stacked over several weeks or months of data or over several days by rotating the antenna by some degree. This was not performed in this study. Instead, with the limited observation days available we stacked the azimuth and elevation dependent residuals over the selected observation days. Since the antenna phase residuals of AV28 and ANN-MB-00 with different mountings evokes additional attention, Figure 6 compares the elevation and azimuth dependent L1 and L2 phase residuals for the reference antenna LEIAR25.R3 LEIT and the antennas Trimble AV28, U-blox ANN-MB-00 with rectangular bracket and circular plane.
Figure 6 demonstrates the performance of a reference antenna (LEIAR25.R3 LEIT) compared to the two low-cost antennas Trimble AV28 and U-blox ANN-MB-00 with a rectangular bracket and a circular plane as base. Note that the zenith angle is used instead of elevation angle to correspond with the ANTEX format and more intuitive interpretation of the polar plots. Generally noteworthy are the fewer satellite tracks on L2 which is caused by not all GPS satellites yet transmitting the L2C signal. As previously illustrated in the elevation based residuals, the LEIAR25.R3 antenna (Figure 6a) depicts generally low residuals over the full horizon with only a few higher values close to the ground. The patterns from the antennas AV28 and ANN-MB-00 are characterized by negligible differences between them. Noticeable differences are slightly lower residuals at low elevation in South-West (225°) direction on L1 for the AV28 (Figure 6b left) compared to the ANN-MB-00 (Figure 6d left) antenna using a rectangular bracket. Evident are also the strong negative residuals on L1 at low elevation in North (0°) direction and the stronger positive residuals on L2 in the same direction. The described L1 pattern at about 45 degree elevation (AV28 rectangular and ANN-MB-00 rectangular in Figure 5) is also visible with the strongest signal in East and West direction. The errors using a circular plane are generally smoother for both antennas. Regions with increased residuals are, however, still evident. For further processing, the elevation and azimuth dependent residuals were averaged in 5 degree bins to comply with the ANTEX standard. To overcome possible outliers in the data and since only limited observation days were used, we also applied a polynomial fit over the azimuth dependent signal. Based on the base antenna’s (LEIAR25.R3 LEIT) ANTEX PCV entries, the elevation and azimuth-elevation dependent phase residuals were used to generate absolute PCVs to append or replace existing ANTEX entries for the tested antennas.

3.2. Evaluation of ZTD Estimates from Low-Cost Dual-Frequency Receiver and Different Quality Antennas

Table 5 shows the ZTD bias and RMSE values, computed without supplying an ANTEX file (no ANTEX), applying only satellite PCO and PCV corrections (Only satellite PCO/PCV), using the original IGS ANTEX entries (IGS ANTEX), elevation-only corrected ANTEX entries (El. Corrected) and azimuth-elevation dependent corrected ANTEX entries (Az.-el. Corrected). For the latter two runs, the existing ANTEX entries from the original IGS ANTEX file were removed and replaced with the generated antenna corrections from our experiment. For all evaluations, the IGS final ZTD estimations from the IGS station DLF1 located at approximately 10 m distance served as reference.
The PPP runs without supplying an ANTEX file yielded high RMSE of about 15 mm for both antennas and a bias of 7.5 mm for the LEIAR25.R3 LEIT antenna. No significant bias is evident for the TRM55971.00 NONE antenna. Applying only the satellite PCO and PCV corrections, the bias of the LEIAR25.R3 antenna slightly decreased to about 6 mm and the RMSE to about 8 mm. The bias of the TRM55971.00 antenna remained at about the same level while the RMSE decreased drastically to about 4 mm which already agrees well with the expected standard deviation of about 4 mm from the official IGS ZTD final product [3,34]. Both reference antennas performed well using the original IGS ANTEX file resulting in no significant biases. The RMSE is in an expected range of about 4 mm. Replacing the existing ANTEX entries with the generated ANTEX entries resulted in a similar performance to the IGS reference results with RMSE values between 3 and 5 mm. Remarkably, compared to the LEIAR25.R3 antenna, the bias of the TRM55971.00 antenna increased up to about −2.3 mm in the azimuth- elevation corrected results.
The same evaluation is done for the antennas without official ANTEX entries, yet without the IGS receiver antenna corrections that are unavailable for this case. Table 6 shows the results for the ANTEX corrected PPP-based ZTD estimations with the antennas GA530, AV28 and ANN-MB-00.
By supplying no ANTEX file or only correcting for the satellite antenna PCO and PCV, the results in Table 6 depict a generally better ZTD quality for the Trimble GA530 antenna compared to the Trimble AV28 and U-blox ANN-MB-00 antennas. A considerable difference is evident when using a circular ground plane and a rectangular bracket for the latter two. While the bias and RMSE of the data with rectangular brackets remained at a constant high level (>20 mm), employing a circular plane reduced the errors down to about 7 and 10 mm RMSE. Remarkably, applying the elevation-only or azimuth-elevation dependent ANTEX entries for these antennas resulted in a significant improvement for both antennas and mounting types. The offsets are lowered to between −0.47 and −3.91 mm and the ZTD RMSE are between 3.77 and 6.64 mm. Whilst the RMSE of the Trimble GA530 remained at the same level of about 5 mm, the bias increased slightly compared to the satellite-only PCO and PCV corrections.

3.3. ZTD Evaluation Using Single-Frequency PPP with SEID Modelling

Table 7 shows ZTD results using L1 data combined with SEID modelling of L2. The Table shows results using the original RINEX L1 data, elevation-corrected L1 data and azimuth-elevation corrected L1 data as input. The IGS ANTEX file is used to provide the satellite PCO/PCVs. In case of the original RINEX L1 data, the receiver PCO/PCV is used as well in case there is an entry in the IGS ANTEX file. In case of the elevation and/or azimuth corrected data the RINEX L1 data is modified for the L1 PCV (no receiver entries from ANTEX are used).
Applying SEID and using the original RINEX L1 data and IGS ANTEX file, the overall performance of the geodetic quality antennas (LEIAR25.R3 LEIT and TRM55971.00 NONE) remained at a high level. It is also evident that noise and bias were significantly decreased for the antennas Trimble AV28 and U-blox ANN-MB-00 for both mounting types compared to the satellite-only PCO and PCV corrected results from Table 6. The bias was almost zero for the U-blox ANN-MB-00 (circular plane) and −6 mm for the rectangular bracket dataset. The AV28 data were slightly more biased with values of about 3 mm for the circular plane data and −5 mm using the rectangular bracket. The RMSE values were between about 4 mm and 7.5 mm. Notably, the ANN-MB-00 (circular plane) dataset is already comparable to the reference results from Table 6. Applying elevation and azimuth-elevation dependent corrections to the RINEX L1 observations further improved the results with biases between almost zero and 4 mm and RMSE values of about 4 to 6 mm ZTD. The performance of the higher grade antennas (LEIAR25.R3 LEIT, TRM55971.00 NONE and Trimble GA530) remained at a stable level which is similar to the results from Table 6.
The results from all conducted evaluations are summarized in the boxplots shown in Figure 7. The boxplots show the differences between the IGS ZTD reference data and the obtained goGPS PPP ZTD estimations. The boxplots on the left depict the results using the original L1 + L2 RINEX data with the original IGS ANTEX, without supplying ANTEX corrections and using only satellite PCO and PCV. One should note that these graphs in the left box illustrate the ZTD results with the original recorded dual-frequency data and different IGS ANTEX constellations. It is evident that supplying the original IGS ANTEX corrections resulted in the smallest errors, but these are not available for the low cost antennas. It also shows that applying no ANTEX corrections to the data yield high standard deviations and offsets in the ZTD estimations. Supplying only satellite PCO/PCV corrections provide reasonable results for the antennas TRM55971.00 NONE and GA530. The antennas LEIAR25.R3 LEIT, AV28 (circular) and ANN-MB-00 (circular) are at a comparable level. Although the standard deviation decreased for the data from the ANN-MB-00 and AV28 antennas, a significant bias was still present for the rectangular ground plate datasets.
The boxplots on the right in Figure 7 depict the reference data (original ANTEX and satellite PCO/PCV) and summarize the results for the corrected datasets (the first four groups) and applied SEID experiments (the rightmost three groups). One can note that the corrected data illustrate values in the range between −30 and 20 mm compared to −70 and 45 mm when not using the IGS ANTEX file. The presented results demonstrate a similar performance of all antennas with their most significant differences being the biases. Notably, the biases of the rectangular and circular mounting types are of opposite sign using only satellite PCO/PCV corrections. After correction, the biases are significantly reduced for the LEIAR25.R3 LEIT antenna as well as for the low-cost antennas AV28 and ANN-MB-00 using both, rectangular bracket and circular plane. It also shows that results for the single-frequency SEID experiments are comparable to the dual-frequency results.

4. Discussion

4.1. Residual Analysis

The presented residual analysis provides elevation- and azimuth-elevation phase patterns on both frequencies for each rover antenna. The analysis proves that antenna dependent residual phase patterns are present, and certain anomalies, for example, multipath signals presumably caused by the rectangular plate (AV28 and ANN-MB-00), can be exposed. The phase patterns can be modelled to provide corrections and/or a relative antenna calibration for our further investigations. The relative calibrations can be turned into absolute antenna calibrations in the international ANTEX format by averaging over 5 degree elevation and azimuth bins, and adding the relative calibration to the absolute calibration of the reference antenna. An important point of discussion is whether the full azimuth-elevation pattern should be used, or the elevation only pattern. The elevation only pattern is more robust and less sensitive to possible outliers than the azimuth-elevation pattern, it is also computationally less expensive to compute. Three days of data is enough to compute the elevation only pattern. To compute the azimuth-elevation pattern we advise to use more days, and/or rotate the antenna, to fill the gaps in the azimuth patterns. Additional satellite tracks over the horizon can also be obtained by utilizing multiple satellite constellations sharing the same center frequency (e.g., Galileo E1 and GPS L1). However, it introduces additional unknowns (i.e., estimation of an additional clock term) and, in the latitude of the executed experiment, still leaves the gap in the North. Consequently, a carefully conducted rotation of the antenna and accounting for it during the processing can be used to fill gaps in the azimuth pattern and at the same time average potential multipath effects. The result we obtained for the elevation only patterns were comparable to our limited azimuth-elevation patters, thus, for three days calibration time, we recommend to use the elevation only patterns. The procedure for azimuth-elevation patterns needs some further investigation.

4.2. Absolute ZTD Estimations

In order to evaluate the performance of our antenna calibrations on the absolute ZTD estimation several PPP computations were performed. The rover antennas were divided in two groups. The first group is formed by the LEIAR25.R3 LEIT and TRM55971.00 NONE from which we know the antenna patterns from existing type mean IGS ANTEX entries, and which provide an excellent reference for our own calibrations, as well as scenarios in which no or satellite-only antenna calibrations would be available. The results are summarized in Table 5 and Figure 7. Using no ANTEX file at all, the ZTD RMSE compared to the IGS reference is about 15 mm for both antennas in contrast to about 4 mm with applying the IGS PCO and PCV corrections. Supplying only satellite antenna corrections decreases the ZTD RMSE to 8 mm (LEIAR25.R3 LEIT) and to about 4 mm (TRM55971.00 NONE). It also shows that the LEIAR25.R3 LEIT antenna, caused by the antenna design and radome, has a phase pattern that deviates significantly from a sphere, resulting in a bias of about 6 mm when applying only satellite antenna corrections (and ignoring the receiver corrections). This makes it particularly important to correct for this error with this antenna type. The TRM55971.00 NONE antenna pattern suggests to have only little impact on the ZTD estimation with almost identical results comparing the original IGS ANTEX data results. It suggests that the PCV of this antenna has a spherical pattern. Applying the antenna PCV corrections from the conducted short baseline analysis demonstrated comparable results for the elevation-based ANTEX correction and slightly less precise results for the azimuth-elevation corrections. Especially the bias increased which suggests that more outliers are present in the azimuth analysis which is presumably caused by the lack of observing days to perform an azimuthal correction with the utilized calibration method. Except for the minor bias, the ZTD RMSE with self-calibrated antenna pattern entries are comparable to the results using the IGS ANTEX calibrations, and comparable to the IGS reference ZTD estimations.
The second group of antennas consisted of the GA530, AV28 and ANN-MB-00. Since no official antenna calibrations are available for these antennas, the performance could not be evaluated directly against official calibrations. However, the IGS supplies official ZTD estimations from DLF1 to which the results can be compared. Since the PPP processing scheme is not changed except for the supplied ANTEX files, the results demonstrate the antenna phase variation impact on the tropospheric delay. They are shown in Table 6 and Figure 7. The results of the GA530 antenna are comparable to the performance of the LEIAR25.R3 and TRM55971.00 antennas. Supplying no ANTEX file at all, high ZTD biases in the order of −20 mm and −15 mm for the AV28 and ANN-MB-00 antennas are evident with the rectangular bracket. Using a circular plane reduced them to about 12 mm and 6.5 mm, respectively, while maintaining similar RMSE. When applying satellite PCO and PCV corrections, the boxplots in Figure 7 (Satellite PCO/PCV column) demonstrate that the standard deviation decreased notably. The presented offsets and consequently RMSE values limit the application of the data for meteorological purposes. After applying the elevation-only antenna corrections to the data, the bias and RMSE decreased significantly for the antennas AV28 and ANN-MB-00. Remarkably, the applied corrections did not only increase the performance of the antennas with a circular plane, but also significantly decreased the error from using the rectangular bracket as base. Applying the azimuth-elevation dependent corrections to the data slightly increased the performance of the low-cost antennas. The bias increased slightly for the GA530 antenna and is presumably caused by the short observation time and outliers present in the residuals. The results are encouraging and demonstrate that the applied corrections for low-cost antennas make the data more attractive for tropospheric analysis. Particularly, the performance of the patch antenna ANN-MB-00 with a circular ground plane after correcting the phase pattern yields comparable results (0.47 mm bias and 4.02 mm RMSE) to those from geodetic quality antennas. To confirm these findings, longer observation times are recommended. The utilized IGS I14.ATX ANTEX file consisting of the elevation-only calibrations (without PCO estimations) for the antennas LEIAR25.R3 LEIT, TRM55971.00 NONE, Trimble GA530 and Trimble AV28 and U-blox ANN-MB-00 using a circular plane is attached as Supplementary Material.

4.3. Dual- versus Single-Frequency

The ionosphere-free linear combination, which is applied to dual-frequency data in PPP to eliminate the ionospheric delay, almost triples the noise in the data. Considering that noise in the data, including the noise in the antenna calibrations, is the major contributor to the bias and RMSE in the ZTD estimation, it can be useful to use L1 data only. Also, although this could change in the future, single-frequency receivers are more readily available than cheap dual-frequency receivers. By applying the SEID algorithm to L1-only observations, an artificial second frequency is generated from the L1 data using the interpolated ionospheric delay from a network of dual-frequency reference receivers. We apply this method to investigate if L1-only measurements may be favorable for ZTD estimations. The results are shown in Table 7. Using the original L1-only data and IGS ANTEX file, the SEID results indicate a similar performance for the high-quality antennas LEIAR25.R3, TRM55971.00 and GA530 compared to the L1 + L2 processing using the original IGS ANTEX file (Table 5 and Table 6). Compared to results obtained using only satellite PCO/PCV corrections, the performance of the AV28 and ANN-MB-00 antennas increased significantly after applying SEID on the original data. The lowest bias (−0.40 mm) and RMSE (4.23 mm) is observed with the ANN-MB-00 using a circular plane as base. The results with rectangular brackets demonstrate a ZTD RMSE of about 7 mm and a bias of −5 to −6 mm. Especially the bias of the datasets with rectangular brackets could be reduced to −0.36 mm (ANN-MB-00) and 2.26 mm (AV28) after applying elevation corrections to the L1 data. Applying the azimuth-elevation dependent corrections to the L1 input data resulted in minor improvements for the AV28 data and slight degradation of the ANN-MB-00 data.
These results suggests that the original L1 + L2 data is considerably affected by noise amplified by the ionosphere-free linear combination. Provided that a network of high quality surrounding stations exists, the approach demonstrates the strong advantage of the SEID algorithm to generate L2, which drastically reduces the noise on the target receiver data. There is, however, a trade-off between smoothing the true signal and the underlying noise. Utilizing this method almost eliminates the ZTD bias that was present in the data and the RMSE decreased to a level that is comparable to high-quality measurements which makes it attractive for meteorological applications such as water vapor estimation.

5. Conclusions

In this paper we investigated the PPP ZTD performance of a recently introduced low-cost dual-frequency receiver (U-blox ZED F9P) in combination with different antennas, ranging from geodetic to mass-market devices, with and without applying relative antenna calibrations. The conducted experiments demonstrated that the U-blox ZED-F9P dual-frequency receiver is very well capable to produce high-quality results, with the limiting factor being the quality of the receiving antenna. However, our results show that, using a simple-to-apply method to correct for the PCV of cost-efficient receiver antennas, high quality results are achievable even for low-cost antenna. This is demonstrated by a field experiment, resulting in ZTD estimations of similar quality as with high-grade antennas.
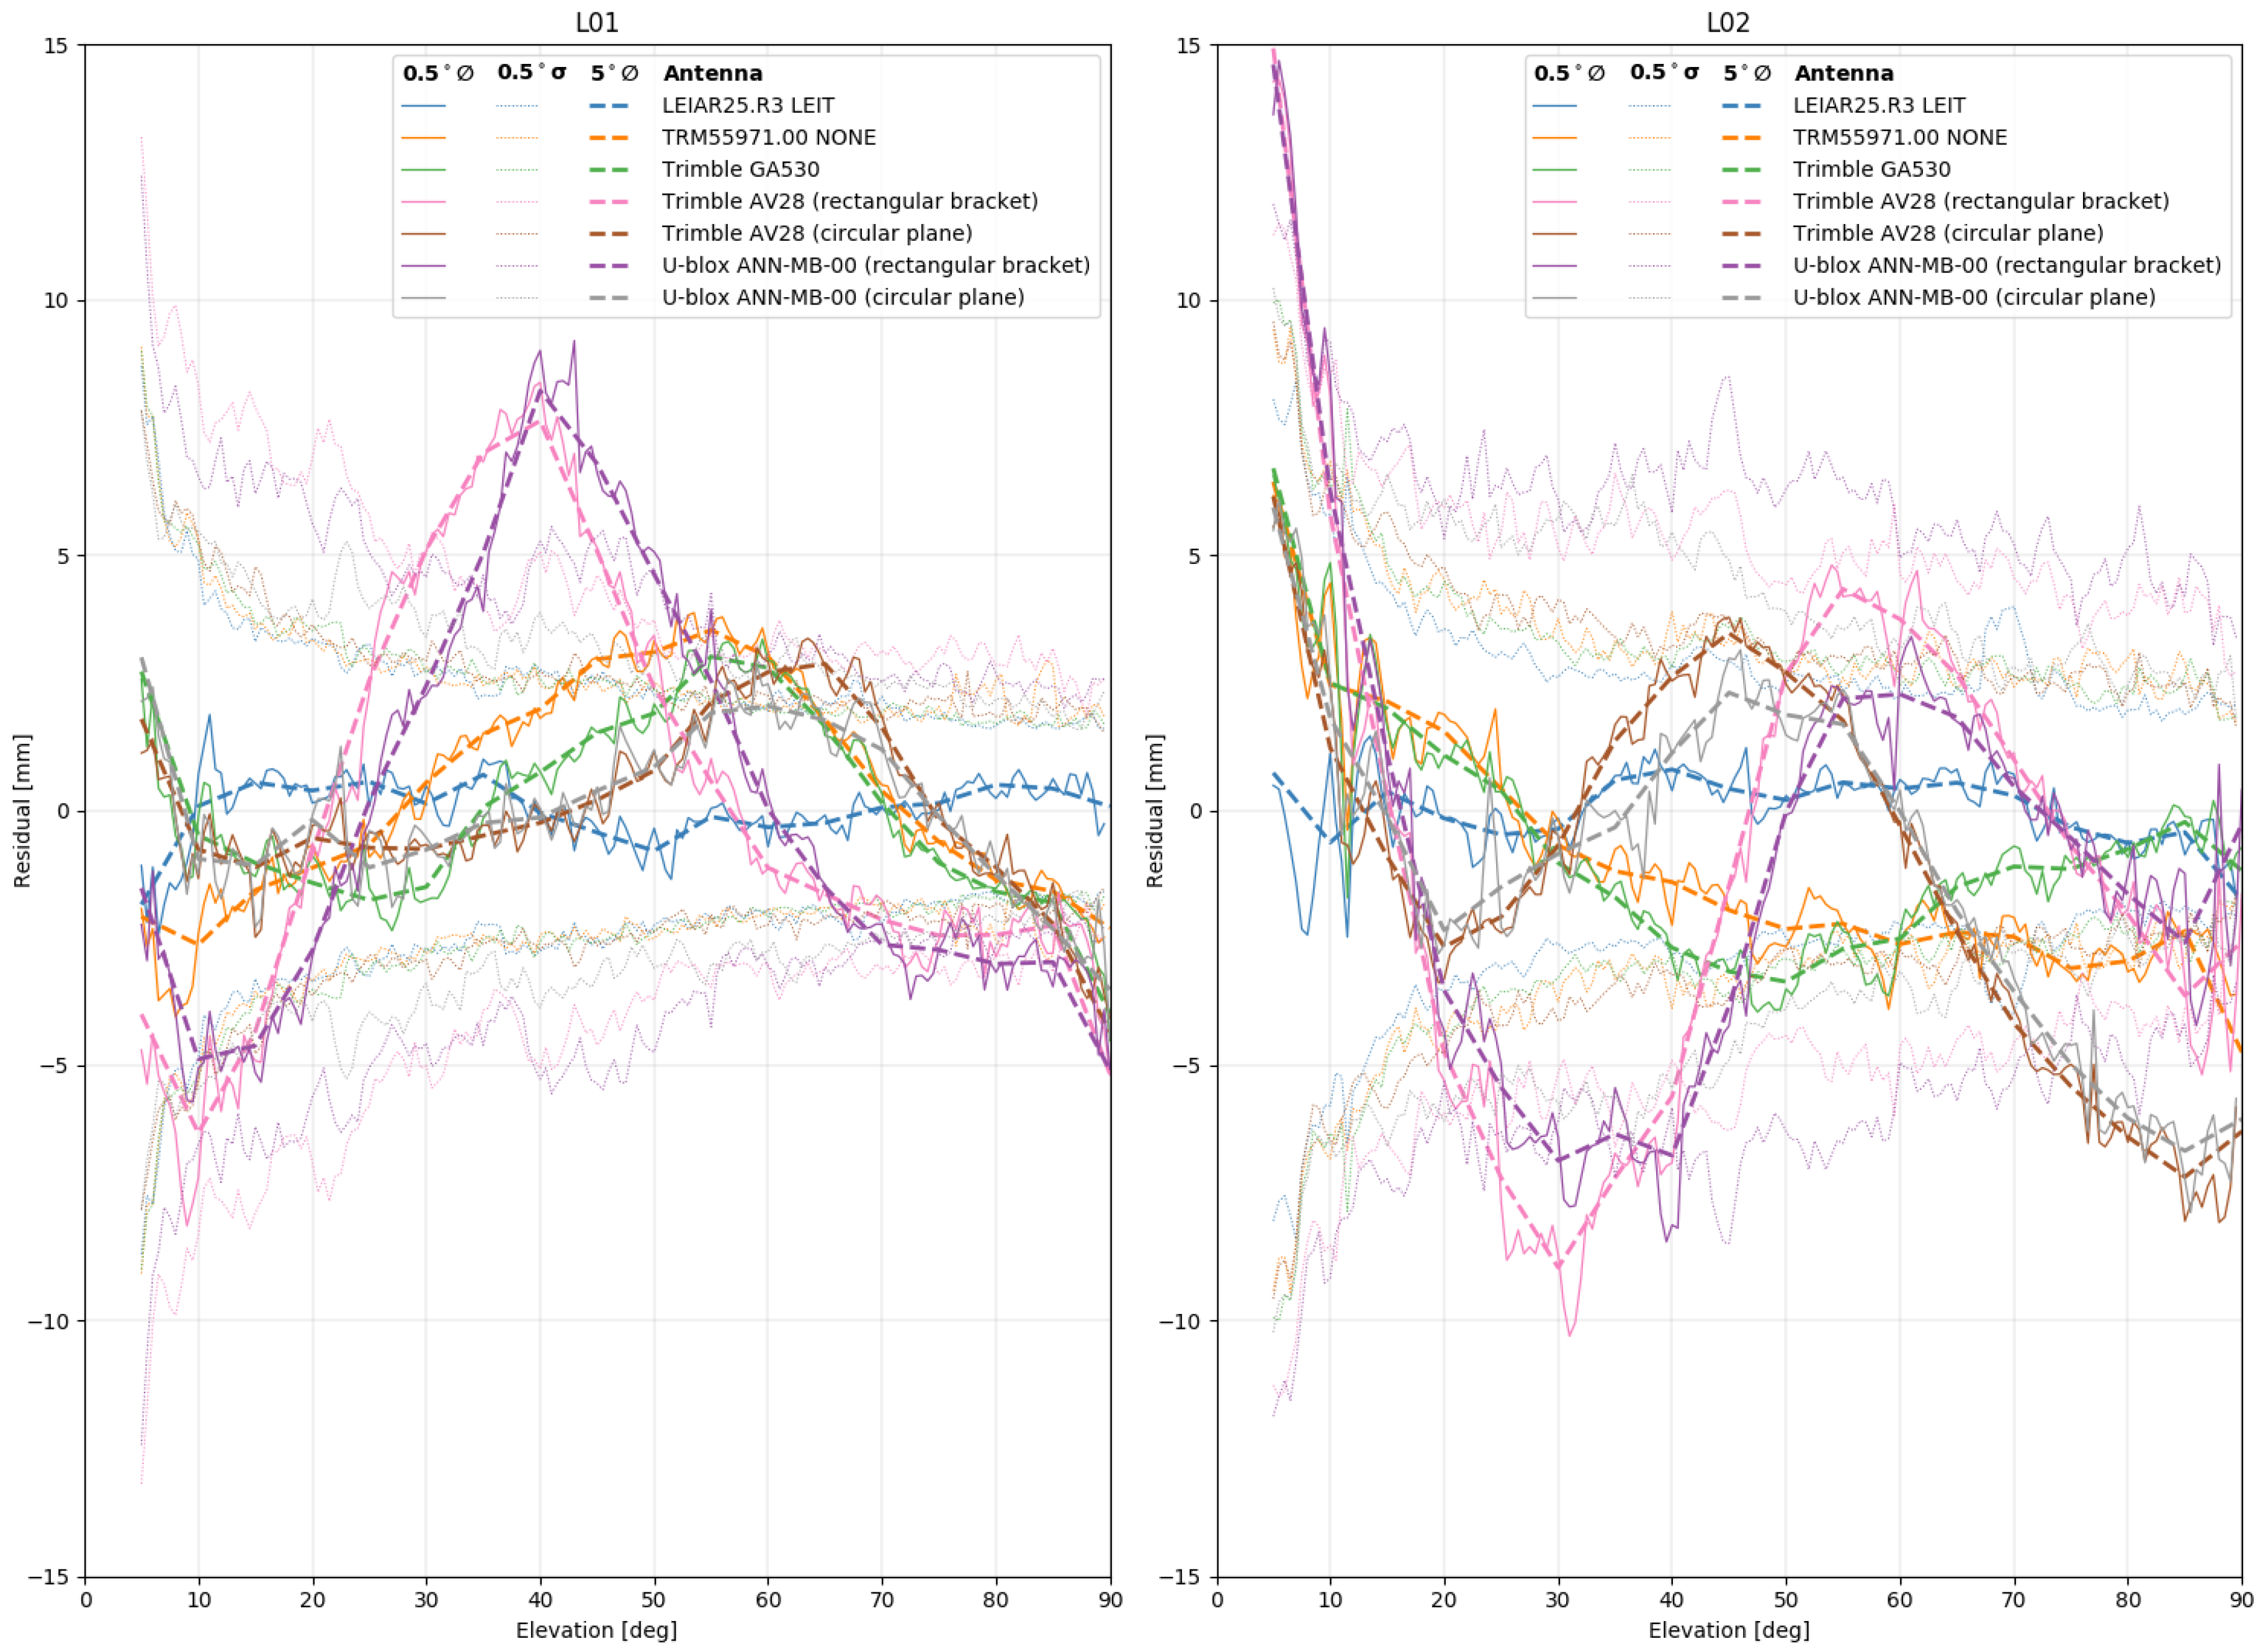
The phase residuals with different antenna types were analyzed over a short baseline. The aim was to do a relative antenna calibration. The absolute antenna calibration pattern can then be computed from the absolute antenna calibration of the reference antenna and the relative calibration result from the short baseline experiment. For two of the tested antennas, the AV28 and ANN-MB-00 antennas, when used with a rectangular bracket as mounting point, very prominent elevation-based patterns were found (see Figure 5). These cases result in the highest RMSE phase residuals when compared to other antennas. Figure 6 indicates azimuth dependent patterns with strongly fluctuating amplitudes. The rectangular bracket presumably caused high residuals for L2 close to the horizon, but also in East and West direction for L1. Smaller residuals were obtained after repeating the experiment with a circular ground plane. These results showed that our approach is working, regardless of the size of the residual patterns. This suggests that our approach is feasible for even more challenging, multipath-prone environments. Additional uncertainty may be introduced by the smoothing technique we used to obtain PCVs in the 5-degree bin size required by the ANTEX standard. A lower binning size may further improve the results. Considering that only three days of data were used for the calibration, and that the antenna was not rotated, many of the azimuth-elevation bins were without data or had only few observations. For this reason the elevation-only based calibration is preferred over the azimuth-elevation based calibration.
The impact of the different antenna PCV corrections on PPP ZTD estimations has been analyzed for the tested antennas. Our results confirm that antenna pattern corrections are essential for PPP ZTD estimations. Applying satellite PCO/PCV corrections significantly decreases the standard deviation in the ZTD error compared to using no ANTEX corrections at all. Without applying receiver antenna corrections, the ANN-MB-00 and Trimble AV28 antennas with a rectangular bracket, resulted in a ZTD bias between −20 and −24 mm and similar standard deviations. With a circular plane the effect could be partially mitigated, but biases in the order of about 9.5 mm and 5.3 mm remained. The results suggest that a phase pattern is present for the low-cost antennas which we address by applying a relative antenna calibration. Applying elevation or azimuth-elevation dependent corrections to the data reduced the ZTD bias significantly and lowered the standard deviation. For example, when using the azimuth-elevation dependent corrections on the ANN-MB-00 antenna, the bias in the ZTD was reduced to −0.52 mm and an RMSE to only 3.77 mm. Results for the other antennas, and using elevation only patterns, were similar. This shows that the ZTD estimations achieve an error level that is comparable to high-grade antennas. Though the biases for ANN-MB-00 (rectangular bracket), AV28 (circular plane) and AV28 (rectangular bracket) could not be completely removed, they were reduced significantly to a level that makes the observations useful for tropospheric analysis.
The ionosphere-free linear combination used by the PPP solutions is very noisy. The noise in the L1 and L2 data, including the errors in the relative calibration, is basically tripled. For this reason we also looked at only using the L1 data in combination with the SEID algorithm to generate L2 data from an existing network of geodetic-grade receivers. In case no PCV correction is done for the receiving antenna, the bias and standard deviation in ZTD for the GA530, AV28 and ANN-MB-00 antennas, were smaller using L1 with SEID generated L2 data, than for the original dual-frequency data. This is a clear indication that the ionosphere-free linear combination on the original L1 + L2 data is considerably amplifying the noise present in the datasets. Using SEID in combination with the elevation or azimuth-elevation based L1 corrected data removed the biases almost entirely. The results are of comparable quality to ZTD estimations derived from the dual-frequency results.
This experiment uses exclusively GPS observations. As many of the low-cost receivers can track multiple GNSS systems, expanding the antenna calibrations to include multi-GNSS may further increase the application of the presented approach. Another interesting experiment would be to perform an absolute antenna calibration by a specialized company on low-cost antennas and compare their calibrations to our results. Further work is needed to investigate, if the observed pattern is reproduced (or differs) from other antennas of the same model, so that the observed elevation-based phase pattern of an antenna can be applied to other antennas of the same model. This will be subject of future experiments.

Supplementary Materials

The following are available online at https://www.mdpi.com/2072-4292/12/9/1393/s1. The utilized IGS I14.ATX ANTEX file appended with the elevation-only calibrations (without PCO estimations) for the antennas LEIAR25.R3 LEIT, TRM55971.00 NONE, Trimble GA530 and Trimble AV28 and U-blox ANN-MB-00 using a circular plane. The file (file extension .ATX) is a plain text file and a standard convention for GNSS antenna calibrations. The format description can be found on the website of the IGS [35]. The file can be opened in every classical text editor.

Author Contributions

Conceptualization, A.K., H.v.d.M., M.-C.t.V. and N.v.d.G.; methodology, A.K., H.v.d.M. and M.-C.t.V.; software, A.K. and H.v.d.M.; formal analysis, A.K., H.v.d.M., M.-C.t.V. and N.v.d.G.; data curation, A.K. and H.v.d.M.; writing—original draft preparation, A.K.; writing—review and editing, A.K., H.v.d.M., M.-C.t.V. and N.v.d.G.; visualization, A.K.; supervision, H.v.d.M., M.C.t.V. and N.v.d.G.; funding acquisition, M.-C.t.V. and N.v.d.G. All authors have read and agreed to the published version of the manuscript.

Funding

The work received funding from the European Community’s Horizon 2020 Programme (2014–2020) under grant agreement No. 776691 (TWIGA). This project has also received funding from the European Union’s Horizon 2020 research and innovation programme under grant agreement No. 700699 (BRIGAID).

Acknowledgments

We like to thank Christian Tiberius for providing the U-blox ZED F9P engineering sample. A special thanks goes to Sander Terwee from Geometius (www.geometius.nl) for donating the antennas Trimble Zephyr 2 Geodetic and GA530 for educational and scientific purposes to the Faculty of Civil Engineering.

Conflicts of Interest

The authors declare no conflict of interest.

Abbreviations

The following abbreviations are used in this manuscript:
ANTEXAntenna Exchange Format
APApplication Program
APCAntenna Phase Center
ARAmbiguity Resolution
CLICommand-line User Interface
DDDouble Differences
DOYDay-Of-Year
DPGADutch Permanent GNSS Array
EKFExtended Kalman Filter
ENUEast North Up
GMFGlobal Mapping Function
GNSSGlobal Navigation Satellite System
GPSGlobal Positioning System
GPTGlobal Pressure/Temperature
GUIGraphical User Interface
IGSInternational GNSS Service
LEIAR25.R3Leica AR25.R3
NMiNederlands Meetinstituut
PCOPhase Center Offset
PCVPhase Center Variation
PPPPrecise Point Positioning
PWVPrecipitable Water Vapor
RINEXReceiver Independent Exchange Format
RMSERoot Mean Square Error
SEIDSatellite-specific and Epoch-differenced Ionospheric Delay
TRM55971.00Trimble Zephyr 2 Geodetic
USNOUS Naval Observatory
ZTDZenith Tropospheric Delay
ZWDZenith Wet Delay

Appendix A. Data Storing and Conversion

Data were stored in the binary U-blox logging format (*.ubx) on a local SD card of the Raspberry Pi. The logged files consisted of the UBX-RAWX messages which contained the raw measurements of the receiver (pseudorange, carrierphase, doppler and SNR on all recorded frequencies and satellite systems). The sampling interval was 1 Hz. Data were stored in 24 h batches of .ubx log files. For further processing, the data were converted to daily, 1Hz RINEX3 files. This step was performed with a combination of the RTKLIB application convbin (v. 2.4.3) and gfzrnx (v. 1.11) [36]. Figure A1 represents the work flow of this process. Metadata, if available, were added to the generated data.
Figure A1. Sketch of *.ubx data format conversion to RINEX version 3.
Remotesensing 12 01393 g0a1

Appendix B. Ambiguity Fixing Case Study

Since ambiguity fixing is essential to achieve highest accuracy results and RTKLIB offers several methods, a brief sensitivity study was conducted utilizing the continuous, instantaneous and fix-and-hold RTKLIB options with the same geodetic-grade antenna type on both, rover and base station (LEIAR25.R3 LEIT). For the sensitivity case study, one day of data from the highest quality antenna, LEIAR25.R3 LEIT was used. The continuous mode estimates phase biases over many epochs. It provides less outliers but when erroneous data are fed into the EKF it may remain over several epochs. The instantaneous method estimates integer ambiguities without constraining the previous (successful) fixes epoch-by-epoch. Fix-and-hold works similar to the Continuous AR, but tightly constrains the validated carrier-phase bias parameters in the next EKF update step. Further details can be obtained from the RTKLIB manual [37]. The results of the RTKLIB processing scheme are shown in Table A1. With 99.69% and 99.70% fixed solutions on L1 and L2 or only 2700 and 1614 float satellite observations on L1 and L2, the fix-and-hold solution performed best in our scenario.
Table A1. Fix and float satellite residuals summary of the LEIAR25.R3 LEIT antenna on DOY 79. For the fix-and-hold ambiguity solution, ’hold’ epochs are considered as fix (Q==1).
AR-MethodFrequencyN (Epochs)Fix N(%) Q==1Float N(%) Q==2
ContinuousL1873,729835,273 (95.60)38,456 (4.40)
ContinuousL2531,297508,782 (95.76)22,515 (4.24)
InstantaneousL1873,729302,696 (34.64)571,033 (65.36)
InstantaneousL2531,297189,191 (35.61)342,106 (64.39)
Fix-and-holdL1873,729871,029 (99.69)2700 (0.31)
Fix-and-holdL2531,297529,683 (99.70)1614 (0.30)

References

  1. Bevis, M.; Businger, S.; Herring, T.A.; Rocken, C.; Anthes, R.A.; Ware, R.H. GPS meteorology: Remote sensing of atmospheric water vapor using the global positioning system. J. Geophys. Res. Atmos. 1992, 97, 15787–15801. [Google Scholar] [CrossRef]
  2. Bonafoni, S.; Biondi, R.; Brenot, H.; Anthes, R. Radio occultation and ground-based GNSS products for observing, understanding and predicting extreme events: A review. Atmos. Res. 2019, 230, 104624. [Google Scholar] [CrossRef]
  3. Guerova, G.; Jones, J.; Douša, J.; Dick, G.; Haan, S.D.; Pottiaux, E.; Bock, O.; Pacione, R.; Elgered, G.; Vedel, H.; et al. Review of the state of the art and future prospects of the ground-based GNSS meteorology in Europe. Atmos. Meas. Tech. 2016, 9, 5385–5406. [Google Scholar] [CrossRef] [Green Version]
  4. Zumberge, J.; Heflin, M.; Jefferson, D.; Watkins, M.; Webb, F. Precise point positioning for the efficient and robust analysis of GPS data from large networks. J. Geophys. Res. B Solid Earth 1997, 102, 5005–5017. [Google Scholar] [CrossRef] [Green Version]
  5. Hauschild, A. Combinations of Observations. In Springer Handbook of Global Navigation Satellite Systems; Springer International Publishing: Cham, Switzerland, 2017; pp. 583–604. [Google Scholar] [CrossRef]
  6. Barindelli, S.; Realini, E.; Venuti, G.; Fermi, A.; Gatti, A. Detection of water vapor time variations associated with heavy rain in northern Italy by geodetic and low-cost GNSS receivers. Earth Planets Space 2018, 70, 28. [Google Scholar] [CrossRef] [Green Version]
  7. Krietemeyer, A.; ten Veldhuis, M.C.; van der Marel, H.; Realini, E.; van de Giesen, N. Potential of cost-efficient single frequency GNSS receivers for water vapor monitoring. Remote Sens. 2018, 10, 1493. [Google Scholar] [CrossRef] [Green Version]
  8. Kouba, J.; Lahaye, F.; Tétreault, P. Precise Point Positioning. In Springer Handbook of Global Navigation Satellite Systems; Springer International Publishing: Cham, Switzerland, 2017; pp. 723–751. [Google Scholar] [CrossRef]
  9. Mader, G.L. GPS antenna calibration at the National Geodetic Survey. GPS Solut. 1999, 3, 50–58. [Google Scholar] [CrossRef]
  10. Gendt, G. IGS Switch to Absolute Antenna Model and ITRF2005; IGSMAIL-5438; IGS Central Bureau: Pasadena, CA, USA, 2006. [Google Scholar]
  11. Görres, B.; Campbell, J.; Becker, M.; Siemes, M. Absolute calibration of GPS antennas: Laboratory results and comparison with field and robot techniques. GPS Solut. 2006, 10, 136–145. [Google Scholar] [CrossRef]
  12. Schupler, B.R.; Allshouse, R.L.; Clark, T.A. Signal characteristics of GPS user antennas. Navigation 1994, 41, 276–296. [Google Scholar] [CrossRef]
  13. Wübbena, G.; Schmitz, M.; Boettcher, G.; Schumann, C. Absolute GNSS antenna calibration with a robot: Repeatability of phase variations, calibration of GLONASS and determination of carrier-to-noise pattern. In Proceedings of the IGS Workshop, Darmstadt, Germany, 8–11 May 2006; pp. 8–12. [Google Scholar]
  14. Geo++. GNSS Technologies. 2019. Available online: http://www.geopp.de/ (accessed on 23 September 2019).
  15. IGS. ANTEX: The Antenna Exchange Format. 2019. Available online: http://www.igs.org/assets/txt/antex14.txt (accessed on 23 September 2019).
  16. Araszkiewicz, A.; Völksen, C. The impact of the antenna phase center models on the coordinates in the EUREF Permanent Network. GPS Solut. 2017, 21, 747–757. [Google Scholar] [CrossRef]
  17. Schmid, R.; Mader, G.; Herring, T. From relative to absolute antenna phase center corrections. In Proceedings of the IGS Workshop and Symposium 2004; Meindl, M., Ed.; Astronomical Institute, University of Bern: Bern, Switzerland, 2005; pp. 209–219. [Google Scholar]
  18. Sidorov, D.; Teferle, F.N. Impact of antenna phase centre calibrations on position time series: Preliminary results. In IAG 150 Years; Springer International Publishing: Cham, Switzerland, 2015; pp. 117–123. [Google Scholar]
  19. Rothacher, M. Estimation of Station Heights with GPS. In Vertical Reference Systems; Drewes, H., Dodson, A.H., Fortes, L.P.S., Sánchez, L., Sandoval, P., Eds.; Springer: Berlin/Heidelberg, Germany, 2002; pp. 81–90. [Google Scholar]
  20. Ejigu, Y.G.; Hunegnaw, A.; Abraha, K.E.; Teferle, F.N. Impact of GPS antenna phase center models on zenith wet delay and tropospheric gradients. GPS Solut. 2018, 23, 5. [Google Scholar] [CrossRef]
  21. Bar-Sever, Y.E.; Kroger, P.M.; Borjesson, J.A. Estimating horizontal gradients of tropospheric path delay with a single GPS receiver. J. Geophys. Res. Solid Earth 1998, 103, 5019–5035. [Google Scholar] [CrossRef] [Green Version]
  22. Pacione, R.; Araszkiewicz, A.; Brockmann, E.; Dousa, J. EPN-Repro2: A reference GNSS tropospheric data set over Europe. Atmos. Meas. Tech. 2017, 10, 1689–1705. [Google Scholar] [CrossRef] [Green Version]
  23. Loh, R.; Wullschleger, V.; Elrod, B.; Lage, M.; Haas, F. The US Wide-Area Augmentation System (WAAS). Navigation 1995, 42, 435–465. [Google Scholar] [CrossRef]
  24. Noll, C.E. The Crustal Dynamics Data Information System: A resource to support scientific analysis using space geodesy. Adv. Space Res. 2010, 45, 1421–1440. [Google Scholar] [CrossRef] [Green Version]
  25. Takasu, T. RTKLIB: An Open Source Program Package for GNSS Positioning. 2019. Available online: https://github.com/tomojitakasu/RTKLIB (accessed on 3 June 2019).
  26. Takasu, T. RTKLIB Github Issue Tracker. 2019. Available online: https://github.com/tomojitakasu/RTKLIB/issues/457#issuecom\ment-473523905 (accessed on 3 June 2019).
  27. Teunissen, P.J.; De Jonge, P.; Tiberius, C. Performance of the LAMBDA method for fast GPS ambiguity resolution. Navigation 1997, 44, 373–383. [Google Scholar] [CrossRef]
  28. Araszkiewicz, A.; Kiliszek, D.; Podkowa, A. Height Variation Depending on the Source of Antenna Phase Centre Corrections: LEIAR25. R3 Case Study. Sensors 2019, 19, 4010. [Google Scholar] [CrossRef] [Green Version]
  29. Herrera, A.M.; Suhandri, H.F.; Realini, E.; Reguzzoni, M.; de Lacy, M.C. goGPS: Open-source MATLAB software. GPS Solut. 2016, 20, 595–603. [Google Scholar] [CrossRef]
  30. Lyard, F.; Lefevre, F.; Letellier, T.; Francis, O. Modelling the global ocean tides: Modern insights from FES2004. Ocean Dyn. 2006, 56, 394–415. [Google Scholar] [CrossRef]
  31. Dow, J.; Neilan, R.; Rizos, C. The International GNSS Service in a changing landscape of Global Navigation Satellite Systems. J. Geod. 2009, 83, 191–198. [Google Scholar] [CrossRef]
  32. Van Der Marel, H.; De Bakker, P. Single- versus Dual-Frequency Precise Point Positioning. Inside GNSS 2012, 1, 30–35. [Google Scholar]
  33. Deng, Z.; Bender, M.; Dick, G.; Ge, M.; Wickert, J.; Ramatschi, M.; Zou, X. Retrieving tropospheric delays from GPS networks densified with single frequency receivers. Geophys. Res. Lett. 2009, 36. [Google Scholar] [CrossRef]
  34. IGS. IGS Products. 2019. Available online: http://www.igs.org/products (accessed on 23 September 2019).
  35. IGS. ANTEX Format Description. 2010. Available online: https://kb.igs.org/hc/en-us/articles/216104678-ANTEX-format-description (accessed on 24 April 2020).
  36. Nischan, T. GFZRNX—RINEX GNSS Data Conversion and Manipulation Toolbox (Version 1.05). 2016. Available online: http://doi.org/10.5880/GFZ.1.1.2016.002 (accessed on 27 April 2020).
  37. Takasu, T. RTKLIB ver. 2.4.2 Manual. 2013. Available online: http://www.rtklib.com/prog/manual_2.4.2.pdf (accessed on 3 June 2019).
Figure 1. Waterproof pelican box rover equipment on the ground next to the marker (a). The pelican box contains the U-blox ZED-F9P, a Raspberry Pi Zero for data logging, power and a Septentrio receiver. The Septentrio receiver is used to provide power, through an antenna splitter, to the antennas: LEIAR25.R3 (b), Zephyr2 (c) and GA530 (d). No data collection or processing is performed with the Septentrio receiver. The verification setup is depicted in (b). It shows the baseline setup with two LEIAR25.R3 LEIT antennas. The antenna in the foreground is at the marker that is used for the investigation. In the background the radome and antenna of the base station DLF1 is visible. Both antennas are oriented North. The subfigures (bf) illustrate the marker used for the investigation with different installed antennas. The antennas AV28 (e) and ANN-MB-00 (f) are depicted with a circular plane.
Remotesensing 12 01393 g001
Figure 2. Steps in the Zenith Tropospheric Delay (ZTD) evaluation procedure. The top central box illustrates the short baseline with base station (DLF1) on the left and rover on the right. The base station DLF1 uses a Trimble NetR9 receiver and LEIAR25.R3 LEIT antenna, which did not change during the time frame of our experiment. The rover is illustrated on the right, with an U-blox ZED-F9P receiver and five antenna types applied consecutively.
Remotesensing 12 01393 g002
Figure 3. PPP ZTD evaluation concept. Original dual-frequency RINEX files are utilized as file input. Several runs with different antennas and ANTEX configurations are tested. The absolute ZTD estimations are evaluated against International GNSS Service (IGS) final ZTD estimations from DLF1.
Remotesensing 12 01393 g003
Figure 4. Satellite-specific Epoch-differenced Ionospheric Delay model (SEID) PPP methods. The original (dual-frequency) RINEX data is trimmed to L1-only observations and the RINEX correction after Equation (2) is utilized. SEID is applied with the stations APEL, IJMU and DENT. The subsequent PPP process is conducted once with the original I14.ATX file and once without the LEIAR25 and TRM55971.00 entries, hence providing satellite Phase Center Offset (PCO)/Phase Center Variation (PCV) corrections only. The resulting absolute ZTD estimations are evaluated against final IGS ZTD estimations from DLF1.
Remotesensing 12 01393 g004
Figure 5. Elevation based antenna pattern on the phase residuals. L1 residuals are depicted left and L2 on the right. The continuous lines (0.5°∅) show the mean residual over 0.5 degree elevation bins, the dotted lines (0.5°σ) in the background its respective standard deviation and the dashed line (5°∅) the smoothed 5 degree bins corresponding to the ANTEX format.
Remotesensing 12 01393 g005
Figure 6. Satellite phase residuals on L1 (left) and L2 (right) for the selected antennas (a) LEIAR25.R3 LEIT (top frame), (b) AV28 L1, (c) AV28 L2, (d) ANN-MB-00 L1 and (e) ANN-MB-00 L2. The figures (be) depict on the left the phase residuals using a rectangular metallic bracket as base and on the right with a circular metallic plane of 10 cm diameter.
Remotesensing 12 01393 g006
Figure 7. Boxplots of goGPS PPP ZTD estimations against IGS reference data from DLF1. The figure on the left depicts the combinations with the original dual-frequency RINEX data using the original IGS ANTEX file, supplying no ANTEX file at all, or only satellite PCO/PCV corrections. The boxplots on the right illustrate the references (original ANTEX, only satellite PCO/PCV), the results with original RINEX L1 + L2 and modified ANTEX entries (elevation modified ANTEX, azimuth-elevation modified ANTEX) and SEID results with original, elevation corrected and azimuth-elevation corrected L1 data.
Remotesensing 12 01393 g007
Table 1. Time frame and antenna descriptions of the antenna placements on GPS Mark 15 for the short-baseline experiments.
StartEndDOYsAntenna, Description
15 February 201920 February 2019046–051Trimble AV28 (stacked patch), rectangular bracket
20 February 201926 February 2019051–057Taoglas AQHA50 (stacked patch), rectangular bracket
26 February 20195 March 2019057–064U-blox ANN-MB-00 (stacked patch), rectangular bracket
5 March 201919 March 2019064–078Trimble GA530 (radome)
19 March 201926 March 2019078–085LEIAR25.R3 LEIT (choke ring)
26 March 20192 April 2019085–092Trimble TRM55971.00 NONE (resistive plane)
11 October 201915 October 2019284–288Trimble AV28 (stacked patch), circular plane
15 October 201918 October 2019288–291U-blox ANN-MB-00 (stacked patch), circular plane
Table 2. RTKLIB RNX2RTKP command line options.
OptionCommand-Line Parameter
Positioning solution: static-p 3
Elevation cut-off: 5 degree-m 5
AR: fix-and-hold-h
AR validation threshold: 3-v 3.0
Output: residuals-y 2
Output: East, North, Up baseline-a
Satellite systems: GPS-only-sys G
Time format: YYYY/MM/DD hh:mm:ss-t
Kalman filter: forward + backward-c
Table 3. goGPS settings for Precise Point Positioning (PPP) ZTD estimation.
TypeParameter
ObservationsGPS-only
Elevation cutoff10
Ocean loadingFES2004
Observation weightingsame weight for all observations
Code observation error threshold30 m
Phase observation error threshold0.05 m
Code least-squares estimation error st. dev. threshold40 m
Clock & orbitsIGS Final
Troposphere modelingSaastamoinen (with GPT model)
Troposphere mapping functionGMF
Sampling interval30-s
Antenna calibrationIGS, own, none
Kalman filter resetno (seamless)
Table 4. Mean and Root Mean Square Errors (RMSE) of code and phase residuals from the static solutions of the short baseline experiments. The phase mean is zero for all antennas since the mean of the single-differenced residuals are used as reference for the DD analysis in the modified RTKLIB application.
AntennaCode RMSE (mm)Code mean error (mm)Phase RMSE (mm)
L1L2L1L2L1L2
LEIAR25.R3 LEIT508.36522.46−0.020.003.614.14
TRM55971.00 NONE513.57551.960.010.144.225.25
Trimble GA530540.35541.410.00−0.023.995.42
Trimble AV28(rectangular bracket)644.51578.630.080.117.708.93
Trimble AV28(circular plane)473.30494.890.000.003.945.70
U-blox ANN-MB-00(rectangular bracket)632.60599.06-0.020.007.009.13
U-blox ANN-MB-00(circular plane)515.49492.470.000.074.286.32
Table 5. ZTD estimation based on antenna PCV corrections with no ANTEX corrections, only satellite PCO/PCV corrections, original IGS type mean ANTEX, elevation corrected ANTEX and azimuth-elevation corrected ANTEX entries on the reference antennas LEIAR25.R3 LEIT and TRM55971.00 NONE. Bias and RMSE refer to the PPP ZTD estimations compared to the IGS ZTD reference.
Antenna(mm)No ANTEXOnly Satellite PCO/PCVIGS ANTEXEl. CorrectedAz.-el. Corrected
LEIAR25.R3 LEITBias7.505.961.151.081.59
RMSE15.868.024.774.674.64
TRM55971.00 NONEBias−0.89−1.30−0.98−1.17−2.26
RMSE14.203.833.583.593.85
Table 6. ZTD estimation based on antenna corrections with no ANTEX corrections, only satellite PCO/PCV corrections, elevation corrected ANTEX and azimuth-elevation corrected ANTEX entries on the antennas Trimble GA530, Trimble AV28 and U-blox ANN-MB-00. Bias and RMSE refer to the PPP ZTD estimations compared to the IGS ZTD reference.
Antenna(mm)No ANTEXOnly Satellite PCO/PCVEl- CorrectedAz-el- Corrected
Trimble GA530Bias3.65−0.93−2.21−3.65
RMSE13.795.054.315.06
Trimble AV 28 (rectangular bracket)Bias−19.35−24.04−3.91−2.86
RMSE23.5924.826.135.10
Trimble AV 28 (circular plane)Bias12.149.542.612.83
RMSE18.0210.865.014.79
U-blox ANN-MB-00 (rectangular bracket)Bias−14.54−19.55−3.34−3.58
RMSE20.1920.596.645.44
U-blox ANN-MB-00 (circular plane)Bias6.475.26−0.47−0.52
RMSE15.327.234.023.77
Table 7. ZTD PPP results using original L1 data, elevation-corrected L1 data and azimuth-elevation corrected L1 data together with the original IGS ANTEX type mean entries using SEID. For the reference target antennas only satellite PCO/PCV ANTEX corrections were utilized. For the SEID processing, the Dutch Permanent GNSS Array (DPGA) stations APEL (Apeldoorn, Netherlands) and IJMU (IJmuiden, Netherlands) as well as the EUREF station DENT (Dentergem, Belgium) were used. The stations are located approximately 110, 55 and 130 km from the experimental setup.
Antenna(mm)Original L1 and IGS ANTEXEl-Corrected L1 and IGS ANTEXAz-el-Corrected L1 and IGS ANTEX
LEIAR25.R3 LEITBias2.202.222.67
RMSE5.145.105.31
TRM55971.00 NONEBias1.721.691.69
RMSE4.684.664.66
Trimble GA530Bias1.411.550.94
RMSE4.084.133.91
Trimble AV 28 (rectangular bracket)Bias−5.082.260.75
RMSE7.585.965.42
Trimble AV 28 (circular plane)Bias3.383.852.89
RMSE5.275.564.90
U-blox ANN-MB-00 (rectangular bracket)Bias−6.02−0.36−1.84
RMSE7.344.164.44
U-blox ANN-MB-00 (circular plane)Bias−0.400.22−0.78
RMSE4.234.194.28

