An Interaction Methodology to Collect and Assess User-Driven Requirements to Define Potential Opportunities of Future Hyperspectral Imaging Sentinel Mission

 ,
,  , and
, and
Abstract
:
1. Introduction
- The management of natural and anthropic risks (e.g., hydrological and geological risk, volcanic risk, effects of climate change, and pollution of water resources);
- The monitoring and management of agricultural, water resources, and forestry resources (e.g., areas covered by fire, desertification, soil pollution, habitat monitoring);
- The control of human activities (e.g., mineral resources, urbanization, and cultural heritage).
- the identification of the users and stakeholders to be involved in the requirement collection;
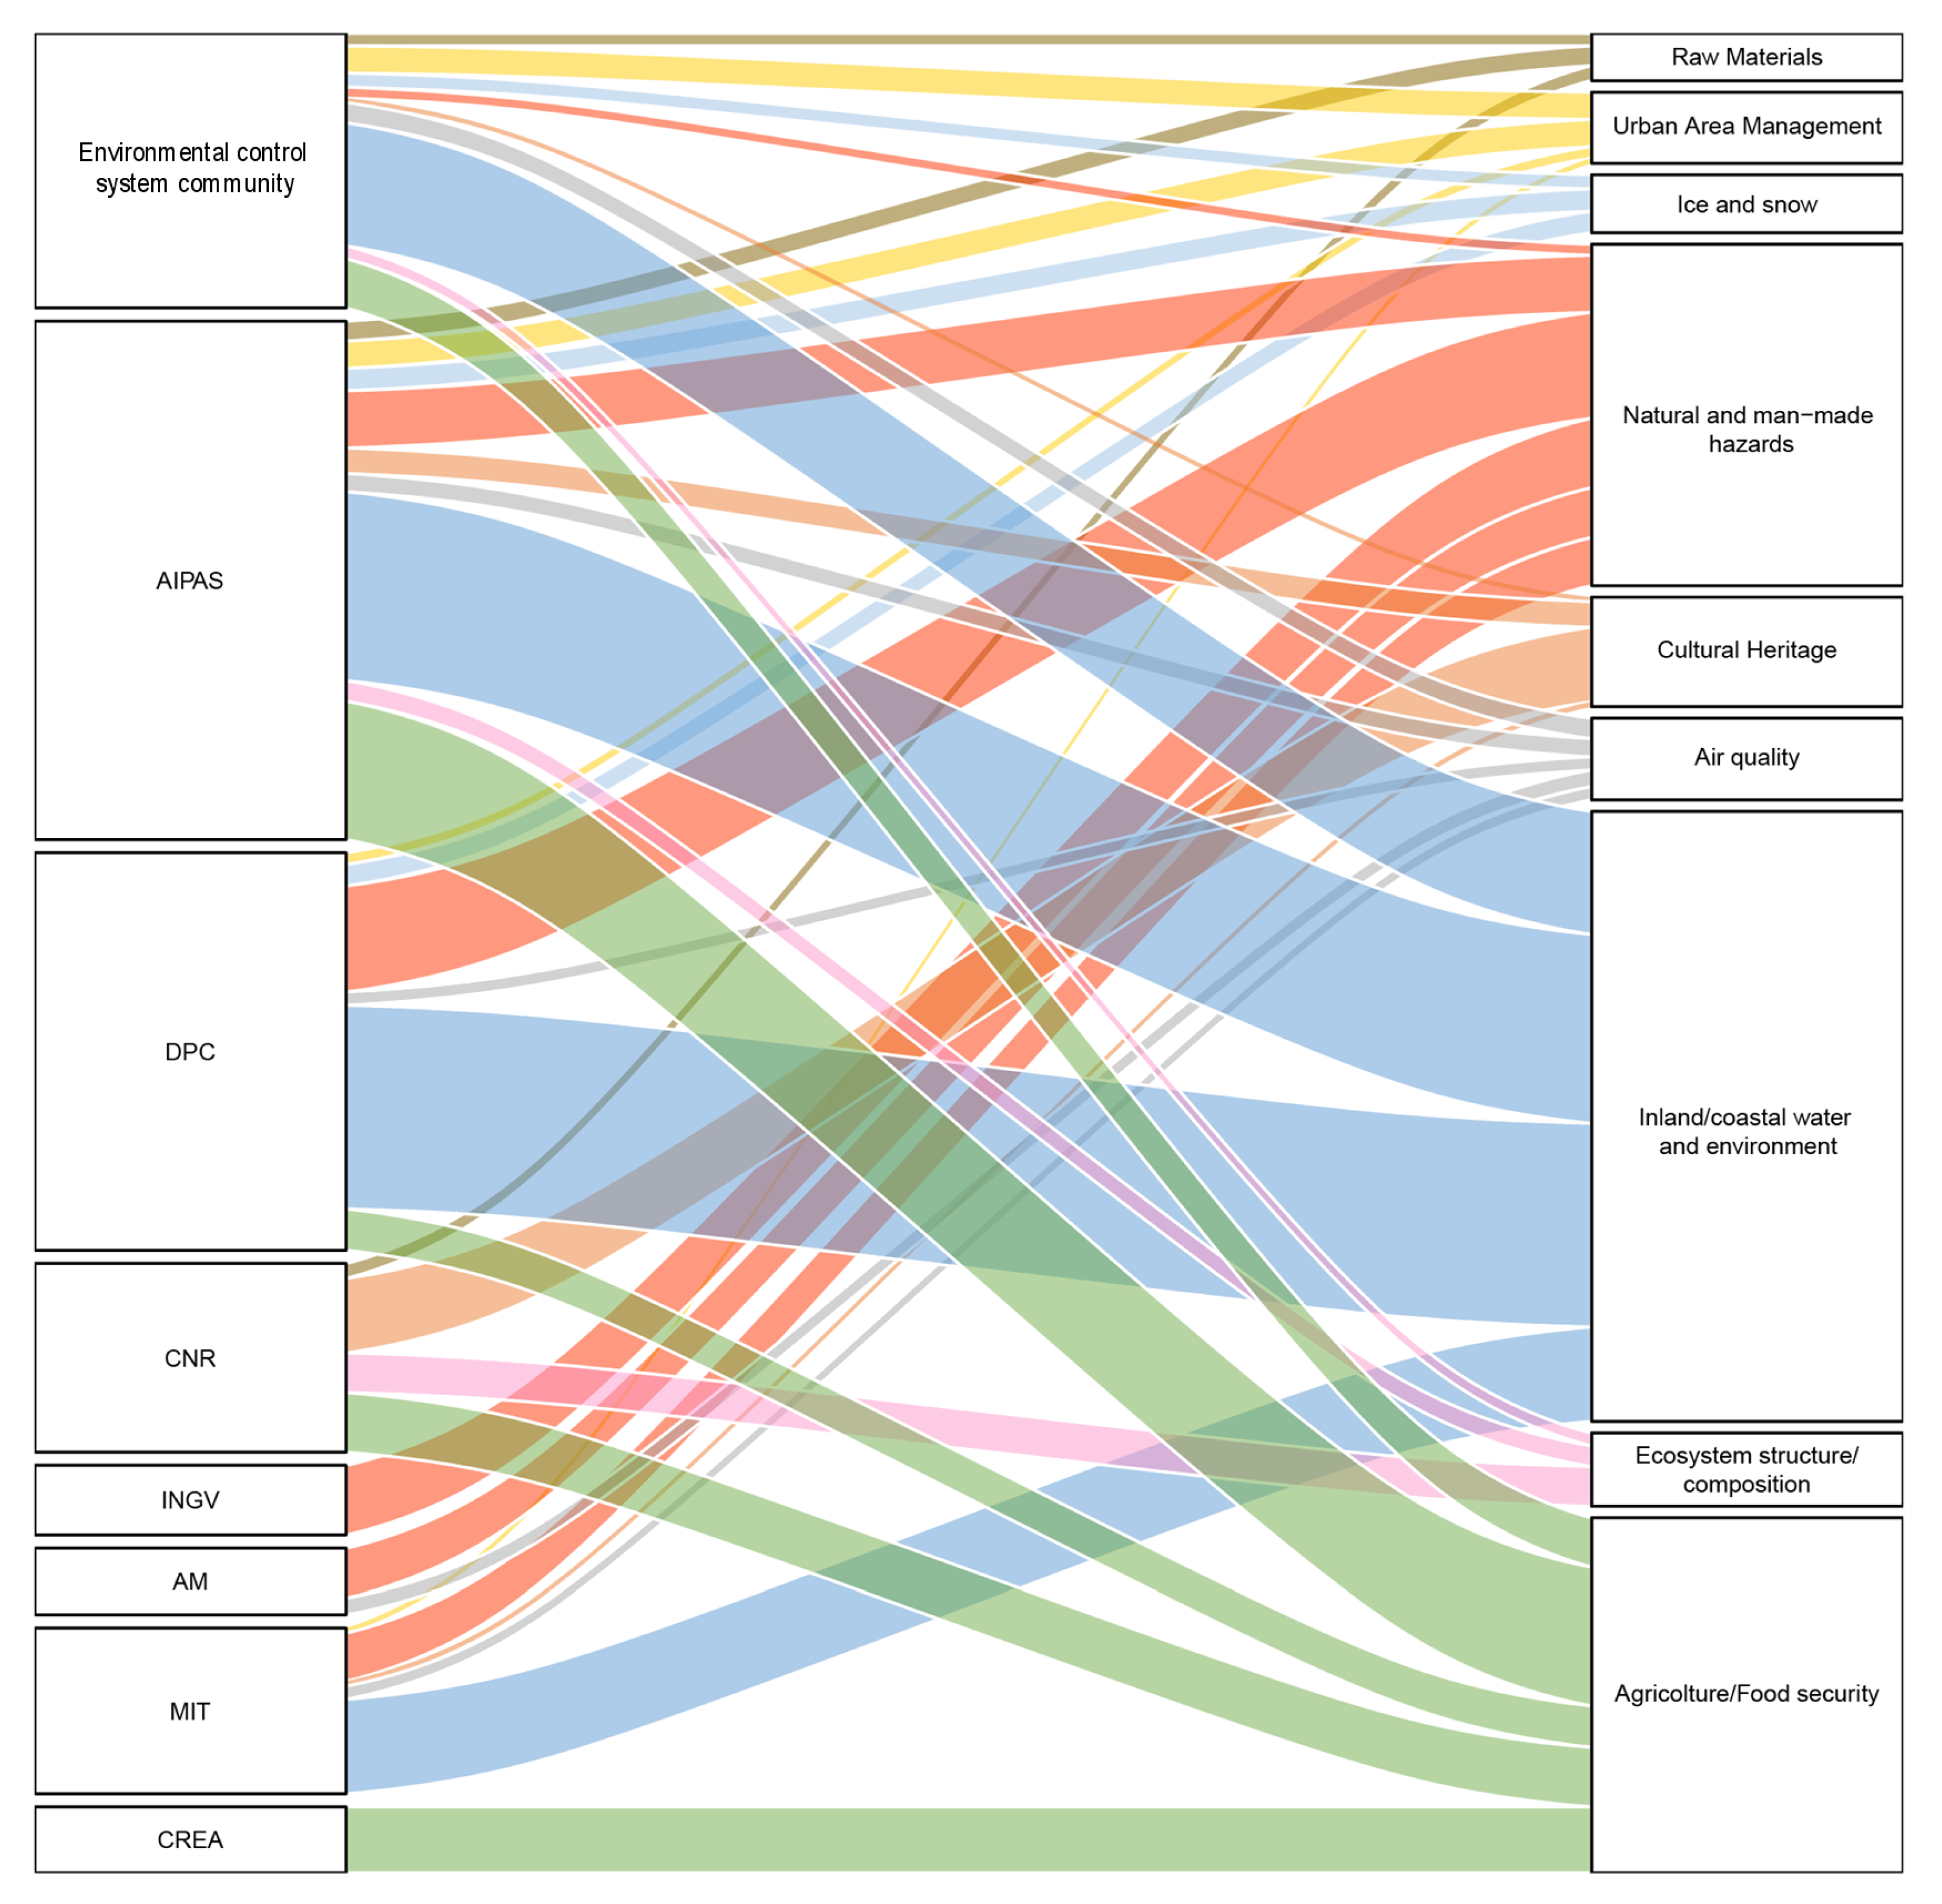
- the analysis of the collected requirements in order to identify the priorities for the different user communities and the preferences on spectral, spatial, and temporal resolutions of possible future products and services;
- the identification of those requirements that are already fulfilled by available products and those for which the development of new products is feasible.
2. Materials and Methods
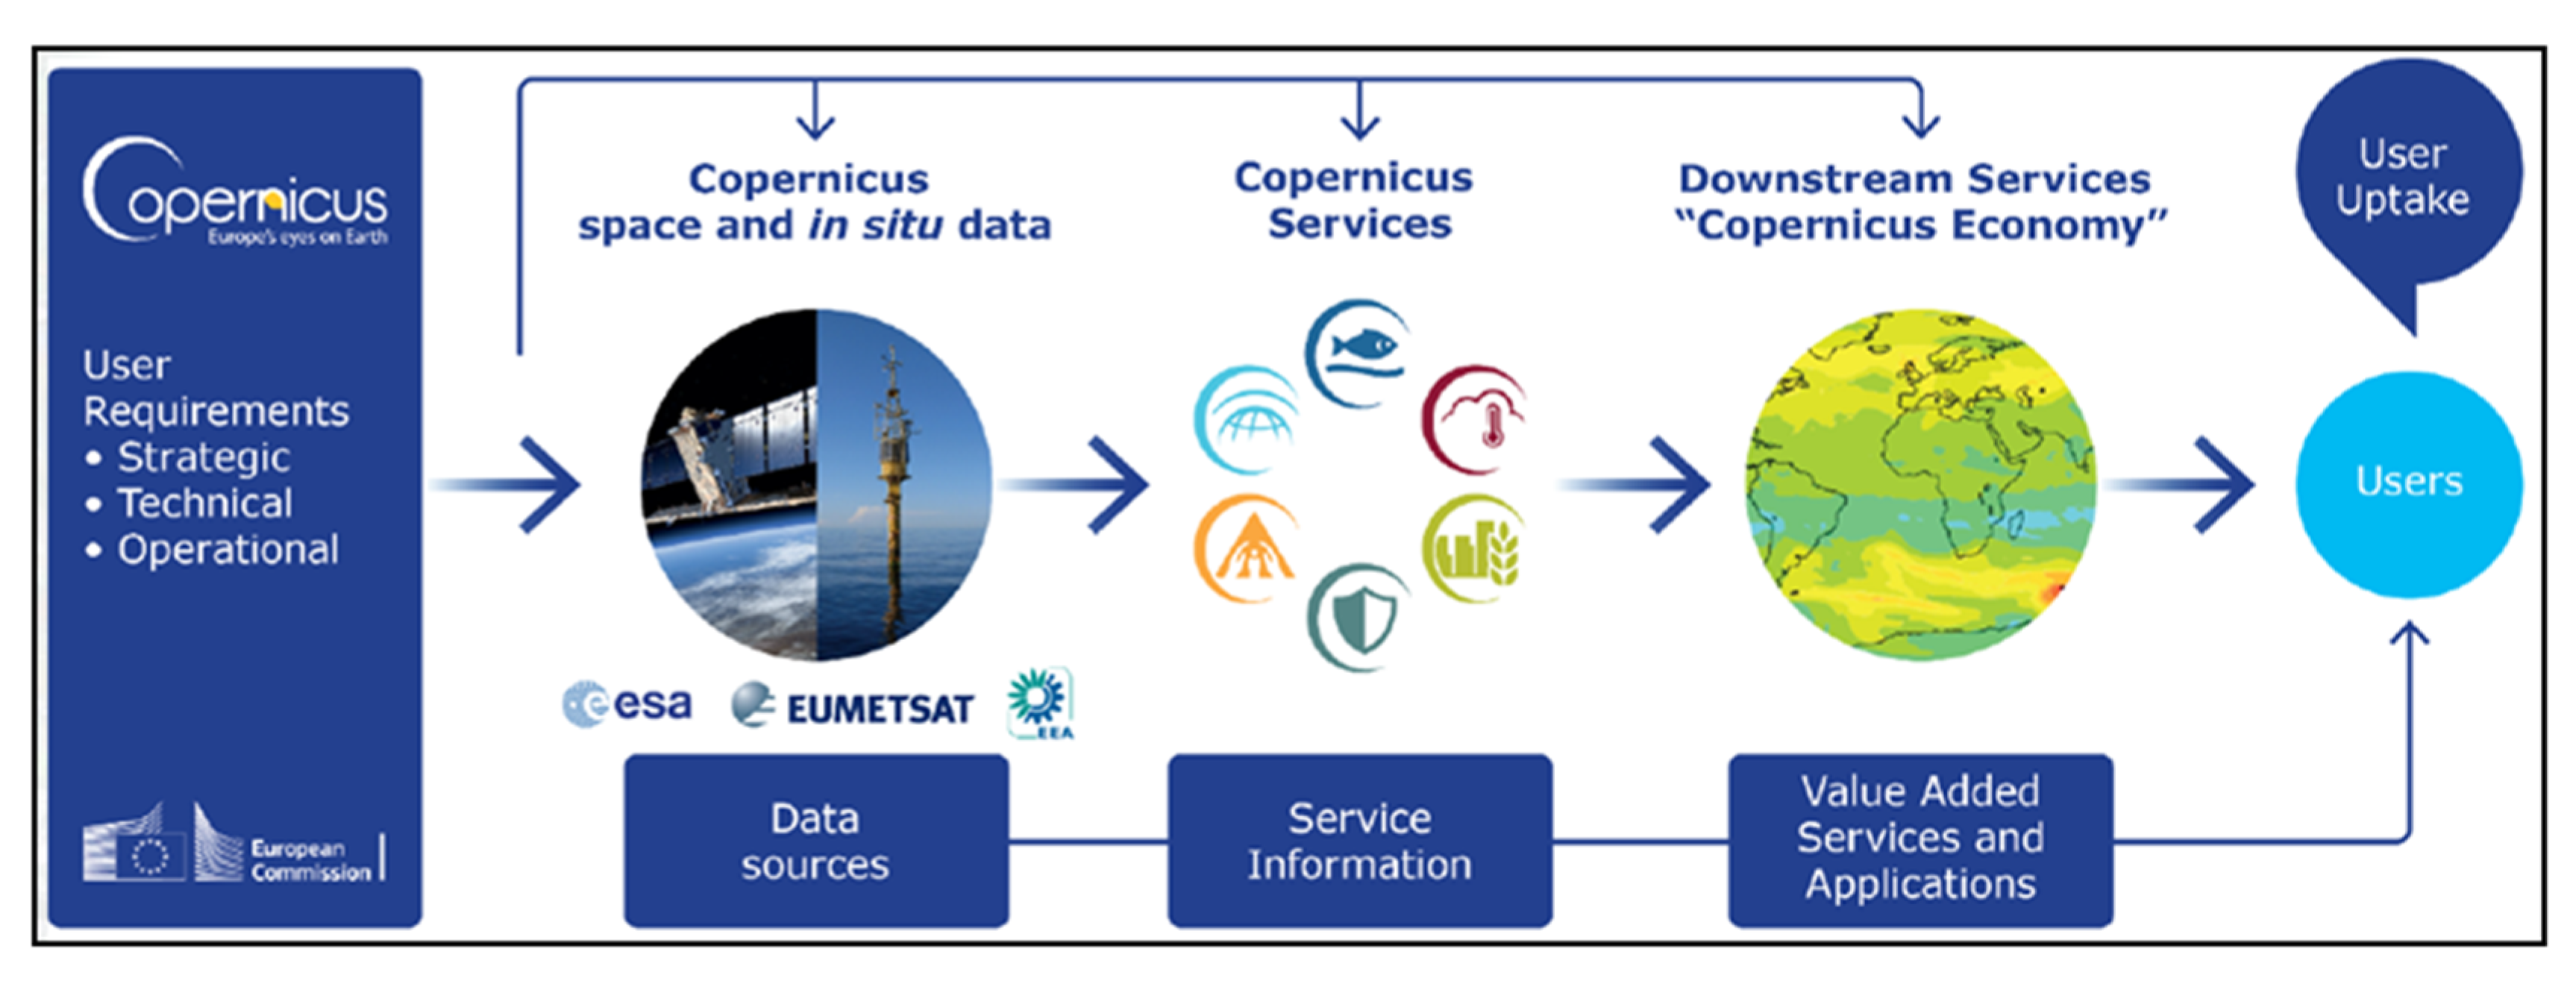
2.1. The Copernicus Programme
- the upstream component that includes in situ measurements (from ground-based stations and airborne sensors) and observation from satellites (Sentinels and Contributing Missions from other space agencies); and
- the services, processing raw data into exploitable information for end users.
2.2. The Hyperspectral Remote Sensing State of the Art
2.3. Methodology: The Interaction Legal Framework
The Interaction Methodology with the User Communities
- A pre-processing phase that consisted of the involvement of the user communities and in the collection of their feedbacks on EU policy, thematic areas of interest, requirements, and parameters by means of an interaction matrix;
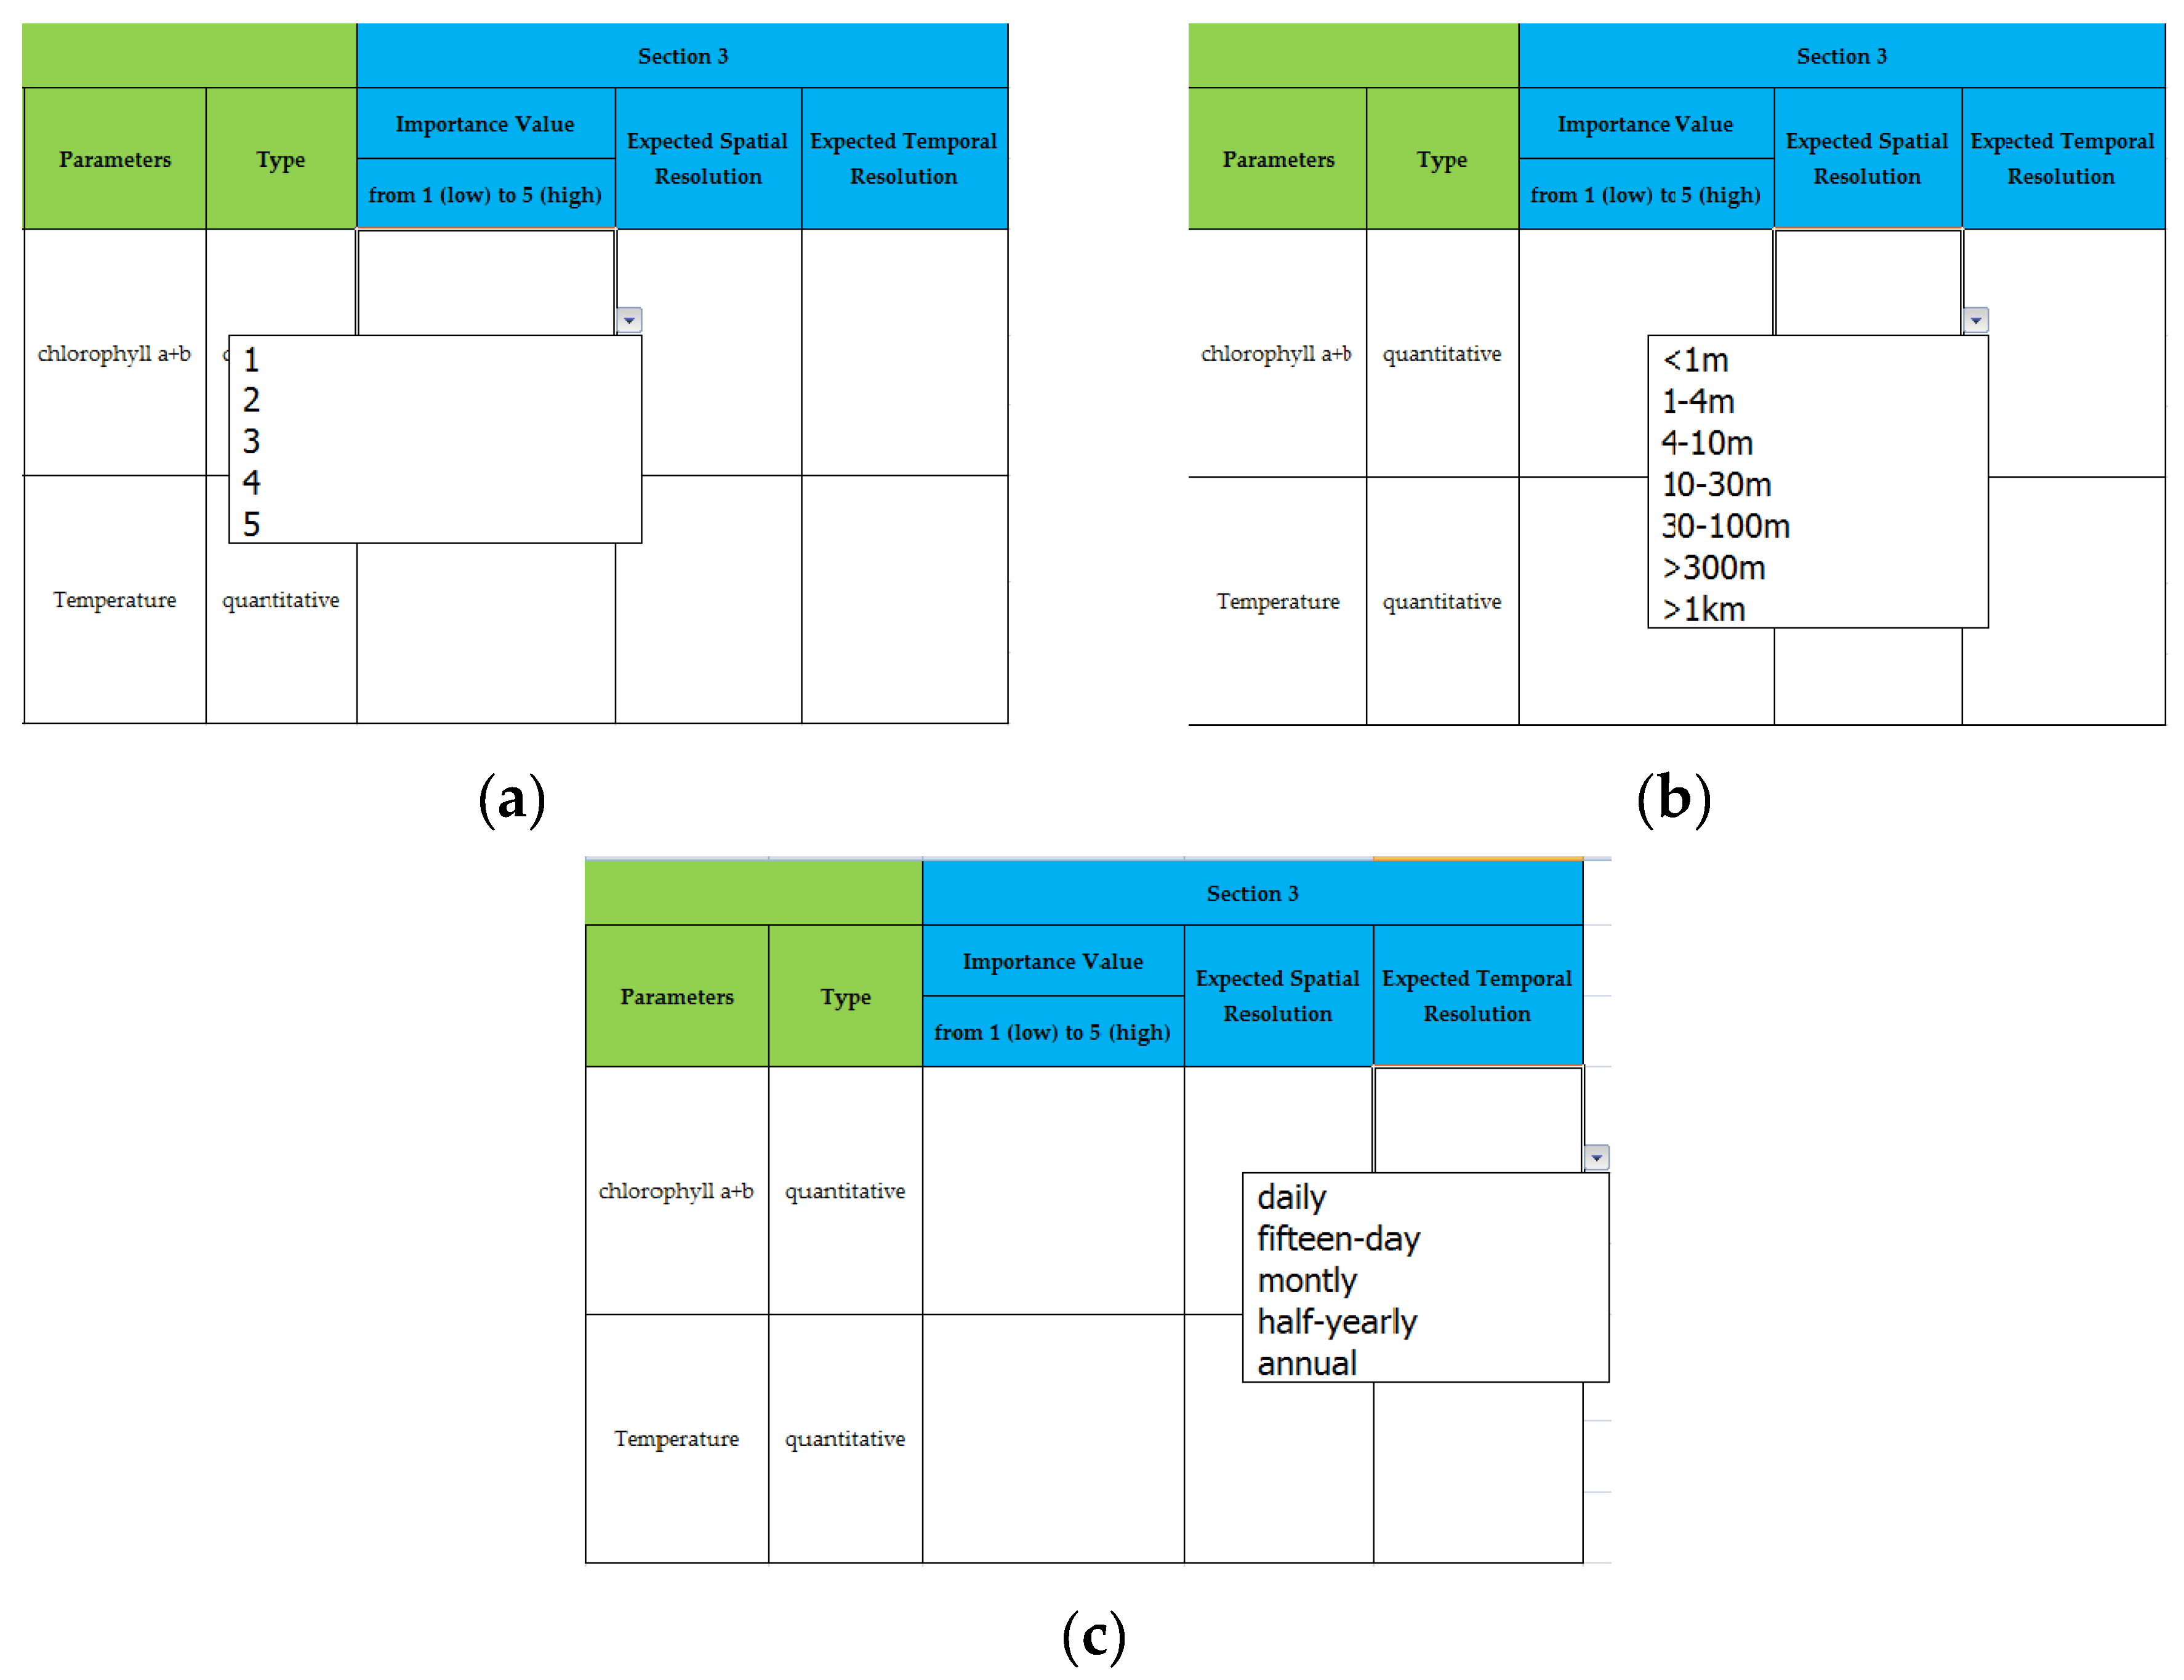
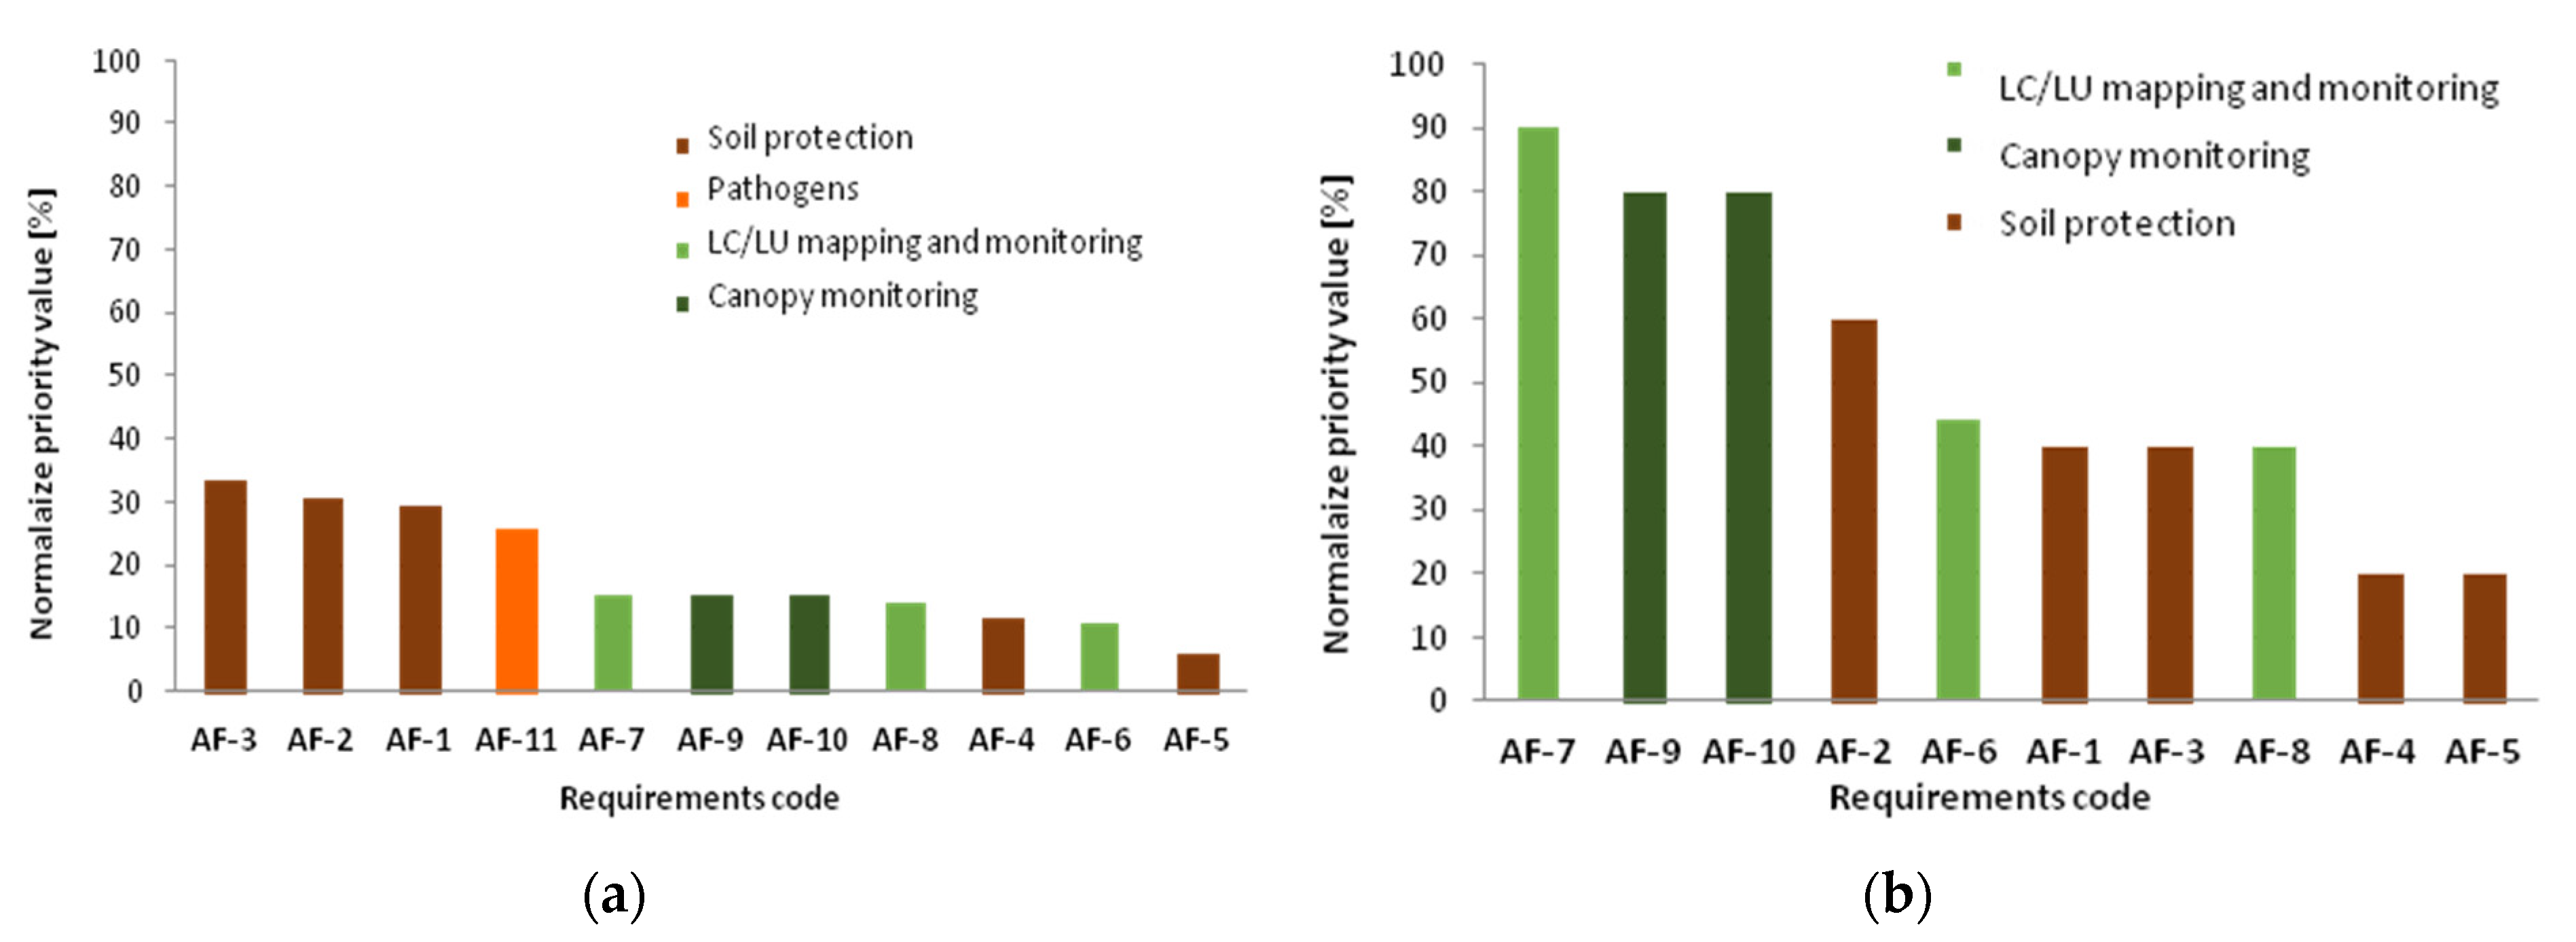
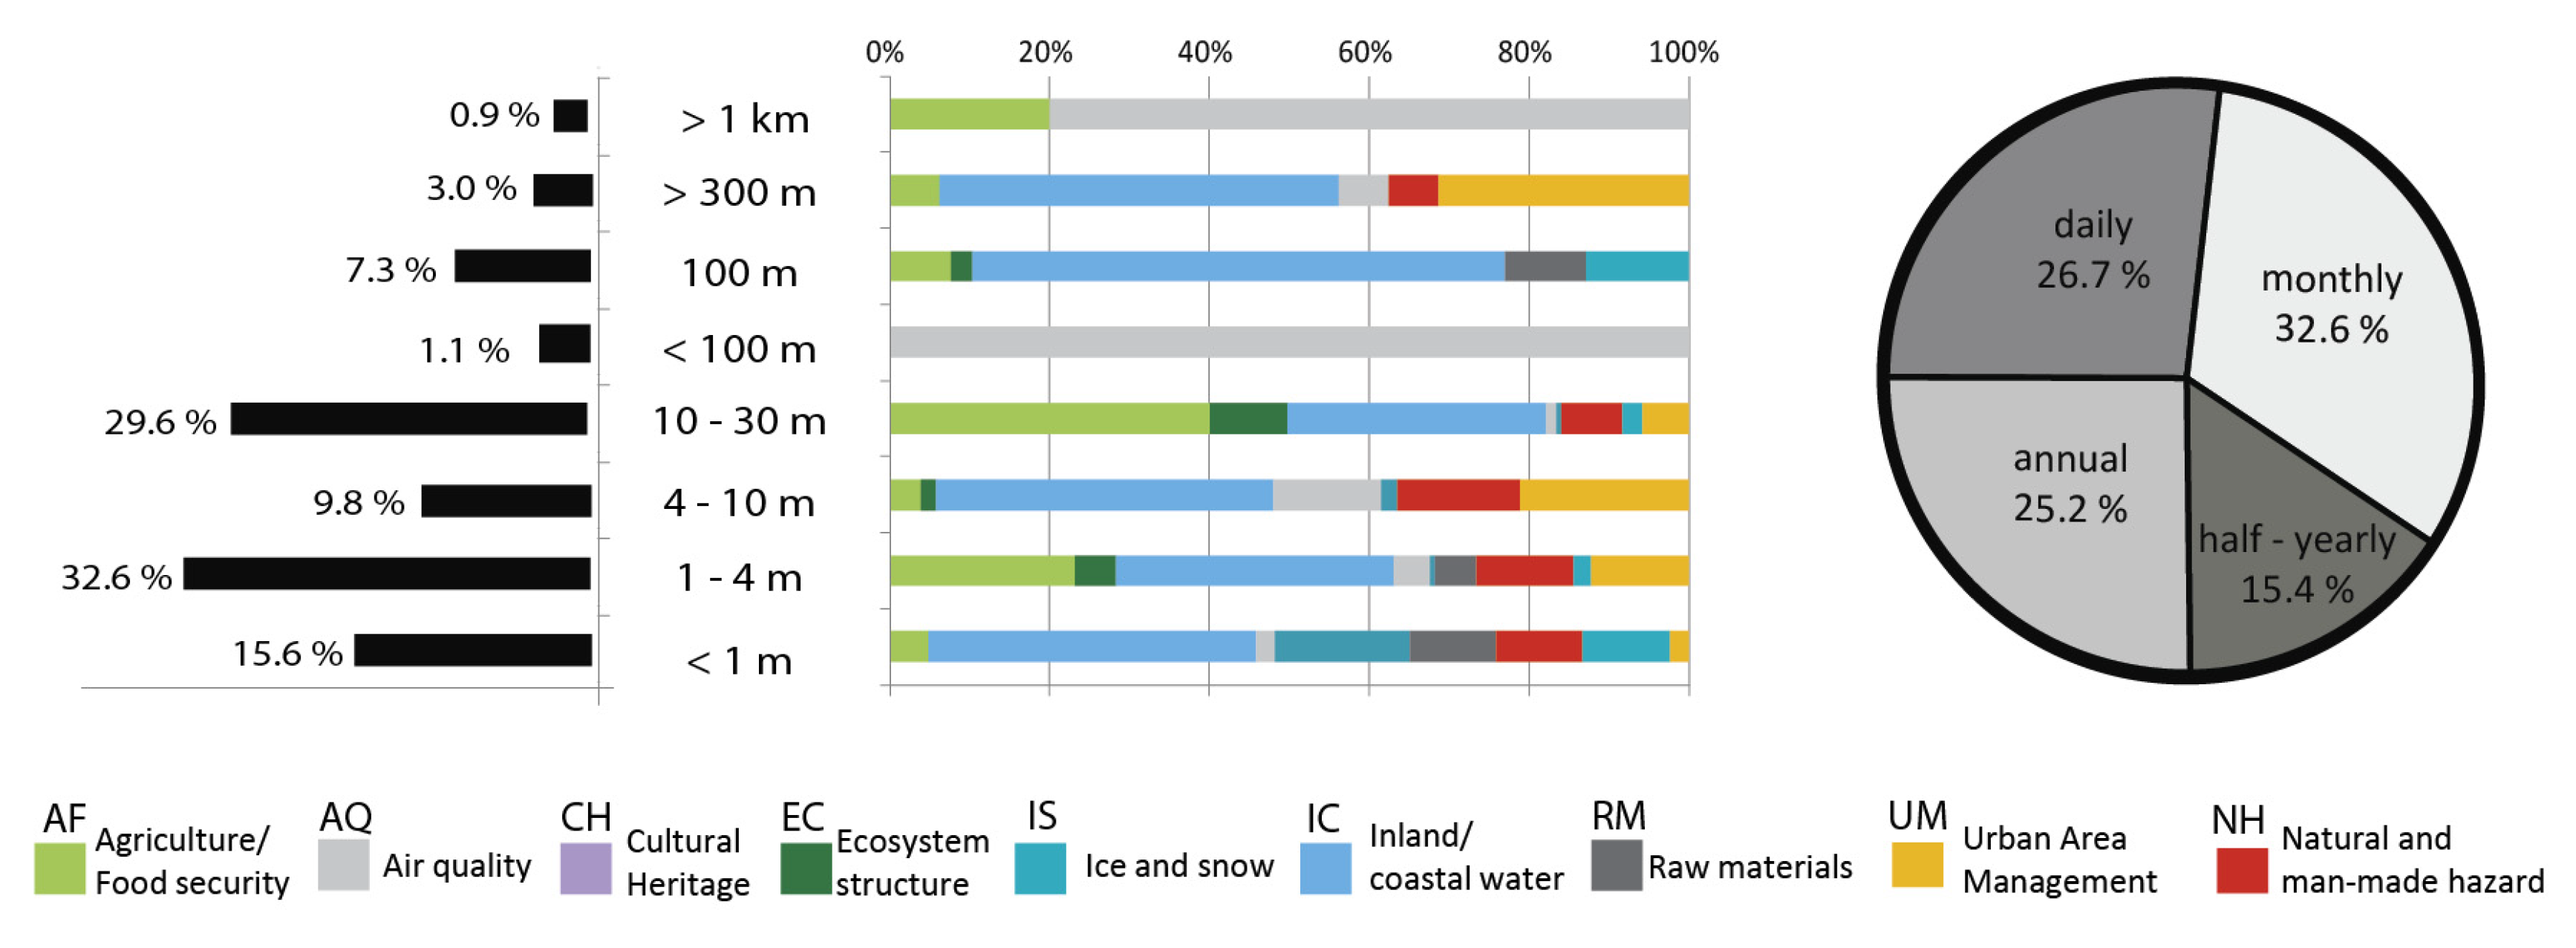
- A processing phase where the feedback from user communities was analyzed in order to prioritize the user interests, identifying a “priority value” for each requirement as a function of an “importance value” that users provided to each parameter (Figure 3a–c);
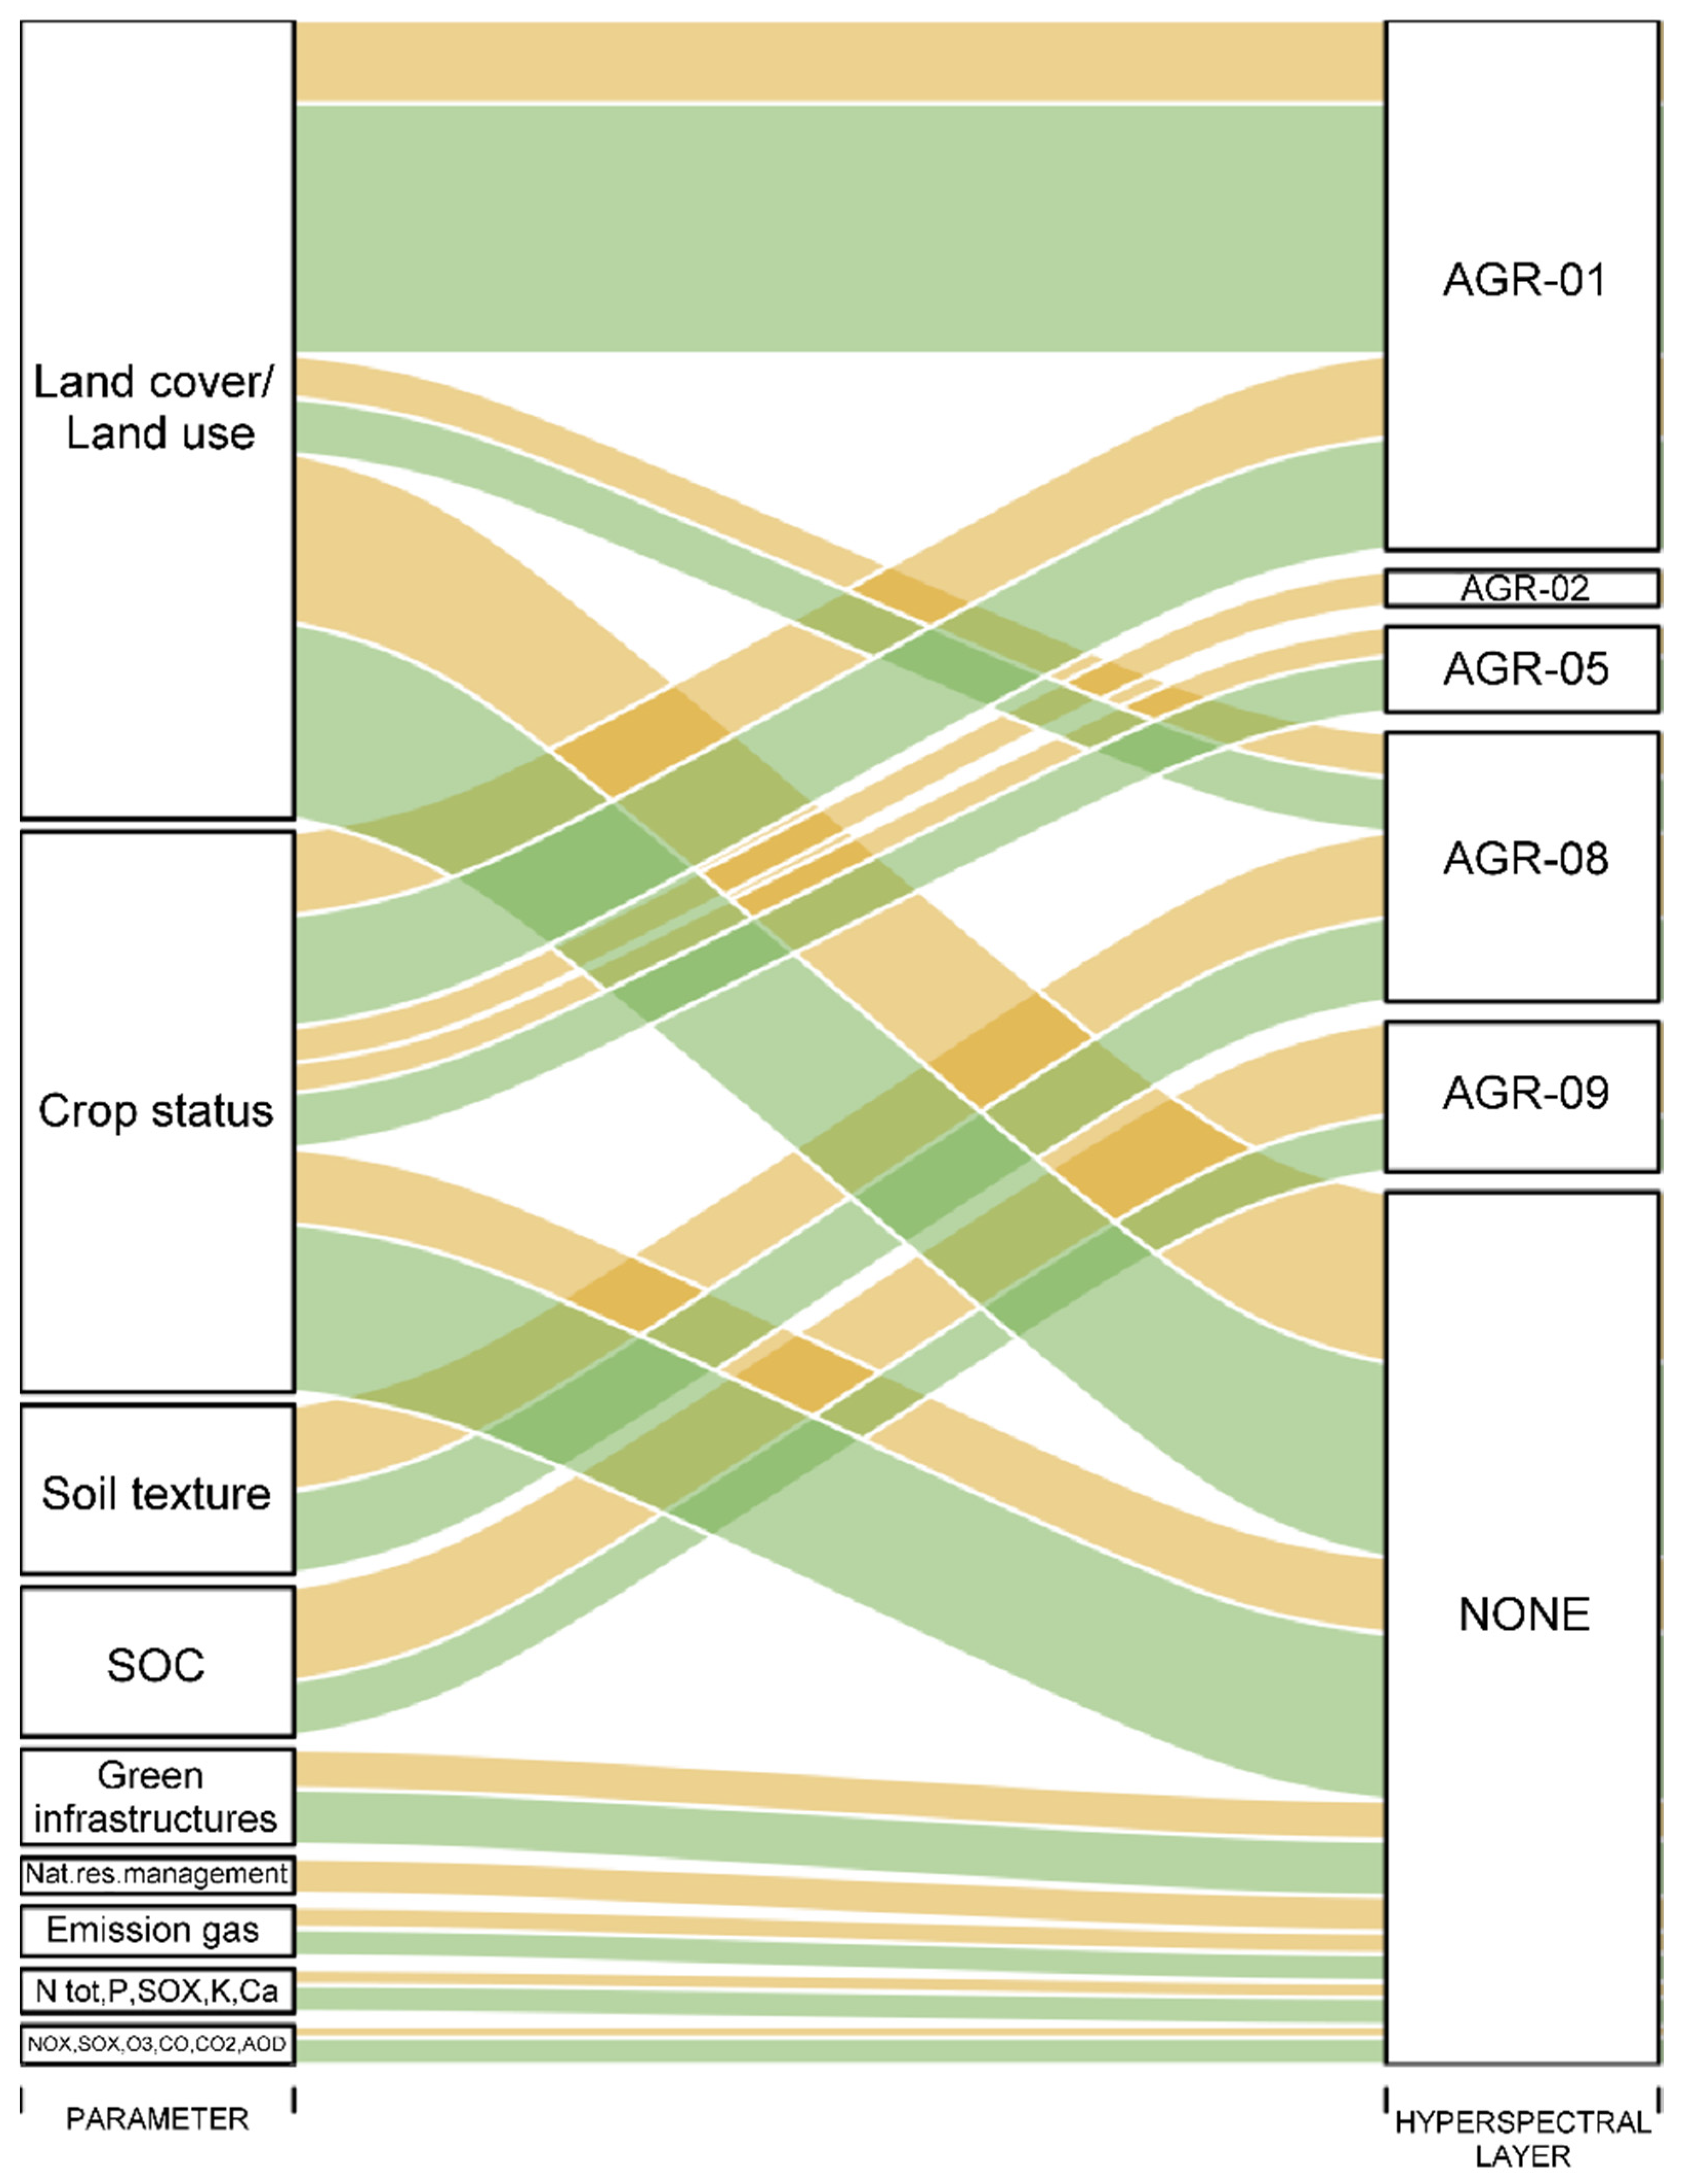
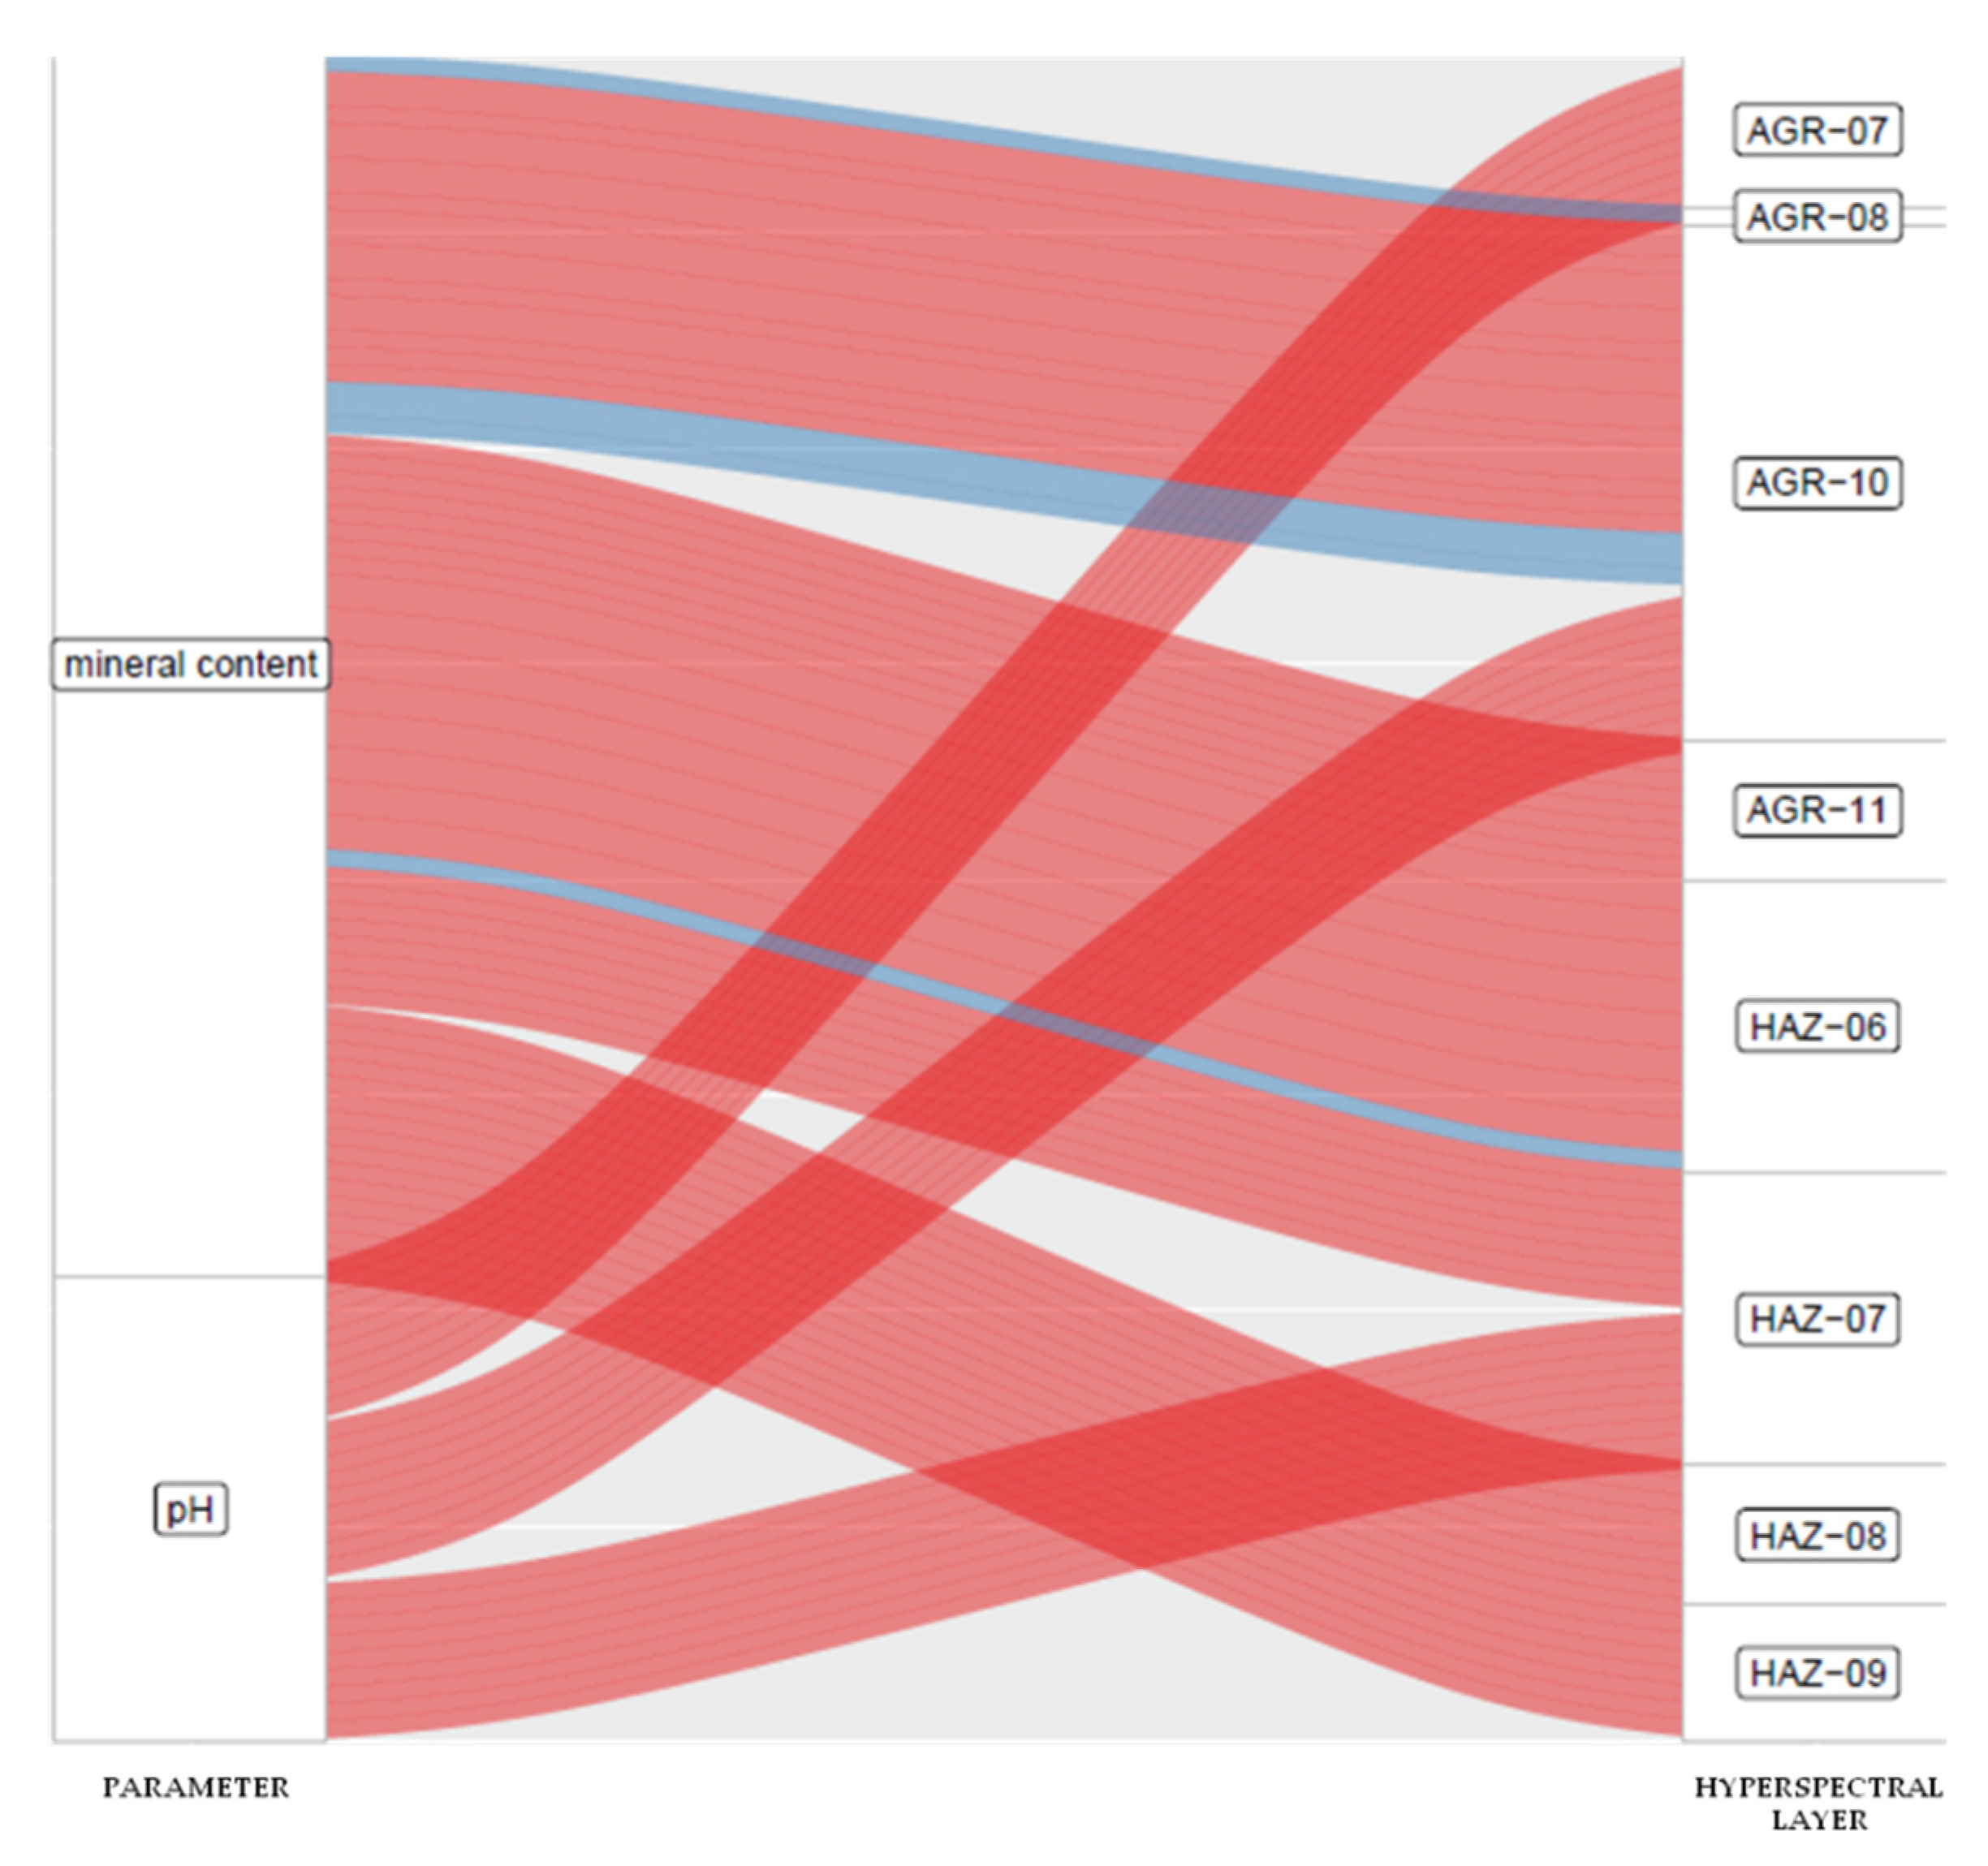
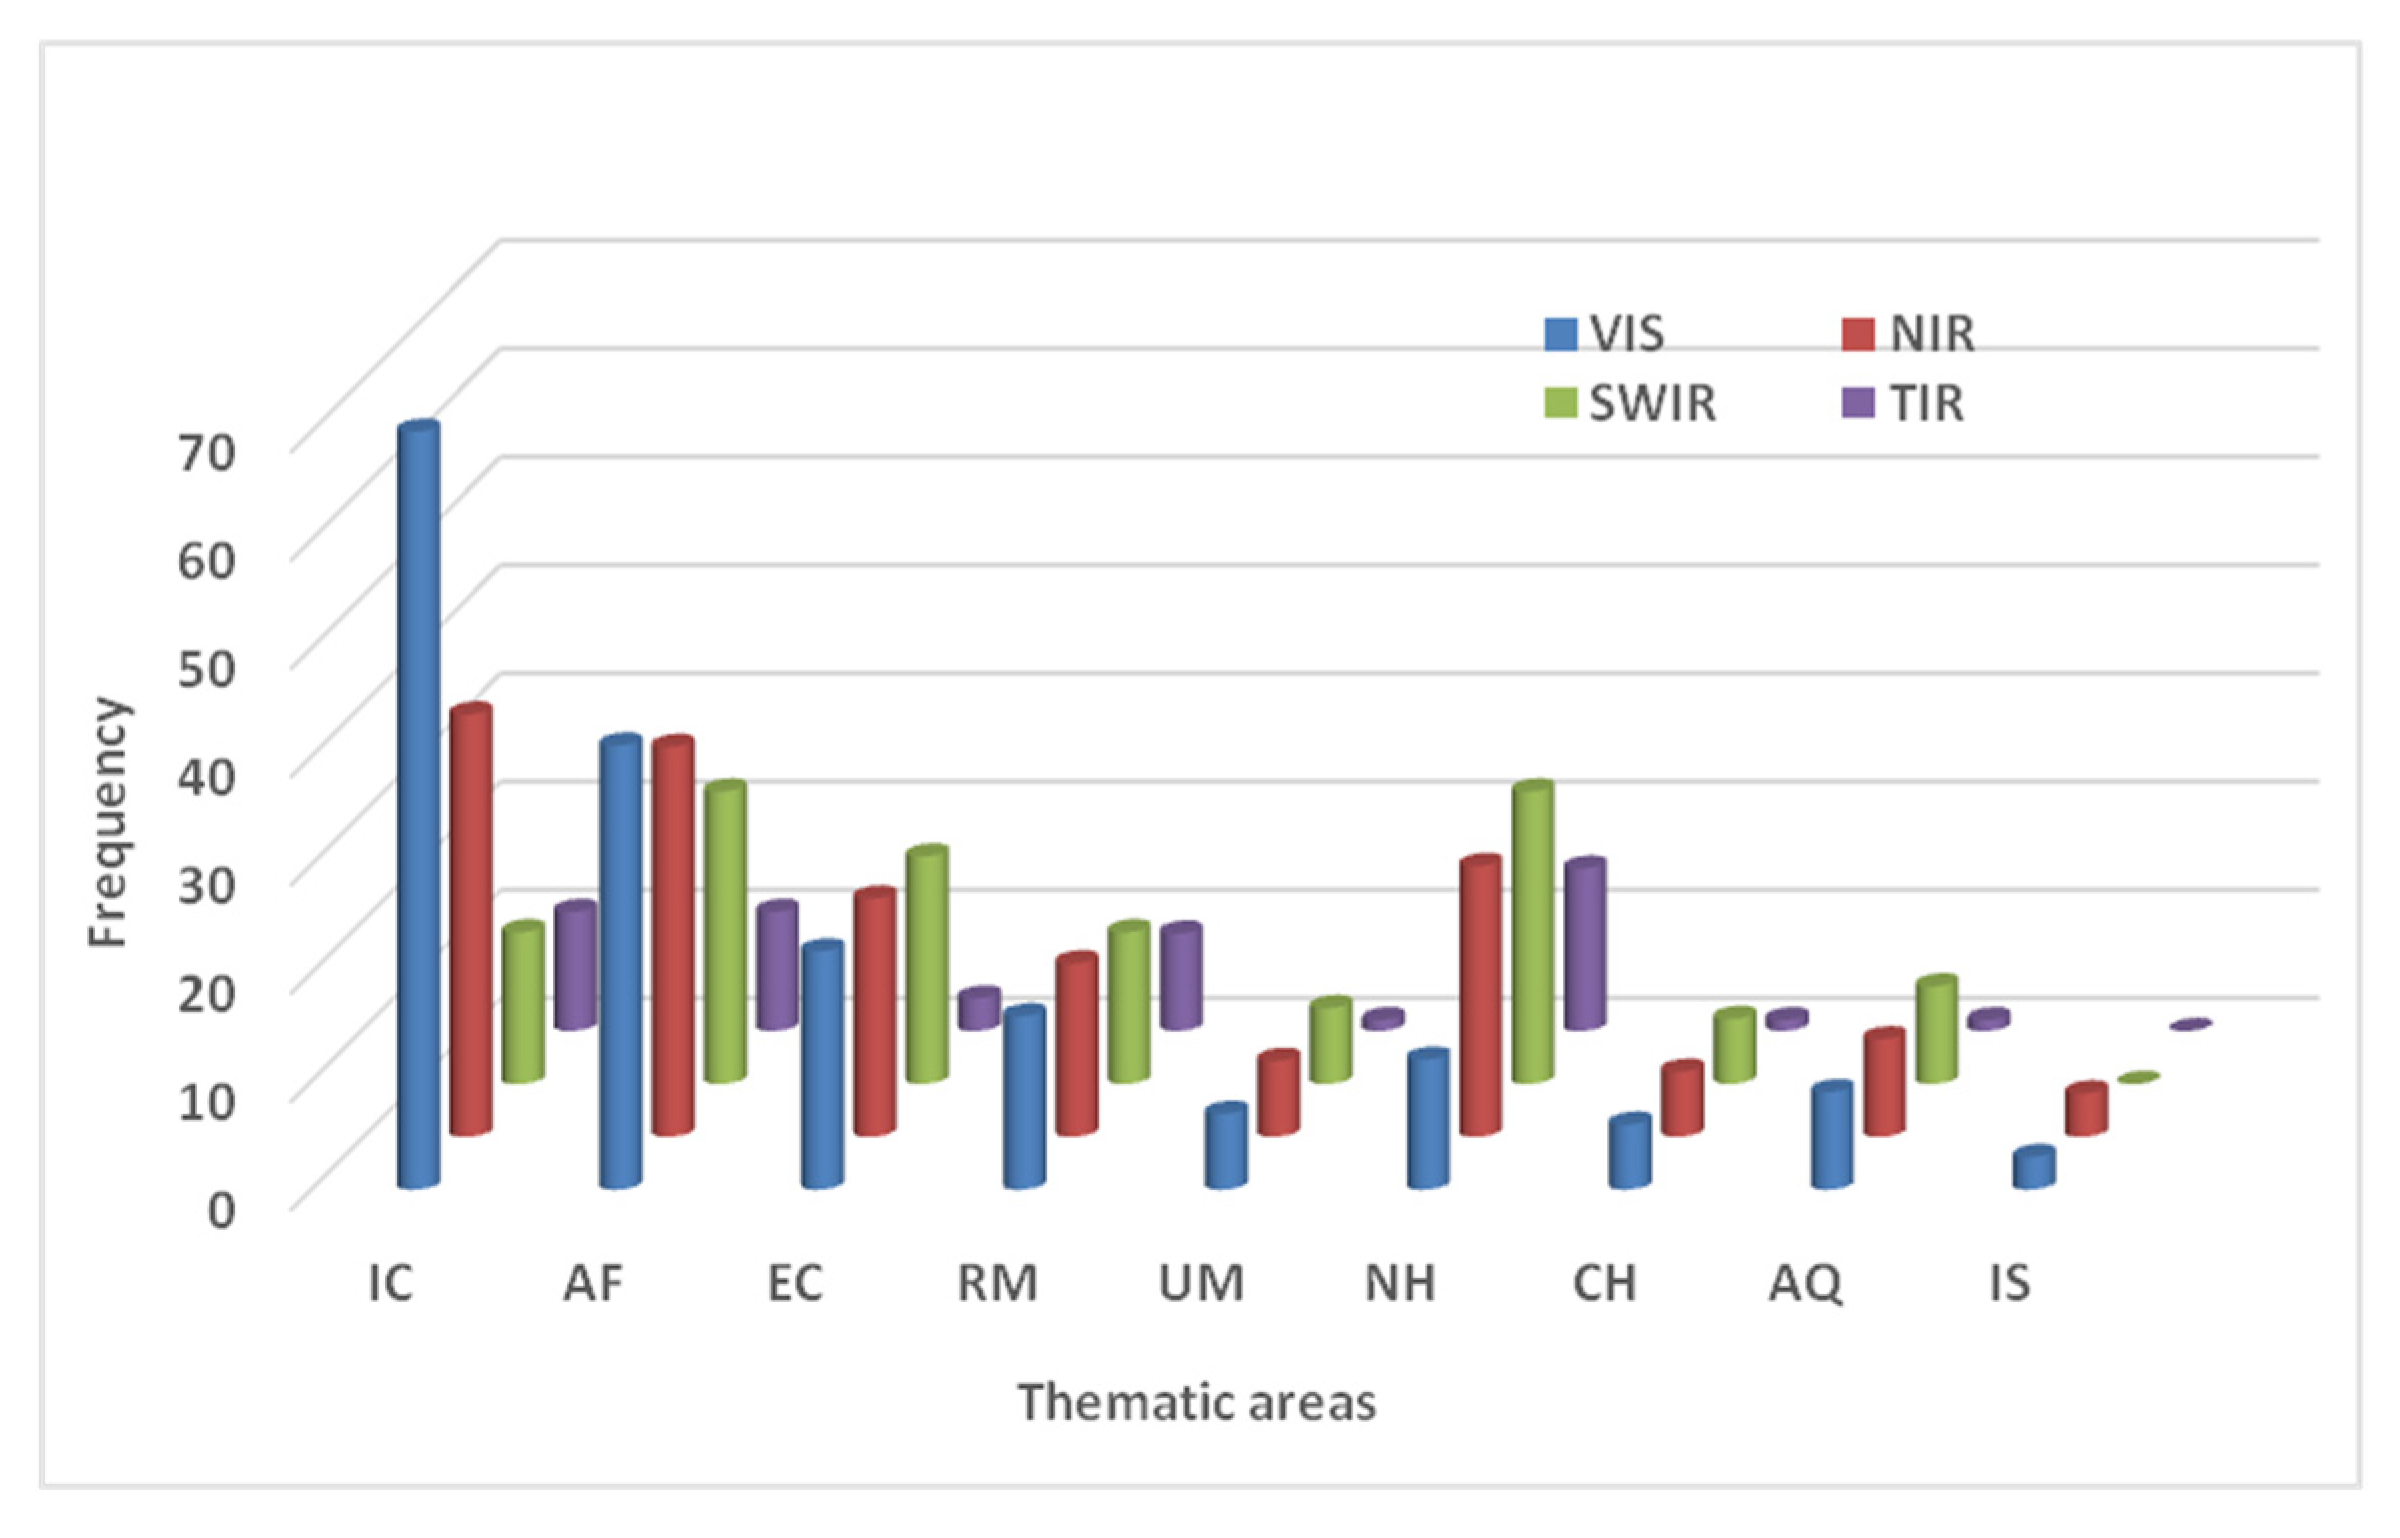
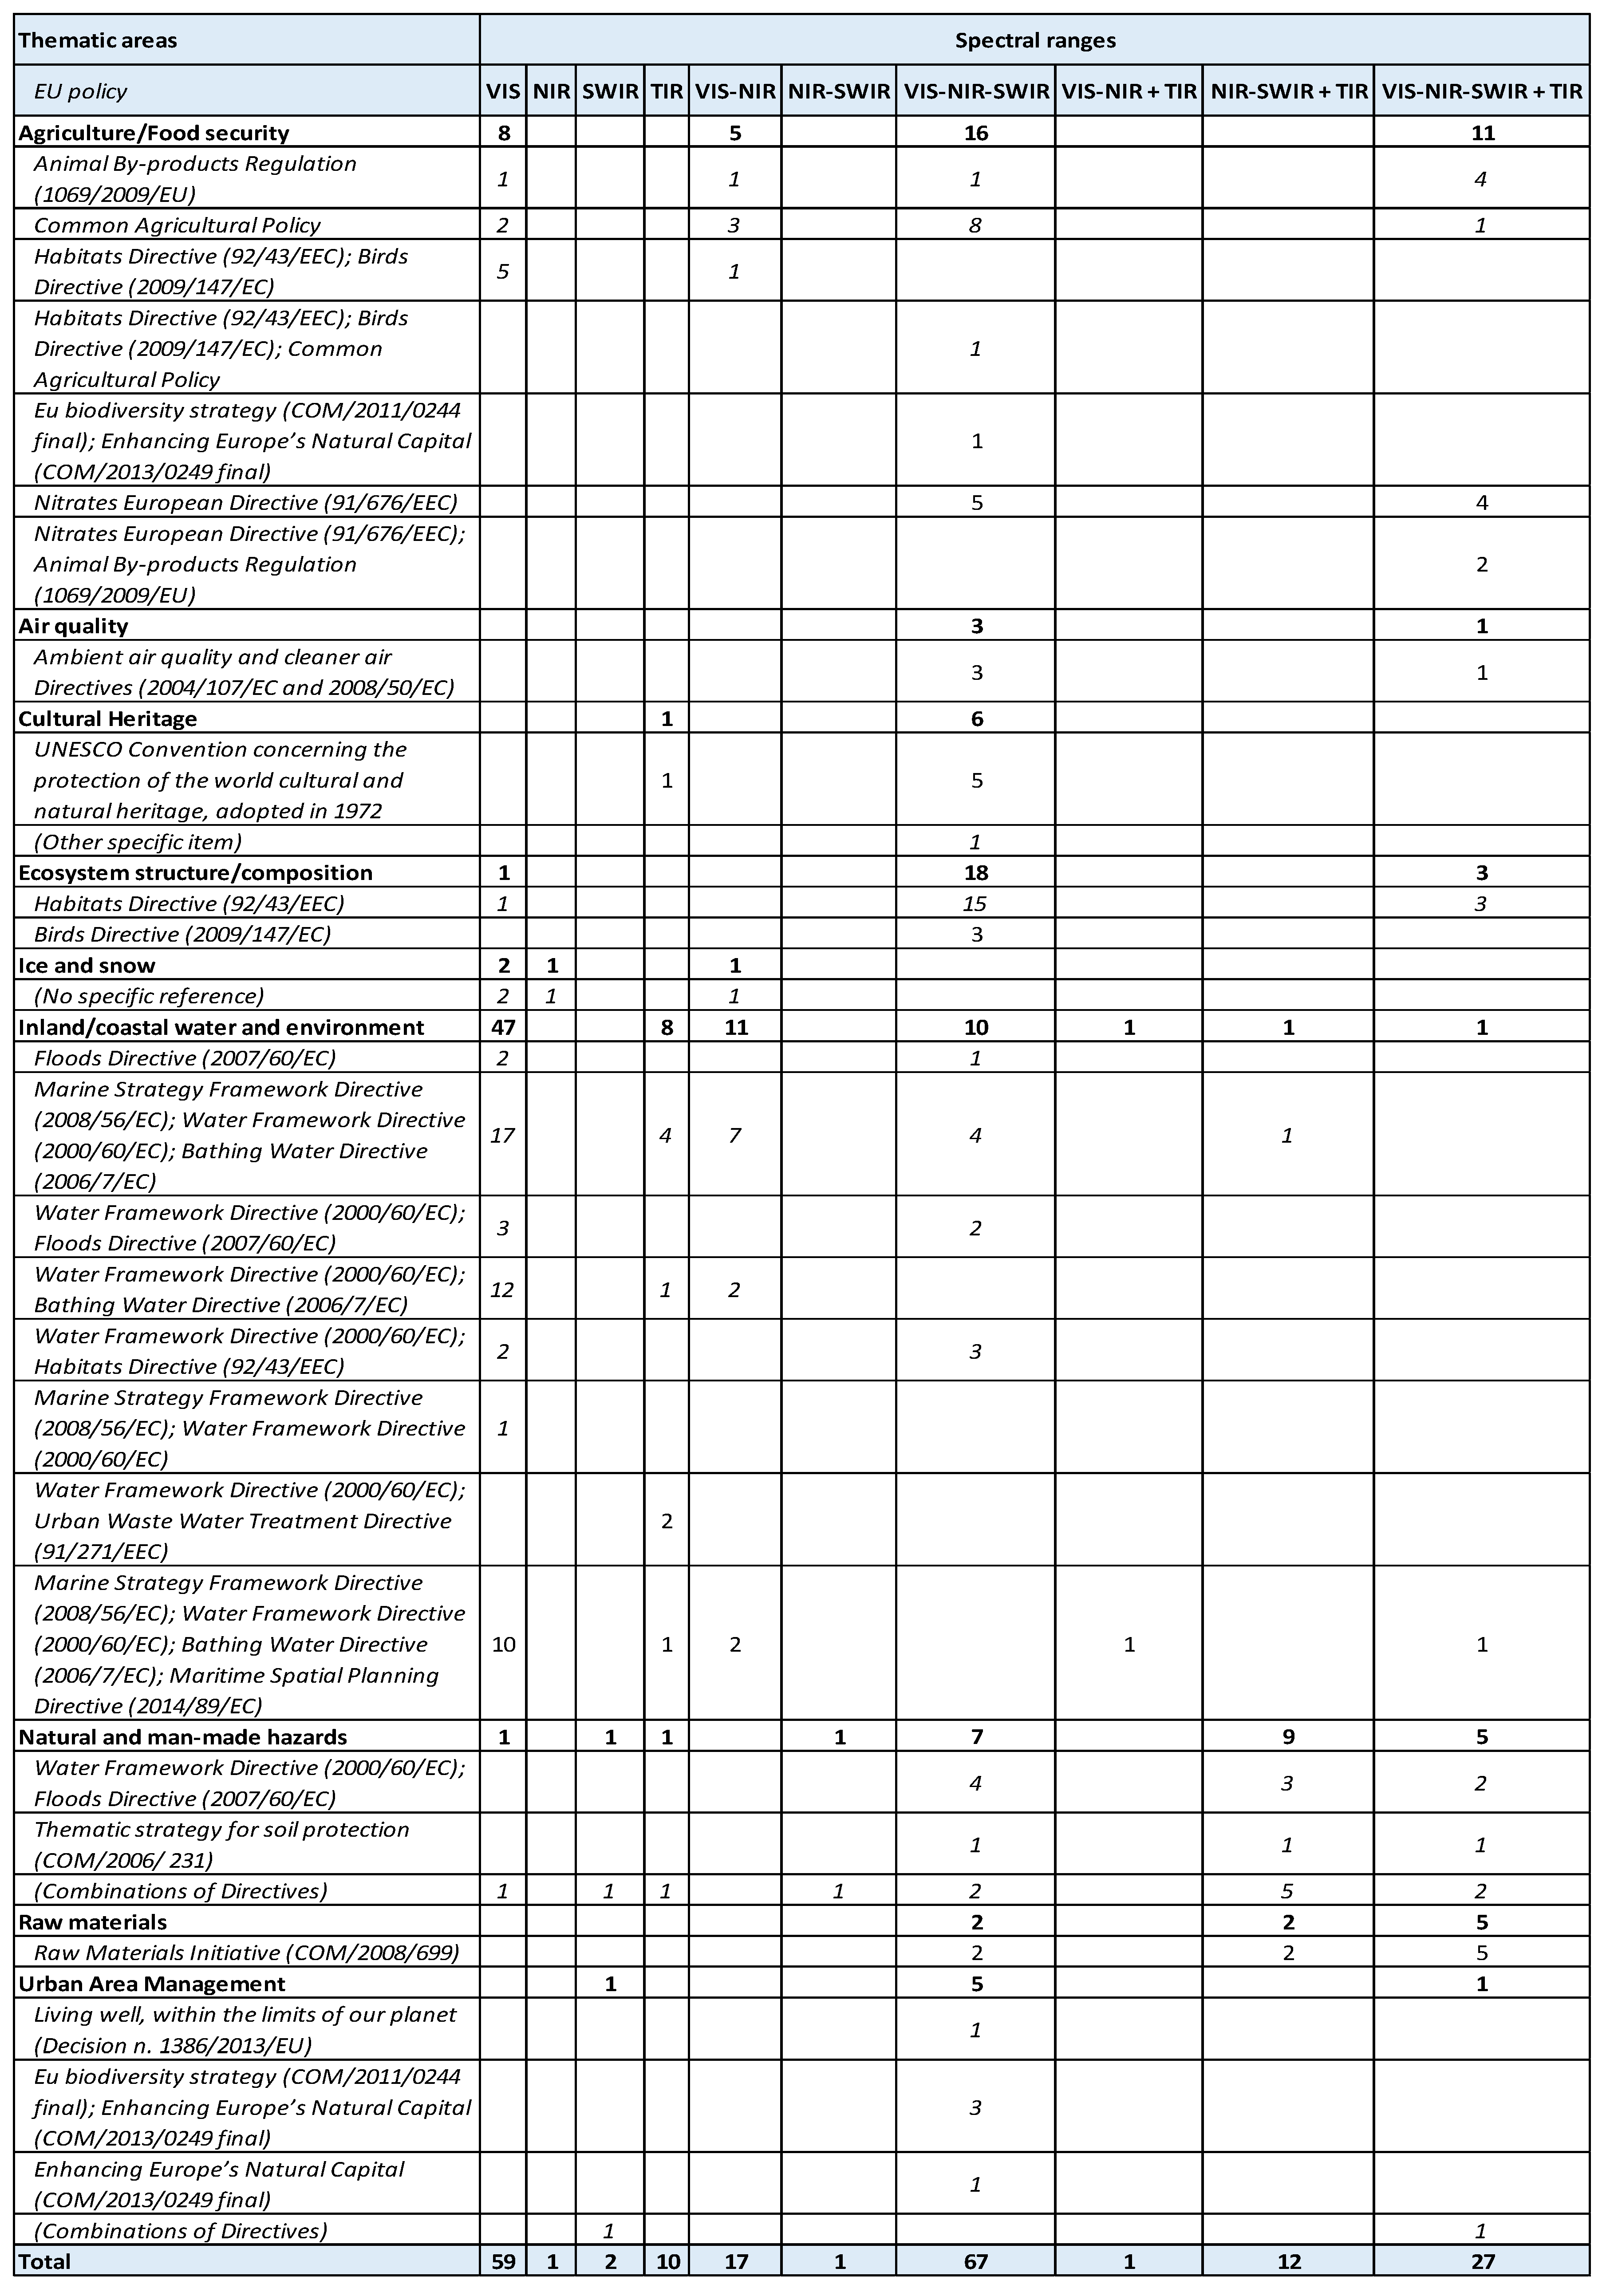
- A post-processing phase in which the assessment of results was used to match the spatial and temporal resolutions required by the user communities with hyperspectral-based products and services (hyperspectral-derived algorithms, hereinafter referred to as “hyperspectral layers”), which were available and already developed at the time of the study. An extensive review of the scientific literature about hyperspectral-derived algorithms was hence conducted to detect suitable layers for the identified user requirements. Moreover this match highlighted the number of times a particular spectral range was present in those products and services achieving user needs.
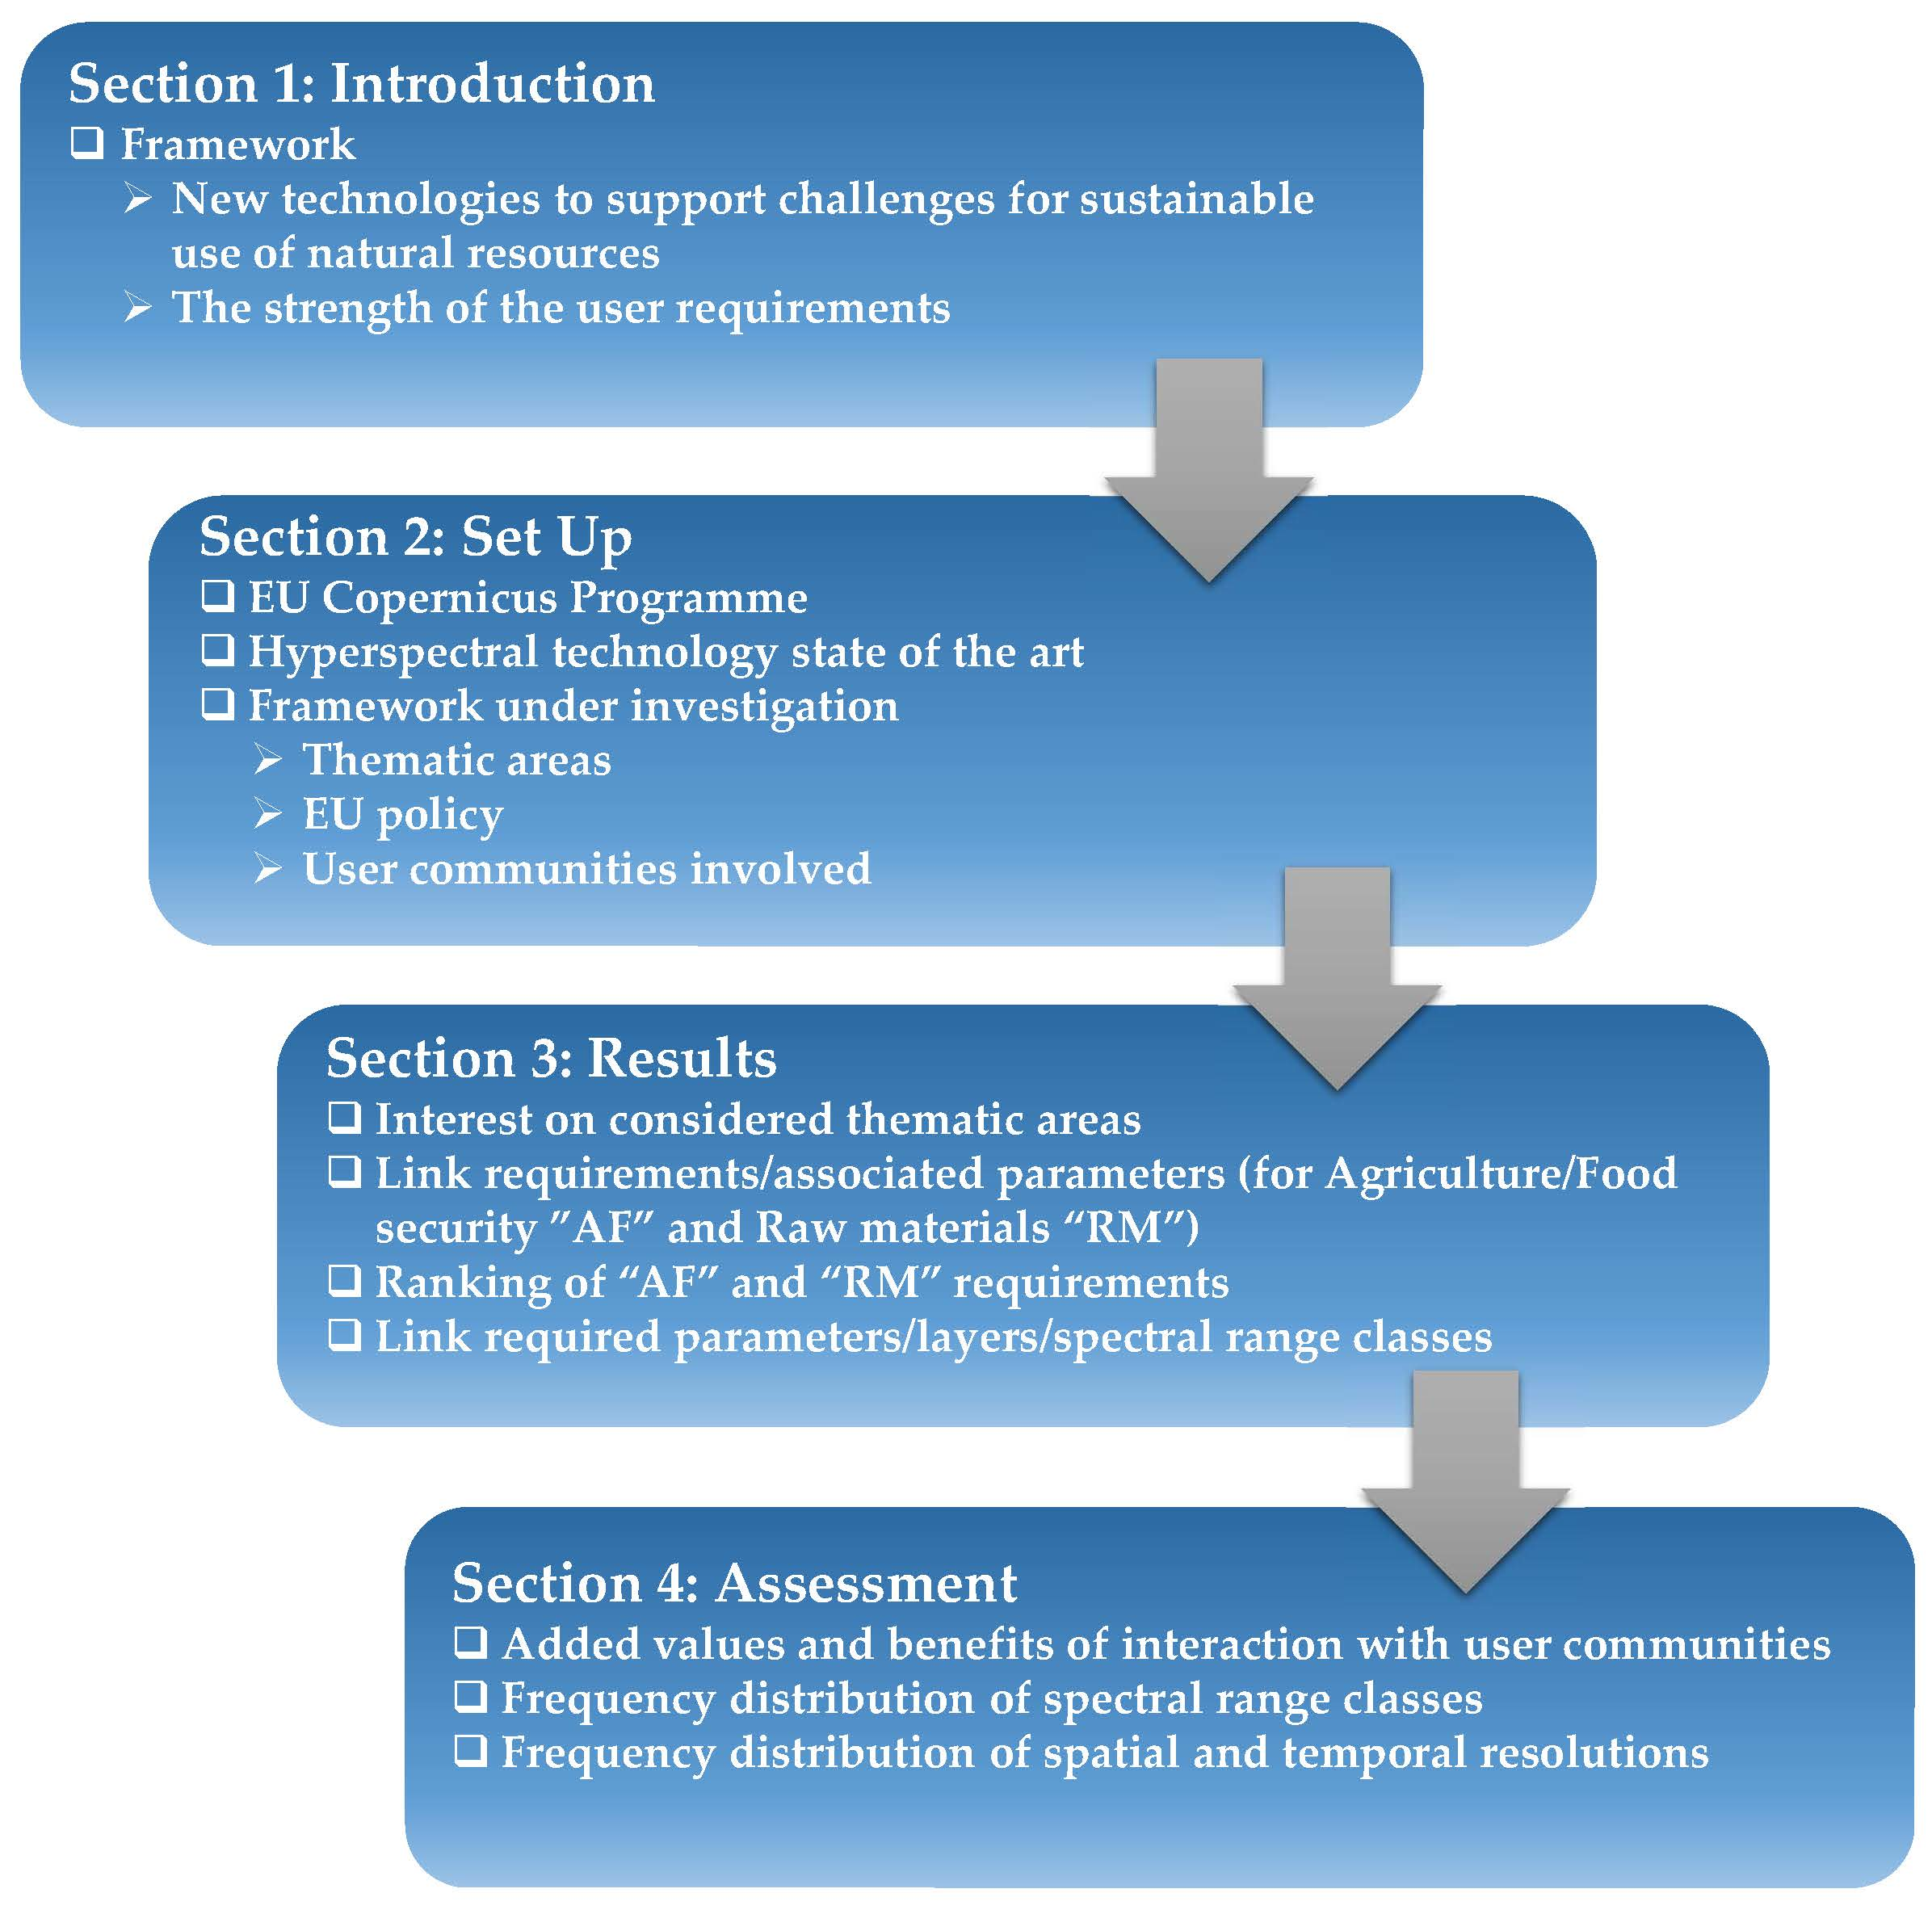
- Section 1 includes information on thematic areas and policy framework (i.e.; the specific objects of the EU policy for each linked thematic area);
3. Results
4. Discussion
5. Conclusions
Author Contributions
Funding
Acknowledgments
Conflicts of Interest
Appendix A

| Code | Requirement | Associated Parameters (EU Policy) |
|---|---|---|
| AF-1 | Mapping of the soil physical degradation, including the soil condition and erosional | land cover/land use (acc. Dir. 91/676/EEC) |
| land cover/land use (acc. Reg. 1306/2013/EU) | ||
| AF-2 | Estimation of soil texture in agricultural fields (when without cultivation), i.e. the particle-size distribution of mineral soil fraction expressed as the relative proportions of clay, sand, and silt | soil texture (acc. Dir. 91/676/EEC) |
| soil texture (acc. Reg. 1306/2013/EU) | ||
| AF-3 | Estimation and mapping of soil organic carbon (SOC) in agricultural fields as input for simulation models of crops, hydrological and hydrogeological models | SOC (acc. Dir. 91/676/EEC) |
| SOC (acc. Reg. 1306/2013/EU) | ||
| AF-4 | Support to identify chemical compounds presence (e.g., N tot, P SOX, K, Ca) in agriculture fertilizer | N tot, P SOX, K, Ca |
| AF-5 | Support to identify specific gases presence (e.g., ammonia) emitted by manure through absorption bands detection on parcels | NOX, SOX, O3, CO, AOD |
| emission gas | ||
| AF-6 | Agriculture practices risk mapping to study the diverse extents, shapes, and connectivity levels of heterogeneous pattern systems in agriculture, in relationship to human impacts | land cover/land use (acc. Dir. 91/676/EEC) |
| crop status (acc. Dir. 91/676/EEC) | ||
| land cover/land use (acc. Reg. 1306/2013/EU) | ||
| crop status (acc. Reg. 1306/2013/EU) | ||
| land cover/land use (acc. Reg. 1306/2013/EU) | ||
| AF-7 | Mapping and monitoring of land-use/land-cover types and changes | land cover/land use – vegetation (acc. Reg. 1306/2013/EU) |
| land cover/land use – soil/sediment (acc. Reg. 1306/2013/EU) | ||
| AF-8 | Estimation and mapping on soil and vegetation depletion from agro-ecosystem structure and composition | green infrastructures (acc. Reg. 1306/2013/EU) |
| land cover/land use (acc. Reg. 1306/2013/EU) | ||
| AF-9 | Fraction of Absorbed Photosynthetically Active Radiation (fAPAR) and chlorophyll a+b (Cab) indexes extraction, which is useful to characterize crop status and phenology | crop status (acc. Dir. 92/43/EEC & Dir. 2009/147/EC) |
| crop status (acc. Reg. 1306/2013/EU) | ||
| AF-10 | Estimation of cropland biophysical variables, such as Leaf Area Index (LAI) | crop status (acc. Dir. 92/43/EEC & Dir. 2009/147/EC) |
| crop status (acc. Reg. 1306/2013/EU) | ||
| AF-11 | Natural resource exploitation planning and crop biotic stress (pathogens) | natural resource management |

References
- Milligan, S.R.; Holt, W.V.; Lloyd, R. Impacts of climate change and environmental factors on reproduction and development in wildlife. Philos. Trans. R Soc. Lond. B Biol. Sci. 2009, 364, 3313–3319. [Google Scholar] [CrossRef] [PubMed] [Green Version]
- Malenovský, Z.; Rott, H.; Cihlar, J.; Schaepman, M.E.; García-Santos, G.; Fernandes, R.; Berger, M. Sentinels for science: Potential of Sentinel-1, -2, and -3 missions for scientific observations of ocean, cryosphere, and land. Remote Sens. Environ. 2012, 120, 91–101. [Google Scholar] [CrossRef]
- Pfeifer, M.; Disney, M.; Quaife, T.; Marchant, R. Terrestrial ecosystems from space: Are view of earth observation products for macroecology applications. Global Ecol. Biogeogr. 2012, 21, 603–624. [Google Scholar] [CrossRef] [Green Version]
- Chen, J.; Chen, J.; Liao, A.; Cao, X.; Chen, L.; Chen, X.; He, C.; Han, G.; Peng, S.; Lu, M.; et al. Global land cover mapping at 30 m resolution: A POK-based operational approach. ISPRS J. Photogramm. Remote Sens. 2015, 103, 7–27. [Google Scholar] [CrossRef] [Green Version]
- Li, S.; Dragicevic, S.; Castro, F.A.; Sester, M.; Winter, S.; Coltekin, A.; Pettit, C.; Jiang, B.; Haworth, J.; Stein, A.; et al. Geospatial big data handling theory and methods: A review and research challenges. ISPRS J. Photogramm. Remote Sens. 2016, 115, 119–133. [Google Scholar] [CrossRef] [Green Version]
- Gomarasca, M.A.; Tornato, A.; Spizzichino, D.; Valentini, E.; Taramelli, A.; Satalino, G.; Vincini, M.; Boschetti, M.; Colombo, R.; Rossi, L.; et al. Sentinel for applications in agricolture. In Proceedings of the International Archives of the Photogrammetry, Remote Sensing and Spatial Information Sciences, 2019 ISPRS-GEOGLAM-ISRS Joint International Workshop on “Earth Observations for Agricultural Monitoring”, New Delhi, India, 18–20 February 2019; Volume XLII-3/W6, pp. 91–98. [Google Scholar] [CrossRef] [Green Version]
- Science Communication Unit, University of the West of England, Bristol. Science for Environment Policy Future Brief: Earth Observation’s Potential for the EU Environment. Report produced for the European Commission DG Environment, February 2013, Issue 6. Available online: http://ec.europa.eu/science-environment-policy (accessed on 12 March 2019).
- Mulder, V.L.; de Bruin, S.; Schaepman, M.E.; Mayr, T.R. The use of remote sensing in soil and terrain mapping—A review. Geoderma 2011, 162, 1–19. [Google Scholar] [CrossRef]
- Ben-Dor, E.; Taylor, R.G.; Hill, J.; Demattê, J.a.M.; Whiting, M.L.; Chabrillat, S.; Sommer, S. Imaging spectrometry for soil applications. In Advance in Agronomy; Elsevier: Amsterdam, The Netherlands, 2008; Volume 97, pp. 321–392. [Google Scholar] [CrossRef]
- Bizzi, S.; Demarchi, L.; Grabowski, R.C.; Weissteiner, C.J.; Van de Bund, W. The use of remote sensing to characterise hydromorphological properties of European rivers. Aquat. Sci. 2016, 78, 57–70. [Google Scholar] [CrossRef] [Green Version]
- Pérez-Hoyos, A.; Rembold, F.; Kerdiles, H.; Gallego, J. Comparison of Global Land Cover Datasets for Cropland Monitoring. Remote Sens. 2017, 9, 1118. [Google Scholar] [CrossRef] [Green Version]
- Defourny, P.; Kirches, G.; Brockmann, C.; Boettcher, M.; Peters, M.; Bontemps, S.; Lamarche, C.; Schlerf, M.; Santoro, M. Land Cover CCI: Product Use Guide Version 2, 2016. Available online: http://maps.elie.ucl.ac.be/CCI/viewer/download/ESACCI-LC-PUG-v2.5.pdf (accessed on 10 June 2017).
- De Peppo, M.; Dragoni, F.; Volpi, I.; Mantino, A.; Giannini, V.; Filipponi, F.; Tornato, A.; Valentini, E.; Nguyen Xuan, A.; Taramelli, A.; et al. Modelling the ground-LAI to satellite-NDVI (Sentinel-2) relationship considering variability sources due to crop type (Triticum durum L., Zea mays L., and Medicago sativa L.) and farm management. In Proceedings of the Remote Sensing for Agriculture, Ecosystems, and Hydrology XXI; SPIE Remote Sensing, Strasbourg, France, 9–12 September 2019; Volume 11149. [Google Scholar] [CrossRef]
- EU Commission. User Requirements for the Copernicus Programme. Brussels, 2019. Available online: https://www.copernicus.eu/sites/default/files/2019-10/STAFF_WORKING_PAPER_2019-394-Expression_of_User_Needs_for_the_Copernicus_Programme.pdf (accessed on 21 December 2019).
- Maynard, J.J.; Levi, M.R. Hyper-temporal remote sensing for digital soil mapping: Characterizing soil-vegetation response to climatic variability. Geoderma 2017, 285, 94–109. [Google Scholar] [CrossRef] [Green Version]
- Jutz, S.; Milagro-Perez, M.P. Copernicus Programme. In Comprensive Remote Sensing Mission and Sensor, 1st ed.; Liang, X., Butler, J.J., Eds.; Elsevier: Amsterdam, The Netherlands, 2018; Volume 1, pp. 150–191. [Google Scholar]
- Taramelli, A.; Lissoni, M.; Piedelobo, L.; Schiavon, E.; Valentini, E.; Nguyen Xuan, A.; González-Aguilera, D. Monitoring Green Infrastructure for Natural Water Retention Using Copernicus Global Land Products. Remote Sens. 2019, 11, 1583. [Google Scholar] [CrossRef] [Green Version]
- Lacaze, R.; Smets, B.; Baret, F.; Weiss, M.; Ramon, D.; Montersleet, B.; Wandrebeck, L.; Calvet, J.-C.; Roujean, J.-L.; Camacho, F. Operational 333m biophysical products of the copernicus global land service for agriculture monitoring. In Proceedings of the International Archives of the Photogrammetry, Remote Sensing and Spatial Information Sciences, 36th International Symposium on Remote Sensing of Environment, Berlin, Germany, 11–15 May 2015; Volume XL-7/W3. [Google Scholar] [CrossRef] [Green Version]
- Nieke, J.; Reusen, I. A New Method to Retrieve the Data Requirements of the Remote Sensing Community–Exemplarily Demonstrated for Hyperspectral User Needs. Sensors 2007, 7, 1545–1558. [Google Scholar] [CrossRef] [Green Version]
- Software Test & Evaluation Panel (STEP). Requirements Definition Implementation Team. Operational Requirements for Automated Capabilities. Draft Pamphlet (Draft PAM). 23 April 1991.
- Institute of Electrical and Electronics Engineers. IEEE Standard Glossary of Software Engineering Terminology: IEEE Standard 610.12-1990 (Revision and Redesignation of IEEE Std. 729-1983); Institute of Electrical and Electronics Engineers: New York, NY, USA, 1990. [Google Scholar]
- Amandeep. A Literature Review of Software Requirement Engineering. IEEE 2015, 2, (Special Issue 2 (RIECCE-2015)). 16–20. [Google Scholar]
- Ma, Q. The Effectiveness of Requirements Prioritization Techniques for a Medium to Large Number of Requirements A Systematic Literature Review. A Dissertation Submitted to Auckland University of Technology as a Part of the Requirements for the Degree of Master of Computer and Information Sciences, November 2009, School of Computing and Mathematical Sciences. Available online: http://aut.researchgateway.ac.nz/bitstream/handle/10292/833/MaQ.pdf?sequence=3&isAllowed=y (accessed on 12 March 2019).
- Nuseibeh, B.; Easterbrook, S. Requirements Engineering: A Roadmap. In Proceedings of the Conference on The Future of Software Engineering, Limerick, Ireland, 4–11 June 2000; pp. 35–46. Available online: https://www.cs.toronto.edu/~sme/papers/2000/ICSE2000.pdf (accessed on 12 March 2019).
- Rasaiah, B.; Jones, S.D.; Bellman, C. Building better hyperspectral datasets: The fundamental role of metadata protocols in hyperspectral field campaigns. In Proceedings of the 2011 Surveying & Spatial Sciences Biennial Conference, Wellington, New Zealand, 21–25 November 2011. [Google Scholar]
- Maguire, M.; Bevan, N. User requirements analysis: A review of supporting methods. In Proceedings of the IFIP 17th World Computer Congress, Montreal, Canada, 25–30 August 2002; pp. 133–148. [Google Scholar]
- Vijayan, J.; Raju, G. A New approach to Requirements Elicitation Using Paper Prototype. Int. J. Adv. Sci. Technol. 2011, 28, 9–16. [Google Scholar]
- Feingersh, T.; Ben Dor, E. SHALOM—A commercial hyperspectral space mission. Opt. Payl. Space Miss. 2015, 247–263. [Google Scholar]
- EU Commission. Proposal for a Regulation of the European Parliament and of the Council Establishing the Space Programme of the Union and the European Union Agency for the Space Programme and Repealing Regulations (EU) No 912/2010, (EU) No 1285/2013, (EU) No 377/2014 and Decision 541/2014/EU. Available online: https://eur-lex.europa.eu/legal-content/EN/TXT/?uri=COM:2018:447:FIN (accessed on 21 December 2019).
- Nieke, J.; Rast, M. Towards the Copernicus Hyperspectral Imaging Mission for the Environment (CHIME). In Proceedings of the IGARSS International Geoscience and Remote Sensing Symposium, Valencia, Spain, 22–27 July 2018; pp. 157–159. [Google Scholar]
- Foerster, S.; Guanter, L.; Lopez, T.; Moreno, J.; Rast, M.; Schaepman, M.E. Guest Editorial: International Space Science Institute (ISSI) Workshop on space–borne imaging spectroscopy for exploring the Earth’s ecosystems. Surv. Geophys. 2019, 40, 297–301. [Google Scholar] [CrossRef] [Green Version]
- Transon, J.; d’Andrimont, R.; Maugnard, A.; Defourny, P. Survey of Hyperspectral Earth Observation Applications from Space in the Sentinel-2 Context. Remote Sens. 2018, 10, 157. [Google Scholar] [CrossRef] [Green Version]
- Rast, M.; Painter, T.H. Earth Observation imaging spectroscopy for terrestrial systems: An overview of its history, techniques, and applications of its missions. Surv. Geophys. 2019, 40, 303–331. [Google Scholar] [CrossRef]
- Eismann, M.T. Hyperspectral Remote Sensing; SPIE Press: Bellingham, WA, USA, 2012. [Google Scholar]
- Pu, R. Hyperspectral Remote Sensing. Fundamentals and Practices; CRC Press: Boca Raton, FL, USA, 2017. [Google Scholar]
- Manolakis, D.G.; Lockwood, R.B.; Cooley, T.W. Hyperspectral Imaging Remote Sensing. Physics Sensors and Algorithms; Cambridge University Press: Cambridge, MA, USA, 2016. [Google Scholar]
- Coulter, D.; Hauff, P.L.; Kerby, W.L. Airborne hyperspectral remote sensing. In Proceedings of the 5th Decennial International Conference on Mineral Exploration, Toronto, ON, Canada, 21–25 October 2007; pp. 375–378. [Google Scholar]
- Dowman, I. Hyperspectral Imaging: Beyond the Niche. Geospat. World 2011. [Google Scholar]
- Vane, G.; Goetz, A.F.H.; Wellman, J.B. Airborne imaging spectrometer: A new tool for remote sensing. IEEE Trans. Geosci. Remote Sens. 1984, GE-22, 546–549. [Google Scholar] [CrossRef]
- Zhang, D.; Yuan, L.; Wang, S.; Yu, H.; Zhang, C.; He, D.; Han, G.; Wang, J.; Wang, Y. Wide Swath and High Resolution Airborne HyperSpectral Imaging System and Flight Validation. Sensors 2019, 19, 1667. [Google Scholar] [CrossRef] [Green Version]
- Green, R.O.; Eastwood, M.L.; Sarture, C.M.; Chrien, T.G.; Aronsson, M.; Chippendale, B.J. Imaging spectroscopy and the airborne visible/infrared imaging spectrometer (AVIRIS). Remote Sens. Environ. 1998, 65, 227–248. [Google Scholar] [CrossRef]
- Chrien, T.G.; Green, R.O.; Chovit, C.; Eastwood, M.; Faust, J.; Hajek, P. New calibration techniques for the Airborne Visible/Infrared Imaging Spectrometer (AVIRIS). Available online: https://ntrs.nasa.gov/archive/nasa/casi.ntrs.nasa.gov/19950027368.pdf (accessed on 8 March 2019).
- Porter, W.M.; Enmark, H.T. A system overview of the airborne visible/infrared imaging spectrometer (AVIRIS). In Proceedings of the Imaging Spectroscopy II, International Society for Optics and Photonics, San Diego, CA, USA, 20–21 August 1987; Volume 834, pp. 22–32. [Google Scholar]
- Eastwood, M.L.; Sarture, C.M.; Chrien, T.G.; Green, R.O.; Porter, W.M. Current instrument status of the airborne visible/infrared imaging spectrometer (AVIRIS). In Proceedings of the Infrared Technology XVII, International Society for Optics and Photonics, San Diego, CA, USA, 22–26 July 1991; Volume 1540, pp. 164–176. [Google Scholar]
- Macenka, S.A.; Chrisp, M.P. Airborne visible/infrared imaging spectrometer (AVIRIS) spectrometer design and performance. In Proceedings of the Imaging Spectroscopy II, International Society for Optics and Photonics, San Diego, CA, USA, 20–21 August 1987; Volume 834, pp. 32–44. [Google Scholar]
- Lee, Z.; Carder, K.L.; Chen, R.F.; Peacock, T.G. Properties of the water column and bottom derived from Airborne Visible Infrared Imaging Spectrometer (AVIRIS) data. J. Geophys. Res. Oceans 2001, 106, 11639–11651. [Google Scholar] [CrossRef] [Green Version]
- Carrere, V.; Conel, J.E. Recovery of atmospheric water vapor total column abundance from imaging spectrometer data around 940 nm—Sensitivity analysis and application to Airborne Visible/Infrared Imaging Spectrometer (AVIRIS) data. Remote Sens. Environ. 1993, 44, 179–204. [Google Scholar] [CrossRef]
- Small, C. Spectral dimensionality and scale of urban radiance. In Proceedings of the AVIRIS Workshop, Pasadena, CA, USA, 19 March 2001. [Google Scholar]
- Xiao, Q.; Ustin, S.L.; McPherson, E.G. Using AVIRIS data and multiple-masking techniques to map urban forest tree species. Int. J. Remote Sens. 2004, 25, 5637–5654. [Google Scholar] [CrossRef] [Green Version]
- Dennison, P.E.; Roberts, D.A. Examining Seasonal Changes in Canopy Moisture Using AVIRIS Time Series Data. In Proceedings of the AVIRIS Workshop, Pasadena CA, USA, 31 March–2 April 2004. [Google Scholar]
- Green, R.O. Estimation of biomass fire temperature and areal extent from calibrated AVIRIS spectra. Summ. Sixth Annu. JPL Airborne Earth Sci. Works. JPL 1996, 96, 105–113. [Google Scholar]
- Green, R.O.; Pavri, B.E.; Chrien, T.G. On-orbit radiometric and spectral calibration characteristics of EO-1 Hyperion derived with an underflight of AVIRIS and in situ measurements at Salar de Arizaro, Argentina. IEEE Trans. Geosci. Remote Sens. 2003, 41, 1194–1203. [Google Scholar] [CrossRef]
- Laneve, G.; de Bonis, R.; Fusilli, L. Development of a vegetation damage severity index based on hyperspectral sensor data. In Proceedings of the 33rd EARSel Symposium, Matera, Italy, 3–6 June 2013. [Google Scholar]
- Palacios, S.L.; Kudela, R.M.; Guild, L.S.; Negrey, K.H.; Torres-Perez, J.; Broughton, J. Remote sensing of phytoplankton functional types in the coastal ocean from the HyspIRI Preparatory Flight Campaign. Remote Sens. Environ. 2015, 167, 269–280. [Google Scholar] [CrossRef]
- Leifer, I.; Lehr, W.J.; Simecek-Beatty, D.; Bradley, E.; Clark, R.; Dennison, P.; Reif, M. State of the art satellite and airborne marine oil spill remote sensing: Application to the BP Deepwater Horizon oil spill. Remote Sens. Environ. 2012, 124, 185–209. [Google Scholar] [CrossRef] [Green Version]
- Clark, R.N.; Swayze, G.A.; Leifer, I.; Livo, K.E.; Kokaly, R.; Hoefen, T.; Sarture, C. A method for quantitative mapping of thick oil spills using imaging spectroscopy. US Geolog. Surv. 2010, 1167, 1–51. [Google Scholar]
- Spinetti, C.; Buongiorno, M.F. Volcanic water vapour abundance retrieved using hyperspectral data. In Proceedings of the Geoscience and Remote Sensing Symposium; IGARSS ’04, Anchorage, AK, USA, 20–24 September 2004; Volume 2, pp. 1487–1490. [Google Scholar]
- Herold, M.; Roberts, D.A.; Gardner, M.E.; Dennison, P.E. Spectrometry for urban area remote sensing—Development and analysis of a spectral library from 350 to 2400 nm. Remote Sens. Environ. 2004, 91, 304–319. [Google Scholar] [CrossRef]
- Heiden, U.; Segl, K.; Roessner, S.; Kaufmann, H. Determination of robust spectral features for identification of urban surface materials in hyperspectral remote sensing data. Remote Sens. Environ. 2007, 111, 537–552. [Google Scholar] [CrossRef] [Green Version]
- Mars, J.C.; Crowley, J.K. Mapping mine wastes and analyzing areas affected by selenium-rich water runoff in southeast Idaho using AVIRIS imagery and digital elevation data. Remote Sens. Environ. 2003, 84, 422–436. [Google Scholar] [CrossRef]
- Casey, K.; Kääb, A.; Benn, D.I. Geochemical characterization of supraglacial debris via in situ and optical remote sensing methods: A case study in Khumbu Himalaya, Nepal. Cryosphere 2012, 6, 85–100. [Google Scholar] [CrossRef] [Green Version]
- Painter, T.H.; Duval, B.; Thomas, W.H.; Mendez, M.; Heintzelman, S.; Dozier, J. Detection and Quantification of Snow Algae with an Airborne Imaging Spectrometer. Appl. Environ. Microbiol. 2001, 67, 5267–5272. [Google Scholar] [CrossRef] [PubMed] [Green Version]
- Nolin, A.W.; Dozier, J. A hyperspectral method for remotely sensing the grain size of snow. Remote Sens. Environ. 2000, 74, 207–216. [Google Scholar] [CrossRef]
- Painter, T.H.; Seidel, F.C.; Bryant, A.C.; McKenzie Skiles, S.; Rittger, K. Imaging spectroscopy of albedo and radiative forcing by light-absorbing impurities in mountain snow. J. Geophys. Res. Atmos. 2013, 118, 9511–9523. [Google Scholar] [CrossRef]
- Cavalli, R.M.; Fusilli, L.; Pascucci, S.; Pignatti, S.; Santini, F. Hyperspectral sensor data capability for retrieving complex urban land cover in comparison with multispectral data: Venice city case study (Italy). Sensors 2008, 8, 3299–3320. [Google Scholar] [CrossRef] [Green Version]
- Alberotanza, L.; Cavalli, R.M.; Pignatti, S.; Zandonella, A. Classification of submersed aquatic vegetation of the Venice lagoon using MIVIS airborne data. Anna. Geophys. 2006. Available online: https://www.annalsofgeophysics.eu/index.php/annals/article/view/3147 (accessed on 18 December 2019). [CrossRef]
- Barducci, A.; Guzzi, D.; Lastri, C.; Marcoionni, P.; Nardino, V.; Pippi, I. Emissivity and Temperature Assessment Using a Maximum Entropy Estimator: Structure and Performance of the MaxEnTES Algorithm. IEEE Trans. Geosci. Remote Sens. 2015, 53, 738–751. [Google Scholar] [CrossRef]
- Bresciani, M.; Bolpagni, R.; Braga, F.; Oggioni, A.; Giardino, C. Retrospective assessment of macrophytic communities in southern Lake Garda (Italy) from in situ and MIVIS (Multispectral Infrared and Visible Imaging Spectrometer) data. J. Limnol. 2012, 71, 19. [Google Scholar] [CrossRef] [Green Version]
- Cappucci, S.; Valentini, E.; Monte, M.D.; Paci, M.; Filipponi, F.; Taramelli, A. Detection of natural and anthropic features on small islands. J. Coast. Res. 2017, 77, 73–87. [Google Scholar] [CrossRef]
- Manzo, C.; Valentini, E.; Taramelli, A.; Filipponi, F.; Disperati, L. Spectral characterization of coastal sediments using Field Spectral Libraries, Airborne Hyperspectral Images and Topographic LiDAR Data (FHyL). Int. J. Appl. Earth Observ. Geoinf. 2015, 36, 54–68. [Google Scholar] [CrossRef]
- Giardino, C.; Bresciani, M.; Valentini, E.; Gasperini, L.; Bolpagni, R.; Brando, V.E. Airborne hyperspectral data to assess suspended particulate matter and aquatic vegetation in a shallow and turbid lake. Remote Sens. Environ. 2015, 157, 48–57. [Google Scholar] [CrossRef]
- Taramelli, A.; Valentini, E.; Innocenti, C.; Cappucci, S. FHYL: Field spectral libraries, airborne hyperspectral images and topographic and bathymetric LiDAR data for complex coastal mapping. In Proceedings of the IEEE International Geoscience and Remote Sensing Symposium (IGARSS), Melbourne, Australia, 21–26 July 2013; IEEE Conference Publications. pp. 2270–2273, ISBN 978-1-4799-1114-1. [Google Scholar] [CrossRef]
- Giardino, C.; Bresciani, M.; Matta, E.; Brando, V.E. Imaging Spectrometry of Inland Water Quality in Italy Using MIVIS: An Overview. In Advances in Watershed Science and Assessment; Springer International Publishing: Cham, Switzerland, 2015; pp. 61–83. [Google Scholar]
- Lombardo, V.; Buongiorno, M.F. Lava flow thermal analysis using three infrared bands of remote sensing imagery: A study case from Mt. Etna 2001 eruption. Remote Sens. Environ. 2006, 101, 141–149. [Google Scholar] [CrossRef]
- Pascucci, S.; Belviso, C.; Cavalli, R.M.; Palombo, A.; Pignatti, S.; Santini, F. Using imaging spectroscopy to map red mud dust waste: The Podgorica Aluminum Complex case study. Remote Sens. Environ. 2012, 123, 139–154. [Google Scholar] [CrossRef]
- Pascucci, S.; Palombo, A.; Pergola, N.; Pignatti, S.; Santini, F.; Fusilli, L. Karst water resources detection through airborne thermal data: MIVIS and TASI-600 imagery. In Proceedings of the Geoscience and Remote Sensing Symposium (IGARSS), Melbourne, Australia, 21–26 July 2013; pp. 4550–4553. [Google Scholar]
- Spinetti, C.; Buongiorno, M.F.; Lombardo, V.; Merucci, L. Aerosol optical thickness of Mt. Etna volcanic plume retrieved by means of the Airborne Multispectral Imaging Spectrometer (MIVIS). Ann. Geophys. 2003. [Google Scholar]
- Teggi, S.; Bogliolo, M.P.; Buongiorno, M.F.; Pugnaghi, S.; Sterni, A. Evaluation of SO2 emission from Mt. Etna using diurnal and nocturnal MIVIS TIR remote sensing images and radiative transfer models. J. Geophys. Res. 1999, 104, 20069–20079. [Google Scholar] [CrossRef]
- Seigmann, B.; Alonso, L.; Celesti, M.; Cogliati, S.; Colombo, R.; Damm, A.; Douglas, S.; Guanter, L.; Hanus, J.; Kataja, K.; et al. The High-Performance Airborne Imaging Spectrometer HyPlant—From Raw Images to Top-of-Canopy Reflectance and Fluorescence Products: Introduction of an Automatized Processing Chain. Remote Sens. 2019, 11, 2760. [Google Scholar] [CrossRef] [Green Version]
- Damm, A.; Guanter, L.; Paul-Limoges, E.; van der Tol, C.; Hueni, A.; Buchmann, N.; Eugster, W.; Ammann; Schaepman, M.E. Far-red sun-induced chlorophyll fluorescence shows ecosystem-specific relationships to gross primary production: An assessment based on observational and modeling approach. Remote Sens. Environ. 2015, 166, 91–105. [Google Scholar] [CrossRef]
- Kruse, F.A.; Boardman, J.W.; Lefkoff, A.B.; Young, J.M.; Kierein-Young, K.S.; Cocks, T.D.; Cocks, P.A. HyMap: An Australian hyperspectral sensor solving global problems-results from USA HyMap data acquisitions. In Proceedings of the 10th Australasian Remote Sensing and Photogrammetry Conference, Adelaide, Australia, 21–25 August 2000. [Google Scholar]
- Acito, N.; Matteoli, S.; Rossi, A.; Diani, M.; Corsini, G. Hyperspectral Airborne “Viareggio 2013 Trial” Data Collection for Detection Algorithm Assessment. IEEE J. Select. Top. Appl. Earth Observ. Remote Sens. 2016, 9, 2365–2376. [Google Scholar] [CrossRef]
- Bedini, E.; van der Meer, F.; van Ruitenbeek, F. Use of HyMap imaging spectrometer data to map mineralogy in the Rodalquilar caldera, southeast Spain. Int. J. Remote Sens. 2009, 30, 327–348. [Google Scholar] [CrossRef]
- Ben-Dor, E.; Malthus, T.; Plaza, A.; Schläpfer, D. Hyperspectral remote sensing. In Airborne Measurements for Environmental Research: Methods and Instruments; Wendisch, J.-L., Benguier, M., Eds.; Wiley-VCH: Weinheim, Germany, 2013; pp. 413–456. [Google Scholar]
- Debba, P.; Van Ruitenbeek, F.J.A.; Van Der Meer, F.D.; Carranza, E.J.M.; Stein, A. Optimal field sampling for targeting minerals using hyperspectral data. Remote Sens. Environ. 2005, 99, 373–386. [Google Scholar] [CrossRef]
- Dehaan, R.L.; Taylor, G.R. Mapping irrigation-induced salinity with hyperspectral imagery. In Proceedings of the Geoscience and Remote Sensing Symposium; IGARSS ’01, Sydney, Australia, 9–13 July 2001; Volume 1, pp. 293–295. [Google Scholar]
- Verrelst, J.; Rivera, J.P.; Gitelson, A.; Delegido, J.; Moreno, J.; Camps-Valls, G. Spectral band selection for vegetation properties retrieval using Gaussian processes regression. Int. J. Appl. Earth Observ. Geoinf. 2016, 52, 554–567. [Google Scholar] [CrossRef]
- Zabcic, N.; Rivard, B.; Ong, C.; Mueller, A. Using airborne hyperspectral data to characterize the surface pH and mineralogy of pyrite mine tailings. Int. J. Appl. Earth Observ. Geoinf. 2014, 32, 152–162. [Google Scholar] [CrossRef]
- Anger, C.D.; Babey, S.K.; Adamson, R.J. A new approach to imaging spectroscopy. Proc. SPIE Imag. Spectrosc. Terrestr. Environ. 1990, 1298, 72–86. [Google Scholar]
- Kutser, T. Passive optical remote sensing of cyanobacteria and other intense phytoplankton blooms in coastal and inland waters. Int. J. Remote Sens. 2009, 30, 4401–4425. [Google Scholar] [CrossRef]
- Lévesque, J.; Staenz, K.; Szeredi, T. The impact of spectral band characteristics on unmixing of CASI data for monitoring mine tailings site rehabilitation, Canadian. J. Remote Sens. 2000, 26, 231–240. [Google Scholar]
- Lévesque, J.; Singhroy, V.; Staenz, K.; Bolton, D. Site Characterization of Mine Tailings at the INCO Copper Cliff Tailings Impoundment Area using CASI Imagery. Presented at the International Symposium Geomatics in the Era of RADARSAT, Ottawa, ON, Canada, 25–30 May 1997. [Google Scholar]
- Marmorino, G.O.; Smith, G.B.; Miller, W.D.; Bowles, J.H. Detection of a buoyant coastal wastewater discharge using airborne hyperspectral and infrared imagery. J. Appl. Remote Sens. 2010, 4, 043502. [Google Scholar] [CrossRef]
- Shang, J.; Lévesque, J.; Staenz, K.; Howarth, P.; Morris, B.; Lanteigne, L. Investigating CASI responses to different levels of tailing oxidation: Inco Copper Cliff tailings area, northern Ontario, Canada. In Proceedings of the 22nd Canadian Symposium on Remote Sensing, Victoria, BC, Canada, 21–25 August 2000; pp. 565–574. [Google Scholar]
- Matarrese, R.; Ancona, V.; Salvatori, R.; Muolo, M.R.; Uricchio, V.F.; Vurro, M. Detecting soil organic carbon by CASI hyperspectral images. In Proceedings of the 2014 IEEE International Geoscience and Remote Sensing Symposium, Quebec, QC, Canada, 13−18 July 2014; pp. 3284–3287. [Google Scholar]
- Croft, H.; Chen, J.M.; Zhang, Y.; Simic, A. Modelling leaf chlorophyll content in broadleaf and needle leaf canopies from ground, CASI, Landsat TM 5 and MERIS reflectance data. Remote Sens. Environ. 2013, 133, 128–140. [Google Scholar] [CrossRef]
- Babey, S.K.; Anger, C.D. Compact airborne spectrographic imager (CASI): A progress review. In Proceedings of the Imaging Spectrometry of the Terrestrial Environment, International Society for Optics and Photonics, Orlando, FL, USA, 11–16 April 1993; Volume 1937, pp. 152–164. [Google Scholar]
- George, D.G. Bathymetric mapping using a compact airborne spectrographic imager (CASI). Int. J. Remote Sens. 1997, 18, 2067–2071. [Google Scholar] [CrossRef]
- Hyperion EO-1—Earth on Line—ESA. Available online: https://directory.eoportal.org/web/eoportal/satellite-missions/e/eo-1 (accessed on 21 January 2020).
- Marshall, M.; Thenkabail, P. Advantage of hyperspectral EO-1 Hyperion over multispectral IKONOS, GeoEye-1, WorldView-2, Landsat ETM+, and MODIS vegetation indices in crop biomass estimation. ISPRS J. Photogramm. Remote Sens. 2015, 108, 205–218. [Google Scholar] [CrossRef] [Green Version]
- Wu, C.; Niu, Z.; Tang, Q.; Huang, W. Estimating chlorophyll content from hyperspectral vegetation indices: Modeling and validation. Agric. For. Meteorol. 2008, 148, 1230–1241. [Google Scholar] [CrossRef]
- Zhang, Q.; Middleton, E.M.; Cheng, Y.-B.; Huemmrich, K.F.; Cook, B.D.; Corp, L.A.; Kustas, W.P.; Russ, A.L.; Prueger, J.H.; Yao, T. Integrating chlorophyll fAPAR and nadir photochemical reflectance index from EO-1/Hyperion to predict cornfield daily gross primary production. Remote Sens. Environ. 2016, 186, 311–321. [Google Scholar] [CrossRef] [Green Version]
- Apan, A.; Held, A.; Phinn, S.; Markley, J. Detecting sugarcane ’orange rust’ disease using EO-1 Hyperion hyperspectral imagery. Int. J. Remote Sens. 2004, 25, 489–498. [Google Scholar] [CrossRef] [Green Version]
- Castaldi, F.; Palombo, A.; Santini, F.; Pascucci, S.; Pignatti, S.; Casa, R. Evaluation of the potential of the current and forthcoming multispectral and hyperspectral imagers to estimate soil texture and organic carbon. Remote Sens. Environ. 2016, 179, 54–65. [Google Scholar] [CrossRef]
- Mahoney, S.; James, P.; Mauger, A.; Heinson, G. Geologic and regolith mapping for mineral exploration in the Gawler Craton of South Australia using Hyperion and other remote sensing techniques. In Proceedings of the IGARSS International Geoscience and Remote Sensing Symposium, Toronto, ON, Canada, 24–28 June 2002; pp. 1779–1781. [Google Scholar]
- Pignatti, S.; Acito, N.; Amato, U.; Casa, R.; Castaldi, F.; Coluzzi, R.; Matteoli, S. Environmental products overview of the Italian hyperspectral prisma mission: The SAP4PRISMA project. In Proceedings of the IGARSS International Geoscience and Remote Sensing Symposium, Milan, Italy, 26–31 July 2015; pp. 3997–4000. [Google Scholar]
- Giardino, C.; Brando, V.E.; Dekker, A.G.; Strömbeck, N.; Candiani, G. Assessment of water quality in Lake Garda (Italy) using Hyperion. Remote Sens. Environ. 2007, 109, 183–195. [Google Scholar] [CrossRef]
- Brando, V.E.; Dekker, A.G. Satellite hyperspectral remote sensing for estimating estuarine and coastal water quality. IEEE Trans. Geosci. Remote Sens. 2003, 41, 1378–1387. [Google Scholar] [CrossRef]
- Zhu, W.N.; Yu, Q. Inversion of chromophoric dissolved organic matter (CDOM) from EO-1 Hyperion imagery for turbid estuarine and coastal waters. IEEE Trans. Geosci. Remote Sens. 2013, 51, 3286–3298. [Google Scholar] [CrossRef]
- Spinetti, C.; Mazzarini, F.; Casacchia, R.; Colini, L.; Neri, M.; Behncke, B.; Pareschi, M.T. Spectral properties of volcanic materials from hyperspectral field and satellite data compared with LiDAR data at Mt. Etna. Int. J. Appl. Earth Observ. Geoinf. 2009, 11, 142–155. [Google Scholar] [CrossRef]
- Hyun, C.U.; Park, H.D. Hyperspectral remote sensing of serpentine rocks and asbestos bearing roofing slate. In Proceedings of the IGARSS 2010 International Geoscience and Remote Sensing Symposium, Honolulu, HI, USA, 25–30 July 2010; Volume 2530. [Google Scholar]
- Lu, Y.; Tian, Q.; Wang, X.; Zheng, G.; Li, X. Determining oil slick thickness using hyperspectral remote sensing in the Bohai Sea of China. Int. J. Digit. Earth 2013, 6, 76–93. [Google Scholar] [CrossRef]
- Negi, H.S.; Jassar, H.S.; Saravana, G.; Thakur, N.K.; Snehmani; Ganju, A. Snow-cover characteristics using Hyperion data for the Himalayan region. Int. J. Remote Sens. 2013, 34, 2140–2161. [Google Scholar] [CrossRef]
- Christian, B.; Joshi, N.; Saini, M.; Mehta, N.; Goroshi, S.; Nidamanuri, R.R.; Thenkabail, P.; Desai, A.R.; Krishnayya, N.S.R. Seasonal variations in phenology and productivity of a tropical dry deciduous forest from MODIS and Hyperion. Agric. For. Meteorol. 2015, 214, 91–105. [Google Scholar] [CrossRef]
- Ryan, J.P.; Davis, C.O.; Tufillaro, N.B.; Kudela, R.M.; Gao, B.-C. Application of the Hyperspectral Imager for the Coastal Ocean to Phytoplankton Ecology Studies in Monterey Bay, CA, USA. Remote Sens. Phytoplankt. 2014, 6, 1007–1025. [Google Scholar] [CrossRef] [Green Version]
- Braga, F.; Giardino, C.; Bassani, C.; Matta, E.; Candiani, G.; Strömbeck, N.; Bresciani, M. Assessing water quality in the northern Adriatic Sea from HICO™ data. Remote Sens. Lett. 2013, 4, 1028–1037. [Google Scholar] [CrossRef]
- Gitelson, A.A.; Gao, B.C.; Li, R.R.; Berdnikov, S.; Saprygin, V. Estimation of chlorophyll-a concentration in productive turbid waters using a Hyperspectral Imager for the Coastal Ocean—The Azov Sea case study. Environ. Res. Lett. 2011, 6, 024023. [Google Scholar] [CrossRef]
- Simon, A.; Shanmugam, P. Estimation of the spectral diffuse attenuation coefficient of downwelling irradiance in inland and coastal waters from hyperspectral remote sensing data: Validation with experimental data. Int. J. Appl. Earth Observ. Geoinf. 2016, 49, 117–125. [Google Scholar] [CrossRef]
- HICO—Hyperspectral Imager for the Coastal Ocean. Available online: http://hico.coas.oregonstate.edu/ (accessed on 21 January 2020).
- The CEOS database CEOS EO HANDBOOK—INSTRUMENT SUMMARY—HICO. Available online: http://database.eohandbook.com/database/instrumentsummary.aspx?instrumentID=1737 (accessed on 21 January 2020).
- Board SS, National Academies of Sciences, Engineering, and Medicine. Thriving on Our Changing Planet: A Decadal Strategy for Earth Observation from Space; National Academies Press: Washington, DC, USA, 2019. [Google Scholar]
- The CEOS Database CEOS EO HANDBOOK—INSTRUMENT SUMMARY—Hyperion. Available online: http://database.eohandbook.com/database/instrumentsummary.aspx?instrumentID=627 (accessed on 21 January 2020).
- The EO-1 Hyperion Imaging Spectrometer. 2001 IEEE Aerospace Conference. Available online: https://eo1.gsfc.nasa.gov/new/validationReport/Technology/TRW_EO1%20Papers_Presentations/10.pdf (accessed on 21 January 2020).
- CHRIS-Proba—Earth on Line—ESA. Available online: https://earth.esa.int/web/guest/missions/esa-operational-eo-missions/proba/instruments/chris (accessed on 21 January 2020).
- The CEOS Database. CEOS EO HANDBOOK—MISSION SUMMARY—PROBA. Available online: http://database.eohandbook.com/database/missionsummary.aspx?missionID=403 (accessed on 21 January 2020).
- Loizzo, R.; Guarini, R.; Longo, F.; Scopa, T.; Formaro, R.; Facchinetti, C.; Varacalli, G. PRISMA: The Italian hyperspectral mission. In Proceedings of the IGARSS International Geoscience and Remote Sensing Symposium, Valencia, Spain, 22–27 July 2018; pp. 175–178. [Google Scholar] [CrossRef]
- PRISMA Hyperspectral Precursor of the Application Mission. Available online: http://prisma-i.it/index.php/en/ (accessed on 21 January 2020).
- The Ceos Database. CEOS EO HANDBOOK—MISSION SUMMARY—PRISMA. Available online: http://database.eohandbook.com/database/missionsummary.aspx?missionID=396 (accessed on 21 January 2020).
- Guanter, L.; Kaufmann, H.; Segl, K.; Foerster, S.; Rogass, C.; Chabrillat, S.; Kuester, T.; Hollstein, A.; Rossner, G.; Chlebek, C.; et al. The environmental mapping and analysis program (EnMAP) spaceborne imaging spectroscopy mission for Earth Observation. Remote Sens. 2015, 7, 8830–8857. [Google Scholar] [CrossRef] [Green Version]
- EnMAP Hyperspectral Imager. Available online: www.enmap.org (accessed on 18 December 2019).
- EnMAP Ground Segment Team GSIS GRSS Technical Committee. Spaceborne Imaging Spectroscopy Mission Compilation. 2019. Available online: http://www.enmap.org/sites/default/files/pdf/Hyperspectral_EO_Missions_2019_06_03.pdf (accessed on 18 December 2019).
- The CEOS Database. CEOS EO HANDBOOK—MISSION SUMMARY—EnMAP. Available online: http://database.eohandbook.com/database/missionsummary.aspx?missionID=600 (accessed on 21 January 2020).
- Matsunaga, T.; Iwasaki, A.; Tsuchida, S.; Iwao, K.; Tanii, J.; Nakamura, R.; Yamamoto, H.; Kato, S.; Obata, K.; Kashimura, O.; et al. HISUI status toward FY2019 launch. In Proceedings of the IGARSS International Geoscience And Remote Sensing Symposium, Valencia, Spain, 22–27 July 2018; pp. 160–163. [Google Scholar] [CrossRef]
- The CEOS Database CEOS EO HANDBOOK—INSTRUMENT SUMMARY—HISUI. Available online: http://database.eohandbook.com/database/instrumentsummary.aspx?instrumentID=1634 (accessed on 21 January 2020).
- The CEOS Database. CEOS EO HANDBOOK—MISSION SUMMARY—FLEX. Available online: http://database.eohandbook.com/database/missionsummary.aspx?missionID=836 (accessed on 21 January 2020).
- Natale, V.G.; Kafri, A.; Tidhar, G.A.; Chen, M.; Feingersh, T.; Sagi, E.; Cisbani, A.; Baroni, M.; Labate, D.; Nadler, R.; et al. SHALOM—Space-borne hyperspectral applicative land and ocean mission. In Proceedings of the 5th Workshop on Hyperspectral Image and Signal Processing: Evolution in Remote Sensing (WHISPERS), Gainesville, FL, USA, 26–28 June 2013; pp. 1–4. [Google Scholar]
- Briottet, X.; Marion, R.; Carrère, V.; Jacquemoud, S.; Chevrel, S.; Prastault, P.; D’oria, M.; Gilouppe, P. HYPXIM: A new hyperspectral sensor combining science/defence applications. In Proceedings of the 3rd Workshop on Hyperspectral Image and Signal Processing. Evolution in Remote Sensing, Lisbon, Portugal, 6–9 June 2011. [Google Scholar]
- Lee, C.M.; Cable, M.L.; Hook, S.J.; Green, R.O.; Ustin, S.L.; Mandl, D.J.; Middleton, E.M. An introduction to the NASA Hyperspectral InfraRed Imager (HyspIRI) mission and preparatory activities. Remote Sens. Environ. 2015, 167, 6–19. [Google Scholar] [CrossRef]
- Devred, E.; Turpie, K.R.; Moses, W.; Klemas, V.V.; Moisan, T.; Babin, M.; Toro-Farmer, G.; Forget, M.H.; Jo, Y.H. Future retrievals of water column bio-optical properties using the Hyperspectral Infrared Imager (HyspIRI). Remote Sens. 2013, 5, 6812–6837. [Google Scholar] [CrossRef] [Green Version]
- The CEOS Database. CEOS EO HANDBOOK—MISSION SUMMARY—HyspIRI. Available online: http://database.eohandbook.com/database/missionsummary.aspx?missionID=644 (accessed on 21 January 2020).
- Green, R.O. Global VSWIR Imaging Spectroscopy and the 2017 Decadal Survey. In Proceedings of the IGARSS International Geoscience And Remote Sensing Symposium, Valencia, Spain, 22–27 July 2018; pp. 183–185. [Google Scholar] [CrossRef]
- NASA Science—Decadal Designated Observable Study. Available online: https://science.nasa.gov/earth-science/decadal-sbg (accessed on 21 January 2020).
- Hook, S.J.; Cawse-Nicholson, K.; Hulley, G.C. ECOSTRESS, HyTES and HyspIRI/SBG—Imaging in the Thermal Infrared. In Proceedings of the American Geophysical Union 2018 Fall Meeting, Washington, DC, USA, 13 December 2018. [Google Scholar]
- Wang, L.; Zhao, C. Hyperspectral Image Processing; Springer: Cham, Switzerland, 2015. [Google Scholar]
- Dozier, J.; Green, R.O.; Nolin, A.W.; Painter, T.H. Interpretation of snow properties from imaging spectrometry. Remote Sens. Environ. 2009, 113, S25–S37. [Google Scholar] [CrossRef]
- Hestir, E.L.; Brando, V.E.; Bresciani, M.; Giardino, C.; Matta, E.; Villa, P.; Dekker, A.G. Measuring freshwater aquatic ecosystems: The need for a hyperspectral global mapping satellite mission. Remote Sens. Environ. 2015, 167, 181–195. [Google Scholar] [CrossRef] [Green Version]
- Ong, C.; Carrère, V.; Chabrillat, S.; Clark, R.; Hoefen, T.; Kokaly, R.; Marion, R.; Souza Filho, C.R.; Swayze, G.; Thompson, D.R. Imaging Spectroscopy for the Detection, Assessment and Monitoring of Natural and Anthropogenic Hazards. Surv. Geophys. 2019, 40, 431–470. [Google Scholar] [CrossRef] [Green Version]
- European Space Agency (ESA–ESTEC). Earth and Mission Science Division. Copernicus Hyperspectral Imaging Mission For Environment–Mission Requirements Document. Ref. ESA-EOPSM-CHIM-MRD-3216. 2019. [Google Scholar]
- Valentini, E.; Taramelli, A.; Cappucci, S.; Filipponi, F.; Nguyen Xuan, A. Exploring the Dunes: The Correlations between Vegetation Cover Pattern and Morphology for Sediment Retention Assessment Using Airborne Multisensor Acquisition. Remote Sens. 2020, 12, 1229. [Google Scholar] [CrossRef] [Green Version]


| Sensor (Country) | Spectral Range (nm) | SSI (nm) | Number of Channels | FOV (deg) | IFOV (mrad) | Application |
|---|---|---|---|---|---|---|
| AVIRIS NG (USA) [41,42,43,44,45,46,47,48,49,50,51,52,53,54,55,56,57,58,59,60,61,62,63,64] | 380–2500 | 9.7–12.0 | 224 | 30 | 1 | Ecology, agricultural and forest status, oceanography, geology, atmosphere, ice, snow, clouds |
| MIVIS (Italy) [65,66,67,68,69,70,71,72,73,74,75,76,77,78] | 433–833 1150–1550 2000–2500 8200–12700 | 20 50 8 400–500 | 20 8 64 10 | 70 | 2 | Geological and environmental study |
| Hymap (Australia) [79] | 400–2500 | 10–20 | 128 | 61.3 | 2×2.5 | Mineral exploration and environmental, agricultural and forest monitoring |
| APEX (Europe) [80] | 380–970 940–2500 | 0.5–8.0 10.0–6.0 | 114 199 | 28 | 0.48 | Pigments and chlorophyll fluorescence in agriculture |
| Hyplant-DUAL (Germany-Finland) [81,82,83,84,85,86,87,88] | 380–970 970–2500 670–780 | 4.0 13.3 0.25 | 350 272 1024 | 32.3 32.3 | 0.0832 0.0832 | Agricultural and forest status, vegetation fluorescence |
| CASI (Canada)[89,90,91,92,93,94,95,96,97,98] | 400–2500 | 2.4/7.5 | 96/200 | 40 | 0.49/0.698 | Ecosystem, terrestrial features observation |
| Mission/ Sensor (Country) | Launch Date | Spectral Range (nm) | Spectral Resolution (nm) | Number of Channels | Spatial Resolution (m) | Swath (km) | Features |
|---|---|---|---|---|---|---|---|
| Hyperion (USA) [99,122,123] | Nov. 2000 Now closed | 400–2500 | 10 | 220 | 30 | 7.5 | Technology validation/demonstration mission |
| CHRIS (Europe) [124,125] | Oct. 2001 Now closed | 400–1050 | 1.25@400 nm 11@1050 nm | 62 Mode 1 18 Mode 2–5 | 36 Mode 1 18 Mode 2–5 | 14 | Technological demonstrator to collect BRDF data for the better understanding of spectral reflectances |
| HICO (USA) [115,116,117,118,119,120] | Sep. 2009 Now closed | 380–960 | 5.7 | 102 | 90 | 42–192 | Observing coastal ocean |
| PRISMA (Italy) [126,127,128] | Mar. 2019 | 400–1010 920–2500 400–700 | 10 | 66 173 1 | 30 30 5 | 30 | Europe and the Mediterranean region observation |
| EnMAP (Germany) [129,130,131,132] | Exp. 2020 | 420–1000 900–2450 | 6.5 10 | 98 130 | 30 | 30 | Scientific path finder mission for later operational services, for environmental monitoring, process understanding |
| HISUI (Japan) [133,134] | Dec. 2019 | 440–970 900–2500 | 10 12.5 | 185 | 20 (cross track) 30 (along track) | 20 | Oil/gas/mineral resource exploration and other fields such as agriculture, forestry, and coastal issues |
| FLORIS/ FLEX (Europe) [135] | Exp. 2022 | 500–780 | 0.3–3 | 300 | 105–150 | Quantitative global mapping of actual photosynthetic activity of terrestrial ecosystems, as a function of variable vegetation health status and environmental stress conditions | |
| SHALOM (Italy-Israel) [28,136] | Exp. 2022 | 400–1010 920–2500 400–700 | ~10 | 10 10 | 10 | Environmental quality, crisis monitoring, search for mineral and natural resources, monitoring water bodies, assisting precision agriculture activity | |
| HYPXIM-P (France) [137] | Exp. 2020 | 400–2500 8000–12000 | 10 100–150 | 210 40 | < 8 100 | 16 | Vegetation, coastal and inland water ecosystems, geosciences, urban environment, atmospheric studies, security and defense |
| HyspIRI/SBG (USA) [54,138,139,140,141,142,143] | Exp. 2022 | 380–2510 | 10 | 30(60) | 145–600 | World ecosystems, natural disasters (volcanoes, wildfires, and drought) |
| Copernicus Application Domains | ||||||||
|---|---|---|---|---|---|---|---|---|
| Thematic Areas | Agriculture, Forestry & Fisheries | Biodiversity & Environ. Protection | Climate & Energy | Civil Protection & Humanitarian Aid | Public Health | Tourism | Transport & Safety | Urban & Regional Planning |
| European Policy | ||||||||
| Agriculture/Food security | ||||||||
| Nitrates European Directive (91/676/EEC) | ||||||||
| Common Agricultural Policy | ||||||||
| Habitats Directive (92/43/EEC) | ||||||||
| Birds Directive (2009/147/EC) | ||||||||
| Enhancing Europe’s Natural Capital COM/2013/0249 final | ||||||||
| Animal By-Products Regulation (1069/2009/EU) | ||||||||
| Ecosystem structure/Composition | ||||||||
| Habitats Directive (92/43/EEC) | ||||||||
| Birds Directive (2009/147/EC) | ||||||||
| Animal By-Products Regulation (1069/2009/EU) | ||||||||
| Inland/Coastal water and environment | ||||||||
| Marine Strategy Framework Directive (2008/56/EC) | ||||||||
| Water Framework Directive (2000/60/EC) | ||||||||
| Bathing Water Directive (2006/7/EC) | ||||||||
| Maritime Spatial Planning Directive (2014/89/EU) | ||||||||
| Strategic Environmental Assessment Directive (2001/42/EC) | ||||||||
| Floods Directive (2007/60/EC) | ||||||||
| Habitats Directive (92/43/EEC) | ||||||||
| Directive Urban Wastewater Treatment (91/271/EEC) | ||||||||
| Air quality | ||||||||
| Ambient Air Quality and Cleaner Air Directives (2004/107/EC and 2008/50/EC) | ||||||||
| Cultural heritage | ||||||||
| General Conference of the United Nations Educational, Scientific and Cultural Organization meeting, Paris, 17 Oct. – 21 Nov. 1972 | ||||||||
| Raw materials | ||||||||
| Raw Materials Initiative (COM/2008/699) | ||||||||
| Natural and man-made hazards | ||||||||
| Restrictions on the marketing and use of certain dangerous substances and preparations (asbestos) [1999/77/CE] | ||||||||
| Thematic strategy for soil protection (COM/2006/231) | ||||||||
| Water Framework Directive (2000/60/EC) | ||||||||
| Floods Directive (2007/60/EC) | ||||||||
| Ice and snow | ||||||||
| No specific reference | ||||||||
| Urban area management | ||||||||
| Decision n. 1386/2013/EU | ||||||||
| EU biodiversity strategy (COM/2011/0244 final) | ||||||||
| Enhancing Europe’s Natural Capital (COM/2013/0249 final) | ||||||||
| USER COMMUNITIES [Public/Private] | USERS | USER MAIN FIELD OF ACTIVITY [Thematic Area of Interest] |
|---|---|---|
| Italian National System for Environmental Protection (SNPA) [Public] https://www.snpambiente.it | ARPA Liguria | Management/Services [IC - AQ - RM - NH - UM] |
| ARPA Veneto | Management/Services [AF - EC - IC - AQ - RM - NH - IS - UM] | |
| ARPA Valle d’Aosta | Management/Services [AF - EC - AQ - IS] | |
| ARPA Puglia | Management/Services [AF - EC - IC - AQ - CH - RM - NH - UM] | |
| ARPA Piemonte | Management/Services [AF - EC - IC - AQ - RM - NH - IS - UM] | |
| ARPA Calabria | Management/Services [IC - UM] | |
| ARPA Lombardia | Management/Services [AF - EC - IC - AQ - CH - RM - NH - IS - UM] | |
| APPA Bolzano and Provincia Autonoma di Bolzano | Management/Services [AF - EC - IC - AQ - RM - NH - UM] | |
| ARPA Toscana | Management/Services [AF - EC - IC - AQ - CH - RM - NH - IS - UM] | |
| ARPAE Emilia Romagna | Management/Services [AF - EC - IC - AQ - CH - RM - NH - IS - UM] | |
| ARPA Friuli Venezia Giulia | Management/Services [AF - EC - IC - AQ - CH - RM - NH - IS - UM] | |
| Italian National Committee for Operational Hydrology Services [Public] http://www.isprambiente.gov.it/pre_meteo/idro/Tavolo_IdrologiaOper.html | Regione Basilicata | Management/Services [IC - IS] |
| ARPA Lombardia | Management/Services [AF - EC - IC - AQ - CH - RM - NH - IS - UM] | |
| Regione Puglia | Management/Services [IC - NH] | |
| ARPA Veneto | Management/Services [AF - EC - IC - AQ - CH - RM - NH - IS - UM] | |
| Italian Ministry of Agricultural, Food and Forestry Policies (Mipaaf) [Public] https://www.politicheagricole.it | CREA − Council for Agricultural Research and Analysis of the Agricultural Economy | Research [AF] |
| Italian Civil Protection Department (DPC) [Public] http://www.protezionecivile.gov.it | DPC | Management/Services [AF - IC - AQ -NH - IS - UM] |
| Italian National Research Council (CNR) [Public] https://www.cnr.it | CNR | Research [AF - EC - CH - RM] |
| Association of Italian Space Enterprises (AIPAS) [Private] https://www.aipas.it | INDUSTRY 1 INDUSTRY 2 | Management/Services [AF - EC - IC - AQ - CH - RM - NH - IS - UM] |
| Italian Ministry of Infrastructures and Transport (MIT) [Public] http://www.mit.gov.it | MIT ENAC RFI | Policy/Management/Services [IC - AQ - CH - NH - UM] |
| Italian Air Force Meteorological Service of Ministry of Defense (MID-AM) [Public] http://www.meteoam.it | MID-AM | Management/Services [AQ - NH] |
| Italian National Institute of Geophysics and Volcanology (INGV) [Public] http://terremoti.ingv.it | Remote Sensing Activities | Research/Services [NH] |
© 2020 by the authors. Licensee MDPI, Basel, Switzerland. This article is an open access article distributed under the terms and conditions of the Creative Commons Attribution (CC BY) license (http://creativecommons.org/licenses/by/4.0/).
Share and Cite
Taramelli, A.; Tornato, A.; Magliozzi, M.L.; Mariani, S.; Valentini, E.; Zavagli, M.; Costantini, M.; Nieke, J.; Adams, J.; Rast, M. An Interaction Methodology to Collect and Assess User-Driven Requirements to Define Potential Opportunities of Future Hyperspectral Imaging Sentinel Mission. Remote Sens. 2020, 12, 1286. https://doi.org/10.3390/rs12081286
Taramelli A, Tornato A, Magliozzi ML, Mariani S, Valentini E, Zavagli M, Costantini M, Nieke J, Adams J, Rast M. An Interaction Methodology to Collect and Assess User-Driven Requirements to Define Potential Opportunities of Future Hyperspectral Imaging Sentinel Mission. Remote Sensing. 2020; 12(8):1286. https://doi.org/10.3390/rs12081286
Chicago/Turabian StyleTaramelli, Andrea, Antonella Tornato, Maria Lucia Magliozzi, Stefano Mariani, Emiliana Valentini, Massimo Zavagli, Mario Costantini, Jens Nieke, Jennifer Adams, and Michael Rast. 2020. "An Interaction Methodology to Collect and Assess User-Driven Requirements to Define Potential Opportunities of Future Hyperspectral Imaging Sentinel Mission" Remote Sensing 12, no. 8: 1286. https://doi.org/10.3390/rs12081286