Technical Note

Monitoring Plant Functional Diversity Using the Reflectance and Echo from Space

1
German Centre for Integrative Biodiversity Research (iDiv) Halle-Jena-Leipzig, 04103 Leipzig, Germany
2
Max Planck Institute for Biogeochemistry, 07745 Jena, Germany
3
Department of Systematic Botany and Functional Biodiversity, Leipzig University, 04103 Leipzig, Germany
4
Department of Ecological Modeling, Helmholtz Centre for Environmental Research (UFZ), 04318 Leipzig, Germany
5
Institute for Geography, Leipzig University, 04103 Leipzig, Germany
*
Author to whom correspondence should be addressed.
Remote Sens. 2020, 12(8), 1248; https://doi.org/10.3390/rs12081248
Submission received: 16 March 2020 / Revised: 6 April 2020 / Accepted: 10 April 2020 / Published: 15 April 2020
(This article belongs to the Special Issue Remote Sensing for Biodiversity Mapping and Monitoring)

Abstract

:
Plant functional diversity (FD) is an important component of biodiversity. Evidence shows that FD strongly determines ecosystem functioning and stability and also regulates various ecosystem services that underpin human well-being. Given the importance of FD, it is critical to monitor its variations in an explicit manner across space and time, a highly demanding task that cannot be resolved solely by field data. Today, high hopes are placed on satellite-based observations to complement field plot data. The promise is that multiscale monitoring of plant FD, ecosystem functioning, and their services is now possible at global scales in near real-time. However, non-trivial scale challenges remain to be overcome before plant ecology can capitalize on the latest advances in Earth Observation (EO). Here, we articulate the existing scale challenges in linking field and satellite data and further elaborated in detail how to address these challenges via the latest innovations in optical and radar sensor technologies and image analysis algorithms. Addressing these challenges not only requires novel remote sensing theories and algorithms but also urges more effective communication between remote sensing scientists and field ecologists to foster mutual understanding of the existing challenges. Only through a collaborative approach can we achieve the global plant functional diversity monitoring goal.

Graphical Abstract

1. What Are the Opportunities for Measuring FD Offered by New Generation Satellites?

Today, a new generation of Earth observation (EO) satellites scans large parts of the Earth’s surface at ever higher spatial, temporal, and spectral resolutions (Table 1). For instance, the recently launched Sentinel-2 satellites allow us to monitor vegetation properties every 5–10 days globally at 10 m resolutions [1]. High-resolution hyperspectral satellites that resolve the full optical domain are also being launched [2]. These optical reflectance measurements are complemented by new spaceborne Synthetic Active Radar (SAR) and Light Detection and Ranging (LiDAR) instruments [3]. Both SAR and LiDAR are active remote sensing technologies as they essentially measure their own echo and allow inference of vegetation biomass and its three-dimensional structure with much improved accuracy, spatial coverage, and resolution than previous sensors [4]. Furthermore, the free and open access of historically collected Landsat imagery brings new opportunities for monitoring ecological changes spanning time periods longer than four decades [5].
In short: the breadth of potential ecological applications based on these new generation EO sensors is huge [6,7,8]. One key question is how to capitalize on these unprecedented amount of data streams to truly understand changes in plant diversity, ecosystem functioning, and services at the global scale in light of the global environmental change and biodiversity crisis [9]. The objective of this technical note is to shed light on the emerging opportunities offered by the latest innovations in EO technologies in bridging the existing scale challenges, so that plant traits and functional diversity data collected by field ecologists can be better scaled across space and time using satellite measurements.

2. What Do Satellites Measure?

Measurements from space are the result of the complex physical interaction between electromagnetic radiation and vegetated surfaces at different wavelengths—an “electromagnetic signature” that encodes fundamental information on vegetation states, function, and structure. Signatures from the visible to shortwave infrared spectral region are related to the biophysical and biochemical properties of top canopy leaves [10,11]. In the thermal infrared region, instead, one can infer canopy surface temperatures from which canopy transpiration rates can be further estimated [12]. In electromagnetic wavelengths longer than the thermal infrared region (microwave region), one can detect even deeper structural properties and the vertically integrated water content [13]. Essentially, one can assess plant traits, vegetation structure and functioning, and phenology at an aggregated pixel level integrating signals from all individual plants and species present in the pixel [14]. Given that remote sensing measurements resolve these properties in space and time, they are key for investigating changes in plant diversity, ecosystem functioning, and services, globally and in near real time [15,16,17,18,19].

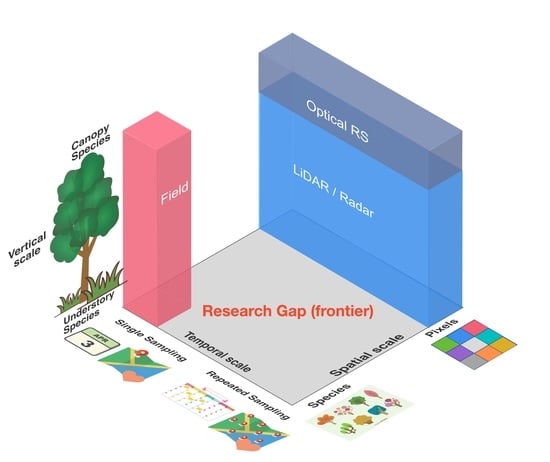
3. Do Satellites “See” the Same FD as Field Ecologists?

Plant functional diversity (hereafter referred to as FD), often defined as the within-community range and dispersion of those plant traits that influence ecosystem functioning or how plants respond to environmental factors, is an important component of plant diversity [20,21]. Alternatively, FD can be defined as the number of functionally disparate species within a population (e.g., different feeding mechanisms and mortality rate), also known as functional richness [22]. Evidence shows that FD strongly determines ecosystem functioning and stability [20,22,23,24,25,26] and also regulates various ecosystem services (e.g., fodder production and maintenance of soil fertility) that underpin human well-being [27]. Recently, efforts have been made to derive FD from retrievals of plant physiological traits (e.g., chlorophyll and water content) and structural traits (e.g., plant height, plant area index) from airborne hyperspectral and LiDAR instruments [28,29]. High-spatial resolution satellite measurements of spectral reflectance across the visible to near infrared spectrum have also been used to directly upscale plant FD from a plot to a regional scale via statistical modelling [30]. However, common practices for in-situ observation in plant ecology as well as the definition of traits and FD do not really match what we can retrieve today from remote sensing observations. We argue that there are several potential issues and scale mismatches that call for novel field measurement strategies and remote sensing algorithms as well as novel concepts and theory related to plant FD. Considering the practical side first, field and satellite measurements typically “see” different objects for different reasons:
First, there is a critical spatial scale mismatch. Field surveys rely on the direct measurement or traits of sampled plant organs to characterize traits at the individual plant level [31]. Trait values are typically averaged to the species level and then aggregated to community estimates of plant FD accounting for species abundance. Remote sensing of plant FD, instead, implies first retrieving plant traits from images and estimating the plant FD as the variance of trait values among pixels [28]. Other methods rely on the use of statistical models to predict FD directly from remote sensing data, typically optical [30,32]. Obviously, there is no easy mapping method to infer information from these spaceborne sensor-dedicated scales to individual plants and species. Different from an ecologist’s view on plant FD that represents inter-species trait variability, remote sensing-derived plant FD represents a broader scale view of the plant FD by measuring spatiospectral variability of biochemical properties and structure among pixels or patches [32]. For instance, in savannah biomes, there is much sub-pixel variability in plant traits due to the contrasting tree and grass layers, but any two adjacent pixels that contain similar fractions of trees and grasses would have the same reflectance values detected by spectral sensors, resulting in an underestimation of true FD in such ecosystems.
Second, there is a critical temporal scale mismatch. Co-existing species in a plant community can have different phenologies, plus the traits themselves may vary over the seasons [33,34,35] (Figure 1). As such, not only trait values for each species, but also their community means, should vary across seasons (Figure 1). This directly leads to the insight that plant FD varies temporally (Figure 1). However, it is common practice in field data collection to measure traits for each species at a certain time in a growing season. Though studies can also take repeated sampling of traits via multiple field campaigns, this is demanding in terms of both labor and economic costs and hence not readily applicable in practice. Taking leaf traits as an example, standard trait sampling protocols recommend that “relatively young but fully expanded and hardened leaves from adult plants need to be selected” [31]. Following this practice implies that plant functional ecology is based on the assumption of a static ecosystem—any subsequent estimation of FD for a plant community represents some trait potential that may never have physically existed in reality. By contrast, remote sensing can potentially lead us to a phenological view of traits and FD by revealing the temporal signatures of plant traits and community composition.
Third, there is a critical vertical scale mismatch. A plant community consists of not only canopy species but also sub-canopy species. Field measurements have the potential to sample all of them but due to the limited penetration capacity, remote sensing (especially in the optical domain) has a limited capability in measuring the vertical profile of canopy spectra [14]. This leads to an underrepresentation of sub-canopy species in remote sensing-based FD.
In addition, there can be other intrinsic differences between satellite and in-situ measurements. For instance, satellite measurements can potentially have larger uncertainties than in-situ sampling due to the influence from the atmosphere, cloud, topography, soil background, and sun–sensor geometry. Attention needs to be paid by ecologists before using satellite data in their studies, and much efforts are needed to correct these uncertainties by the remote sensing community; only through these efforts can reliable links be established between satellite and in-situ measurements of plant traits and FD.

4. How Can We Address the Scale Challenges?

The above-mentioned mismatches in spatial scale, temporal perspective, and vertical understanding make up today’s multidimensional research frontier towards achieving the global plant FD monitoring goal (Figure 2). There are hopes to bridge the described scale mismatches between remote sensing and field data of FD thanks to both technical advances in EO satellite remote sensing and dedicated efforts in field campaigns (Table 2).
From a remote sensing perspective, to solve the spatial scale mismatch, the spatial resolution of current spaceborne hyperspectral and LiDAR sensors needs to be improved to less than 10 m. However, data alone do not solve the problem: only if we augmented these data by the combined use of hyperspectral and LiDAR measurements via latest artificial intelligence technologies will we be able to solve the scale mismatches. Much work has been done with the use of airborne instruments that usually offer very high spatial resolutions capable of segmenting pixels into canopy species with LiDAR data [37,38,39] and further retrieval of chemical and structural traits for each individual tree using hyperspectral data [40]. For instance, in the humid tropical forests of Malaysian Borneo, airborne hyperspectral measurements were used to successfully map multiple foliar traits, at high precision and accuracy, for each individual sunlit canopy crown that was delineated by concurrent LiDAR measurements [41]. The transferability of experience gained from airborne applications now needs to be tested with the refined resolutions of satellite sensors.
To better bridge the spatial scale mismatch, measurements taken by sensors onboard towers, drones, and aircrafts (near-surface remote sensing) can be used to scale up FD from field plots to satellite pixels; this is the so-called multi-scale sampling & upscaling strategy [42]. A study has used hyperspectral sensors onboard small UAVs to map multiple plant traits over grassland; the mapped traits over much larger scales than field plots can then be used as a link to satellite measurements [43]. To solve the vertical scale mismatch, optical and radar/LiDAR instruments need to be integrated to better characterize vegetation 3D structural change across time. Besides, the cutting-edge hyperspectral LiDAR technology should be explored to characterize the foliar traits in full 3D [44,45] and hence make remote sensing-derived FD comparable to field-based FD in terms of the representativeness of canopy and understory species. The capability of using hyperspectral LiDAR for retrieving the distribution of foliar chlorophyll content among different Scots pine shoots has been demonstrated, showing a greater advantage than the conventional approach using optical sensors that can only resolve the canopy biochemical contents integrated across the vertical foliage profile [46].
From a field measurement perspective, to solve the temporal scale mismatch, repeated and consistent sampling needs to be done across time to provide enough high-quality calibration data for remote sensing. In this sense, the emerging drone/ground-based high-throughput phenotyping technology using a range of image acquisition systems (so-called “phenomics”) offers a consistent, direct, cost-effective, and rapid method to bridge the temporal scale mismatch [47,48,49,50]. With the progress made in sensors, aeronautics, and high-performance computation, the cost of high-throughput phenotyping is becoming more affordable, and the entire process is becoming more automatic [51]. Meanwhile, as spatial variability in remote sensing signals can essentially come from both intra- and inter-specific variability, and much intra-specific variation in leaf chemistry has been reported [52], comprehensive field sampling that can provide such information would be extremely valuable in achieving a better match with satellite measurements. To help remote sensing to identify which species are presented in each pixel, ground reference data about the accurate location of different species are highly desirable, as then we could obtain the spectral signatures of each species, by which a species–spectral library can be established. Such an image-based species–spectral library would greatly facilitate assigning species codes to segmented individuals in the imagery or even enabling spectral unmixing techniques to directly decompose pixels into fractions of different species [53,54]. In this sense, the ongoing efforts dedicated to the development of open-access species-level spectral library databases (e.g., EcoSIS) are particularly promising and should be encouraged.

5. Statistics-Based Data Integration as an Alternative Pathway for Upscaling FD

Statistics-based data integration can also facilitate a direct upscaling of plant FD from field plots to the regional scale [30,55,56]. Figure 3 shows how the multi-faceted biological and environmental information from new generation EO sensors can be fed into the statistical models to predict FD from field plots. This statistics-based upscaling concept has several advantages. First, it bypasses the non-trivial challenge of segmenting pixels into individual plants and further labelling them as species. Second, the FD that is predicted from a statistical regression framework is compatible with field-based FD, as the model is essentially trained with field FD as a targeting variable. Third, considering the rich information from new generation EO sensors (optical, radar, LiDAR, thermal, fluorescence, and other environmental variables), the statistics-based upscaling approach also has the potential to maximize the predictive power of FD and even offer insights into the underlying mechanisms driving FD patterns, hence simplifying the mapping of FD from space.
A prerequisite in linking spaceborne measurements directly to field-estimated FD is that the spatial resolution of satellite imagery should be comparable to the size of the field plots. The ever refining spatial resolutions of EO sensors have enabled promising opportunities in applying the statistics-based FD upscaling approach. For instance, a recent study linked multispectral measurements from the Sentinel-2 satellite directly to FD derived from a suite of plant traits measured in field plots [30]. Sentinel-2 offers improved spatial (up to 10 m), spectral (13 bands in visible, red-edge, near infrared, and shortwave infrared regions), and temporal resolutions (3–5-day revisit) from previous spaceborne sensors. As such, a good comprise is reached between spatial resolution, which is needed to link field plot measurements (plot size: 30 × 30 m), spectral resolution, which is required to infer FD computed from multiple functional traits, and temporal resolution, which is necessary to match to the date and phenological stages when field samplings were done. These advantages enabled the establishment of a direct statistical regression model between Sentinel-2 measurements and field plot FD that can predict more than 50% of the spatial variation in FD across European forests [30]. Another challenge in operationalizing the statistics-based upscaling approach is the reliance of consistent field plot data of both species composition and traits that are not usually available over large geographic extents. Such a challenge may be overcome via the efforts in standardizing field plot design and trait collection, and perhaps more importantly, making such data visible and available to a broad research community [57].
To achieve a better integration of satellite and field data, it would be highly beneficial to take into consideration the linking to EO data as early as possible in the field plot design stage. For instance, plot size should be large enough to match satellite pixels and if possible, accurate information about geolocation and orientation of plots should be registered. Maintenance of field plots across a longer time span is also crucial for validating EO products and for testing their ability to map not only spatial patterns but also to track temporal changes. In short, effective communication between the ecology and the EO communities will be essential to ensure coordinated efforts [58,59].

6. Do We Need to Rethink the Classical Plant FD Concept in a Satellite Era?

Scale mismatches are not merely of a technical nature, but rather lead us to more fundamental questions: Do these new data from space require us to rethink the concept of plant FD and to revise classic concepts? Taking the relationship between plant FD and ecosystem functioning, for example, many mechanisms have been proposed. The “complementarity” hypothesis, for example, suggests that a higher number of functionally dissimilar species will increase the efficiency by which relevant resources are harvested. Plenty of studies have found that the diversity in certain plant ecophysiological traits (e.g., maximum growth rate, leaf nitrogen concentration, leaf area, and root distribution pattern) can contribute to this “complementarity” at the ecosystem scale [60,61]. Likewise, the heterogeneity of canopy structures was found to have a positive effect on primary productivity by harvesting light more efficiently [62,63,64]. In the same way, temporal partitioning can facilitate the partitioning of critical resources such as light, water, nutrients and pollinators in the course of the season, which in turn enhance the acquisition of available resources and productivity at community levels [65].
All the aforementioned dimensions of diversity in plant physiology, structure, and phenology can in principle be monitored from space. Therefore, we can achieve a full spatiotemporal characterization of plant FD that goes beyond what is achievable from field surveys, thereby offering new means to relate to ecosystem functioning at different time scales. An apparent advantage of having FD measures from space is that we can finally achieve a much improved spatial and temporal representativeness of FD change. FD that encompasses phenological but also structural diversity, in addition to functional trait diversity, can potentially help to better elucidate the links between species diversity and ecosystem functioning. Despite the challenge in characterising FD due to the scale mismatches, remote sensing has been increasingly and successfully applied in estimating community-weighted means of plant traits, or functional identity, with the use of both airborne and spaceborne measurements over the past decade [43,66]. The potentials in the electromagnetic spectrum are manifold: besides leaf traits retrieved from hyperspectral measurements, spaceborne radar resolution and precision are continually evolving. Characterising vegetation hyperspectral as well as 3D structure across space and time along with estimates of ecosystem functions (e.g., water-use-efficiency, light-use-efficiency, among others) will tell us if the classical ideas reflected, e.g., in the “insurance hypothesis” or the “complementary hypothesis”, hold true across a broad environmental gradient and remain stable at seasonal and interannual time-scales.

7. Concluding Remarks

Currently, in-situ ecological data for monitoring FD are not spatially representative for large-scale ecological gradients. Intensive data streams by new generation EO sensors are becoming more and more available but their full potentials are yet to be realized. While this article is being read, satellites are continuously measuring reflectance and echo over the entire planet. It is now the time to capitalize them for the benefit of plant ecology and biodiversity research. However, it is more than a technical challenge to solve the global biodiversity crisis where novel remote sensing technologies, in tandem with sound ecological knowledge and in-situ observations, can make a unique contribution.

Author Contributions

Conceptualization, all co-authors; methodology, X.M.; writing—original draft preparation, X.M., M.D.M., M.M.; writing—review and editing, all co-authors; visualization, X.M.; funding acquisition, M.D.M. and M.M. All authors have read and agreed to the published version of the manuscript.

Funding

This work was supported by an iDiv-Flexpool project “oBEF-Across” and a European Union H2020 project “BACI” (grant number: 640176).

Acknowledgments

We thank Guido Kramer for helping to craft the conceptual figure and Richard Nair for proof reading and English checking. The vector images and SVGs used in Figure 2 and Figure 3 were obtained from www.svgrepo.com and www.freevector.com under the Creative Commons BY 4.0 license.

Conflicts of Interest

The authors declare no conflict of interest.

References

  1. Drusch, M.; Del Bello, U.; Carlier, S.; Colin, O.; Fernandez, V.; Gascon, F.; Hoersch, B.; Isola, C.; Laberinti, P.; Martimort, P.; et al. Sentinel-2: ESA’s optical high-resolution mission for GMES operational services. Remote Sens. Environ. 2012, 120, 25–36. [Google Scholar] [CrossRef]
  2. Guanter, L.; Kaufmann, H.; Segl, K.; Foerster, S.; Rogass, C.; Chabrillat, S.; Kuester, T.; Hollstein, A.; Rossner, G.; Chlebek, C.; et al. The EnMAP spaceborne imaging spectroscopy mission for Earth observation. Remote Sens. 2015, 7, 8830–8857. [Google Scholar] [CrossRef] [Green Version]
  3. Bergen, K.M.; Goetz, S.J.; Dubayah, R.O.; Henebry, G.M.; Husaker, C.T.; Imhoff, M.L.; Nelson, R.F.; Parker, G.G.; Radeloff, V.C. Remote sensing of vegetation 3-D structure for biodiversity and habitat: Review and implications for LiDAR and radar spaceborne mission. J. Geophys. Res. Biogeosci. 2009, 114, G00E06. [Google Scholar] [CrossRef] [Green Version]
  4. Qi, W.; Lee, S.K.; Hancock, S.; Luthcke, S.; Tang, H.; Armston, J.; Dubayah, R. Improved forest height estimation by fusion of simulated GEDI lidar and TanDEM-X InSAR data. Remote Sens. Environ. 2019, 221, 621–634. [Google Scholar] [CrossRef] [Green Version]
  5. Turner, W. Sensing biodiversity. Science 2014, 346, 301–302. [Google Scholar] [CrossRef]
  6. Andrew, M.E.; Wulder, M.; Nelson, T.A. Potential contributions of remote sensing to ecosystem service assessments. Prog. Phys. Geogr. 2014, 38, 328–353. [Google Scholar] [CrossRef] [Green Version]
  7. Jetz, W.; Cavender-Bares, J.; Pavlick, R.; Schimel, D.; Davis, F.W.; Asner, G.P.; Guralnick, R.; Kattge, J.; Latimer, A.M.; Moorcroft, P. Monitoring plant functional diversity from space. Nat. Plants 2016, 2, 16024. [Google Scholar] [CrossRef] [PubMed] [Green Version]
  8. Cord, A.F.; Brauman, K.A.; Chaplin-Kramer, R.; Huth, A.; Ziv, G.; Seppelt, R. Priorities to advance monitoring of ecosystem services using Earth observation. Trends Ecol. 2017, 32, 416–428. [Google Scholar] [CrossRef]
  9. IPBES. Summary for Policymakers of the Global Assessment Report on Biodiversity and Ecosystem Services of the Intergovernmental Science-Policy Platform on Biodiversity and Ecosystem Services; Díaz, S., Settele, J., Brondizio, E.S., Ngo, H.T., Guèze, M., Agard, J., Arneth, A., Balvanera, P., Brauman, K.A., Butchart, S.H.M., et al., Eds.; IPBES Secretariat: Bonn, Germany, 2019. [Google Scholar]
  10. Hill, J.; Buddenbaum, H.; Townsend, P.A. Imaging spectroscopy of forest ecosystems: Perspectives for the use of space-borne hyperspectral Earth Observation systems. Surv. Geophys. 2019, 40, 553–588. [Google Scholar] [CrossRef]
  11. Homolová, L.; Malenovsky, Z.; Clevers, J.G.P.W.; García-Santos, G.; Schaepman, M.E. Review of optical-based remote sensing for plant trait mapping. Ecol. Complex. 2013, 15, 1–16. [Google Scholar] [CrossRef] [Green Version]
  12. Buitrago-Acevedo, M.F.; Groen, T.A.; Hecker, C.A.; Skidmore, A.K. Identifying leaf traits that signal stress in TIR spectra. ISPRS J. Photogramm. 2017, 125, 132–145. [Google Scholar] [CrossRef]
  13. Konings, A.G.; Rao, K.; Steele-Dunne, S.C. Macro to micro: Microwave remote sensing of plant water content for physiology and ecology. New Phytol. 2019, 223, 1166–1172. [Google Scholar] [CrossRef] [Green Version]
  14. Ustin, S.; Gamon, J. Remote sensing of plant functional types. New Phytol. 2010, 186, 795–816. [Google Scholar] [CrossRef]
  15. Pettorelli, N.; Safi, K.; Turner, W. Satellite remote sensing, biodiversity research and conservation of the future. Philos. Trans. R. Soc. Lond. B 2014, 369, 20130190. [Google Scholar] [CrossRef] [PubMed]
  16. Gamon, J.A.; Somers, B.; Malenovsky, Z.; Middleton, E.M.; Rascher, U.; Schaepman, M.E. Assessing vegetation function with imaging spectroscopy. Surv. Geophys. 2019, 40, 489–513. [Google Scholar] [CrossRef] [Green Version]
  17. Wang, R.; Gamon, J.A. Remote sensing of terrestrial plant biodiversity. Remote Sens. Environ. 2019, 231, 111218. [Google Scholar] [CrossRef]
  18. Gholizadeh, H.; Gamon, J.A.; Townsend, P.A.; Zygielbaum, A.I.; Helzer, C.J.; Hmimina, G.Y.; Yu, R.; Moore, R.M.; Schweiger, A.K.; Cavender-Bares, J. Detecting prairie biodiversity with airborne remote sensing. Remote Sens. Envion. 2019, 221, 38–49. [Google Scholar] [CrossRef]
  19. Rocchini, D.; Boyd, D.S.; Féret, J.-B.; Foody, G.M.; He, K.S.; Lausch, A.; Nagendra, H.; Wegmann, M.; Pettorelli, N. Satellite remote sensing to monitor species diversity: Potential and pitfalls. Remote Sens. Ecol. Conserv. 2015, 2, 25–36. [Google Scholar] [CrossRef]
  20. Tilman, D.; Knops, J.; Wedin, D.; Reich, P.; Ritchie, M.; Siemann, E. The influence of functional diversity and composition on ecosystem processes. Science 1997, 277, 1300–1302. [Google Scholar] [CrossRef] [Green Version]
  21. Lavorel, S.; Garnier, E. Predicting changes in community composition and ecosystem functioning from plant traits: Revisiting the Holy Grail. Funct. Ecol. 2002, 16, 545–556. [Google Scholar] [CrossRef]
  22. Mason, N.W.; Mouillot, D.; Lee, W.G.; Wilson, J.B. Functional richness, functional evenness and functional divergence: The primary components of functional diversity. Oikos 2005, 111, 112–118. [Google Scholar] [CrossRef]
  23. Diaz, S.; Cabido, M. Vive la difference: Plant functional diversity matters to ecosystem process. Trends Ecol. Evol. 2001, 16, 646–655. [Google Scholar] [CrossRef]
  24. Hooper, D.; Chapin, J., III; Ewel, J.; Hector, A.; Inchausti, P.; Lavorel, S.; Lawton, J.H.; Lodge, D.M.; Loreau, M.; Naeem, S.; et al. Effects of biodiversity on ecosystem functioning: A consensus of current knowledge. Ecol. Monogr. 2005, 75, 3–35. [Google Scholar] [CrossRef]
  25. Paquette, A.; Messier, C. The effect of biodiversity on tree productivity: From temperate to boreal forests. Glob. Ecol. Biogeogr. 2011, 20, 170–180. [Google Scholar] [CrossRef] [Green Version]
  26. Ruiz-Benito, P.; Gómez-Aparicio, L.; Paquette, A.; Messier, C.; Kattge, J.; Zavala, M. Diversity increases carbon storage and tree productivity in Spanish forests. Glob. Ecol. Biogeogr. 2014, 23, 311–322. [Google Scholar] [CrossRef]
  27. Diaz, S.; Lavorel, S.; de Bello, F.; Quétier, F.; Grigulis, K.; Matthew, R.T. Incorporating plant functional diversity effects in ecosystem service assessments. Proc. Natl. Acad. Sci. USA 2007, 104, 20684–20689. [Google Scholar] [CrossRef] [Green Version]
  28. Schneider, F.D.; Morsdorf, F.; Schmid, B.; Petchey, O.L.; Hueni, A.; Schimel, D.S.; Schaepman, M.E. Mapping functional diversity from remotely sensed morphological and physiological forest traits. Nat. Commun. 2017, 8, 144. [Google Scholar] [CrossRef] [Green Version]
  29. Asner, G.P.; Martin, R.E.; Knapp, D.E.; Tupayachi, R.; Anderson, C.B.; Sinca, F.; Vaughn, N.R.; Llactayo, W. Airborne laser-guided imaging spectroscopy to map forest trait diversity and guide conservation. Science 2017, 355, 385–389. [Google Scholar] [CrossRef]
  30. Ma, X.; Mahecha, M.D.; Migliavacca, M.; van der Plas, F.; Benavides, R.; Ratcliffe, S.; Kattge, J.; Richter, R.; Musavi, T.; Baeten, L.; et al. Inferring plant functional diversity from space: The potentials of Sentinel-2. Remote Sens. Environ. 2019, 233, 111368. [Google Scholar] [CrossRef]
  31. Pérez-Harguindeguy, N.; Díaz, S.; Garnier, E.; Lavorel, S.; Poorter, H.; Jaureguiberry, P.; Bret-Harte, M.S.; Cornwell, W.K.; Gurvich, D.E.; Urcelay, C.; et al. New handbook for standardized measurement of plant functional traits worldwide. Aust. J. Bot. 2013, 61, 167–234. [Google Scholar] [CrossRef]
  32. Rocchini, D.; Bacaro, G.; Chirici, G.; Da Re, D.; Feilhauer, H.; Foody, G.M.; Galluzzi, M.; Garzon-Lopez, C.X.; Gillespie, T.W.; He, K.S.; et al. Remotely sensed spatial heterogeneity as an exploratory tool for taxonomic and functional diversity study. Ecol. Indic. 2018, 85, 983–990. [Google Scholar] [CrossRef] [Green Version]
  33. Bloomfield, K.J.; Cernusak, L.A.; Eamus, D.; Ellsworth, D.S.; Prentice, I.C.; Wright, I.J.; Boer, M.M.; Bradford, M.G.; Cale, P.; Cleverly, J.; et al. A continental-scale assessment of variability in leaf traits: Within species, across sites and between seasons. Funct. Ecol. 2017, 32, 1492–1506. [Google Scholar] [CrossRef]
  34. Fajardo, A.; Siefert, A. Phenological variation of leaf functional traits within species. Oecologia 2016, 180, 951–959. [Google Scholar] [CrossRef]
  35. McKown, A.D.; Guy, R.D.; Azam, M.S.; Drewes, E.C.; Quamme, L.K. Seasonality and phenology alter functional leaf traits. Oecologia 2013, 172, 653–665. [Google Scholar] [CrossRef]
  36. Laliberté, E.; Legendre, P. A distance-based framework for measuring functional diversity from multiple traits. Ecology 2010, 91, 299–305. [Google Scholar] [CrossRef]
  37. Yao, W.; Krzystek, P.; Heurich, M. Enhanced detection of 3D individual trees in forested areas using airborne full-waveform LiDAR data by combining normalized cuts with spatial density clustering. ISPRS Ann. 2013, II–5/W2, 349–354. [Google Scholar] [CrossRef] [Green Version]
  38. Shi, Y.; Skidmore, A.K.; Wang, T.; Holzwarth, S.; Heiden, U.; Pinnel, N.; Zhu, X.; Heurich, M. Tree species classification using plant functional traits from LiDAR and hyperspectral data. Int. J. Appl. Earth Obs. 2018, 73, 207–219. [Google Scholar] [CrossRef]
  39. Féret, J.B.; Asner, G.P. Tree species discrimination in tropical forests using airborne imaging spectroscopy. IEEE Trans. Geosci. Remote 2013, 51, 73–84. [Google Scholar] [CrossRef]
  40. Asner, G.P.; Martin, R.E. Airborne spectranomics: Mapping canopy chemical and taxonomic diversity in tropical forests. Front. Ecol. Environ. 2009, 7, 269–276. [Google Scholar] [CrossRef] [Green Version]
  41. Martin, R.E.; Chadwick, K.D.; Brodrick, P.G.; Carranza-Jimenez, L.; Vaughn, N.R.; Asner, G.P. An approach for foliar trait retrieval from airborne imaging spectroscopy of tropical forests. Remote Sens. 2018, 10, 199. [Google Scholar] [CrossRef]
  42. Marvin, D.C.; Koh, L.P.; Lynam, A.J.; Wich, S.; Davies, A.B.; Krishnamurthy, R.; Stokes, E.; Starkey, R.; Asner, G.P. Integrating technologies for scalable ecology and conservation. Glob. Ecol. Conserv. 2016, 7, 262–275. [Google Scholar] [CrossRef] [Green Version]
  43. Capolupo, A.; Kooistra, L.; Berendonk, C.; Boccia, L.; Suomalainen, J. Estimating plant traits of grasslands from UAV-acquired hyperspectral images: A comparison of statistical approaches. ISPRS Int. J. Geo Inf. 2015, 4, 2792–2820. [Google Scholar] [CrossRef]
  44. Hakala, T.; Suomalainen, J.; Kaasalainen, S.; Chen, Y. Full waveform hyperspectral LiDAR for terrestrial laser scanning. Opt. Express 2012, 20, 7119–7127. [Google Scholar] [CrossRef]
  45. Sun, J.; Shi, S.; Yang, J.; Chen, B.; Gong, W.; Du, L.; Mao, F.; Song, S. Estimating leaf chlorophyll status using hyperspectral LiDAR measurements by PROSPECT model inversion. Remote Sens. Environ. 2018, 212, 1–7. [Google Scholar] [CrossRef]
  46. Nevalainen, O.; Hakala, T.; Suomalainen, J.; Mäkipää, R.; Peltoniemi, M.; Krooks, A.; Kaasalainen, S. Fast and non-destructive method for leaf level chlorophyll estimation using hyperspectral LiDAR. Agric. For. Meteorol. 2014, 198, 250–258. [Google Scholar] [CrossRef]
  47. Sankaran, S.; Khot, L.R.; Espinoza, C.Z.; Jarolmasjed, S.; Sathuvalli, V.R.; Vandemark, G.J.; Miklas, P.N.; Carter, A.H.; Pumphrey, M.O.; Knowles, N.R.; et al. Low-altitude, high-resolution aerial imaging systems for row and field crop phenotyping: A review. Eur. J. Agron. 2015, 80, 112–123. [Google Scholar] [CrossRef]
  48. Hawkesford, M.J.; Lorence, A. Plant phenotyping: Increasing throughput and precision at multiple scales. Funct. Plant Biol. 2017, 44, 5–7. [Google Scholar] [CrossRef] [Green Version]
  49. Araus, J.L.; Cairns, J.E. Field high-throughput phenotyping: The new crop breeding frontier. Trends Plant Sci. 2014, 19, 52–61. [Google Scholar] [CrossRef]
  50. Thorp, K.R.; Thompson, A.L.; Harders, S.J.; French, A.N.; Ward, R.W. High-throughput phenotyping of crop water use efficiency via multispectral drone imagery and a daily soil water balance model. Remote Sens. 2018, 10, 1682. [Google Scholar] [CrossRef] [Green Version]
  51. Ampatzidis, Y.; Partel, V. UAV-based high throughput phenotyping in citrus utilizing multispectral imaging and artificial intelligence. Remote Sens. 2019, 11, 410. [Google Scholar] [CrossRef] [Green Version]
  52. Auger, S.; Shipley, B. Inter-specific and intra-specific trait variation along short environmental gradients in an old-growth temperate forest. J. Veg. Sci. 2013, 24, 419–428. [Google Scholar] [CrossRef]
  53. Somers, B.; Asner, G.P. Multi-temporal hyperspectral mixture analysis and feature selection for invasive species mapping in rainforests. Remote Sens. Environ. 2013, 136, 14–27. [Google Scholar] [CrossRef]
  54. Stagakis, S.; Vanikiotis, T.; Sykioti, O. Estimating forest species abundance through linear unmixing of CHRIS/PROBA imagery. ISPRS J. Photogramm. 2016, 119, 79–89. [Google Scholar] [CrossRef]
  55. Butler, E.E.; Datta, A.; Flores-Moreno, H.; Chen, M.; Wythers, K.R.; Fazayeli, F.; Banerjee, A.; Atkin, O.K.; Kattge, J.; Amiaud, B.; et al. Mapping local and global variability in plant trait distributions. Proc. Natl. Acad. Sci. USA 2017, 114, E10937–E10946. [Google Scholar] [CrossRef] [Green Version]
  56. Moreno-Martínez, Á.; Camps-Valls, G.; Kattge, J.; Robinson, N.; Reichstein, M.; van Bodegom, P.; Kramer, K.; Cornelissen, J.H.C.; Reich, P.; Bahn, M.; et al. A methodology to derive global maps of leaf traits using remote sensing and climate data. Remote Sens. Environ. 2018, 218, 69–88. [Google Scholar] [CrossRef] [Green Version]
  57. Kissling, W.D.; Walls, R.; Bowser, A.; Jones, M.O.; Kattge, J.; Agosti, D.; Amengual, J.; Basset, A.; van Bodegom, P.M.; Cornelissen, J.H.C.; et al. Towards global data products of Essential Biodiversity Variables on species traits. Nat. Ecol. Evol. 2018, 2, 1531–1540. [Google Scholar] [CrossRef] [Green Version]
  58. Skidmore, A.; Pettorelli, N.; Coops, N.C.; Geller, G.N.; Hansen, M.; Lucas, R.; Mücher, C.A.; O’Connor, B.; Paganini, M.; Schaepman, M.E.; et al. Agree on biodiversity metrics to track from space. Nature 2015, 523, 403–405. [Google Scholar] [CrossRef] [Green Version]
  59. O’Connor, B.; Secades, C.; Penner, J.; Sonnenschein, R.; Skidmore, A.; Burgess, N.D.; Hutton, J.M. Earth observation as a tool for tracking progress towards the Aichi Biodiversity Targets. Remote Sens. Ecol. Conserv. 2015, 1, 19–28. [Google Scholar] [CrossRef]
  60. Roscher, C.; Schumacher, J.; Gubsch, M.; Lipowsky, A.; Weigelt, A.; Buchmann, N.; Schmid, B.; Schulze, E.-D. Using plant functional traits to explain diversity-productivity relationships. PLoS ONE 2012, 7, e36760. [Google Scholar] [CrossRef]
  61. Wagg, C.; Ebeling, A.; Roscher, C.; Ravenek, J.; Bachmann, D.; Eisenhauer, N.; Mommer, L.; Buchmann, N.; Hillebrand, H.; Schmid, B.; et al. Functional trait dissimilarity drives both species complementarity and competitive disparity. Funct. Ecol. 2016, 31, 2320–2329. [Google Scholar] [CrossRef]
  62. Williams, L.J.; Paquette, A.; Cavender-Bares, J.; Messier, C.; Reich, P.B. Spatial complementarity in tree crowns explains overyielding in species mixtures. Nat. Ecol. 2017, 1, 0063. [Google Scholar] [CrossRef] [PubMed]
  63. Dänescu, A.; Albrecht, A.; Bauhus, J. Structural diversity promotes productivity of mixed, uneven-aged forests in southwestern Germany. Oecologia 2016, 182, 319–333. [Google Scholar] [CrossRef] [PubMed]
  64. Bohn, F.J.; Huth, A. The importance of forest structure to biodiversity–productivity relationships. R. Soc. Open Sci. 2017, 4, 160521. [Google Scholar] [CrossRef] [PubMed] [Green Version]
  65. Sapijanskas, J.; Paquette, A.; Potvin, C.; Kunert, N.; Loreau, M. Tropical tree diversity enhances light capture through crown plasticity and spatial and temporal niche differences. Ecology 2014, 95, 2479–2492. [Google Scholar] [CrossRef]
  66. Kokaly, R.F.; Asner, G.P.; Ollinger, S.V.; Martin, M.E.; Wessman, C.A. Characterizing canopy biochemistry from imaging spectroscopy and its application to ecosystem studies. Remote Sens. Environ. 2009, 113, S78–S91. [Google Scholar] [CrossRef]
Figure 1. Hypothetical View of Time-Varying Plant Trait and Functional Diversity Here, the first three panels show the hypothetical seasonal profiles of three traits for three species (equal abundance). In the bottom panel, the temporally varying FD and community-weighted mean (CWM) of each trait are computed at any day of the year by applying the multivariate FD algorithm, the functional dispersion [36], and the CWM algorithm, respectively. The dashed lines in the bottom panel indicate the values of FD and CWMs computed using a species–trait matrix with traits of each species reaching their maximum value within a growing season, which is a common practice in plant ecology. The decrease in FD around June/July indicates the moment when the mean distance from each species to the centroid in the multidimensional trait space reaches the minimum value within a growing season, or, in other words, when species appear to be most similar to each other in terms of the values of the three traits selected. Such a temporally varying phenological aspect of traits has been documented in previous literature [34,35].
Remotesensing 12 01248 g001
Figure 2. Identifying the Frontier in Satellite-Based Remote Sensing used for Plant FD Research Field measurement (red box) can resolve species details (including both canopy and understory) in a plant community but field data is confined in space and time. Optical satellites (dark blue box) can resolve top canopy layer traits but have limited penetration ability to resolve the vertical structure. Radar and LiDAR satellites (light blue box) can complement optical satellites to characterize the full 3D structure of a plant community. Satellites can repeat the measurements across space and time but can only take measurements at a pixel level and cannot (to date) resolve the species or even individual details. The new research frontier will be formed by moving the field measurements towards the right (more frequent sampling across space and time) while moving satellite measurements towards the top (more refined measurements so that we can resolve species details).
Remotesensing 12 01248 g002
Figure 3. A Conceptual Workflow for Upscaling Plant FD Using Satellite Measurements. In the bottom panels, there are variations in plant leaf traits, vegetation structure, and phenology within a plant community that can be directly measured on the ground, from which a multi-dimensional FD measure can be computed. In the upper panels, there are satellite measurements that are capable of measuring leaf, structural, and phenological traits. Taking the in-situ FD and satellite measurements as input, innovative statistical models (e.g., machine learning) can be calibrated for mapping plant FD at regional or even global scales.
Remotesensing 12 01248 g003
Table 1. List of some new generation spaceborne Earth observation (EO) missions that can be used to infer plant traits and functional diversity.
Multi-/HyperspectralRadar and LiDARThermal InfraredFluorescence
Sentinel-2DESISPRISMAGF-5Sentinel-1PALSAR-2Tandem-XGEDIICESat-2EcoSTRESSLandsat 8-TIRSTROPOMIFLEX
Space AgencyESADLRASICNSAESAJAXADLRNASANASANASANASA/USGSESAESA
Instrument TypemultispectralhyperspectralhyperspectralhyperspectralC-band SARL-band SARX-band SARLiDARLiDARThermal infraredThermal infraredChlorophyll fluorescenceChlorophyll fluorescence
LaunchJune 2015June 2018March 2019May 2018April 2014May 2014June 2010November 2018September 2018June 2018February 2013October 20172022
Bands13235240200441--62--
Resolution10/20/60 m30 m30 m30 m10 m25 m20 m25 m100 m70 m100 m7 km × 3.5 km300 m
Retrievable variablesCanopy traits, vegetation phenologyCanopy traitsCanopy traitsCanopy traitsForest coverForest coverForest height, Forest coverForest structure, Forest height, biomassForest structure, Forest height, biomassCanopy temperature, plant water-use-efficiency and transpiration ratesCanopy temperature, plant water-use-efficiency and transpiration ratesCanopy photosynthetic traits and primary productivityCanopy photosynthetic traits and primary productivity
Table 2. The three scale mismatches and the potential technical innovations that can bridge them.
Scale MismatchDescriptionConsequencesPotential Solutions
SpatialField ecologists measure traits at the species scale while satellites measure traits at a pixel scaleFD that is computed directly from remote sensing-generated traits images represents inter-pixel variance instead of inter-specific variance 1. Refining the spatial resolution of satellite sensors;
2. Developing effective algorithms for segmenting pixels into individuals;
3. Applying a multi-scale upscaling strategy from sensors onboard towers, drones, and aircraft to satellite pixels;
4. Collecting ground reference data about the accurate location of different species within an image to help develop a spectral library that can address the biological entity labelling challenge.
TemporalField ecologists usually take trait measurements at certain times of a season while remote sensing has the potential to repeatedly sample traits and community composition across timePlant FD can vary temporally. Following the common practice of field trait sampling, assume a static plant community that may never have physically existed in reality. By contrast, remote sensing has the potential to provide a phenological view of traits and FD1. Conducting repeated and consistent sampling of traits and community composition to provide enough high-quality calibration data for remote sensing;
2. Drone/field-based high throughput phenotyping using image-acquisition systems.
VerticalField ecologists can sample both canopy and sub-canopy species while satellite remote sensing has a limited capability in measuring the vertical profile of canopy spectraThere can be an underrepresentation of sub-canopy species in remote sensing-based trait and FD measurementsExploring cutting-edge hyperspectral LiDAR to characterize the foliar traits in full 3D

