1. Introduction
Earthquakes are considered as some of the significant damaging forms of natural hazards, and they regularly happen with a little notice to entirely without any notice. They usually cause massive destruction to properties such as buildings and infrastructures, as well as the environment [
1]. Moreover, human life is threatened during high-intensity earthquakes, especially in populated areas. While earthquakes are not preventable, responding to them can be changed. Therefore, the exposure of the affected areas is very important for distributing relief resources such as food, medicine, and shelter [
2]. Remote-sensing (RS) technologies have been presented to be valuable tools for damage detection and estimations for post-earthquake emergency responses [
3].
Various RS data generally used for earthquake damage detection include optical, light detection and ranging (LiDAR) point cloud [
4], synthetic aperture radar (SAR) [
5], and aerial and unmanned aerial vehicle (UAV)-based orthophoto imageries [
6]. Optical sensors for the direct recognition of damages in the constructions suggested having a quality resolution (e.g., greater than one meter) [
7]. Yet, such a condition is often costly and typically only covers a minor part of a region; additionally, the atmospheric conditions such as cloud coverage can affect the viewing capacity [
1]. The LiDAR point cloud is another useful tool for earthquake damage detection, as it can benefit from three dimensional (3D) information from the digital surface model (DSM). However, the application of LiDAR data is still few compared with other RS technologies, as this kind of dataset is not often available, especially before a disaster [
2]. SAR can obtain data in day/night and under any weather conditions; however, orientation, shape, and material constituents of certain objects might affect the quality of the data [
8]. Aerial and UAV-based orthophoto imageries are flexible data acquisitions both to flight patterns and time [
9,
10]. Moreover, these data have higher spatial resolutions compared to satellite imagery sensors that make them more appropriate for comprehensive inventories [
11]. When a large-scale earthquake occurs, tremendous time is needed to visually interpret the aerial images. Therefore, it is more efficient to automatically detect damaged buildings using intelligent techniques such as machine learning (ML) [
12].
Recently, deep-learning (DL) approaches (mainly convolutional neural networks (CNNs)) have shown to be promising for discovering the necessary features in works, such as collapsed-buildings identification [
13,
14]. CNNs have also vastly been used in different applications, such as classifications, speech recognition, and the detection of various objects. Although plenty of studies have recently employed CNNs for damage detection, most of these techniques are designated for the detection of a maximum of two or three levels of classes, including undamaged, moderately damaged, and severely damaged [
12]. Many studies investigated the performance of CNNs and different integrated techniques for recognizing damaged and undamaged areas from high-resolution remote imagery [
15,
16,
17]. Certain strategies—for example, a combination of CNN with features of point clouds—were carried out to identify the damaged areas through two classes of damaged and undamaged utilizing aerial photos. Another strategy of using DL in damage recognition could be employed by adding a field photograph to the aerial images to increase the accuracy of the damaged classes [
18]. A combination of multiscale segmentation with CNN is another approach to increase the classification accuracy of recognizing two classes of damaged and undamaged [
13]. Combining images with a different spatial resolution assisted by the capability of CNNs could also improve detecting damaged and undamaged classes [
19].
Utilizing pretrained CNN models (e.g., VGGnet), as well as data augmentation, proved to be an effective approach at detecting collapsed and noncollapsed buildings [
12,
17]. Moreover, texture features and CNNs for feature extraction and then utilizing different classifiers instead of CNNs could also improve the recognition of collapsed and uncollapsed buildings [
16]. The approach of combing CNNs with geographic information system (GIS) data (such as block vector data) could also play a positive role in recognizing three damage levels for groups of buildings block [
20].
As per the literature, CNN, as a state-of-the-art algorithm, could efficiently contribute to assessing the damages caused by earthquakes, especially to recognize the levels of multi-class damages. This research aims to develop three different CNN architectures to identify four classes from pre- and post-event RS imageries and reveal the design that works the best for this purpose. In summary, the contributions of this study are twofold. First, three custom CNN architectures are used on pre- and post-event RS imageries to determine the effects of each CNN architecture on accuracy. The pre- and post-event images were captured at different resolutions (16 and 25 cm, respectively). Each image from both categories was registrated using its original resolution without change. Second, the four classes (background, no damage, minor damage, and debris) were considered without having the altitude information of the buildings. The following section reviews the previous and latest studies that applied diverse techniques to detect various levels of damaged buildings from different RS imagery.
Related Studies
The automatic approaches can identify the damaged building by extracting the defect features. However, different architectures, design methods, and widely changing real-world settings are still challenging these methods. Numerous studies have been done using standard ML approaches for building damage estimations post-earthquakes. Moya et al. [
2] evaluated three methods for collapsed building detection after the 2016 Kumamoto earthquake’s mainshock. These were the
threshold, the support vector machine (SVM), and K-means clustering. Results showed the Kappa coefficients of 0.80, 0.80, and 0.76 for all three methods, respectively. In Moya et al. [
3], the authors developed a new unsupervised approach for the classification of collapsed and noncollapsed buildings using a combination of traditional ML methods with probabilistic damage mapping, which is called IHF. They used TerraSAR-X satellite images from the Great East Japan earthquake and tsunami, 2011. Their results showed an overall accuracy (OA) of 80% compared to the field survey. Rupnik et al. [
11] developed an automatic workflow for the detection of the damaged building using semi-supervised random forests (RF) and unsupervised
and K-mean methods from airborne nadir imageries. Three classes were identified: (i) damaged buildings, (ii) intact buildings, and (iii) others. The results showed the number of detected damages against the total number of damages were 78.26, 71.74, and 73.91 by using RF,
, and
, respectively.
In recent years, it has been demonstrated that utilizing deep neural network models provides high performances compared to other supervised ML methods [
21]. For instance, Li et al. [
22] developed a workflow using DL for buildings based on a single-shot multi-box detector (SSD). Aerial imageries collected from USA’s 2012 Hurricane Sandy were used as the dataset. The authors detected two classes, (i) debris and (ii) mild, with high detection precision (79.5% and 70% for debris and mild, respectively). Nex et al. [
14] developed an autonomous real-time solution for damage detection using a combination of the morphological filter (MF) and CNN. The results showed that the precision accuracy is improved from 0.573 to 0.839 when the MF is combined with CNN to compare with using only MF. Tamkuan et al. [
1] used a combination of Landsat-8 and interferometric (Advanced Land Observing Satellite) ALOS-2 coherence to detect damaged buildings post the 2016 Kumamoto earthquake. Three levels of damage classes were identified: (i) none-to-slight, (ii) slight-to-heavy, and (iii) heavy-to-destructive. Results showed the OA to be at 90.58% with a Kappa coefficient of 0.854. Erdogan et al. [
4] developed a novel method based on the geometric characteristics of buildings to define perimeter ratios of building damage detection. Pre- and post-earthquake aerial images with the 0.3-m ground sample distance (GSD) and DSM was used to study the 2011 Van City, Turkey earthquake. They classified the damaged building into two classes: (i) destroyed buildings caused by the earthquake and (ii) destroyed buildings caused by other reasons. The result showed an average accuracy of 24% by orthophotos differences in their works. However, the successful results were obtained by DSM differences with an accuracy of 70%. Chen et al. [
23] applied the SVM algorithm to evaluate the earthquake damage degree from aerial photos collected by UAV. The index of damage degree evaluation (DDE) was used to describe the destruction level after the event. Bai et al. [
24] enhanced the operational damage mapping framework using the U-net convolutional network implemented within the cognitive toolkit to detect damages caused by the Tohuku earthquake-tsunami that happened in 2011. Bai et al. [
24] utilized a high-resolution four bands of WorldView 2 dataset for their analysis, and the damages were categorized into three classes, namely washed away, collapsed, and survived, at the pixel level. Their method achieved 70.9% of OA due to the drawback lays in the single optical sensor. Vetrivel et al. [
25] developed an automatic method for disaster damage detection via integrating DL CNN and 3D point clouds. They used aerial photos (10–16 cm) and UAV images (1–5 cm) for different geographic locations such as Haiti, Nepal, Italy, India, Peru, Taiwan, and Germany. The average accuracy of their model improved by 3% compared to the use of only CNN classification by 94%. The model scored an accuracy of 85% on the test data. Miura et al. [
26] also built their own CNN for damage detection, where aerial images from the 2016 Kumamoto earthquake were used as input to identify collapsed, noncollapsed, and blue tarp-covered buildings. They found that the over- and underestimations of the classes occured due to the complexity in distinguishing small features around the buildings and solar panels on building roofs from building rubbles. The authors, however, believed that future improvements can be achieved by enhancing the training samples to include soft-story collapses and solar panels on the roofs.
The outcomes of the previous studies demonstrated that most ML models utilize DL techniques as an effective way to detect two or three damage classes, with a majority range of accuracy varies from 70% to 90%. Nevertheless, to the best of the authors’ knowledge, limited studies utilized CNN models to classify the damage levels of individual buildings into four classes using different structure designs. This study proposes a robust earthquake-induced building damage detection based on various CNN architectures using pre- and post-event orthophoto imageries acquired by a fixed-wing airplane near the Mashiki residential area, Japan. In this research, three different CNNs models, namely composite, twin, and fusion, were developed to detect four damaged classes after the Kumamoto earthquake event in 2016. The specific objectives were: (i) to develop experiments over three CNNs models, namely composite, twin, and fusion models, for building damage recognition from orthophoto imageries; (ii) to evaluate the performance of proposed models using statistical indexes such as F1 score, OA, producer accuracy (PA), user accuracy (UA), and perform sensitivity analysis to ensure their robustness; and (iii) to investigate the effects of CNN architecture on the accuracy.
2. Materials and Methods
2.1. Study Area and Data Acquisition
The Kumamoto earthquake was triggered with a seismic intensity of 6.2 Mw at the West-Central Kyushu Region, Japan, on 14 April 2016. The mainshock (at 7.0 Mw) occurred near Mashiki (residential area) on 16 April 2016. These earthquakes led to more than 1600 injured and 67 killed based on the report of the Japanese Red Cross provided on 17 May 2016. Moreover, more than 85,000 constructions, infrastructure facilities, and roads were destroyed over a wide area of land because of powerful seismic ground motions [
2].
Two orthophotos are collected before and after the mainshock over Kumamoto with a spatial resolution of 16 and 25 cm in the year 2016 (respectively on the 15th and 23rd April). These datasets were acquired using airplanes over the urban area, which had the most damage. In order to focus only on buildings, we utilized the geocoded building footprint provided from Japan’s GSI (geospatial information authority). They were georeferenced into the same projection of the orthophoto imageries.
Figure 1 shows the study area and orthophoto images before and after the mainshock.
2.2. Ground Truth Data
The four classes considered in this study were (i) no damage, (ii) minor damage, (iii) debris, and (iv) background.
Table 1 shows examples of different classes available in the orthophoto images. The building polygons and backgrounds are coded with four colors of classes (refer to
Table 1). The visual interpretation results are then constructed as GIS data based on the geographic data provided by GSI (2018).
Figure 2 shows the percentage of ground truth (GT) dataset pixels for each class. The percentages of GT pixels showed a tolerance of 2.91% as the minimum (debris class) to a supreme of 72.35% (in the background class). The number of GT pixels for the minor damage class was about 7.96%. The percentages for the no damage showed a value of 16.78% (twofold more than the minor damage). This was done to ensure that these GTs were representative of the whole classes. For example, the backgrounds of the images were more than the other classes, so a well-conducted classification would try to maintain this ratio in the GT sample. The details for the GT data are shown in
Table 2.
2.3. Image Preprocessing
Orthorectification is one of the early and essential steps before image processing and object recognition. This step is necessary for precise mapping and classification, especially for building damage detection. Without the orthorectification process, the sensor shows a greater area compared to the real one, which is not accurate. Accordingly, shortage in this step not only could lead to uncertainties in classifications but, also, could cause inaccurate change detection analysis [
27]. The geometric accuracy is affected by the number of ground control points (GCPs), accuracy, and distribution of the points [
28,
29]. In this study, two datasets before and after the 2016 Kumamoto earthquake mainshock were registered by using their original resolutions (i.e., 16 cm and 25 cm, respectively), with considering the GCPs, via random, systematic, and convenient choosing methods in the JGD2000 system.
Unbalanced data can be a problem when training a ML classification algorithm. This is when the number of examples (or observations) from one class extremely outweighs another. In this study, the data for damaged buildings are much lower than no damage or background, which can lead to poor overall generalization, specifically for the class that has the fewest examples. As a solution, we adopt oversampling to increase the number of observations.
A typical step to all kinds of neural networks is the need for normalization. Normalization is a preprocessing technique to make sure that the data is consistent and has a uniform scale. In image processing, commonly used data preparation techniques include pixel normalization. In this step, the numeric pixel values are rescaled to be between 0 and 1 by dividing each pixel by 255. Normalization is often a required step in order to reduce the data dimension, which aids in drastically reducing the training time and improving the classification results [
30].
2.4. Methodology
In the present study, the RGB (red, green, and blue) form images of the mainshock event (before and after) were employed to identify the damaged buildings. The process of damage detection was executed by three different models using various CNNs structures that comprised multilayers to simulate the function of the human brain [
31]. These networks detect the classes in the image by a learning scheme utilizing a number of convolutional layers, which progressively develop the labeling task [
31]. Some hierarchical processes in the CNN classifier with learning filters would lead to update the weights to optimize the operation of feature extraction. CNNs improve the ability of automatic learning of the contextual features from the feeding images, providing a suitable platform for very high-resolution images processing [
32].
Artificial neural networks (ANN) generally consists of one input layer, several hidden layers, and an output layer. CNN, which is a type of ANN mainly used for image data, follows the similar convention. In this work, the input layer takes in images (before and after the mainshock). Many images are required to properly train a CNN to generate accurate results. After the input layer, a general CNN contains the following:
- (i)
Convolutional layer: Here, a convolution operation is applied to the input image and passes the results for its receptive field to the next layer [
33].
- (ii)
Activation function: This function is used to determine the output to be sent to the next layer of a neural network. It can also be attached between two different neural networks. Common activation functions are Tanh, rectified linear unit (ReLU), and threshold. ReLU is currently mostly used, as it is said to avoid the vanishing gradient problem [
15]. In this work, we applied the ReLU.
- (iii)
Pooling layer: This layer performs a reduction (i.e., down-sampling) of the convolution operation’s feature, with the hope of preserving important patterns. In this work, we use max pooling, where the maximum value from each neuron cluster in the prior layer is taken. In this work, each
window is max-pooled. It is worth noting that this step is also useful as the pooled patterns can be made scale and orientation invariants [
33].
- (iv)
Flattening: This layer is placed between the final convolutional layer and the fully connected layer. This layer basically converts any features from the previous layers into a vector (one-dimensional matrix) [
34].
- (v)
Fully connected layer (dense layer): This layer acts as a multi-layer-perceptron neural network (MLP), in which it attaches each neuron in a layer to each neuron in another one [
34].
Constructing a robust network requires extensive efforts to determine the most suitable layer numbers and the hyper-parameters, since there is no customary definition for the best of a network because of numerous factors (e.g., image size, complexity, amount of classes, training samples availability, etc.).
Typically, for each dataset, the ideal combinations of layers and the hyper-parameters are empirically recognized based on specific applications. That is why a huge quantity of training samples are required to lessen overfitting problems; therefore, these networks can be implemented only when a big enough quantity of the sample data is available for the training of the network. The features from this method can be denoted to a specific usage/data-specific features based on the specific learning of the usage/application (such as damaged buildings) and images with particular characteristics (e.g., orthophoto images) [
16]. Furthermore, it was suggested that the accuracy of the detection can further be enhanced using a variety of CNN structures [
22]. Therefore, this research developed three building damage detection models based on the CNNs, namely composite, twin, and fusion models, using different network structures. These models were used to classify the buildings into four classes, namely background, no damage, minor damage, and debris.
CNN Models
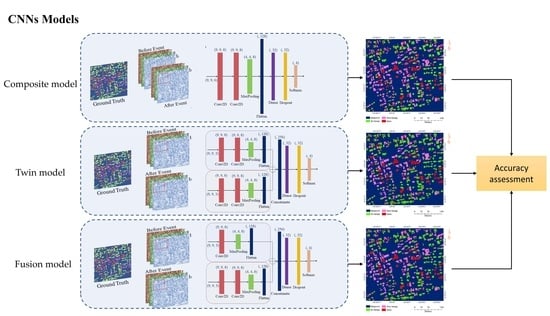
This research aims to develop and experiment with three CNNs-based models with different network structures for building damage detection, namely composite, twin, and fusion models. The first model aims to detect damaged buildings using stacking the three bands (RGB) of the orthophoto imageries (before and after the mainshock) to form a six-band raster image. This model is named as composite model. The second model uses the images (before and after the event) as different inputs. Each image is separately processed with a CNN model. The features were then concatenated before classification was performed. This model is called the twin, because the two CNNs models are identical. The third model is almost similar to the twin model; however, it uses different CNN models to process the images before and after the event; therefore, this model is named as the fusion model.
Figure 3 showed the flowchart of the proposed models.
Regarding the composite model, before and after the earthquake, orthophotos are assembled to form an image with six bands. Thereafter, a network of CNN with two 2D convolution layers and eight filters with a 3 × 3 window size are imployed. The quantity of filters needs to be set to a maximum of eight to avoid overfitting in training [
21]. The size of the window needs to be greater than the smallest size of an intermediate output (i.e., building) [
16]. The outcomes of the convolution then transited to a ReLU prior to down-sampling by a max pooling layer.
Then, a dense layer, including 32 neurons, trailing with ReLU activation and ending with a softmax dense layer (i.e., four neurons representing the final classes), was comprised. The dropout technique was also employed to elude the overfitting issue. Two dropouts with a value of 0.5 were employed after the max pooling layer and the dense ReLU. Optimization of the network was performed using the Adam optimizer (batch size = 32 for 100 epochs).
In the twin model, the CNN parameters are similar to the composite model; however, two independent CNN networks were applied to the orthophoto image before and after the mainshock. Moreover, a concatenate layer was applied to merge the CNN models applied to the images before and after the earthquake. In the last, the fusion model using independent CNN networks (similar to the twin model) was applied. The clear difference between the twin and fusion CNN model was that, in the fusion model, one 2D CNN was used before the mainshock image, while two 2D CNNs were applied to the image after the mainshock. However, in the twin model, both images (after and before mainshock) used the same CNN. The seed was considered as seven for all three models. The validation split of 0.5 was applied for the accuracy assessment, with an iteration of 100, using the adam optimizer. The batch size was considered as 32.
Table 3 presents the CNN parameters used.
2.5. Accuracy Measurements
In the experiments, we measured the four following metrics: (i)
, (ii)
, (iii)
and (iv) F1 score. A confusion matrix was formed to evaluate the classifier against the validation data [
35]. These metrics basically summarize the classifiers’ efficiency by comparing the number of pixels in the GT data. The above-mentioned metrics can be computed via the confusion matrix [
31,
36].
Overall accuracy can be obtained by the ratio of the entire amount of properly classified pixels to the entire quantity of the test pixels. The OA indicates a mean for the entire classification process and does not disclose the performance of the technique for an individual class. However, the PA and UA are used for an individual class.
The PA is equal to the error of omission (exclusion), and demonstrates how many pixels of the classified image for a given class is suitably (correctly) labeled in the reference data, while UA designates the likelihood that a predicted value in a specific class actually belongs to that particular class.
The accuracies above are obtainable through the following Equations (1)–(3), respectively:
where
denotes how many pixels were correctly classified in row
and column
and
is the total number of pixels in row
, and
is the total number of pixels in column
which claim to be in the map class.
The F1 score metric was computed using the confusion matrix. This metric is generally a mean weightage/harmonic mean of the metrics, i.e., precision () and recall ().
In the present work, macro-mean (macro-averaging) for all three metrics were carried out, providing a better explanation for the multi-class imbalance [
37]. In this approach, each metric was averaged over all the classes. Equations (4)–(6) denote the computations of these metrics:
The loss curve is another indicator that is used to evaluate the CNN performance, showing the improvement progress of the optimization and relative learning progress through numerous epochs [
31]. Some information loss occurred due to generalization during classification, affecting the completeness of the outcome [
31]. Equation (7) defines the loss function as the following;
Categorical crossentropy (CE) and the dice coefficients (DC) were used as the loss function in this work. CE is a common loss function used to evaluate the loss in multi-class classification tasks, whereas DC is useful when there are issues of class imbalances.
3. Results
The models were executed using Python 3.7.4 on the platform of Intel(R) Xeon(R) W-2125 CPU @ 4.00GHz Core-i7 system with 32 GB RAM. The performance evaluation of the three models is presented in
Table 4. The OA was recorded at 69.24%, 72.27%, and 76.86% when the composite, fusion, and twin models were applied, respectively. The OA appeared to increase by about 3.03% when considering the fusion model instead of the composite model. In addition, the OA was enhanced by about 4.59% when considering a CNN using the twin model instead of the fusion model. In general, the OA appeared to increase from 69.24% to 76.86% when considering a CNN using the twin model.
Moreover, the UA and PA were calculated for each class in all three models. In the composite model, the UA of no damage class was 0.712, and the PA was 0.702; however, the minor damage class showed the UA of 0.462 and the PA of 0.700. The debris class displayed the UA of 0.741 and the PA of 0.642, followed by the background class with the UA of 0.837 and the PA of 0.729. On the other hand, the CNN using the fusion model showed the highest UA in all classes, namely no damage (0.732), minor damage (0.508), debris (0.771), and background classes (0.865) compared with a CNN using the composite model. The PA appeared to increase from 0.702 to 0.716 for the no damage class, from 0.7 to 0.719 for the minor damage class, from 0.642 to 0.669 for the debris class, and from 0.729 to 0.787 for the background when considering a CNN using the fusion model. The UA of the minor damage class appeared to increase from 0.508 to 0.623; however, the PA decreased from 0.719 to 0.716 when considering the CNN using the twin model. On the other hand, the debris class showed the highest UA (0.775) and PA (0.754) based on a CNN using the twin model, as well as the background class with the UA of 0.982 and the PA of 0.797.
To further assess the robustness of the models, the F1 score measurement was also carried out considering the imbalance distribution of the samples. The highest F1 score referred to the CNN as 0.761 belonging to the twin model, and the lowest F1 score was recorded based on the composite model with a value of 0.682. Conversely, the CNN using the fusion model had an F1 score value of 0.714. According to the obtained outcome, the CNN model using the twin approach had comparatively more advanced accuracy than the composite and fusion approaches.
Figure 4 shows the validation curves (loss) of the three models. The loss of models continuously reduced in both the validation and training through 100 epochs, while the accuracies correspondingly improved. This prompted us to define an early stopping step to shrink the amount of training time, as well as to avoid overfitting.
Figure 5 illustrates the damage detection maps generated by CNN using three models. The results showed that, for all three models, the background is perfectly classified; however, the no damage building is classified with less accuracy. In detail, the composite model from a total of 112,417 pixels of no damage class only classified 78,932 pixels correctly, and about 17,312 and 11,673 pixels were misclassified as minor damage and debris, respectively. This can be seen in
Figure 6d–f, some parts of buildings are classified as minor and debris instead of no damage. Moreover,
Figure 6j illustrates an example of building misclassification (red square), where the composite model assigns it minor damage instead of no damage. On the other hand, the twin model was able to distinguish the debris and no damage classes better than the composite and fusion models.
4. Discussion
Regarding early disaster rescue activates, a detailed damage map is required after an earthquake happens. Orthophoto imagery from planes or drones will often be limited in their instrument payload capabilities, making the reliance on RGB even more critical. Furthermore, RGB imagery is also advantageous for visual inspection; if an emergency procedure requires emergency responders to verify some of the damage predictions before actions are taken, it is much easier for the untrained eye to inspect the RGB bands as opposed to bands from the invisible spectrum, which are unnatural [
38]. Evaluating the damage level of buildings can support humanitarian aid and related organizations to recognize the affected zones rapidly. Nevertheless, performing this operation in its manual form is a slow and dangerous process, as aid personnel is needed to investigate through the damaged and hazardous areas.
Remote technologies (e.g., satellite imagery and UAVs) are used as options to gather statistics from impacted regions. While the remote sensors gather the data, individuals can analyze it through visual interpretation. Although humans in the loop is essential in practice, depending only on individuals could be led to misjudging and time-wasting, especially in the critical time after a disaster. Thus, state-of-the-art methods (e.g., DL and CNNs) have regularly been developing to offer solutions to the disadvantages of traditional approaches. The key benefit of CNNs is to extract features automatically. This benefit can incredibly save a lot of effort compared with old image-processing techniques.
CNNs can learn the constant features from massive images in training. If certain misclassifications happen in the process, the only necessary response is to prepare the misclassified records and retrain the network. The advantages mentioned above sort CNNs like cutting-edge techniques in hands-on/actual challenges; nevertheless, requiring an extensive dataset is a shortcoming, as it may not always be available.
This paper evaluates orthophoto data for the detection of earthquake-induced damaged buildings through three CNNs models: composite, twin, and fusion. The damaged maps were classified into four classes, namely background, debris, minor damage, and no damage. It was found that background can be identified precisely from the three models. However, minor damage is classified with the lowest accuracy in all three models.
Figure 6p–r shows an example of when a building (red square) is mostly misclassified by all the models as background instead of minor damage. The misclassification might relate to the nature of triple-band orthophotos and their resolutions. Overall, although some degrees of misclassification still exists among the classes, the applicability of the adopted frameworks exhibited satisfactory performances in detecting multi-class damages.
Figure 7 shows a comparison between the accuracy achieved using the UA and PA in each class. The higher accuracy is achieved using a twin model in the no damage and background classes, and the lowest one is achieved in the debris class using the composite model.
Figure 8 shows that the twin model achieved a better result of 76.86% OA and a 0.761 F1 score compared with the fusion (72.27% OA and 0.714 F1 score) and composite models (69.24% OA and 0.682 F1 score). In the twin model, we applied two independent CNNs to the orthophoto images, i.e., before and after the mainshock. Both the CNNs were made up of two convolutional layers with the same hyper-parameters. Our intuition was that this could work better mainly due to the presence of two convolutional layers, which are expected to learn more features. On the other hand, the fusion model’s one-layer setup was not capable enough to efficiently extract meaningful features. Nevertheless, adding more layers unnecessarily to any CNN will increase the number of parameters, and increasing unnecessary parameters will only lead to overfitting the network. That is why establishing a robust architecture is completely dependent on what the requirement is and how the data is.
Table 5 shows samples of the affected buildings whose rooftops are covered with blue tarps. These buildings were already recognized and determined (by the authorities) to have inflicted minor/massive damage. Due to the color of the roof, some misclassifications occurred. We believe, however, similar to Miura et al. [
26], that the blue tarp-covered rooftops could be considered as a separate class.
As mentioned in
Section 2.1, two massive earthquakes hit Mashiki in Kumamoto on the 14 and 16 April 2016. A few buildings were damaged by the earthquake on April 14.
Table 6 illustrates buildings that were already damaged based on aerial photos taken on April 15. The photos showed the buildings in the study area that were already damaged before the April 16 earthquake. These buildings (subset 1–5) were identified as minor damage in the GT, because although these buildings were damaged in the April 14 earthquake, more damage happened on April 16. In the present experiments, the CNN models were able to recognize the condition of these buildings after the mainshock earthquake occurred on 16 April 2016, so that, in all subsets, the models classified these buildings as minor damage. Therefore, all CNNs models were almost capable for the detection of such damaged buildings that were already damaged by the earthquake on April 14 and had more damage happen on April 16. We anticipate the reason is that the training data worked well, and the structure of the models exhibited a promising functionality.
Generally, the results of this study can be improved by employing additional spectral bands or high information extracted from LiDAR; however, given the limited response time in post-earthquake events, using this information has certain limitations (e.g., being costly in time and processing). Overall, knowing that the RGB source images are the most common and least-costly options available very often, the majority of classes in dissimilar circumstances were well-distinguished; such damage recognition has always been a challenging issue, especially when only one source RGB orthophoto is used during disaster events. These cameras can easily be used over various platforms such as UAVs, which are nowadays becoming very popular.
5. Conclusions
This study analyzed the use of three CNNs models, namely composite, twin, and fusion, for earthquake damage detection. The RGB images before and after the mainshock during the 2016 Kumamoto, Japan earthquake were selected as the study area. The results showed that the twin model damage detection demonstrated an OA of 76.85 and a F1 score of 0.761. Overall, the proposed framework was found to be acceptable for building damage detection from RGB images. Particularly, the accuracy obtained on the model was without utilizing the elevation information in the study area, which made it more challenging, and the CNN models achieved an acceptable accuracy. The outcome of this study could be useful to further support of the experts in geosciences, disaster managers, and authorities in recognizing the correct damaged areas and speeding-up the response time to help the victims, specifically when the data resources and tools are limited. In the future, we intend to investigate CNNs that can detect and classify damaged buildings using only a post-earthquake image, as, in many cases, the images before the earthquake were not available. Moreover, comparisons with other CNN and/or DL architectures for image classification will also be done in order to see which one performs best.


