1. Introduction
The reflection of visible and near-infrared (NIR) wavelengths, captured by means of remote sensing techniques, has been widely used to nondestructively monitor various characteristics and patterns of vegetation [
1]. The spectral reflectance of blue and red wavelengths decreases, while that of the NIR wavelengths increases as the biomass of healthy vegetation increases [
2]. The spectral reflectance has been used to calculate vegetation indices. Among them, the normalized difference vegetation index (NDVI) has been utilized to detect crop production [
3], change in vegetation phenology due to climate change [
4], effects of disasters such as forest fires [
5], and agricultural drought [
6].
In particular, the utilization of satellite data for precision agriculture increased after the launch of the Sentinel-2 satellites, which carries sensors for wavelengths that are useful for producing vegetation indices [
7]. Two satellites, Sentinel-2A and Sentinel-2B, were launched in June 2015 and March 2017, respectively. Their combined temporal resolution period was 5 days [
8]. Nevertheless, surface information sometimes cannot be acquired because of interference by clouds, aerosols, moisture, or fog. Moreover, monitoring a crop in the booting stage is difficult, and so is identifying vegetation conditions under stress related to a disease or a heatwave [
9,
10]. Some studies argue that satellite data with higher spatial resolution are required for precision agriculture [
9,
11].
These limitations can be overcome using unmanned aerial vehicle (UAV)-based remote sensing techniques. Multispectral cameras on UAVs can capture data that are useful for evaluating vegetation conditions [
12,
13]. A UAV can cover comparatively small areas, but can provide data with a ground sample distance (GSD) of a few centimeters, thereby offering improved spatial resolution compared with that of satellites [
14]. Moreover, UAVs offer flexible measurement schedules [
11,
15].
NDVI values measured from satellite and UAV data were compared to those obtained from ground-installed sensors and field spectrometers (or handheld spectrometers) [
16,
17]. Ground-based data are normally considered as “true reference sources” owing to the fact that the distance between the sensor and the measurement target is small. Ground-based remote sensing data show minimal atmospheric effects at altitudes lower than 10 m [
18]. Given that scans of ground-installed optical devices are frequent [
19], these devices can provide information on the crop condition continually. Meanwhile, spectral information obtained at different spatial scales can enable a comprehensive characterization of the vegetation in a target area. Ground-based vegetation data may reflect the spectral characteristics of a crop growing on homogeneous land. However, satellite-based data can provide information on heterogeneous land types. In particular, the presence of ridges and furrows can affect the comparison of data from different sources [
15]. Therefore, the spatial characteristics of the data obtained from ground-based, airborne, and spaceborne sensors should be taken into account when making comparisons across data. In previous studies, the spatial characteristics of vegetation indices were only compared under specific spatial scales: comparisons between UAV and satellite data [
15,
20] or between ground-based data and satellite data [
16] were carried out.
The purpose of this study is to compare NDVI values obtained at different spatial scales (from 5.5 mm to 10 m) in garlic and onion cropland to understand their spatial characteristics. The NDVI data used in this study were obtained from ground-based sensors (a leaf spectrometer, field spectrometers, and spectral reflectance sensors (SRSs)), a multispectral camera onboard a UAV, and a multispectral instrument mounted on a satellite. The NDVI values were compared using statistical metrics. Next, the UAV-based NDVI data were upscaled to the pixel size of the satellite-based NDVI data to evaluate how the results of the comparison changed.
2. Materials and Methods
2.1. Study Area and Crops
The study area (34.968°N, 126.4515°E) is a plot of land at the Bioenergy Crop Research Institute in Muan County, South Korea. Garlic and onion were being cultivated in this plot. They are considered representative vegetable crops in South Korea as they are the essential ingredients for almost every delicacy (including Kimchi, a typical Korean food) [
21]. The crops were cultivated from October 2017 to June 2018. In particular, the garlic cultivars
Hongsan,
Namdo, and
Daeseo and the onion cultivar
Sunpower were used. The ridges and furrows were 1.2 m and 0.6 m long, on average. In the garlic field, the planting distance was 13 cm and nine plants were cultivated in each row. In the onion field, the planting distance was 15 cm and six plants were cultivated in each row. Garlic and onion begin to grow during autumn, then enter a dormant stage in winter in response to the low air temperature, and resume their growth in spring. In the study area, the mean (2001–2019) air temperature was 13.42 °C and the mean cumulative precipitation was 1282.5 mm/year according to data collected at Muan station, an automatic weather station of the Korea Meteorological Administration located approximately 2 km from the study area.
2.2. Ground-Based Remote Sensing Measurements
Ground-based remote sensing measurements were performed using a handheld leaf spectrometer, handheld field spectrometers, and ground-installed SRSs to obtain NDVI data. In particular, the leaf spectrometer (CID CI-710, Bio-Science, Camas, WA, USA) was used to obtain spectral reflectance information on garlic at a leaf spatial scale at three locations (G1, G2, and G3, see
Figure 1a). This device can measure the spectral reflectance in the range of 400–950 nm with a sampling interval smaller than 0.215 nm. The diameter of the leaves on which the leaf spectrometer measurements were performed was 5.5 mm. The measurements were repeated three times on each leaf, and 10 leaves were measured at each site to obtain a representative measure of the crop condition.
Two field spectrometers (AvaSpec-UL2048L, Avantes BV, Apeldoorn, The Netherlands) were used to monitor the crops at visible and NIR wavelengths (from 350 to 1050 nm). The sampling interval at 700 nm was 0.576 nm. The field of view (FOV) of the bare fiber-mounted field spectrometer was 23°. One field spectrometer was used to monitor the sunlight reflected by a white reference panel (RS50 White Reflectance Standard, StellarNet Inc., Tampa, FL, USA) that provided > 97% reflectivity of visible and NIR wavelengths. The other field spectrometer was used to monitor the light reflected from the crops at a height of 70 cm from the crop canopy. The measurements were averaged over 10 observations to minimize the observation error; three samples at each position were monitored to obtain representative results of the crop conditions. In particular, measurements were conducted at 13 locations during solar noon. The reflectance was calculated using irradiance and radiance data, which were recorded simultaneously. In addition, cross-calibration values were applied over the entire range of wavelengths monitored by the two spectrometers.
The leaf and field spectrometer measurements were conducted immediately after or before the UAV measurements to ensure correspondence across the data [
19]. The NDVI values were calculated from the spectral reflectance converted to 1 nm intervals, as follows: NDVI = (R
840 − R
665)/(R
840 + R
665), where R
840 and R
665 are the spectral reflectance values for 10 nm of bandwidth.
The SRSs (METER Group, Inc., Pullman, WA, USA) were installed near the ground surface to monitor the crop conditions at six locations continually (
Figure 1b). The SRSs working at 650 nm and 810 nm (with 10 nm of bandwidth) are based on photodiode sensors and consist of upward- and downward-facing sensors with FOVs of 180° and 36°, respectively. The SRS data were stored in data loggers (EM50, METER Group, Inc., Pullman, USA) every 2 min. The distance between an SRS and the plant canopy was approximately 70 cm and the height of the downward-facing sensor was adjusted to maintain a constant distance by accounting for the plant height. The NDVI was calculated from data measured from 11:00 to 14:00 local time in order to minimize the solar zenith angle for each day. The SRS-based daily mean NDVI (hereafter NDVI
SRS) was obtained after excluding the 15% largest and 15% smallest NDVI values.
2.3. UAV-Based Remote Sensing Measurements
The eight-propeller DJI S1000 UAV (SZ DJI Technology Co., Ltd., Sham Chun, Guangdong Province, China), equipped with a multispectral camera (RedEdge, Micasense, Inc., Seattle, WA, USA), was used in this study [
22]. This multispectral camera has blue (center wavelength: 475 nm; bandwidth: 20 nm), green (560 nm; 20 nm), red (668 nm; 10 nm), red edge (717 nm; 10 nm), and NIR (840 nm; 40 nm) bands, which were used to evaluated the NDVI (hereafter UAV
NDVI). The FOV (imager resolution) of the multispectral camera was 47.2° (1280 × 960 pixels).
The UAV-based remote sensing measurements were conducted four times after the dormant stage of garlic and onion (
Table 1). The flight altitude was set to 30 m with a mean GSD of approximately 2.18 cm (multispectral camera), with 80% forward and sideways overlap. The UAV-based raster data were obtained at solar noon. A calibrated reflectance panel (Micasense, Inc.) was utilized to obtain the reflectance data from the multispectral camera. The UAV-based imagery was processed using Pix4D software (version 4.3.31). Information on the seven ground control points (GCPs) was obtained using a GRX2 GNSS Receiver (SOKKIA Corporation, Olathe, KS, USA).
2.4. Satellite-Based Remote Sensing Measurements
High-resolution satellite data are useful for the continuous monitoring of cropland at a regional scale. In this study, data from the multispectral instrument (MSI) onboard Sentinel-2 were compared with the ground- and UAV-based NDVI values obtained for the cropland in the study area.
Sentinel-2 data were downloaded from the Copernicus Hub of the European Space Agency (ESA) [
23]. Level-2A data of Sentinel-2/MSI from March 2019 to May 2019 were obtained, on which geometric processing and atmospheric correction were performed. The data covered a target area that included the study area. NDVI values (hereafter NDVI
Sentinel-2) were calculated from the reflectance in band 4 (red; center wavelength: 665 nm; bandwidth: 30 nm) and band 8 (NIR; 842 nm; 115 nm) after excluding cloud pixels through a scene classification map. The spatial resolution of Sentinel-2/MSI is 10 m in the red and NIR bands. Four dates were selected to perform the comparison with the ground- and UAV-based data: 29 March 2019, 18 April 2019, 3 May 2019, and 13 May 2019 (
Table 1). The time differences between the UAV and satellite measurements were 1, 2, 0, and 4 days, respectively. These differences were deemed acceptable, as the NDVI values of garlic and onion crops do not change significantly during a few days under non-stress conditions.
2.5. Methods Used to Compare the Values Measured at Different Spatial Scales
To allow for objective comparisons, a set of criteria was adopted. In particular, two approaches were followed. In the first approach, the NDVI values were calculated from the data obtained by the ground-based sensors without further processing. In contrast, the UAV-based remote sensing data were first averaged over the pixels belonging to a region of interest (ROI) using the geospatial data abstraction library. The ROI was set at each ground measurement spot as a diameter (area) of approximately 82.0 cm (0.528 m2) considering the length of a ridge and the geolocation error of the NDVIUAV data. The Sentinel-2/MSI-based data were extracted using the nearest neighbor method for each spot. The correlation coefficient, absolute bias, and root mean square error (RMSE) were used to evaluate the relationships among the NDVI values measured at different spatial scales. A bias-corrected RMSE was also calculated.
The second approach entailed the upscaling of the UAV data to the scale of the Sentinel-2/MSI data.
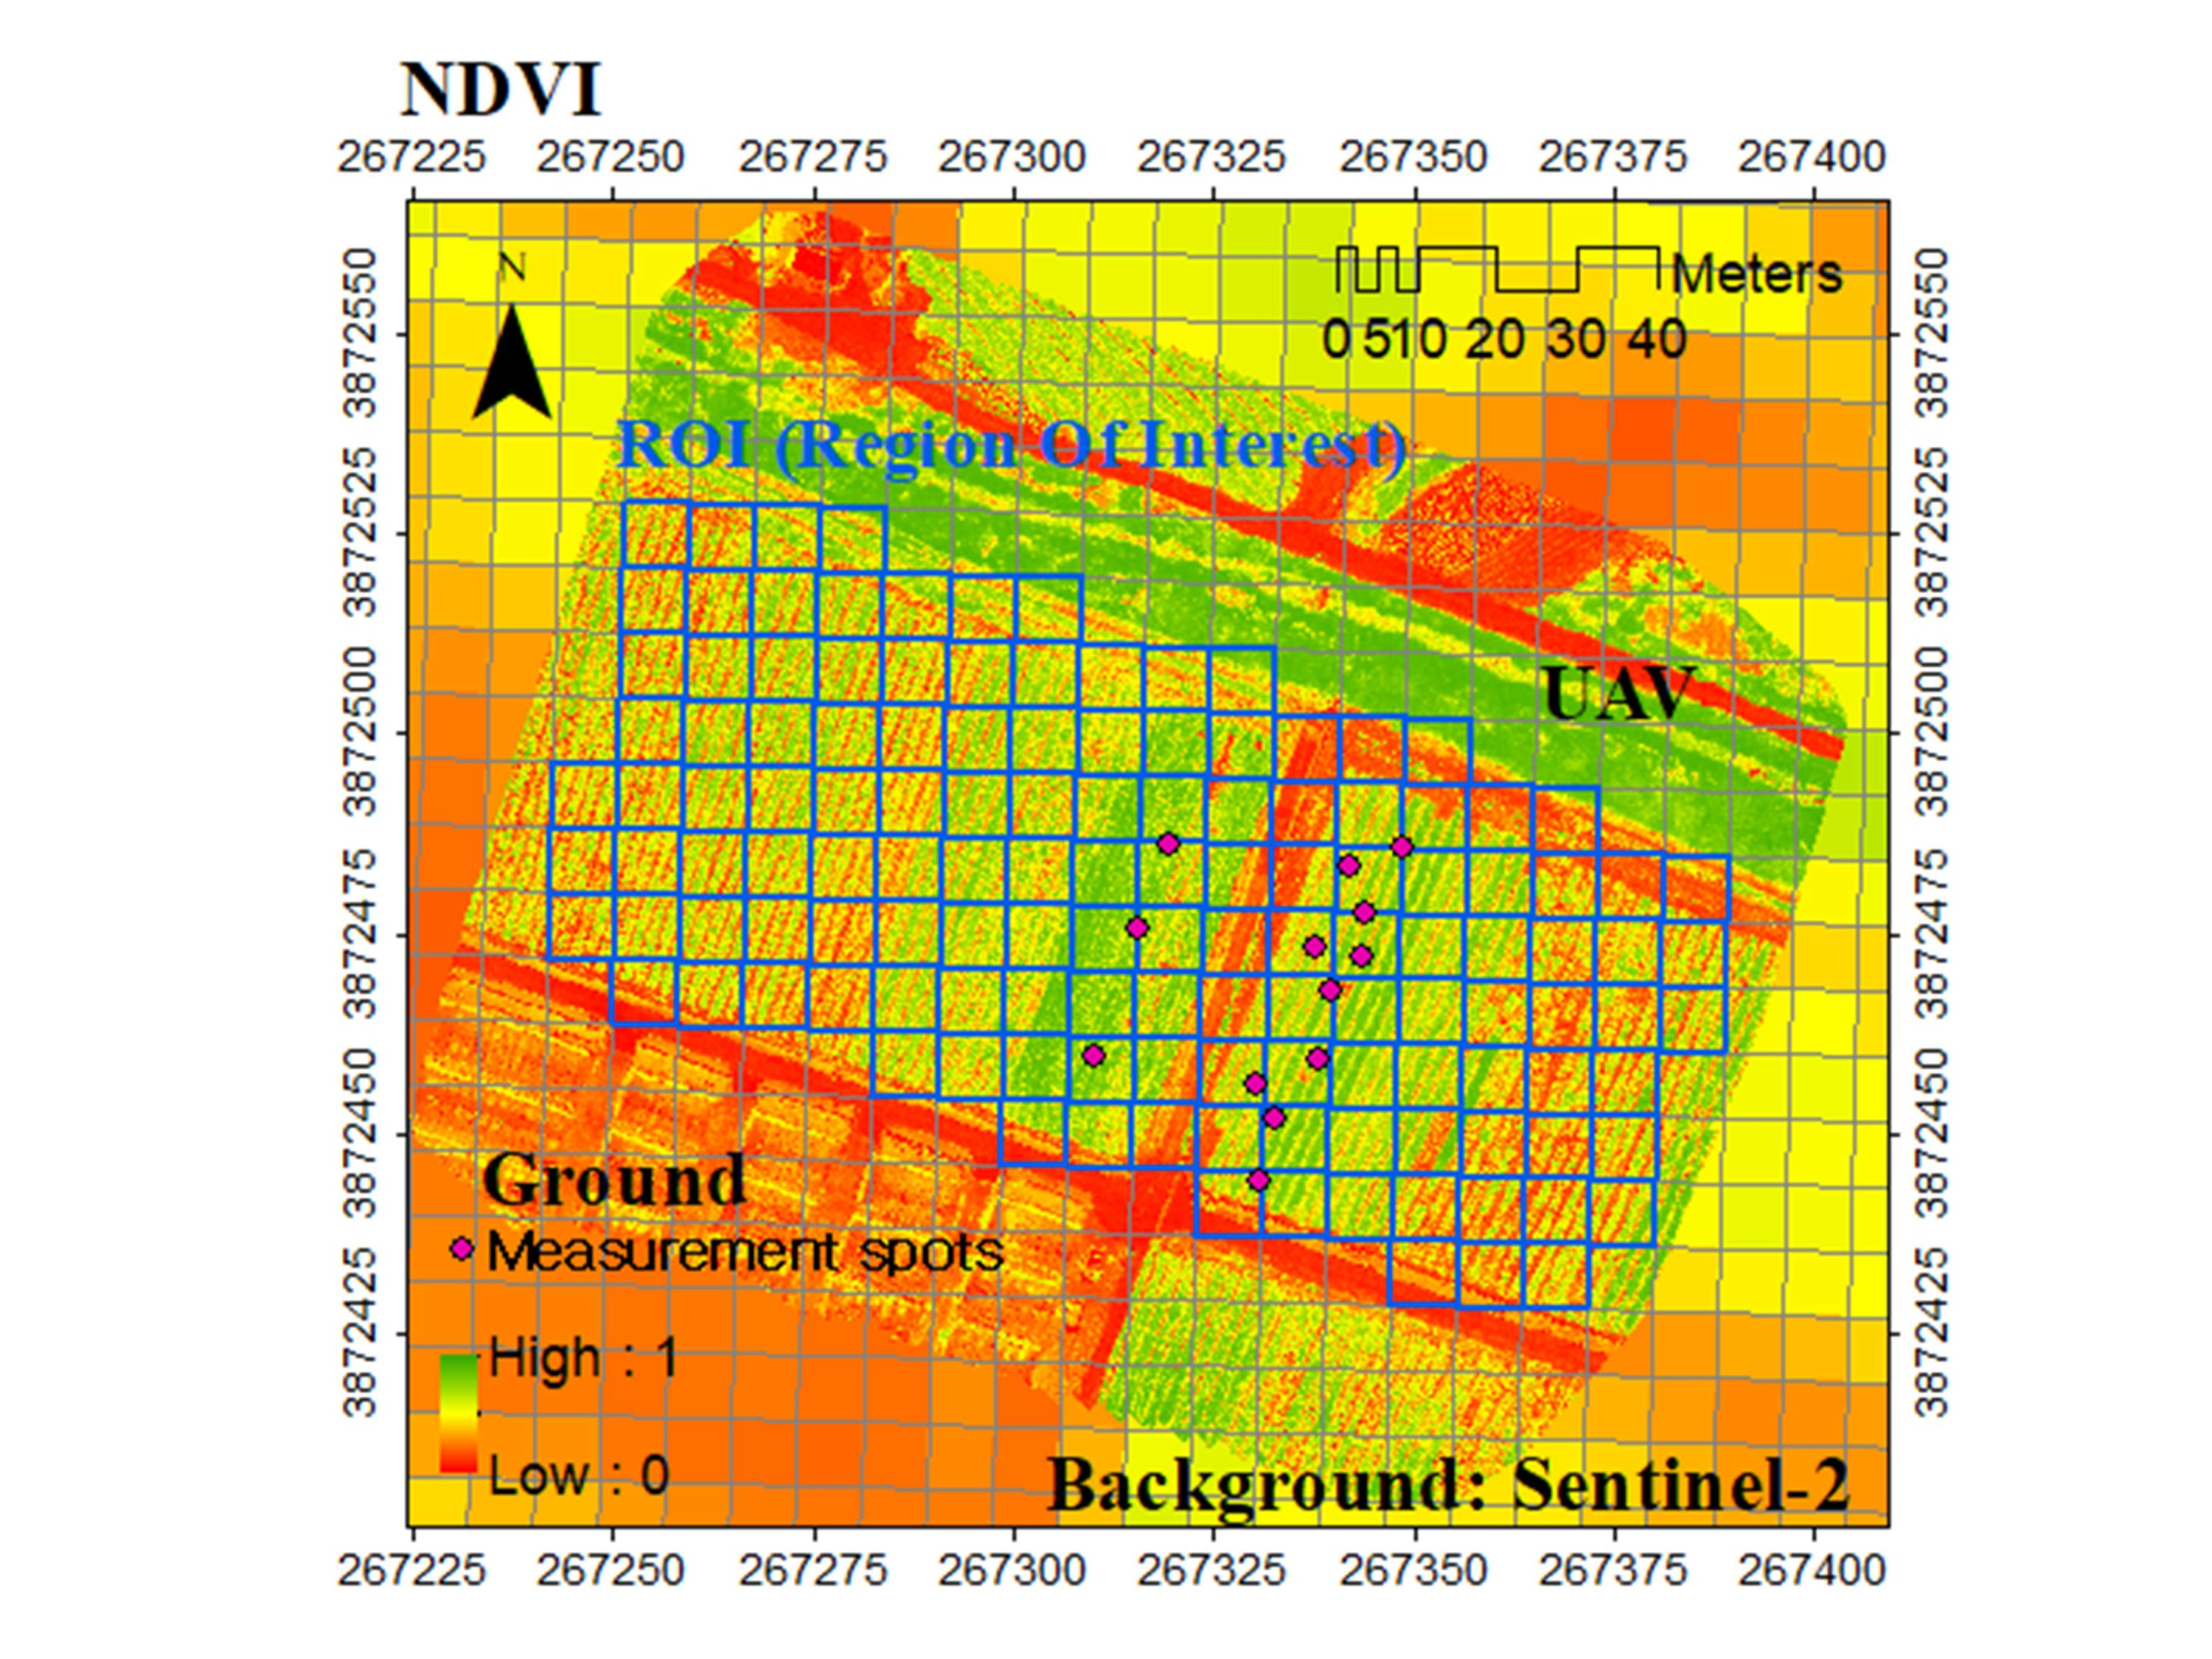
Figure 2 shows the NDVI map acquired using UAV and satellite data. The background of
Figure 2 shows the NDVI
Sentinel-2 and NDVI
UAV data overlapped over the NDVI
Sentinel-2 data. The grey lines indicate the boundaries of the pixels of the NDVI
Sentinel-2 data. The blue grids indicate the selected ROI based on the Sentinel-2 pixels, which represent the cropland. The NDVI
UAV values were averaged over the Sentinel-2 pixels (each blue pixel). This calculation yielded “upscaled NDVI
UAV values” [
24]. The relationship between the upscaled NDVI
UAV and the NDVI
Sentinel-2 values was evaluated (in terms of the homogeneity of one pixel) through a coefficient of variation (CV), which was calculated as the standard deviation divided by the mean value. Additionally, the normalized RMSE (NRMSE) was calculated as RMSE/(Y
max. − Y
min.) × 100 to understand the relative difference of the errors in the four measurement dates. Y
max. and Y
min. are the maximum and minimum values, respectively, of the variable on the y-axis.
4. Discussion
The different footprint sizes of the sensors can be deemed attributable for the differences in NDVI values and ranges. The NDVI is a proxy for the structural condition of vegetation. In particular, NDVI
Leaf values refer to areas fully covered by vegetation (i.e., to individual leaves), even though the NDVI includes chlorophyll information from the red band data [
25]. Therefore, the range of variation of the NDVI
Leaf values is smaller compared with that of the NDVI values obtained from the other sensors.
All comparisons between couples of NDVI data series from different sensors are statistically significant, with the exception of those involving NDVI
Sentinel-2 data (
Figure 3). In particular, NDVI
UAV had a correlation coefficient higher than 0.933 (
p-value <0.0001) with NDVI
Field and NDVI
SRS. This implies that the NDVI
UAV values are reliable in clear sky conditions. On the contrary, NDVI
Leaf, NDVI
Field, and NDVI
UAV are not significantly correlated with NDVI
Sentinel-2. It should be noted that the spatial resolution of Sentinel-2 is approximately 10 m, implying that each pixel of a Sentinel-2 image comprises both crop and bare soil areas owing to the presence of ridges and furrows. However, by upscaling the NDVI
UAV data to the pixel size of Sentinel-2, the correlation coefficient with NDVI
Sentinel-2 increased to 0.504–0.785.
In previous studies, NDVI
UAV and NDVI
Sentinel-2 were reported to exhibit correlation coefficients of 0.55–0.72 in a vineyard [
15]. Di Gennaro et al. [
20] also reported R-square values of 0.57–0.80 between NDVIs evaluated from a UAV-mounted sensor and from Sentinel-2 in a vineyard. In another study, not only Sentinel-2 data, but Landsat-8 data as well were compared with ground and UAV data. NDVI
UAV had an R-square value of 0.93 and 0.86 with NDVIs evaluated from ground and Landsat-8 data (hereafter NDVI
Landsat-8), respectively, in mixed deciduous and coniferous woodland [
26]. In particular, the relationship between NDVI
UAV and NDVI
Landsat-8 at the beginning of spring was relatively weak (R-square < 0.5), and the authors noted that this was due to a temporal gap between the Landsat and UAV data [
27]. In fact, according to Battude et al. [
28], high correlation coefficients between NDVIs using different satellites were evaluated if there was no temporal gap between the measurements. Indeed, in the present study, the bias-corrected NRMSE values were the lowest when data acquired on the same day by different sensors were compared (
Figure 5).
Furthermore, NDVI values obtained from MODIS sensor data recorded by the Terra satellite, which has a relatively lower spatial resolution compared with Sentinel-2 and Landsat-8, showed different relationships depending on the land type [
29]. In cropland, the R-square between NDVIs evaluated from ground sensor data and MODIS data was 0.55–0.56.
Each relationship between NDVI data series carried a distinct bias due to different measurement intervals, meteorological conditions, and different sensor specifications (FOV, sensor calibration, distance between the target and the sensor) [
30,
31]. In addition, the wavelength ranges used for calculating the NDVI were different depending on the optical instruments. For the red band, the central wavelength was 650 nm (bandwidth: 10 nm) for the SRS, while it was 665 nm or 668 nm (bandwidth: 10 nm or 30 nm) for the other instruments. It was calculated that this produced an absolute bias in the comparison between NDVI
SRS and NDVI
Field values of as high as 10% (result not shown). It also implies that the influence of other specifications is larger than that of the wavelength range. The FOV of the field spectrometer is narrower than that of the SRS, implying that the field spectrometer data are more focused on the center of the crop. To reduce the bias, a bias correction method should be implemented, corresponding to the reference study. As for the relationship between NDVI
Sentinel-2 and upscaled NDVI
UAV, the error may originate from different georeferencing of the satellite and UAV data. Inherently, mosaicking and georeferencing UAV data in cropland and forests are relatively difficult tasks [
19,
32]. To alleviate this issue, multiple and accurate GCP target points must be installed.
5. Conclusions
NDVI values obtained at different spatial scales were compared in this work. The statistical analysis of the NDVI values obtained from the multispectral camera, field spectrometers, SRSs, and leaf spectrometer demonstrated that measurements with similar footprint areas are comparable. Moreover, the different footprint areas caused the NDVISentinel-2 values to differ significantly from those evaluated from airborne and ground-based sensors (NDVIUAV, NDVIField, NDVISRS, and NDVILeaf). Given that the correlation coefficient between NDVIUAV and NDVISRS or NDVIField data is higher than 0.933 (p-value < 0.0001), it was concluded that NDVISRS and NDVIField can be used as a true reference source for homogeneous crop-canopy areas. As for the relationship between NDVIUAV and NDVISentinel-2, the upscaled NDVIUAV values (i.e., NDVIUAV values upscaled to the pixel size of Sentinel-2) exhibited a better correlation with the NDVISentinel-2 values compared with the non-upscaled NDVIUAV values. This was attributed to the fact that the upscaled NDVIUAV had the same footprint area as NDVISentinel-2, and suggested that the footprint mismatch is the most critical issue hindering proper data integration from different sensors and across spatial scales. For practical applications in agriculture, resampling the UAV-based data is thus recommended rather than for the ground-based data to obtain comparable NDVI results. However, note that precise crop conditions with low soil contamination errors are better captured by ground-based sensors.
The results presented in this study may help to correctly interpret and compare NDVI maps obtained at different spatial scales. Further, this study also demonstrated that the presence of ridges and furrows must be taken into account when validating the measurement data. In the future, data at various spatial scales will be continually acquired to allow further comparisons of multiple remote-sensing-derived parameters for a variety of crops.


