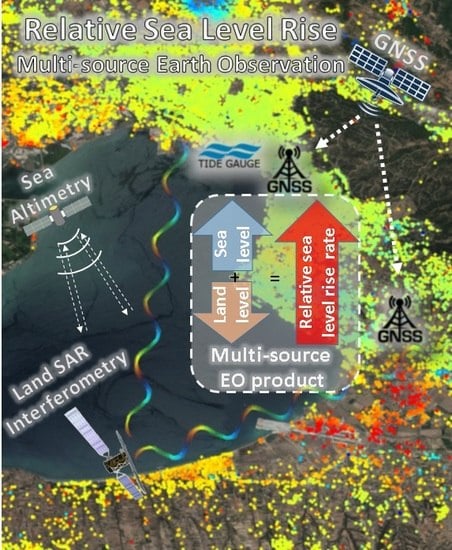
Spatio-Temporal Assessment of Land Deformation as a Factor Contributing to Relative Sea Level Rise in Coastal Urban and Natural Protected Areas Using Multi-Source Earth Observation Data


Abstract
:
1. Introduction
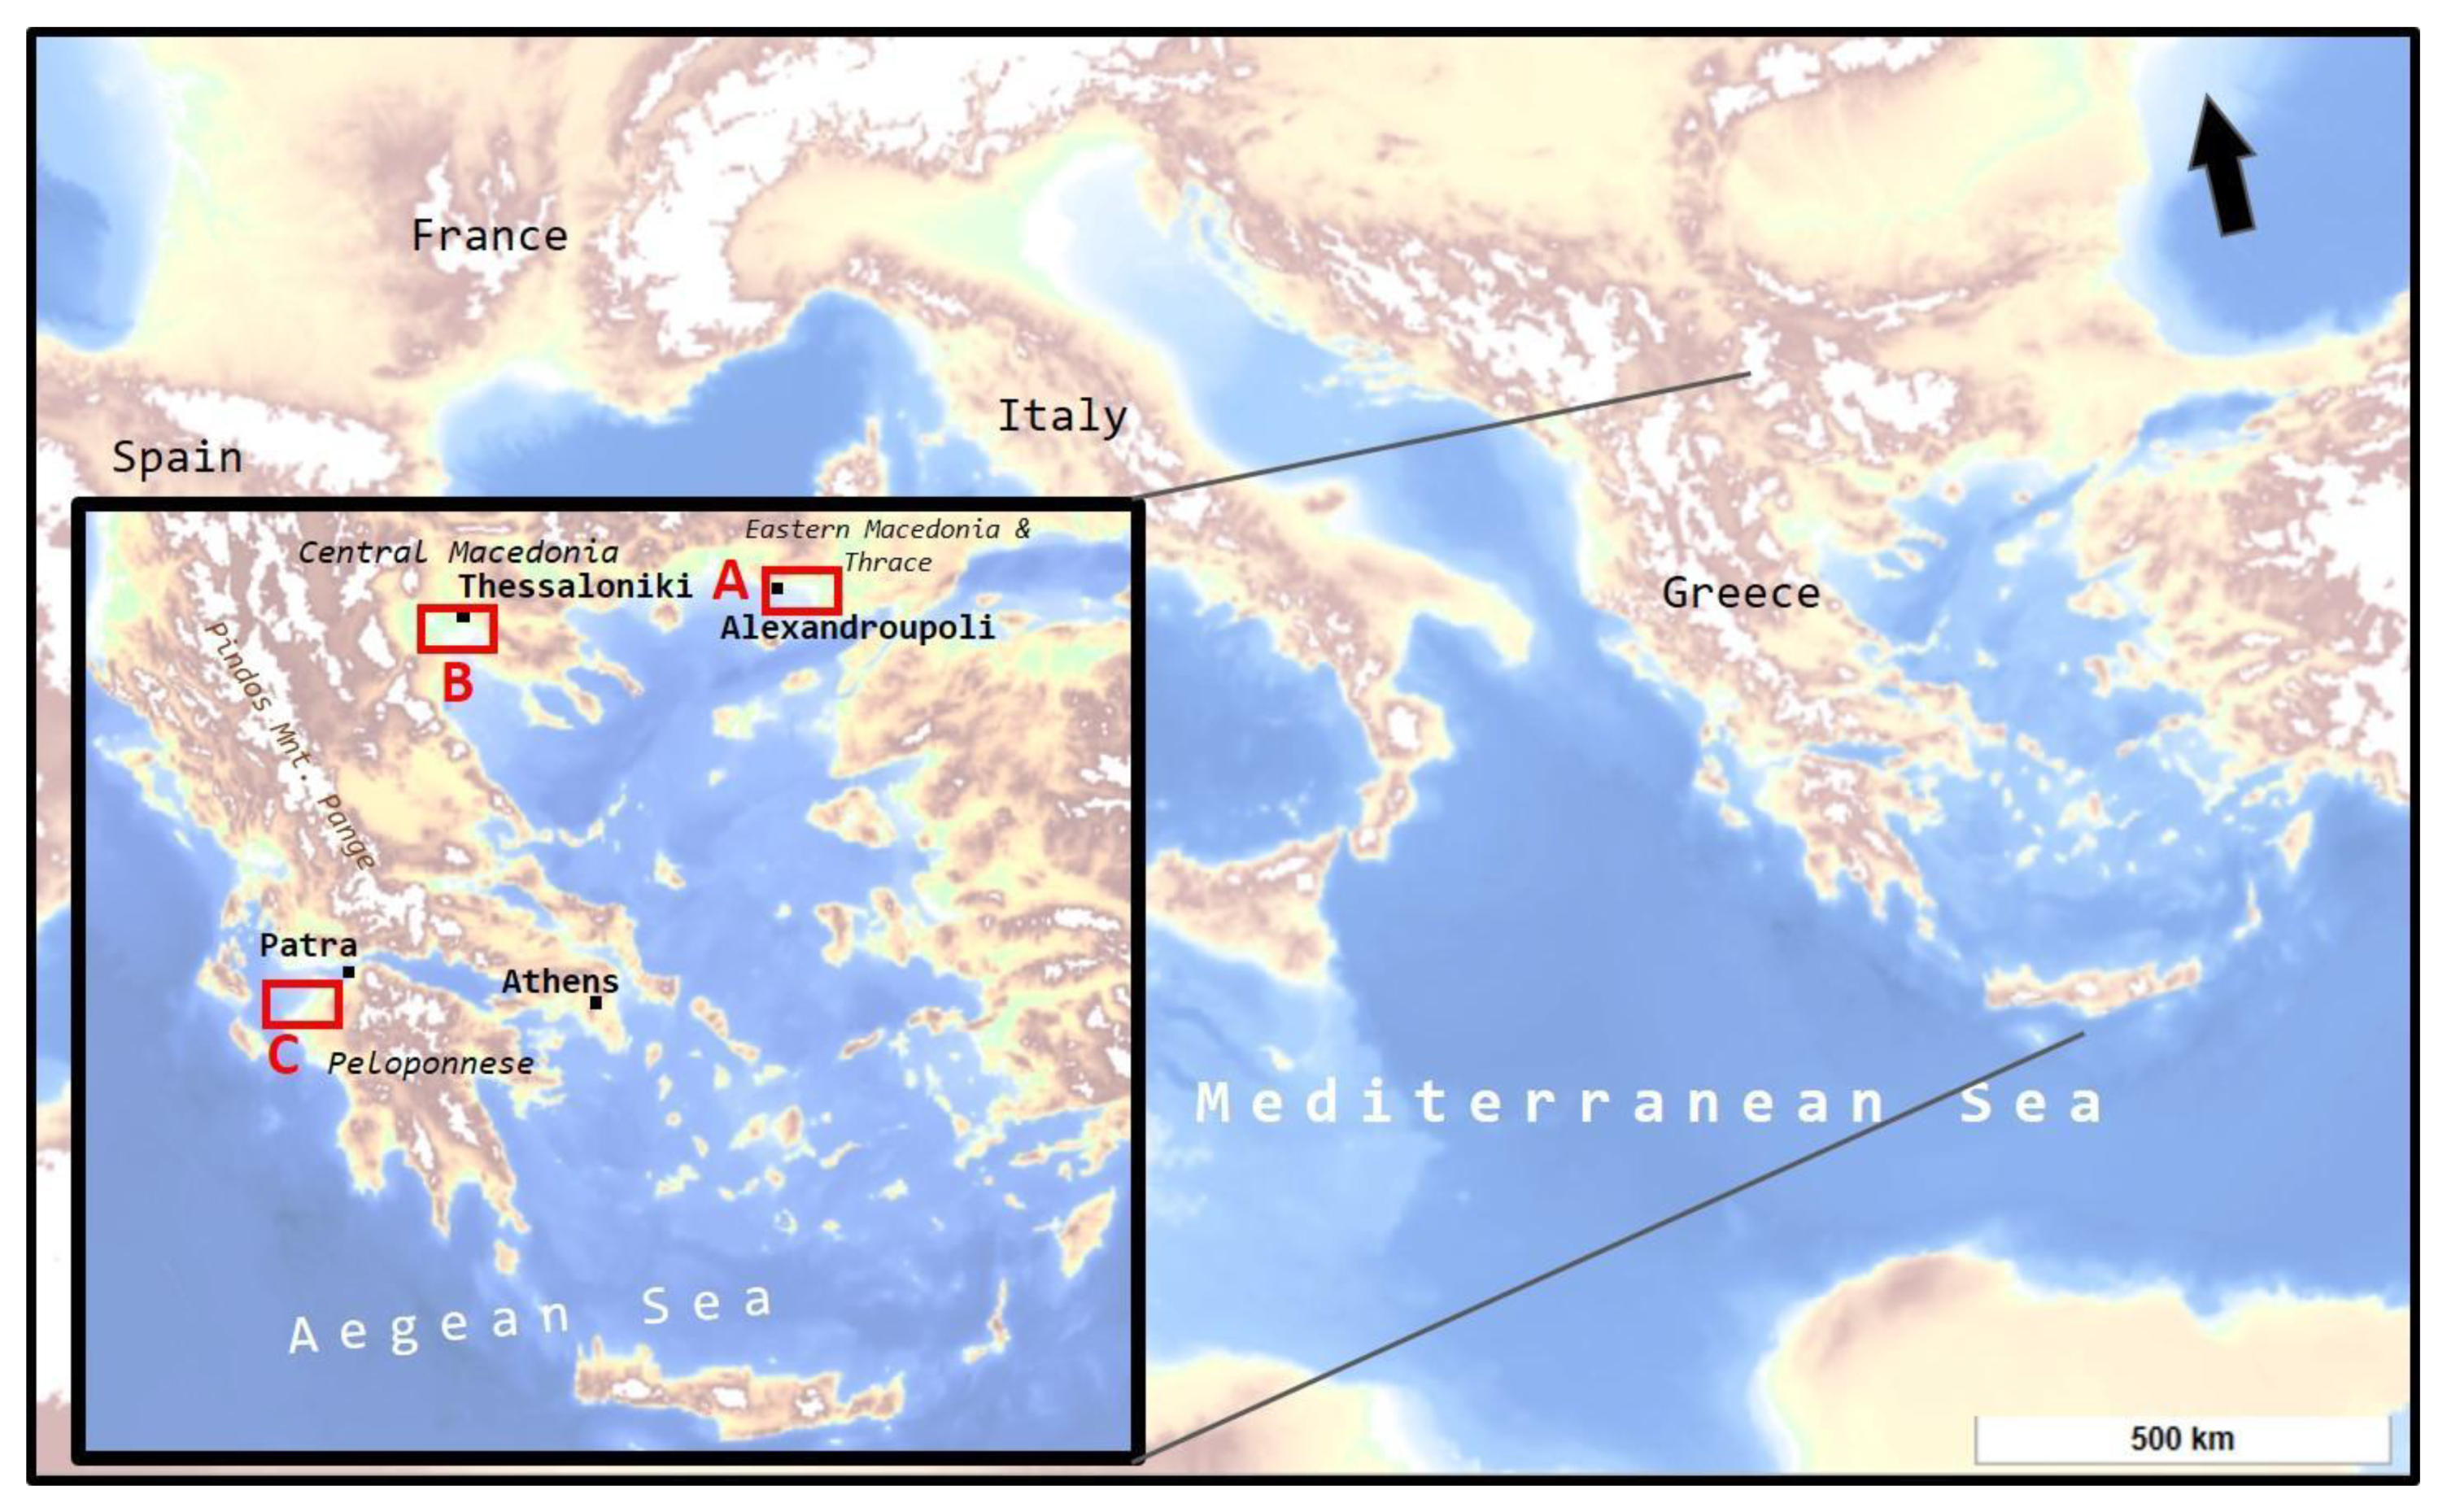
2. Study Areas
2.1. Coastal Area of Alexandroupolis City—Evros Delta Region
2.2. Coastal Zone of Thermaic Gulf, City of Thessaloniki—Axios Delta
2.3. Coastal Area of Killini—Araxos (Patras Gulf), NW Pelloponese
3. Materials and Methods
3.1. Data
3.2. Methodology
4. Results
4.1. Alexandroupolis, Evros Delta
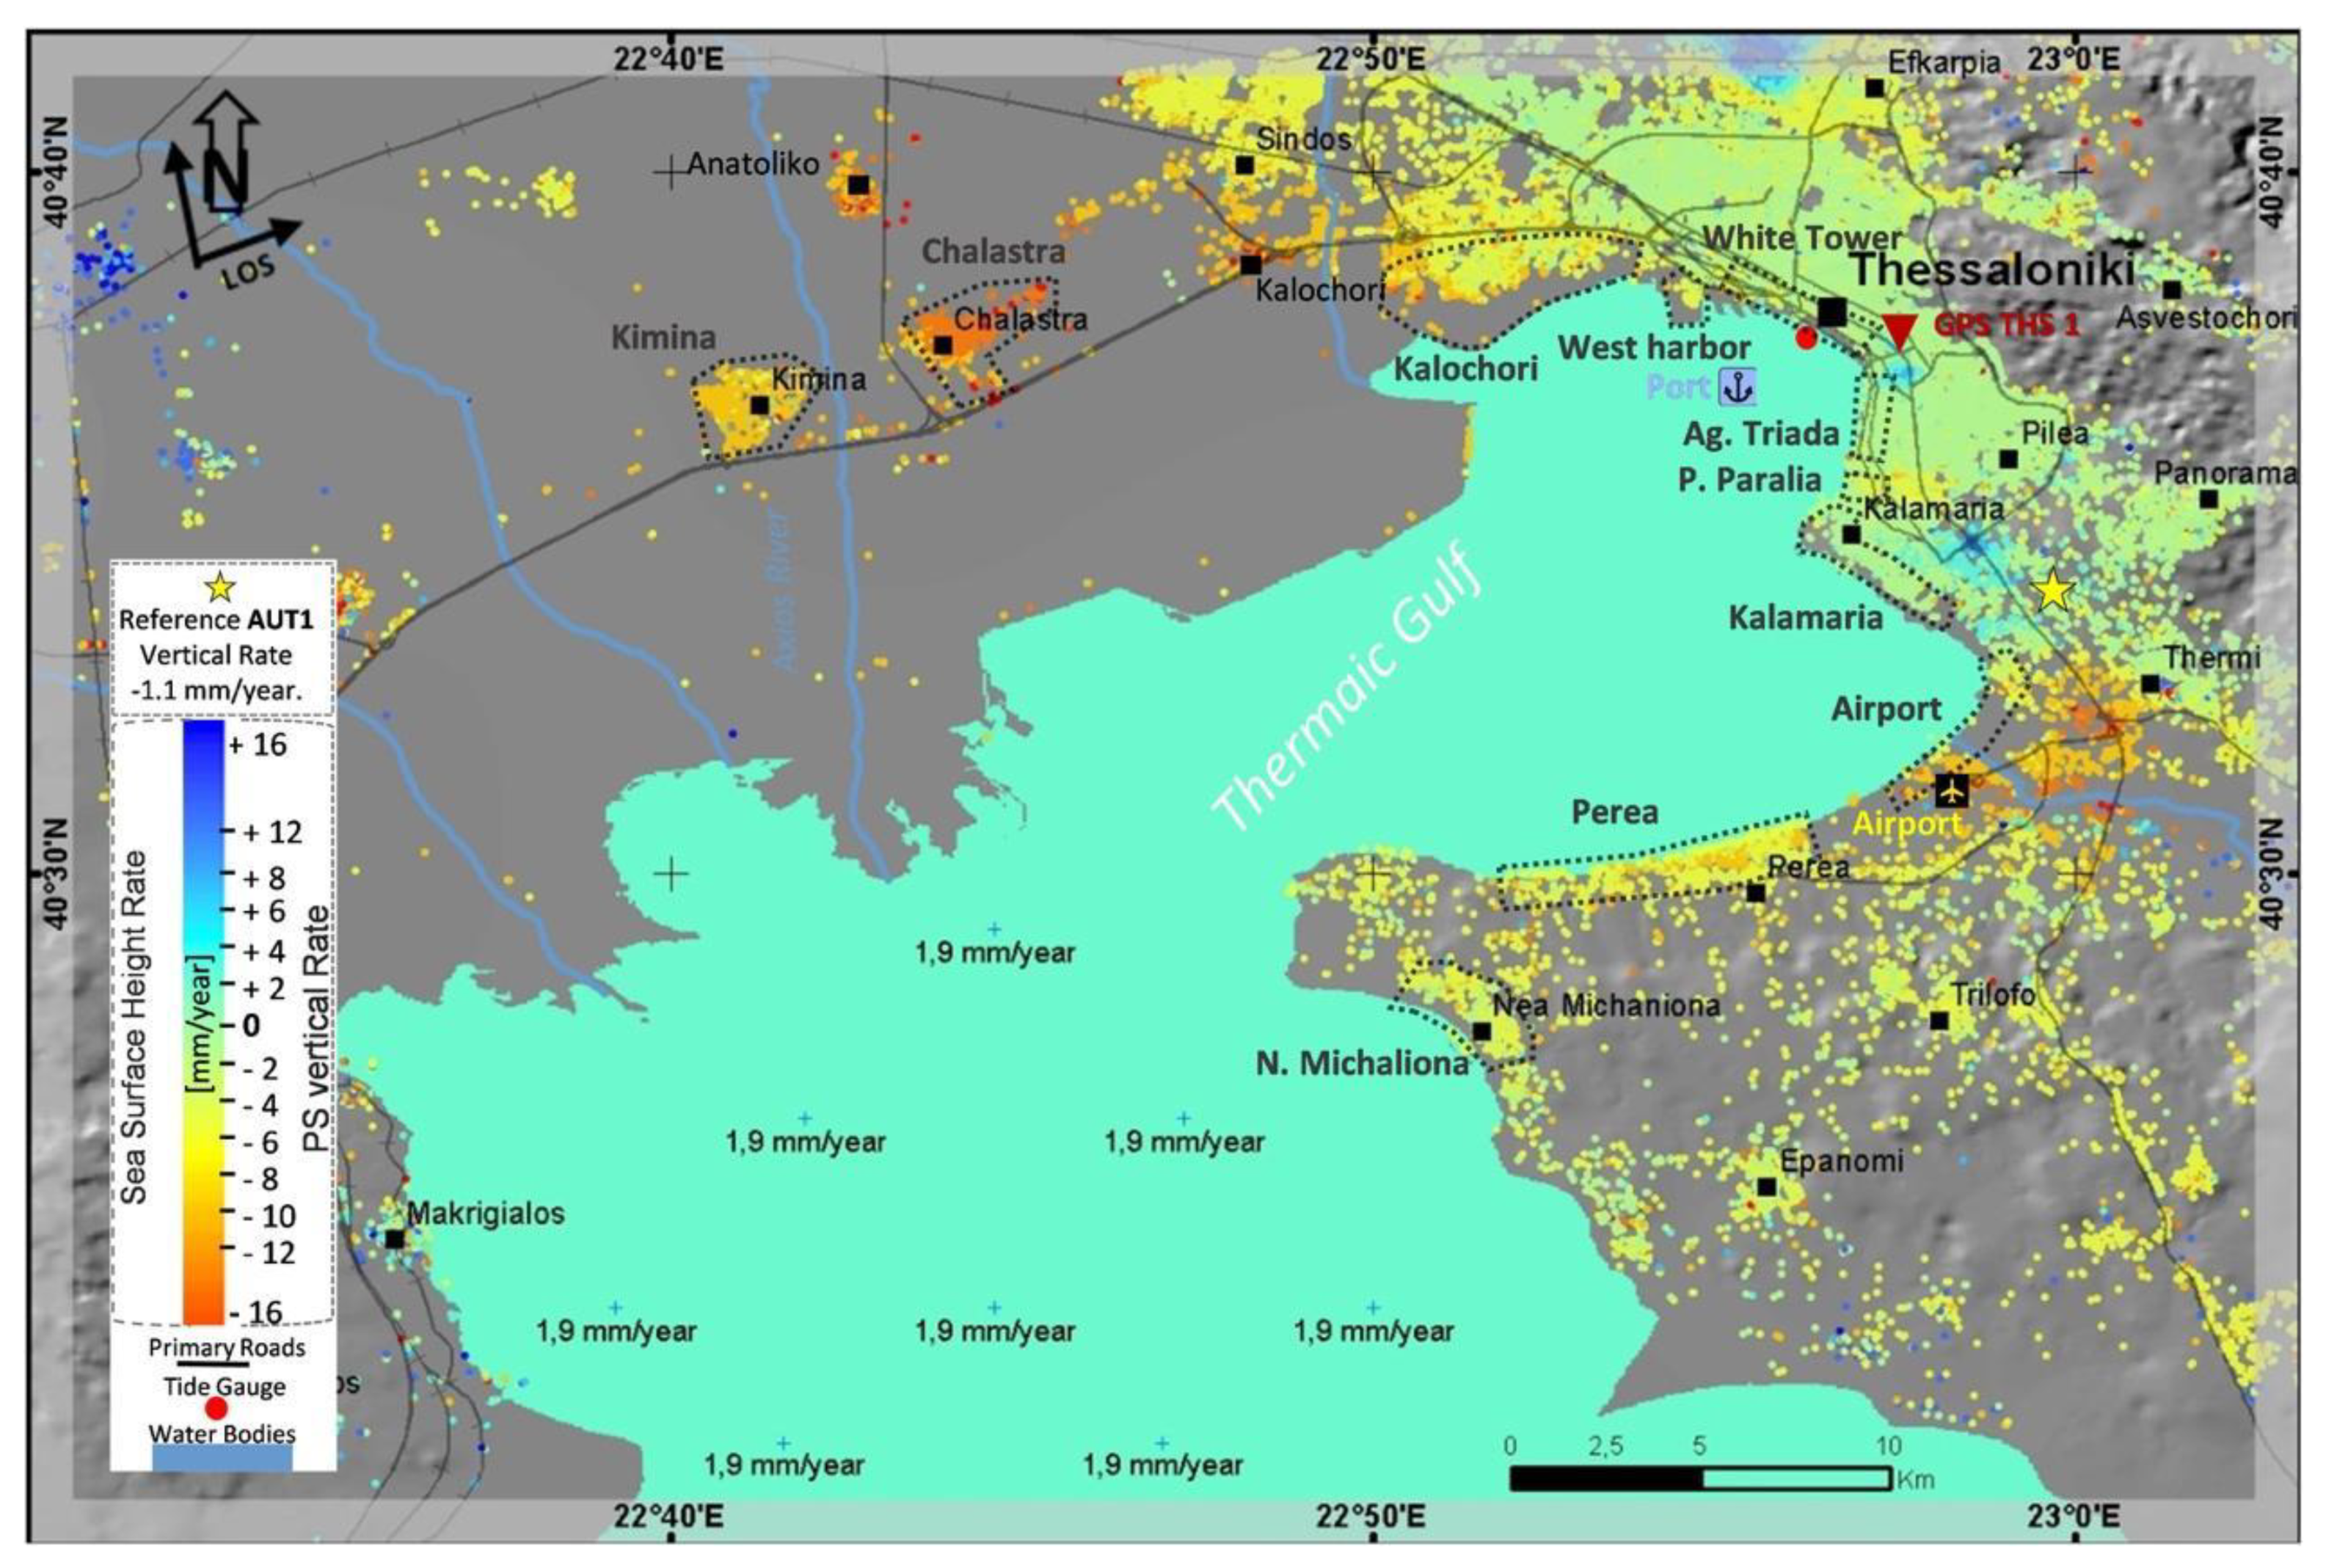
4.2. Thermaic Gulf; Thessaloniki City, Axios Delta
4.3. Killini, Araxos
5. Discussion
6. Conclusions
Supplementary Materials
Author Contributions
Funding

Acknowledgments
Conflicts of Interest
References
- Mimura, N. Sea-level rise caused by climate change and its implications for society. Proc. Jpn. Acad. Ser. B 2013, 89, 281–301. [Google Scholar] [CrossRef] [PubMed] [Green Version]
- Wong, P.P.; Losada, I.J.; Gattuso, J.-P.; Hinkel, J.; Khattabi, A.; McInnes, K.; Saito, Y.; Sallenger, A. Coastal Systems and Low-Lying Areas. In Climate Change 2014: Impacts. Adaptation. and Vulnerability. Part A: Global and Sectoral Aspects. Contribution of Working Group II to the Fifth Assessment Report of the Intergovernmental Panel on Climate Change; Field, C.B., Barros, V.R., Dokken, D.J., Mach, K.J., Mastrandrea, M.D., Bilir, T.E., Chatterjee, M., Ebi, K.L., Estrada, Y.O., Genova, R.C., et al., Eds.; Cambridge University Press: Cambridge, UK; New York, NY, USA, 2014; pp. 361–409. ISBN 978-1107641655. [Google Scholar]
- Cohen, J.E.; Small, C. Hypsographic demography: The distribution of human population by altitude. Proc. Natl. Acad. Sci. USA 1998, 95, 14009–14014. [Google Scholar] [CrossRef] [Green Version]
- Small, C.; Nicholls, R.J. A Global Analysis of Human Settlement in Coastal Zones. J. Coast. Res. 2003, 19, 584–599. [Google Scholar]
- Vousdoukas, M.I.; Mentaschi, L.; Hinkel, J.; Ward, P.J.; Mongelli, I.; Ciscar, J.-C.; Feyen, L. Economic motivation for raising coastal flood defenses in Europe. Nat. Commun. 2020, 11, 1–11. [Google Scholar]
- Nicholls, R.J. Planning for the Impacts of Sea Level Rise. Oceanography 2011, 24, 144–157. [Google Scholar] [CrossRef]
- Oppenheimer, M.; Glavovic, B.; Hinkel, J.; van de Wal, R.; Magnan, A.K.; Abd-Elgawad, A.; Cai, R.; Cifuentes-Jara, M.; DeConto, R.M.; Ghosh, T.; et al. Sea Level Rise and Implications for Low Lying Islands. Coasts and Communities. In IPCC Special Report on the Ocean and Cryosphere in a Changing Climate; Pörtner, H.-O., Roberts, D.C., Masson-Delmotte, V., Zhai, P., Tignor, M., Poloczanska, E., Mintenbeck, K., Alegría, A., Nicolai, M., Okem, A., et al., Eds.; Cambridge University Press: Cambridge, UK, 2019; pp. 321–445, ISSN 1095-9203 (Electronic) 0036-8075 (Linking). [Google Scholar]
- Rodriguez, J.; Saco, P.M.; Sandi, S.G.; Saintilan, N.; Riccardi, G. Potential increase in coastal wetland vulnerability to sea-level rise suggested by considering hydrodynamic attenuation effects. Nat. Commun. 2017, 8, 16094. [Google Scholar] [CrossRef]
- Rovere, A.; Stocchi, P.; Vacchi, M. Eustatic and Relative Sea Level Changes. Curr. Clim. Chang. Rep. 2016, 2, 221–231. [Google Scholar] [CrossRef] [Green Version]
- Kemp, A.C.; Dutton, A.; Raymo, M.E. Paleo Constraints on Future Sea-Level Rise. Curr. Clim. Chang. Rep. 2015, 1, 205–215. [Google Scholar] [CrossRef] [Green Version]
- Meyssignac, B.; Piecuch, C.G.; Merchant, C.J.; Racault, M.F.; Palanisamy, H.; MacIntosh, C.; Sathyendranath, S.; Brewin, R. Causes of the Regional Variability in Observed Sea Level. Sea Surface Temperature and Ocean Colour Over the Period 1993–2011. Surv. Geophys. 2017, 38, 187–215. [Google Scholar] [CrossRef] [Green Version]
- Milne, G.A.; Gehrels, W.R.; Hughes, C.W.; Tamisiea, M.E. Identifying the causes of sea-level change. Nat. Geosci. 2009, 2, 471–478. [Google Scholar] [CrossRef] [Green Version]
- Church, J.; Woodworth, P.L.; Aarup, T.; Wilson, W.S. Understanding Sea-Level Rise and Variability; Wiley-Blackwell Publishing: London, UK, 2010; ISBN 9781444334524. [Google Scholar]
- Sinking Cities–Global Cities Sinking into the Ocean–LSU Law Center: Climate Change Law and Policy Project. Available online: https://sites.law.lsu.edu/coast/2015/07/sinking-cities-global-cities-sinking-into-the-ocean/ (accessed on 16 November 2019).
- Erkens, G.; Bucx, T.; Dam, R.; De Lange, G.; Lambert, J. Sinking coastal cities. Proc. Int. Assoc. Hydrol. Sci. 2015, 372, 189–198. [Google Scholar] [CrossRef] [Green Version]
- Bucx, T.H.M.; Van Ruiten, C.J.M.; Erkens, G.; De Lange, G. An integrated assessment framework for land subsidence in delta cities. Proc. Int. Assoc. Hydrol. Sci. 2015, 372, 485–491. [Google Scholar] [CrossRef] [Green Version]
- Gomis, D.; Tsimplis, M.; Marcos, M.; Fenoglio-Marc, L.; Pérez, B.; Raicich, F.; Vilibić, I.; Wöppelmann, G.; Monserrat, S.; Monserrat, S. Mediterranean Sea-Level Variability and Trends. In The Climate of the Mediterranean Region: From the Past to the Future; Lionello, P., Ed.; Elsevier Inc.: Hoboken, NJ, USA, 2012; pp. 257–299. ISBN 9780124160422. [Google Scholar]
- Poitevin, C.; Wöppelmann, G.; Raucoules, D.; Le Cozannet, G.; Marcos, M.; Testut, L. Vertical land motion and relative sea level changes along the coastline of Brest (France) from combined space-borne geodetic methods. Remote. Sens. Environ. 2019, 222, 275–285. [Google Scholar] [CrossRef]
- Pugh, D.; Woodworth, P. Sea-Level Science: Understanding Tides. Surges. Tsunamis and Mean Sea-Level Changes; Cambridge University Press: Cambridge, UK, 2014; ISBN 1107028191. [Google Scholar]
- Ablain, M.; Legeais, J.F.; Prandi, P.; Marcos, M.; Fenoglio-Marc, L.; Dieng, H.B.; Benveniste, J.; Cazenave, A. Satellite Altimetry-Based Sea Level at Global and Regional Scales. Surv. Geophys. 2017, 38, 7–31. [Google Scholar] [CrossRef]
- Zheng, Q.; Klemas, V.; Yan, X.-H. 8.01-Volume 8 Overview: Progress in Ocean Remote Sensing. In Comprehensive Remote Sensing; Liang, S.B.T.-C.R.S., Ed.; Elsevier: Oxford, UK, 2018; pp. 1–42. ISBN 978-0-12-803221-3. [Google Scholar]
- Blewitt, G. Basics of the GPS Technique: Observation Equations. Geod. Appl. GPS 1997, 10–54. [Google Scholar]
- Blewitt, G.; Altamimi, Z.; Davis, J.; Gross, R.; Kuo, C.Y.; Lemoine, F.G.; Moore, A.W.; Neilan, R.E.; Plag, H.P.; Rothacher, M.; et al. Geodetic observations and global reference frame contributions to understanding sea-level rise and variability. In Understanding Sea-Level Rise and Variability; Church, J.A., Woodworth, P.L., Aarup, P., Wilson, W.S., Eds.; Wiley-Blackwell: Oxford, UK, 2010; pp. 256–284. ISBN 978-1-444-33451-7. [Google Scholar]
- Cigna, F. Observing Geohazards from Space. Geosciences 2018, 8, 59. [Google Scholar] [CrossRef] [Green Version]
- Di Paola, G.; Alberico, I.; Aucelli, P.P.; Matano, F.; Rizzo, A.; Vilardo, G. Coastal subsidence detected by Synthetic Aperture Radar interferometry and its effects coupled with future sea-level rise: The case of the Sele Plain (Southern Italy). J. Flood Risk Manag. 2018, 11, 191–206. [Google Scholar] [CrossRef] [Green Version]
- Liu, A.K. Coastal Monitoring by Satellite-Based SAR. In Remote Sensing of the Changing Oceans; Springer: Berlin/Heidelberg, Germany, 2011; pp. 195–215. [Google Scholar]
- Polcari, M.; Albano, M.; Montuori, A.; Bignami, C.; Tolomei, C.; Pezzo, G.; Falcone, S.; La Piana, C.; Doumaz, F.; Salvi, S.; et al. InSAR Monitoring of Italian Coastline Revealing Natural and Anthropogenic Ground Deformation Phenomena and Future Perspectives. Sustainability 2018, 10, 3152. [Google Scholar] [CrossRef] [Green Version]
- Teatini, P.; Ferronato, M.; Gambolati, G.; Bertoni, W.; Gonella, M. A century of land subsidence in Ravenna, Italy. Environ. Geol. 2005, 47, 831–846. [Google Scholar] [CrossRef]
- Hooper, A.J. A multi-temporal InSAR method incorporating both persistent scatterer and small baseline approaches. Geophys. Res. Lett. 2008, 35, 1–5. [Google Scholar] [CrossRef] [Green Version]
- Crosetto, M.; Garriga, O.T.; Cuevas-González, M.; Devanthéry, N.; Crippa, B. Persistent Scatterer Interferometry: A review. ISPRS J. Photogramm. Remote Sens. 2016, 115, 78–89. [Google Scholar] [CrossRef] [Green Version]
- Lanari, R.; Casu, F.; Manzo, M.; Zeni, G.; Berardino, P.; Manunta, M.; Pepe, A. An Overview of the Small BAseline Subset Algorithm: A DInSAR Technique for Surface Deformation Analysis. Pure Appl. Geophys. 2007, 164, 637–661. [Google Scholar] [CrossRef]
- Montuori, A.; Anderlini, L.; Palano, M.; Albano, M.; Pezzo, G.; Antoncecchi, I.; Chiarabba, C.; Serpelloni, E.; Stramondo, S. Application and analysis of geodetic protocols for monitoring subsidence phenomena along on-shore hydrocarbon reservoirs. Int. J. Appl. Earth Obs. Geoinf. 2018, 69, 13–26. [Google Scholar] [CrossRef]
- Bruno, M.F.; Molfetta, M.G.; Mossa, M.; Morea, A.; Chiaradia, M.T.; Nutricato, R.; Nitti, D.O.; Guerriero, L.; Coletta, A. Integration of multitemporal SAR/InSAR techniques and NWM for coastal structures monitoring: Outline of the software system and of an operational service with COSMO-SkyMed data. In Proceedings of the 2016 IEEE Workshop on Environmental, Energy, and Structural Monitoring Systems (EESMS), Bari, Italy, 13–14 June 2016; pp. 1–16, ISBN 978-1-5090-2371-4. [Google Scholar]
- Hu, B.; Chen, J.; Zhang, X. Monitoring the Land Subsidence Area in a Coastal Urban Area with InSAR and GNSS. Sensors 2019, 19, 3181. [Google Scholar] [CrossRef] [Green Version]
- Ferretti, A.; Prati, C.; Rocca, F. Permanent scatterers in SAR interferometry. IEEE Trans. Geosci. Remote Sens. 2001, 39, 8–20. [Google Scholar] [CrossRef]
- Berardino, P.; Fornaro, G.; Lanari, R.; Sansosti, E. A new algorithm for monitoring localized deformation phenomena based on small baseline differential SAR interferograms. IEEE Trans. Geosci. Remote Sens. 2002, 40, 2375–2383. [Google Scholar] [CrossRef] [Green Version]
- Werner, C.; Wegmuller, U.; Strozzi, T.; Wiesmann, A. Interferometric point target analysis for deformation mapping. Int. Geosci. Remote Sens. Symp. 2003, 7, 4362–4364. [Google Scholar]
- Svigkas, N.; Papoutsis, I.; Constantinos, L.; Tsangaratos, P.; Kiratzi, A.; Kontoes, C.H. Land subsidence rebound detected via multi-temporal InSAR and ground truth data in Kalochori and Sindos regions. Northern Greece. Eng. Geol. 2016, 209, 175–186. [Google Scholar]
- Foumelis, M.; Trasatti, E.; Papageorgiou, E.; Stramondo, S.; Parcharidis, I. Monitoring Santorini volcano (Greece) breathing from space. Geophys. J. Int. 2013, 193, 161–170. [Google Scholar] [CrossRef]
- Papoutsis, I.; Papanikolaou, X.; Floyd, M.; Kontoes, C.; Paradissis, D.; Zacharis, V.; Ji, K.H. Mapping inflation at Santorini volcano, Greece, using GPS and InSAR. Geophys. Res. Lett. 2013, 40, 267–272. [Google Scholar] [CrossRef]
- Adam, N.; Gonzalez, F.R.; Parizzi, A.; Liebhart, W. Wide area persistent scatterer interferometry. In Proceedings of the Fringe 2011 Workshop, Frascati, Italy, 19–23 September 2011. [Google Scholar]
- Floyd, M.A.; Billiris, H.; Paradissis, D.; Veis, G.; Avallone, A.; Briole, P.; McClusky, S.; Nocquet, J.M.; Palamartchouk, K.; Parsons, B.; et al. A new velocity field for Greece: Implications for the kinematics and dynamics of the Aegean. J. Geophys. Res. Solid Earth 2010, 115, 1–25. [Google Scholar] [CrossRef]
- Briole, P.; Rigo, A.; Lyon-Caen, H.; Ruegg, J.C.; Papazissi, K.; Mitsakaki, C.; Balodimou, A.; Veis, G.; Hatzfeld, D.; Deschamps, A. Active deformation of the Corinth rift, Greece: Results from repeated Global Positioning System surveys between 1990 and 1995. J. Geophys. Res. 2000, 105, 605–625. [Google Scholar] [CrossRef] [Green Version]
- Chousianitis, K.; Ganas, A.; Evangelidis, C. Strain and rotation rate patterns of mainland Greece from continuous GPS data and comparison between seismic and geodetic moment release. J. Geophys. Res. Solid Earth 2015, 120, 3909–3931. [Google Scholar] [CrossRef]
- Avallone, A.; Briole, P.; Agatza-Balodimou, A.M.; Billiris, H.; Charade, O.; Mitsakaki, C.; Nercessian, A.; Papazissi, K.; Paradissis, D.; Veis, G. Analysis of eleven years of deformation measured by GPS in the Corinth Rift Laboratory area. C. R. Geosci. 2004, 336, 301–311. [Google Scholar] [CrossRef] [Green Version]
- Elias, P.; Briole, P. Ground Deformations in the Corinth Rift, Greece, Investigated Through the Means of SAR Multitemporal Interferometry. Geochem. Geophys. Geosystems 2018, 19, 4836–4857. [Google Scholar] [CrossRef] [Green Version]
- Raspini, F.; Bianchini, S.; Moretti, S.; Loupasakis, C.; Rozos, D.; Duro, J.; Garcia, M. Advanced interpretation of interferometric SAR data to detect, monitor and model ground subsidence: Outcomes from the ESA-GMES Terrafirma project. Nat. Hazards 2016, 83, 155–181. [Google Scholar] [CrossRef]
- Parcharidis, I.; Kourkouli, P.; Karymbalis, E.; Foumelis, M.; Karathanassi, V. Time Series Synthetic Aperture Radar Interferometry for Ground Deformation Monitoring over a Small Scale Tectonically Active Deltaic Environment (Mornos, Central Greece). J. Coast. Res. 2011, 29, 325–338. [Google Scholar]
- Pehlivanoglou, K.; Tsirambides, A.; Trontsios, G. Origin and Distribution of Clay Minerals in the Alexandroupolis Gulf, Aegean Sea, Greece. Estuar. Coast. Shelf Sci. 2000, 51, 61–73. [Google Scholar] [CrossRef]
- Xeidakis, G.S.; Delimani, P.; Skias, S. Erosion problems in Alexandroupolis coastline, North-Eastern Greece. Environ. Geol. 2007, 53, 835–848. [Google Scholar] [CrossRef]
- Mentzafou, A.; Markogianni, V.; Dimitriou, E. The Use of Geospatial Technologies in Flood Hazard Mapping and Assessment: Case Study from River Evros. Pure Appl. Geophys. 2017, 174, 679–700. [Google Scholar] [CrossRef]
- Dimitriou, E.; Moussoulis, E.; Mentzafou, A.; Tzortziou, M.; Zeri, C.; Colombari, E.; Markogianni, V. Environmental Status Assessment for Evros River Basin; HCMR: Athens, Greece, 2010. [Google Scholar]
- Alpar, B. Plio-Quaternary history of the Turkish coastal zone of the Enez-Evros Delta: NE Aegean Sea. Mediterr. Mar. Sci. 2001, 2, 95–118. [Google Scholar] [CrossRef] [Green Version]
- Raucoules, D.; Parcharidis, I.; Feurer, D.; Novalli, F.; Ferretti, A.; Carnec, C.; Lagios, E.; Sakkas, V.; Le Mouélic, S.; Cooksley, G.; et al. Ground deformation detection of the greater area of Thessaloniki (Northern Greece) using radar interferometry techniques. Nat. Hazards Earth Syst. Sci. 2008, 8, 779–788. [Google Scholar] [CrossRef]
- Kapsimalis, V.; Poulos, S.E.; Karageorgis, A.P.; Pavlakis, P.; Collins, M. Recent evolution of a Mediterranean deltaic coastal zone: Human impacts on the Inner Thermaikos Gulf, NW Aegean Sea. J. Geol. Soc. 2005, 162, 897–908. [Google Scholar] [CrossRef] [Green Version]
- Karageorgis, A.P.; Skourtos, M.S.; Kapsimalis, V.; Kontogianni, A.D.; Skoulikidis, N.T.; Pagou, K.; Nikolaidis, N.; Drakopoulou, P.; Zanou, B.; Karamanos, H.; et al. An Integrated Approach to Watershed Management within the DPSIR Framework: Axios River Catchment and Thermaikos Gulf; Springer-Verlag: Zurich, Switzerland, 2005; Volume 5, ISBN 1011300400. [Google Scholar]
- Psimoulis, P.; Ghilardi, M.; Fouache, E.; Stiros, S. Subsidence and evolution of the Thessaloniki plain, Greece, based on historical leveling and GPS data. Eng. Geol. 2007, 90, 55–70. [Google Scholar] [CrossRef]
- Zalidis, G. Management of river water for irrigation to mitigate soil salinization on a coastal wetland. J. Environ. Manag. 1998, 54, 161–167. [Google Scholar] [CrossRef]
- Maroukian, H.; Gaki-Papanastassiou, K.; Papanastassiou, D.; Palyvos, N. Geomorphological observations in the coastal zone of Kyllini Peninsula. NW Peloponnese-GreecePeloponnesus-Greece. and their relation to the seismotectonic regime of the area. J. Coast. Res. 2000, 16, 853–863. [Google Scholar]
- Management Body of Kotychi and Strofylia Wetlands General Information of the Region–Strofylia National Park. Available online: https://strofylianationalpark.gr/national-park-of-kotychi-strofylia-wetlands/general-information-of-the-region/ (accessed on 4 June 2020).
- NATURA 2000 Standard Data Form for Special Protection Areas (SPA) for sites eligible for identification as Sites of Community Importance (SCI) and for Special Areas of Conservation (SAC); Site GR2320001, Limnothalassa Kalogrias, Dasos Strofylias kai Elos Lamias, Araxos, 2000. Available online: https://natura2000.eea.europa.eu/Natura2000/SDF.aspx?site=GR2320001 (accessed on 16 July 2020).
- De Zan, F.; Guarnieri, A.M. TOPSAR: Terrain Observation by Progressive Scans. IEEE Trans. Geosci. Remote Sens. 2006, 44, 2352–2360. [Google Scholar] [CrossRef]
- Simoncelli, S.; Fratianni, C.; Pinardi, N.; Grandi, A.; Drudi, M.; Oddo, P.; Dobricic, S. Mediterranean Sea Physical Reanalysis (CMEMS MED-Physics) [Data set] Copernicus Monitoring Environment Marine Service (CMEMS). 2019. Available online: https://doi.org/10.25423/MEDSEA_REANALYSIS_PHYS_006_004 (accessed on 16 July 2020).
- Blewitt, G.; Hammond, W.C.; Kreemer, C. Harnessing the GPS Data Explosion for Interdisciplinary Science-Eos. Available online: https://eos.org/science-updates/harnessing-the-gps-data-explosion-for-interdisciplinary-science (accessed on 22 May 2020).
- Holgate, S.J.; Matthews, A.; Woodworth, P.L.; Rickards, L.J.; Tamisiea, M.E.; Bradshaw, E.; Foden, P.R.; Gordon, K.M.; Jevrejeva, S.; Pugh, J. New Data Systems and Products at the Permanent Service for Mean Sea Level. J. Coast. Res. 2012, 29, 493–504. [Google Scholar]
- Bertiger, W.; Desai, S.D.; Haines, B.; Harvey, N.; Moore, A.W.; Owen, S.; Weiss, J.P. Single receiver phase ambiguity resolution with GPS data. J. Geod. 2010, 84, 327–337. [Google Scholar] [CrossRef]
- De Luca, C.; Cuccu, R.; Elefante, S.; Zinno, I.; Manunta, M.; Casola, V.; Rivolta, G.; Lanari, R.; Casu, F. An On-Demand Web Tool for the Unsupervised Retrieval of Earth’s Surface Deformation from SAR Data: The P-SBAS Service within the ESA G-POD Environment. Remote. Sens. 2015, 7, 15630–15650. [Google Scholar] [CrossRef] [Green Version]
- Casu, F.; Elefante, S.; Imperatore, P.; Zinno, I.; Manunta, M.; De Luca, C.; Lanari, R. SBAS-DInSAR Parallel Processing for Deformation Time-Series Computation. IEEE J. Sel. Top. Appl. Earth Obs. Remote. Sens. 2014, 7, 3285–3296. [Google Scholar] [CrossRef]
- Perissin, D. Software Manual–SARPROZ©. Available online: https://www.sarproz.com/software-manual/ (accessed on 22 May 2020).
- USGS EROS Archive-Digital Elevation-Shuttle Radar Topography Mission (SRTM) 1 Arc-Second Global. Available online: https://www.usgs.gov/centers/eros/science/usgs-eros-archive-digital-elevation-shuttle-radar-topography-mission-srtm-1-arc?qt-science_center_objects=0#qt-science_center_objects (accessed on 19 February 2020).
- Goel, K.; Adam, N. An advanced algorithm for deformation estimation in non-urban areas. ISPRS J. Photogramm. Remote Sens. 2012, 73, 100–110. [Google Scholar] [CrossRef]
- Costantini, F.; Mouratidis, A.; Schiavon, G.; Sarti, F. Advanced InSAR techniques for deformation studies and for simulating the PS-assisted calibration procedure of Sentinel-1 data: Case study from Thessaloniki (Greece), based on the Envisat/ASAR archive. Int. J. Remote Sens. 2016, 37, 729–744. [Google Scholar] [CrossRef]
- Ford, M.; Williams, E.A.; Malartre, F.; Popescu, S.M. Stratigraphic Architecture, Sedimentology and Structure of the Vouraikos Gilbert-Type Fan Delta, Gulf of Corinth, Greece. In Sedimentary Processes Environments and Basins. A Tribute to Peter Friend; Nichols, G., Williams, E., Paola, C., Eds.; Int. Assoc. Sedimentologists, John Wiley & Sons, Inc.: Hoboken, NJ, USA, 2007; pp. 49–90. [Google Scholar]


| Study Area | No Sentinel Images | S1A | S1B | Relative Orbit | First Image | Last Image |
|---|---|---|---|---|---|---|
| Alexandroupolis, Evros Delta | 91 | 91 | 131 | 27 September 2016 | 30 October 2019 | |
| Thermaic Gulf; Thessaloniki, Axios Delta | 130 | 70 | 60 | 102 | 12 October 2014 | 24 June 2019 |
| Kyllini-Araxos, northwestern Pelloponese | 158 | 98 | 60 | 175 | 11 November 2015 | 23 July 2019 |
| Name | Network | φ (WGS84°) | λ (WGS84°) | Vertical Linear Rate (mm year−1) | Time Period | Number of Epochs |
|---|---|---|---|---|---|---|
| RLSO | NOA | 38.05583 | 21.46474 | −2.1 | March 2009–February 2017 | 2819 |
| AUT1 | AUTH (EUREF) | 40.56681 | 23.00371 | −1.1 | November 2007–July 2018 | 2245 |
| ALEX | URANUS | 40.84916 | 25.85344 | 0.8 | October 2017–April 2020 | 783 |
| Location | Nr. of PSs | Mean (characteristic at 85% Confidence) (mm/year) | Min (mm/year) (85% Confidence) | Max (mm/year) (85% Confidence) | Std (mm/year) (85% Confidence) | Std Counting Also GNSS (±1.0) (mm/year) | RSL Rise (cm in 50 Years) |
|---|---|---|---|---|---|---|---|
| Alexandroupolis | 198 | 0.4 | −5.0 | 10.0 | 1.2 | 2.2 | 8.5 ± 11 |
| Tide gauge | 9.2 ± 3 | ||||||
| Airport | 183 | −1.6 | −9.0 | 5.0 | 2.6 | 3.6 | 18.5 ± 18 |
| Waterland Park | 630 | −1.2 | −9.0 | 9.5 | 3.1 | 4.1 | 16.5 ± 21 |
| Coastal Delta zone | 199 | 5.3 | −5.5 | 8.5 | 1.8 | 2.8 | −16 ± 14 |
| Yayla Sahili | 177 | 1.8 | −1.5 | 4.5 | 0.8 | 1.8 | 1.5 ± 9 |
| Erikli Plaji | 184 | 1.9 | −0.5 | 4.5 | 0.9 | 1.9 | 1 ± 10 |
| Location | Number of PSs | Mean (Characteristic at 85% Confidence) (mm/year) | Min (mm/year) (85% Confidence) | Max (mm/year) (85% Confidence) | Std (mm/year) (85% Confidence) | Std Counting Also GNSS (±1.0) (mm/year) | RSL Rise (cm in 50 Years) |
|---|---|---|---|---|---|---|---|
| White Tower | 803 | −2.1 | −12.7 | 1.1 | 0.8 | 1.3 | 20 ± 7 |
| Tige gauge | 19 ± 3 | ||||||
| Kalamaria | 422 | −0.9 | −15.4 | 1.6 | 1.0 | 1.5 | 14 ± 7 |
| Airport | 104 | −4.3 | −15.1 | −0.7 | 3.0 | 3.5 | 31 ± 17 |
| Perea | 627 | −4.3 | −11.4 | 6.2 | 1.5 | 2.0 | 31 ± 10 |
| N. Michaliona | 270 | −2.9 | −11.6 | 1.1 | 1.0 | 1.5 | 24 ± 8 |
| Ag. Triada | 289 | −1.6 | −10.5 | 0.9 | 0.8 | 1.3 | 18 ± 6 |
| Kalochori | 1081 | −4.2 | −19.8 | 14.4 | 2.2 | 2.7 | 30 ± 14 |
| Chalastra | 388 | −11.4 | −23.8 | 19.0 | 4.2 | 4.7 | 67 ± 23 |
| Kimina | 372 | −6.0 | −17.7 | 6.2 | 2.3 | 2.8 | 39 ± 14 |
| P. Paralia | 80 | −2.6 | −4.6 | −1.3 | 0.6 | 1.1 | 22 ± 5 |
| West harbor | 45 | −3.4 | −7.8 | 2.6 | 1.4 | 1.9 | 16 ± 9 |
| Location | Number of PSs | Mean (Characteristic at 85% Confidence) (mm/year) | Mmin (mm/year) (85% Confidence) | Max (mm/year) (85% Confidence) | Std (mm/year) (85% Confidence) | Std Counting Also GNSS (±1.0) (mm/year) | RSL Rise (cm in 50 Years) |
|---|---|---|---|---|---|---|---|
| K. Achaea - P Kalamakiou | 508 | 2.7 | −4.0 | 5.0 | 2.1 | 3.1 | −3.5 ± 16 |
| P. Kalamakiou, L. Kalogria | 310 | −1.9 | −6.0 | 4.0 | 1.8 | 2.8 | 19.5 ± 14 |
| Strofilia Forest, Briania | 129 | −3.6 | −8.5 | 3.0 | 3.2 | 4.2 | 28 ± 21 |
| Killini | 152 | 0.9 | −6.5 | 7.0 | 1.8 | 2.8 | 6 ± 14 |
| Ioniko | 105 | 3.8 | −6.0 | 8.5 | 2.2 | 3.7 | −8.5 ± 19 |
© 2020 by the authors. Licensee MDPI, Basel, Switzerland. This article is an open access article distributed under the terms and conditions of the Creative Commons Attribution (CC BY) license (http://creativecommons.org/licenses/by/4.0/).
Share and Cite
Elias, P.; Benekos, G.; Perrou, T.; Parcharidis, I. Spatio-Temporal Assessment of Land Deformation as a Factor Contributing to Relative Sea Level Rise in Coastal Urban and Natural Protected Areas Using Multi-Source Earth Observation Data. Remote Sens. 2020, 12, 2296. https://doi.org/10.3390/rs12142296
Elias P, Benekos G, Perrou T, Parcharidis I. Spatio-Temporal Assessment of Land Deformation as a Factor Contributing to Relative Sea Level Rise in Coastal Urban and Natural Protected Areas Using Multi-Source Earth Observation Data. Remote Sensing. 2020; 12(14):2296. https://doi.org/10.3390/rs12142296
Chicago/Turabian StyleElias, Panagiotis, George Benekos, Theodora Perrou, and Issaak Parcharidis. 2020. "Spatio-Temporal Assessment of Land Deformation as a Factor Contributing to Relative Sea Level Rise in Coastal Urban and Natural Protected Areas Using Multi-Source Earth Observation Data" Remote Sensing 12, no. 14: 2296. https://doi.org/10.3390/rs12142296